Attached files
| file | filename |
|---|---|
| 8-K - FORM 8-K - PLAINS EXPLORATION & PRODUCTION CO | d8k.htm |
 Goldman Sachs
Global Energy Conference
January 2011
Exhibit 99.1 |
 Corporate Headquarters
Contacts
Plains Exploration & Production Company
700 Milam, Suite 3100
Houston, Texas 77002
Forward-Looking Statements
This
presentation
is
not
for
reproduction
or
distribution
to
others
without
PXP’s
consent.
Corporate Information
James C. Flores –
Chairman, President & CEO
Winston M. Talbert –
Exec. Vice President & CFO
Hance
V. Myers –
Vice President Investor Relations
Joanna
Pankey
–
Manager,
Investor
Relations
& Shareholder
Services Phone: 713-579-6000
Toll Free: 800-934-6083
Email: investor@pxp.com
Web Site: www.pxp.com
Except for the historical information contained herein, the matters
discussed
in
this
presentation
are
“forward-looking
statements”
as
defined
by the Securities and Exchange Commission. These statements involve
certain assumptions PXP made based on its experience and perception
of historical trends, current conditions, expected future developments and
other factors it believes are appropriate under the circumstances.
The forward-looking statements are subject to a number of known and
unknown risks, uncertainties and other factors that could cause our actual
results to differ materially. These risks and uncertainties include, among
other things, uncertainties inherent in the exploration for and development
and production of oil and gas and in estimating reserves, the timing and
closing of acquisitions and divestments, unexpected future capital
expenditures, general economic conditions, oil and gas price volatility, the
success of our risk management activities, competition, regulatory
changes
and
other
factors
discussed
in
PXP’s
filings
with
the
SEC.
References to quantities of oil or natural gas may include amounts that
the Company believes will ultimately be produced, but that are not yet
classified as "proved reserves" under SEC definitions.
|
 WTI
NYMEX Historical Prices and Forward Curves ($/bbl)
Source: Goldman Sachs, NYMEX
3
June 29, 2004
February 2, 2009
December 31, 2010
April 23, 2010
20
30
40
50
60
70
80
90
100
110
120
130
140
150
2004
2005
2006
2007
2008
2009
2010
2011
2012
2013
September 25, 2009
February 6, 2008
January 22, 2007 |
 Revenue Per MCFE
3Q 2010
Revenue
Per
MCFE
(3)
PXP
Gas Peer Group Avg.
(1)(2)
(1) Revenues for non oil and gas producing operations servicing third parties not
included. (2) Peer group average includes the following peers: COG, HK, RRC,
SD, UPL. Source: Company filings. (3) Excludes the impact of
derivatives. 4 |
 Debt-Adjusted Cash
Operating Margin (1)(8)
3Q 2010
$/Mcfe
Derivatives
Margin (Excl. Derivatives)
Interest
(7)
G&A
(6)
Production Costs
(5)
5
(1)
Debt-Adjusted Cash Operating Margin calculated as revenue
(excluding hedging), less production expenses, less cash G&A
(excluding capitalized G&A and noncash compensation), less interest
(excluding capitalized interest).
(2)
Revenues and expenses for non oil and gas producing operations
servicing third parties not included. (3) Peer group average includes the
following peers: COG, HK, RRC, SD, UPL. Source: Company filings.
(4)
Net of $0.15 per Mcfe loss on mark-to-market derivative
contracts. (5)
Includes transportation, gathering, production & ad valorem taxes
and steam & electricity costs. (6)
Excludes noncash compensation expense and capitalized G&A.
(7)
Excludes capitalized interest.
(8)
A reconciliation schedule for PXP is included in the Addendum PXP does
not make any representations as to the accuracy of the
information used to make the calculations or the conformity of
these measures with those which may be prepared by the respective
companies, and does not undertake to provide a GAAP reconciliation
with respect to any non-GAAP financial measure which may be
included in such information. |
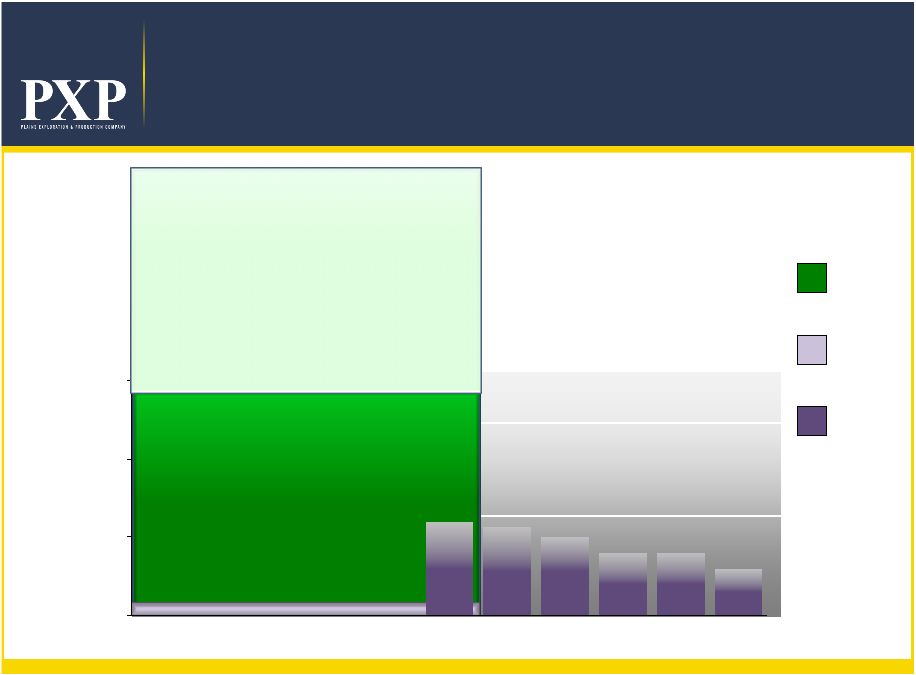 Strong Liquidity
With No Near Term Debt Maturities
Revolver
Availability
Senior
Notes
6
Revolver
Outstanding
(1)
As
of
September
30,
2010
the
revolver
had
$80
million
of
borrowings
and
$1.4
million
letters
of
credit
outstanding
(prior
to
Eagle
Ford
Acquisition).
$1.32B
(1)
Available Liquidity
Millions ($)
$600
$565
$500
$400
$400
$300
0
500
1000
1500
2010
2011
2012
2013
2014
2015
2016
2017
2018
2019
2020
MMR Stock
Plus
Net DW Proceeds |
 PXP
Today •
$6.5
billion
enterprise
value
(1)
•
360 MMBOE proved reserves YE 2009
•
90.6 MBOE per day production for 3Q 2010
•
+1.6
billion
BOE
resource
potential
(2)
•
140.1
million
shares
outstanding
(3)
•
45%
net
debt-to-total
capitalization
(3)(4)
(1) Reflects stock price and total debt as of September 30, 2010.
(2) Includes Eagle Ford acquisition and excludes Gulf of Mexico assets.
(3) As of September 30, 2010.
(4) Does not include 51 MM shares MMR common stock ($876 MM which represents the
closing share price on 12/30/10 of $17.18 multiplied by 51
MM shares). 7 |
 $1400 MM
$1100 MM
$1500 MM
$1200 MM
$1500 MM
0
25
50
75
100
125
150
175
200
2010
2011
2012
2013
2014
2015
$0
$500
$1,000
$1,500
$2,000
$2,500
$3,000
$3,500
$4,000
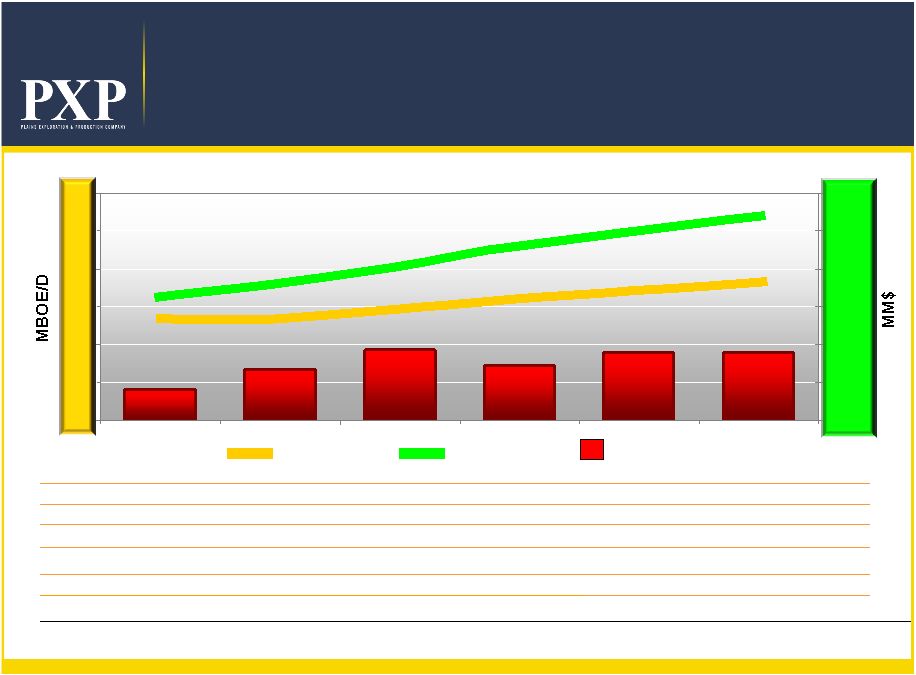
PXP
Operational Plan
PXP Net
Production
PXP Net
Cash Flow
(1)(2)
Capital
Cash Flow
Production
8
(1) Net revenue minus net expenses.
(2)
Assumes
Strip
pricing
in
2010,
$85/Bbl
of
oil
and
natural
gas
pricing
of
$5.00/MMBtu
in
2011,
$85/Bbl
of
oil
and
natural
gas
pricing
of
$5.50/MMBtu
in
2012,
and
$86/Bbl
of
oil
and natural gas pricing of $6.00/MMBtu 2013 and beyond.
Includes Eagle Ford acquisition and excludes Gulf of Mexico assets, shallow water
as of 12/30/2010 and deepwater as of 1/1/2011 |
 Proved Reserves Target Growth
64%
64%
53%
53%
57%
57%
Proved
Developed
Proved
Undeveloped
9
50%
50%
51%
51%
(1)
Illustrates estimated reserves using NYMEX pricing.
360
415
(1)
520
(1)
602
(1)
705
(1) |
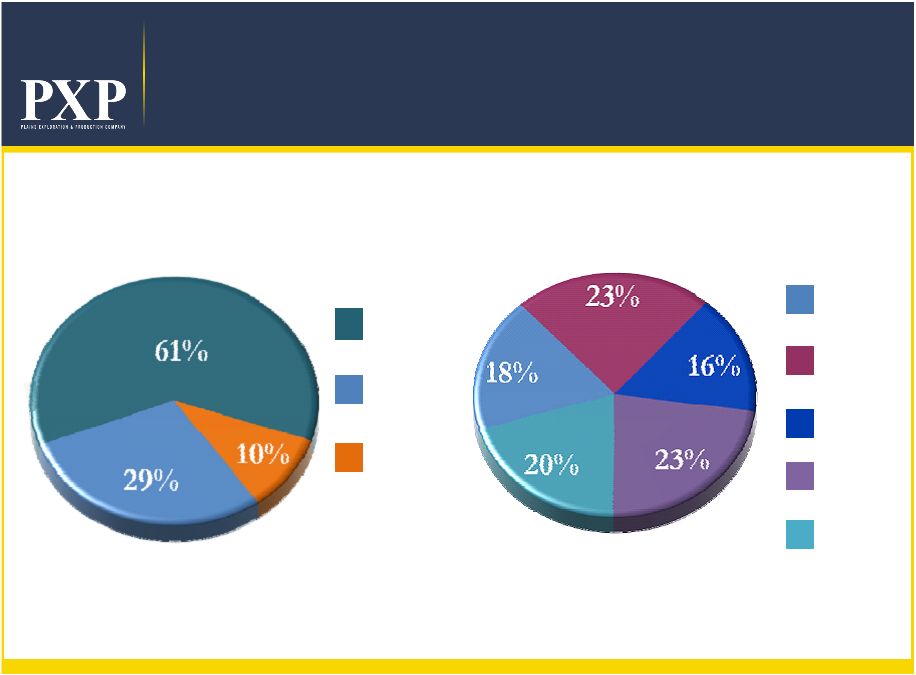
 2009
2011
2010
Capex
Profile
Oil vs. Gas
Operated vs. Non-Operated
2009
2011
2010
Oil + Liquids
Gas + Exploration
Operated
Non-operated
10
Includes Eagle Ford acquisition and excludes Gulf of Mexico assets, shallow water
as of 12/30/2010 and deepwater as of 1/1/2011. |
 Development
(1)
Haynesville
California
Other Capital
(1)
Capital Allocation
Capital Program
2010E
$1.1 Billion
2011E
$1.2 Billion
(1)
Includes
development,
exploitation,
real
estate,
capitalized
interest
and
G&A
costs
but
does
not
include
additional
capital
for
exploratory
successes.
Exploration capital is defined as discovery and dry hole costs.
Exploration
Haynesville
Eagle Ford
Granite Wash
11 |
 Operational Strategy
Focused Oil Growth Strategy
•
Operate substantially all oil assets
•
Maintain total company liquids volumes between 50% and 60% of
total production
•
Hedging strategy protects high oil margins that preserve excellent
returns
Targeted High Liquids/Natural Gas Strategy
•
Granite Wash development focusing on high liquids and highest
rate of return wells
•
Haynesville Shale development drilling continues for our Held By
Production (HBP) program
12 |
 Asset Rotation to Onshore
13 |
 Oil Assets
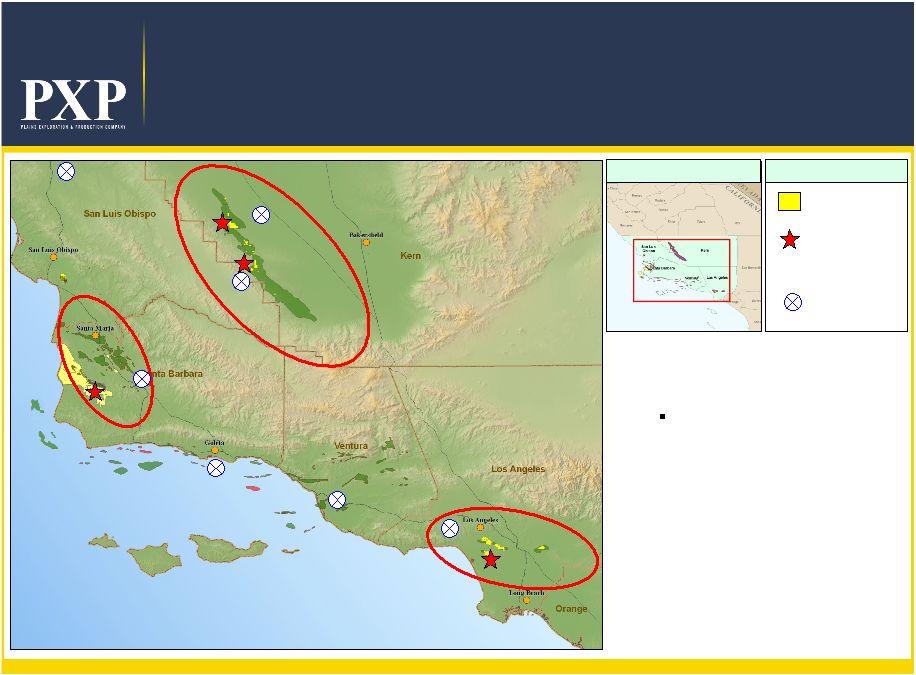
14 |
 California
Onshore/Offshore
Los
Angeles
Basin
Los
Angeles
Basin
San Joaquin
Valley
San Joaquin
Valley
Arroyo
Grande
Arroyo
Grande
Pt Pedernales
Pt Arguello
•
215 MMBOE Net Proved Reserves
•
275 MMBOE Net Development
Resource Potential
•
68% Proved Developed
•
2009 Capex $92 MM; 2010E Capex
$166 MM
•
14 yr R/P
•
2,500+ future well locations
•
Price differentials protected by
contract
The shaded areas are for illustrative purposes only and do not reflect actual leasehold
acreage. 15 |
 California
Operational Plan
January 1, 2010 Project Cost Forward F&D:
$9.87/BOE
(2)
PXP
Interest:
98% WI / 86%
NRI Potential Net Locations:
2,500+
Proved Net
Reserves:
215 MMBOE
Net Development Resource
Potential:
275 MMBOE
Average Gross Well Cost:
$1.2 MM
Average Gross EUR per Well:
135 MBOE
$358 MM
$359 MM
$166 MM
$291 MM
$271 MM
$371 MM
0
15
30
45
60
75
90
2010
2011
2012
2013
2014
2015
$0
$200
$400
$600
$800
$1,000
$1,200
PXP Net
Production
PXP Net
Cash Flow
(1)(2)
(1) Net revenue minus net operating expenses.
(2)
Assumes
Strip
pricing
in
2010,
$85/Bbl
of
oil
and
natural
gas
pricing
of
$5.00/MMBtu
in
2011,
$85/Bbl
of
oil
and
natural
gas
pricing
of
$5.50/MMBtu
in
2012,
and
$86/Bbl
of
oil
and natural gas pricing of $6.00/MMBtu 2013 and beyond.
16
Capital
Cash Flow
Production |
 Eagle Ford Horizontal Oil Play
•
PXP acreage position
~60,000 net acres
•
4 to 6 rigs running in 2011
•
Depth to Eagle Ford Top
~9,500' -
11,500' TVD
TEXAS
Walker
Kimble
Lee
Travis
Milam
Llano
Burnet
Mason
Gillespie
Grimes
Matagorda
Williamson
Fort Bend
Brazos
Waller
Burleson
Webb
Duval
Frio
Kerr
Edwards
Bee
Uvalde
Bexar
Zavala
Medina
Dimmit
La Salle
Real
Maverick
Lavaca
Goliad
Atascosa
Hays
Fayette
Wharton
De Witt
Live Oak
Wilson
Victoria
McMullen
Bastrop
Gonzales
Nueces
Colorado
Karnes
Kleberg
Blanco
Bandera
Austin
Jackson
Refugio
Comal
Jim Wells
Kendall
Guadalupe
Caldwell
San Patricio
Washington
Calhoun
Aransas
Location Map
17
The shaded area is for illustrative purposes only and do not reflect actual
leasehold acreage. |
 $349 MM
$424 MM
$17 MM
$426 MM
$277 MM
$396 MM
0
5
10
15
20
25
30
2010
2011
2012
2013
2014
2015
$0
$150
$300
$450
$600
$750
$900
Eagle Ford
Operational Plan
PXP Net
Production
PXP Net
Cash Flow
(1)(2)
18
Capital
Cash Flow
Production
(1) Net revenue minus net expenses.
(2)
Assumes
Strip
pricing
in
2010,
$85/Bbl
of
oil
and
natural
gas
pricing
of
$5.00/MMBtu
in
2011,
$85/Bbl
of
oil
and
natural
gas
pricing
of
$5.50/MMBtu
in
2012,
and
$86/Bbl
of
oil
and natural gas pricing of $6.00/MMBtu 2013 and beyond.
September 1, 2010 Project Cost Forward F&D:
$18.81/BOE
PXP
Interest:
73% WI/ 56%
NRI Potential Net Locations:
500
Net Development Resource
Potential:
175 MMBOE
Average Gross Well Cost:
$7.00 MM
Average Gross Resource Potential per Well:
483 MBOE |
 Mowry
Shale Horizontal Oil Play
Big Horn Basin, Wyoming
•
PXP acreage position
54,000 net acres
•
Proven Source Rock
•
Petrophysical
characteristics
of successful oil shale plays
•
Depth Range
~6,000' to 10,000'
•
Shale Thickness Range
~250' to 400'
•
Currently drilling initial well
Legend
PXP ACREAGE
USGS OIL FAIRWAY
Location Map
Mowry
Gas
Production
Mowry
Oil
Production
USGS Oil Fairway
19 |
 Legend
PXP ACREAGE
PXP
MONTEREY
PRODUCTION
OXY DISCOVERY
VENOCO ACTIVITY
*
•
PXP acreage position
86,000 net acres
•
Acquiring 3D seismic data
over key assets
•
Exploratory wells planned
in 2011
Monterey Shale Oil Play
Location Map
Los Angeles Basin
Los Angeles Basin
Point Pedernales
Point Arguello
Rocky Point
Arroyo Grande
Lompoc
Cymric
Belridge
McKittrick
Midway Sunset
Urban Area
Las Cienegas
Inglewood
Montebello
Pescado
Hondo
San Joaquin Basin
San Joaquin Basin
Santa Maria Basin
Santa Maria Basin
*
Jesus Maria
20 |
 Natural Gas Assets
21 |
 PRODUCING
AWAITING COMPLETION
2010 DRILL LOCATIONS
ACTIVE DRILLING
Haynesville Shale
Activity Map
Location Map
Legend
22 |
 Haynesville Shale
Operational Plan
PXP Net
Production
PXP Net
Cash Flow
(1)(3)
$312 MM
$319 MM
$336 MM
$222 MM
$232 MM
$317 MM
0
15
30
45
60
2010
2011
2012
2013
2014
2015
$0
$200
$400
$600
$800
January 1, 2010 Project Cost Forward F&D:
$8.24/BOE
(3)
or
$1.37/Mcfe
(1) Net revenue minus net expenses.
(2) Assumes D&C costs for first 4 years = $7.5 MM per well, after 4 years = $6
MM per well. (3) Assumes
Strip
pricing
in
2010,
$85/Bbl
of
oil
and
natural
gas
pricing
of
$5.00/MMBtu
in
2011,
$85/Bbl
of
oil
and
natural
gas
pricing
of
$5.50/MMBtu
in
2012,
and
$86/Bbl
of
oil
and natural gas pricing of $6.00/MMBtu 2013 and beyond.
PXP
Interest:
20% WI / 15%
NRI Net Acreage:
105,000
Potential Net
Locations:
1,400
Net Resource
Potential:
6.8 Tcfe
Average Gross Well Cost:
$7.5 MM
(2)
Average Gross EUR per Well:
6.5 Bcfe
23
Capital
Cash Flow
Production |
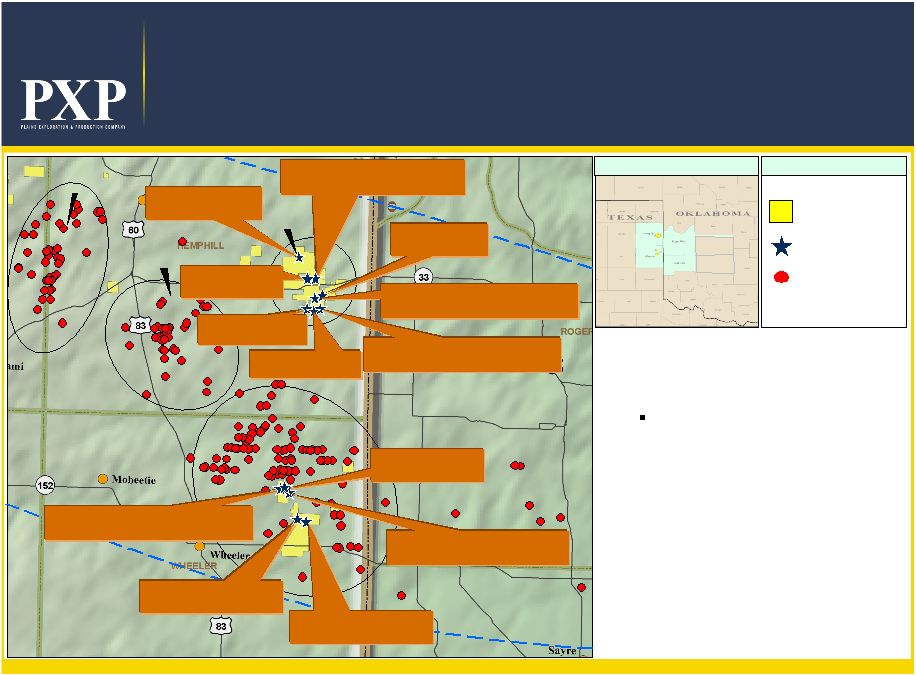 Granite Wash Horizontal Play
Recent High-Rate Completions
PXP LEASES
PXP WELLS
Producing Horizontal
Wells
Custer
Washita
•
PXP acreage position
19,700 net acres
•
Five rigs currently operating
•
150 Granite Wash Locations
(PXP WI 88%)
•
Industry ROI 39% @
$5.00/MMBtu & $75/bbl
Legend
Location Map
NW. Mendota Area
Buffalo
Wallow Area
PXP Hanson #29-2H 19MMCFED
10.4 MMCFD/344 BOPD/1076 NGL
Marvin
Lake Area
PXP Britt #9026H
Drilling
PXP Thomas #1003H
WOC
PXP Thomas #903H
28 MMCFED
12.2 MMCFD/1373 BOPD/1311 NGL
PXP Sanders #74-1H 15 MMCFED
8.2 MMCFD/358 BOPD/773 NGL
Thomas #1103H
WOC
JO Well #96-6H
WOC
PXP Hanson #40-4H
29 MMCFED
15.4 MMCFD/746 BOPD/1532 NGL
PXP Cook #39-2H
WOC
PXP Hanson #29-3H
Drilling
24
Moore #63-6H
Drilling
PXP Hanson #29-5H
Drilling
PXP Britt #4027H
Drilling |
 $105MM
$106MM
$97MM
$132MM
$193MM
$172MM
0
6
12
18
24
30
2010
2011
2012
2013
2014
2015
$0
$100
$200
$300
$400
$500
PXP Net
Production
PXP Net
Cash Flow
(1)(2)
Granite Wash Horizontal Potential
Operational Plan
(1) Net revenue minus net expenses.
(2)
Assumes
Strip
pricing
in
2010,
$85/Bbl
of
oil
and
natural
gas
pricing
of
$5.00/MMBtu
in
2011,
$85/Bbl
of
oil
and
natural
gas
pricing
of
$5.50/MMBtu
in
2012,
and
$86/Bbl
of
oil
and natural gas pricing of $6.00/MMBtu 2013 and beyond.
25
Capital
Cash Flow
Production
January 1, 2010 Project Cost Forward F&D:
$9.79/BOE or $1.62/Mcfe
(2)
PXP
Interest:
88% WI / 70%
NRI Net Acreage:
19,700
Potential
Locations:
152
Net Resource
Potential:
113.2 MMBOE
Average Gross Well Cost:
$8.2 MM
Average Gross EUR per Well:
1.1 MMBOE |
 +1.6 Billion BOE Resource Potential
Potential Reserves
950 MMBOE
275 MMBOE
175 MMBOE
100 MMBOE
10 MMBOE
Region
Haynesville
California
Eagle Ford
Granite Wash
Rockies
Potential Reserves
90 MMBOE
30 MMBOE
Region
Mowry
Shale
Monterey Shale
26 |
 PXP Targets Over Next 3
Years
•
Grow reserves 15% to 20% per year over the
next 3 years
•
Grow production 10% to 15% per year over the
next 3 years
•
Efficiently manage business focusing on cost
reduction and profitability
•
Maintain conservative balance sheet with active
hedging program
•
Focus drilling on high liquid development projects
to increase total percentage of oil production
27 |
 Addendum
28 |
 Full-Year 2011 Operating and
Financial Guidance
29
Year Ended
December 31, 2011
Production Volumes (MBOE/day)
Production volumes sold
95.0
—
100.0
% Oil
50%
—
52%
% Gas
50%
—
48%
Price Realization % Index (Unhedged)
Oil -
NYMEX
84%
—
86%
Gas -
Henry Hub
93%
—
95%
Production Costs per BOE
Lease operating expense
$ 7.90
—
$ 8.30
Steam
gas
costs
(1)
$ 1.90
—
$ 2.85
Electricity
$ 1.20
—
$ 1.50
Production
and
ad
valoremtaxes
(2)
$ 1.70
—
$ 2.00
Gathering
and
transportation
$ 1.90
—
$ 2.10
Depreciation,
Depletion
and
Amortization
per
BOE
(3)
General and Administrative Expenses (in millions)
Cash
$ 96
—
$ 101
Stock
based
compensation
(4)
$ 38
—
$ 43
Interest Expense
Average revolver balance
30 Day LIBOR + 1.75%—2.75%
$600 Million Senior Notes
7.750%
$565 Million Senior Notes
10.000%
$500 Million Senior Notes
7.000%
$400 Million Senior Notes
7.625%
$400 Million Senior Notes
8.625%
$300 Million Senior Notes
7.625%
Effective Tax Rate
42%
—
44%
Weighted Average Equivalent Shares Outstanding (in thousands)
Basic
141,600
Diluted
142,900
Targeted
Capital
Expenditures
(in
millions)
(5)
$ 1,200 |
 Full-Year 2011 Operating and
Financial Guidance
30
Derivative Instruments
Crude
Oil
Put
options-2011
(6)
Bbls
/ day
31,000
Floor
$80.00
Floor Limit
$60.00
Option premium and interest ($/Bbl)
$5.023
Crude
Oil
Three-way
Collars
-
2011
(7)
Bbls
/ day
9,000
Ceiling
$110.00
Floor
$80.00
Floor Limit
$60.00
Option premium and interest ($/Bbl)
$1.00
Crude
Oil
Put
options-2012
(6)
Bbls
/ day
40,000
Floor
$80.00
Floor Limit
$60.00
Option premium and interest ($/Bbl)
$6.087
Natural
Gas
Three-way
Collars
-
2011
(8)
MMBtu
/ day
200,000
Ceiling
$4.92
Floor
$4.00
Floor Limit
$3.00
Option premium and interest ($/MMBtu)
-
Natural
Gas
Put
options-2012
(9)
MMBtu
/ day
160,000
Floor
$4.30
Floor Limit
$3.00
Option premium and interest ($/MMBtu)
$0.294 |
 Full-Year 2011 Operating and
Financial Guidance
31
(1)
Steam
gas
costs
assume
a
base
SoCal
Border
index
price
of
$4.81
per
MMBtu.
The
purchased
volumes
are
anticipated
to
be
42,000
-
45,000
MMBtu
per
day.
(2)
Production
and
ad
valorem
taxes
assume
base
index
prices
of
$85.00
per
barrel
and
$5.00
per
MMBtu.
(3)
Will provide at the time we report year-end reserves.
(4)
Based on current outstanding and projected awards and current stock price.
(5)
Includes capitalized interest and general and administrative expenses.
(6)
If the index price is less than the $80 per barrel floor, we receive the difference between
the $80 per barrel floor and the index price up to a maximum of $20 per
barrel less the option premium. If the index price is at or above $80 per barrel, we
pay only the option premium. (7)
If the index price is less than the $80 per barrel floor, we receive the difference between
the $80 per barrel floor and the index price up to a maximum
of
$20
per
barrel
less
the
option
premium.
We
pay
the
difference
between
the
index
price
and
$110
per
barrel
plus
the
option
premium
if
the
index
price
is
greater
than
the
$110
per
barrel
ceiling.
If
the
index
price
is
at
or
above
$80
per
barrel
but
at
or
below
$110
per
barrel, we pay only the option premium.
(8)
If
the
index
price
is
less
than
the
$4.00
per
MMBtu
floor,
we
receive
the
difference
between
the
$4.00
per
MMBtu
floor
and
the
index
price
up
to
a
maximum
of
$1.00
per
MMBtu.
We
pay
the
difference
between
the
index
price
and
$4.92
per
MMBtu
if
the
index
price
is
greater
than
the
$4.92
per
MMBtu
ceiling.
If
the
index
price
is
at
or
above
$4.00
per
MMBtu
but
at
or
below
$4.92
per
MMBtu,
no
cash
settlement
is required.
(9)
If
the
index
price
is
less
than
the
$4.30
per
MMBtu
floor,
we
receive
the
difference
between
the
$4.30
per
MMBtu
floor
and
the
index
price
up
to
a
maximum
of
$1.30
per
MMBtu
less
the
option
premium.
If
the
index
price
is
at
or
above
$4.30
per
MMBtu,
we
pay
only
the
option
premium. |
 (Millions)
3 mo. Ended
9/30/10
3 mo. Ended
9/30/09
Revenues
$ 387.8
$ 312.2
Production Costs
(119.3)
(100.1)
General & Administrative Expenses
(34.3)
(36.4)
DD&A & Accretion Expense
(137.6)
(105.3)
Other Operating Income
0.5
4.4
Income From Operations
$ 97.1
$ 74.8
Income Before Income Taxes
$ 29.2
$ 72.6
Net Income
$ 18.8
$ 39.3
Earnings
Per
Share
-
diluted
$ 0.13
$ 0.30
Income Statement Summary
32 |
 Reconciliation of Debt-Adjusted Cash Operating Margin
(Non-GAAP) to Net Cash Provided by Operating Activities (GAAP)
The following table reconciles the debt-adjusted operating margin
(non-GAAP) to the net cash provided by operating activities (GAAP) for the three months
ended September 30, 2010. Management believes this presentation may be useful to
investors. PXP management uses this information for comparative
purposes within the industry and as a means to measure cash generated by our oil
and gas production and the ability to fund, among other things, capital
expenditures and acquisitions. This measure is not intended to replace the
GAAP statistic but rather to provide additional information that may be helpful in
evaluating the Company's operational trends and performance.
Debt-adjusted
operating
margin
is
calculated
by
adjusting
gross
margin
to
include
general
&
administrative
expenses,
interest
expense
and
realized
losses
on
mark-to-market derivative contracts and to exclude depreciation, depletion,
and amortization expense (DD&A) and noncash compensation expense. Three
Months Ended
September 30,
2010
Per MCFE
(In Millions)
Oil and gas revenues
$ 386.9
$
7.74 Production expenses
(117.9)
(2.36)
Oil and Gas related DD&A & impairments
(129.1)
(2.58)
Gross margin (GAAP)
139.9
2.80
Oil and Gas related DD&A & impairments
129.1
2.58
General & administrative
(34.3)
(0.68)
Noncash compensation
12.0
0.24
Interest expense, net of capitalized interest
(26.5)
(0.53)
Realized loss on mark-to-market derivative contracts
(7.4)
(0.15)
Debt adjusted cash operating margin (Non-GAAP)
$ 212.8
$
4.26 Net cash provided by operating activities (GAAP)
$ 202.7
$
4.05 Changes in operating assets & liabilities
96.5
1.93
Noncash and other income items
(71.6)
(1.42)
Realized loss on mark-to-market derivative contracts
(7.4)
(0.15)
Current income taxes attributable to derivative contracts
(7.4)
(0.15)
Debt adjusted cash operating margin (Non-GAAP)
$ 212.8
$
4.26 33 |
 34 |