Attached files
Table of Contents
UNITED STATES
SECURITIES AND EXCHANGE COMMISSION
Washington, D.C. 20549
FORM 10-K/A
(Mark One)
| x | ANNUAL REPORT PURSUANT TO SECTION 13 OR 15(d) OF THE SECURITIES EXCHANGE ACT OF 1934 |
For the fiscal year ended December 31, 2009
or
| ¨ | TRANSITION REPORT PURSUANT TO SECTION 13 OR 15(d) OF THE SECURITIES EXCHANGE ACT OF 1934 |
For the transition period from to
Commission file number: 001-33225
Great Lakes Dredge & Dock Corporation
(Exact name of registrant as specified in its charter)
| Delaware | 20-5336063 | |
| (State or other jurisdiction of incorporation or organization) |
(I.R.S. Employer Identification No.) |
| 2122 York Road, Oak Brook, IL | 60523 | |
| (Address of principal executive offices) |
(Zip Code) |
(630) 574-3000
(Registrant’s telephone number, including area code)
Securities registered pursuant to Section 12(b) of the Act:
| Title of Class |
Name of each exchange on which registered | |
| Common Stock, (Par Value $0.0001) |
Nasdaq Stock Market, LLC |
Securities registered pursuant to section 12(g) of the Act: None
Indicate by check mark if the registrant is a well-known seasoned issuer, as defined in Rule 405 of the Securities Act. Yes ¨ No x
Indicate by check mark if the registrant is not required to file reports pursuant to Section 13 or Section 15(d) of the Act. Yes ¨ No x
Indicate by check mark whether the registrant: (1) has filed all reports required to be filed by Section 13 or 15(d) of the Securities Exchange Act of 1934 during the preceding 12 months (or for such shorter period that the registrant was required to file such reports) and (2) has been subject to such filing requirements for the past 90 days. Yes x No ¨
Indicate by check mark if disclosure of delinquent filers pursuant to Item 405 of Regulation S-K (§ 229.405 of this chapter) is not contained herein, and will not be contained, to the best of registrant’s knowledge, in definitive proxy or information statements incorporated by reference in Part III of this Form 10-K or any amendment to this Form 10-K. ¨
Indicate by check mark whether the registrant has submitted electronically and posted on its corporate Web site, if any, every Interactive Data File required to be submitted and posted pursuant to Rule 405 of Regulation S-T during the preceding 12 months (or for such shorter period that the registrant was required to submit and post such files). Yes ¨ No ¨
Indicate by check mark whether the registrant is a large accelerated filer, an accelerated filer, a non-accelerated filer, or a smaller reporting company. See definitions of “large accelerated filer,” “accelerated filer,” and “smaller reporting company” in Rule 12b-2 of the Exchange Act. (Check one):
| Large accelerated filer ¨ |
Accelerated filer x | Non-accelerated filer ¨ (Do not check if a smaller reporting company) |
Smaller reporting company ¨ |
Indicate by check mark whether the registrant is a shell company (as defined in Rule 12b-2 of the Exchange Act). Yes ¨ No x
The aggregate market value of voting stock held by non-affiliates of the Registrant was $197,067,493 at June 30, 2009. The aggregate market value was computed using the closing price of the common stock as of that date on the Nasdaq Stock Market. (For purposes of a calculating this amount only, all directors and executive officers of the registrant have been treated as affiliates.)
As of March 4, 2010, 58,542,038 shares of Registrant’s Common Stock, par value $.0001 per share, were outstanding.
DOCUMENTS INCORPORATED BY REFERENCE
| Part of 10-K |
Documents Incorporated by Reference | |
| Part III |
Portions of the Proxy Statement to be filed with the Securities and Exchange Commission in connection with the 2010 Annual Meeting of Stockholders. |
Table of Contents
Great Lakes Dredge & Dock Corporation (“Great Lakes”) is filing this Form 10-K/A to
(1) amend the presentation of Note 21 (Subsidiary Guarantors) to its Consolidated Financial Statements as of December 31, 2009 and 2008 and for the years ended December 31, 2009, 2008 and 2007 to (a) create new columns that will contain financial information for each of the GLDD subsidiaries, Non-100% owned NASDI, LLC (“NASDI”) and Non-100% owned Yankee Environmental Services, LLC (“Yankee”), respectively, and (b) remove financial information for each of NASDI and Yankee from the column previously titled “Guarantor Subsidiaries”, and
(2) include (a) the audited financial statements of NASDI as of December 31, 2009 and 2008 and for the years ended December 31, 2009, 2008 and 2007 and the related footnotes thereto; (b) the audited financial statements of Yankee as of December 31, 2009 and for the year then ended and the related footnotes thereto; (c) the unaudited financial statements of Yankee Liquidation Corp. as of December 31, 2008 and 2007 and for the years then ended and the related footnotes thereto; and (d) the related Management’s Discussion and Analysis of Financial Condition and Results of Operations and Selected Financial Data for each of NASDI and Yankee; all in accordance with Rule 3-10 of Regulation S-X under the Securities Exchange Act of 1934, as amended, except as otherwise noted.
The 2008 and 2007 financial statements for Yankee Liquidation Corp. (formerly known as Yankee Environmental Services, Inc), Yankee’s predecessor, are unaudited. See the Explanatory Note preceding these financial statements.
Additionally, in connection with the filing of this Form 10-K/A and pursuant to Securities and Exchange Commission (“SEC”) rules, Great Lakes is including currently dated certifications.
Except as described in this Explanatory Note, no other portions of the original Form 10-K are being supplemented or amended by this Form 10-K/A. In addition, this Form 10-K/A has not been updated for events or information subsequent to the date of filing of the original Form 10-K, except in connection with the foregoing. Accordingly, this Form 10-K/A should be read in conjunction with our other filings with the SEC subsequent to the filing of the original Form 10-K.
Table of Contents
| EXPLANATORY NOTE | ||||||
| PART I | ||||||
| Item 1. |
4 | |||||
| Item 1A. |
14 | |||||
| Item 1B. |
22 | |||||
| Item 2. |
23 | |||||
| Item 3. |
23 | |||||
| Item 4. |
23 | |||||
| PART II | ||||||
| Item 5. |
24 | |||||
| Item 6. |
25 | |||||
| Item 7. |
Management’s Discussion and Analysis of Financial Condition and Results of Operations |
31 | ||||
| Item 7A. |
51 | |||||
| Item 8. |
51 | |||||
| Item 9. |
Change in and Disagreements with Accountants on Accounting and Financial Disclosure |
53 | ||||
| Item 9A. |
53 | |||||
| Item 9B. |
56 | |||||
| PART III | ||||||
| Item 10. |
57 | |||||
| Item 11. |
57 | |||||
| Item 12. |
Security Ownership of Certain Beneficial Owners and Management and Related Stockholder Matters |
57 | ||||
| Item 13. |
Certain Relationships and Related Transactions and Director Independence |
57 | ||||
| Item 14. |
57 | |||||
| PART IV | ||||||
| Item 15. |
58 | |||||
| 59 | ||||||
| Non 100%-Owned Guarantor Subsidiary Financial Statements | ||||||
| NASDI, LLC Yankee Environmental Services, LLC |
||||||
Table of Contents
Cautionary Note Regarding Forward-Looking Statements
Certain statements in this Annual Report on Form 10-K may constitute “forward-looking” statements as defined in Section 27A of the Securities Act of 1933 (the “Securities Act”), Section 21E of the Securities Exchange Act of 1934 (the “Exchange Act”), the Private Securities Litigation Reform Act of 1995 (the “PSLRA”) or in releases made by the Securities and Exchange Commission (“SEC”), all as may be amended from time to time. Such forward-looking statements involve known and unknown risks, uncertainties and other important factors that could cause the actual results, performance or achievements of Great Lakes Dredge and Dock Corporation and its subsidiaries (“Great Lakes”), or industry results, to differ materially from any future results, performance or achievements expressed or implied by such forward-looking statements. Statements that are not historical fact are forward-looking statements. Forward-looking statements can be identified by, among other things, the use of forward-looking language, such as the words “plan,” “believe,” “expect,” “anticipate,” “intend,” “estimate,” “project,” “may,” “will,” “would,” “could,” “should,” “seeks,” or “scheduled to,” or other similar words, or the negative of these terms or other variations of these terms or comparable language, or by discussion of strategy or intentions. These cautionary statements are being made pursuant to the Securities Act, the Exchange Act and the PSLRA with the intention of obtaining the benefits of the “safe harbor” provisions of such laws. Great Lakes cautions investors that any forward-looking statements made by Great Lakes are not guarantees or indicative of future performance. Important assumptions and other important factors that could cause actual results to differ materially from those forward-looking statements with respect to Great Lakes, include, but are not limited to, risks and uncertainties that are described in Item 1A of this Annual Report on Form 10-K for the year ended December 31, 2009, and in other securities filings by Great Lakes with the SEC.
Although Great Lakes believes that its plans, intentions and expectations reflected in or suggested by such forward-looking statements are reasonable, actual results could differ materially from a projection or assumption in any forward-looking statements. Great Lakes’ future financial condition and results of operations, as well as any forward-looking statements, are subject to change and inherent risks and uncertainties. The forward-looking statements contained in this Annual Report on Form 10-K are made only as of the date hereof and Great Lakes does not have or undertake any obligation to update or revise any forward-looking statements whether as a result of new information, subsequent events or otherwise, unless otherwise required by law.
Availability of Information
You may read and copy any materials Great Lakes files with the SEC at the SEC’s Public Reference Room at 100 F Street, N.E., Washington, D.C. 20549. Copies of such materials also can be obtained at the SEC’s website, www.sec.gov or by mail from the Public Reference Room of the SEC, at prescribed rates. Please call the SEC at 1-800-SEC-0330 for further information on the Public Reference Room. Great Lakes’ SEC filings are also available to the public, free of charge, on its corporate website, www.gldd.com as soon as reasonably practicable after Great Lakes electronically files such material with, or furnishes it to, the SEC.
Table of Contents
| Item 1. | Business |
The terms “we,” “our,” “ours,” “us,” “Great Lakes” and “Company” refer to Great Lakes Dredge & Dock Corporation and its subsidiaries and the term “NASDI” refers to our subsidiaries NASDI, LLC and Yankee Environmental Services, LLC.
Organization
Great Lakes is the largest provider of dredging services in the United States. The Company was founded in 1890 as Lydon & Drews Partnership and contracted its first project in Chicago, Illinois. The Company changed its name to Great Lakes Dredge & Dock Company in 1905 and was involved in a number of marine construction and landfill projects along the Chicago lakefront and in the surrounding Great Lakes region. Great Lakes now provides dredging services in the East, West and Gulf Coasts of the United States and worldwide. The Company also owns a majority interest in NASDI, a demolition services provider located in the Boston, Massachusetts area. The Company operates in two reportable segments: dredging and demolition. Financial information about the Company’s reporting segments and operating revenues by geographic regions is provided in Note 17, “Segment Information” in the Notes to the Consolidated Financial Statements.
Dredging Operations (approximately 92% of 2009 total revenues)
Dredging generally involves the enhancement or preservation of navigability of waterways or the protection of shorelines through the removal or replenishment of soil, sand or rock. The U.S. dredging market consists of three primary types of work: capital, beach nourishment and maintenance. Our “bid market” is defined as the aggregate dollar value of domestic projects on which the Company bid or could have bid if not for capacity constraints. The Company has experienced an average combined bid market share in the U.S. of 46% over the past three years, including 62%, 43% and 35% of the capital, beach nourishment and maintenance sectors, respectively. In addition, the Company is the only U.S. dredging service provider with significant international operations. Over the last three years, foreign contracts accounted for an average of 30% of the Company’s dredging contract revenues.
The Company’s fleet of 26 dredges, of which 10 are deployed internationally, 22 material transportation barges, two drillboats, and numerous other specialized support vessels, is the largest and most diverse fleet of any U.S. dredging company. The mobility of the Company’s fleet enables it to move equipment in response to changes in demand for dredging services to take advantage of the most attractive opportunities to employ its dredges. The Company currently estimates the replacement cost of its entire fleet to be in excess of $1.5 billion.
Domestic Dredging Operations
Over its 119-year history, the Company has grown to be a leader in capital, beach nourishment and maintenance dredging in the U.S.
Capital (approximately 35% of 2009 dredging revenues). Capital dredging projects consist primarily of port expansion projects, which involve the deepening of channels to allow access by larger, deeper draft ships and the provision of land fill used to expand port facilities. In addition to port work, capital projects also include land reclamations, trench digging for pipelines, tunnels and cables, and other dredging related to the construction of breakwaters, jetties, canals and other marine structures. Although capital work can be impacted by budgetary constraints and economic conditions, these projects typically generate an immediate economic benefit to the ports and surrounding communities.
Maintenance (approximately 31% of 2009 dredging revenues). Maintenance dredging consists of the re-dredging of previously deepened waterways and harbors to remove silt, sand and other accumulated sediments. Due to natural
4
Table of Contents
sedimentation, most channels generally require maintenance dredging every one to three years, thus creating a recurring source of dredging work that is typically non-deferrable if optimal navigability is to be maintained. In addition, severe weather such as hurricanes and flooding can also cause the accumulation of sediments and drive the need for maintenance dredging.
Beach Nourishment (approximately 11% of 2009 dredging revenues). Beach nourishment projects generally involve moving sand from the ocean floor to shoreline locations when erosion threatens shoreline assets. Beach erosion is a continuous problem that has intensified with the rise in coastal development and has become an important issue for state and local governments concerned with protecting beachfront tourism and real estate. Beach nourishment is often viewed as a better response to erosion than trapping sand through the use of sea walls and jetties, or relocating buildings and other assets away from the shoreline. Generally, beach nourishment projects take place during the fall and winter months to minimize interference with bird and marine life migration and breeding patterns and coastal recreation activities.
Foreign Dredging Operations (approximately 23% of 2009 dredging revenues)
Foreign capital projects typically relate to land reclamations, channel deepening and port infrastructure development. The Company targets foreign opportunities that are well suited to the Company’s equipment and where it faces reduced competition from its European competitors. Maintaining a presence in foreign markets has enabled the Company to diversify its customer base. Over the last ten years, the Company has performed dredging work in the Middle East, Africa, India, the Caribbean and Central America. Most recently, the Company has focused its efforts on opportunities in the Middle East.
Dredging Demand Drivers
The Company believes that the following factors are important drivers of the demand for its dredging services:
| • | Deep port capital projects. The average controlling depth of the largest U.S. ports is 5 to 10 feet shallower than major international ports worldwide. Major international ports have been expanding to handle larger vessels and increased throughput. The Panama Canal expansion, currently expected to be completed in 2014, will allow deeper draft vessels to come through to the East and Gulf Coast ports. This is expected to put more pressure on U.S. ports to deepen in order to remain competitive. In addition, the Ports of Los Angeles and Long Beach are resuming expansion efforts to remain competitive with deepened East Coast ports. The Company believes that port deepening and expansion work authorized under Water Resources Development Act (“WRDA”) legislation will provide significant opportunities for the domestic dredging industry in the future. The annual bid market for deep port capital dredging over the last three years averaged $154 million. |
| • | Required maintenance of U.S. ports. The channels and waterways leading to U.S. ports have stated depths on which shippers rely when entering those ports. Due to naturally occurring sedimentation, including as a result of severe weather, active channels will require maintenance dredging to ensure that stated depths are at authorized levels. Therefore, maintenance of channels creates a recurring source of dredging work that is non-deferrable if optimal navigability is to be preserved. The Army Corps of Engineers (“Corps”) is responsible for federally funded projects related to navigation and flood control of U.S. waterways. The Corps had expressed great concern over the level at which it has been able to maintain the U.S. ports and noted that, due to the insufficiency of funding, channel maintenance on average is significantly less than authorized by Congress. However, during 2009, the Corps was able to obtain additional funding for many of these backlogged projects via the normal budgeting process as well as through the American Recovery and Reinvestment Act of 2009 (the “Stimulus”). In addition, the maritime industry, including the ports, continues to advocate for Congressional efforts to ensure that a fully funded, recurring maintenance program is in place. The annual bid market for maintenance dredging over the last three years averaged $395 million. |
5
Table of Contents
| • | Substantial need for beach nourishment. Beach erosion is a continuous problem due to the normal ebb and flow of coastlines as well as the effects of severe storm activity. Growing populations in coastal communities and vital beach tourism are drawing attention to the importance of protecting beach front assets. Over the past few years, both the federal government and state and local entities have funded beach work. The annual bid market for beach nourishment over the last three years averaged $151 million. |
| • | Additional significant long-term opportunities. Other capital projects make consistent contributions to the Company’s annual revenues. These include dredging related to the development of private port facilities and coastal restoration. The Company anticipates that projects to repair the erosion of wetlands and coastal marshes, particularly those in Louisiana, will result in significant capital dredging opportunities. Therefore, it is likely that this work, as well as other port development, will provide supplemental opportunities to the market. |
| • | Middle East market. In recent years, the Middle East has been one of the most dynamic markets for dredging services in the world. With the substantial income from oil revenues and real estate speculation, these countries have been undergoing extensive infrastructure expansion. While the worldwide economic slowdown has resulted in reduced activity levels, the Company believes that the demand for infrastructure development will present attractive future opportunities that suit the Company’s equipment in the region. |
Demolition Operations (approximately 8% of 2009 total revenues)
NASDI, whose corporate predecessor was founded in 1976, is a major U.S. provider of commercial and industrial demolition services. The majority of NASDI’s work is performed in the New England area. NASDI’s core business is exterior and interior demolition. Exterior demolition involves the complete dismantling and demolition of structures and foundations. Interior demolition involves removing specific structures within a building. Other business activities include site development, and since the acquisition of a majority interest in Yankee Environmental Services, LLC, or “Yankee”, on January 1, 2009, the removal of asbestos and other hazardous materials. Yankee does not take legal title to hazardous materials, which remains the property of the site owner. NASDI typically performs numerous small projects (each generating revenue of $0.1 million to $1.0 million) but NASDI is one of a few providers in New England with the required licenses, operating expertise, equipment fleet and access to bonding to execute larger, complex industrial demolition projects.
In April 2008, NASDI was converted into a limited liability company and the Company’s ownership of NASDI was restructured so that the Company owns 100% of NASDI’s Class A Percentage Interests and 65% of NASDI’s Class B Percentage Interests. The remaining 35% of NASDI’s Class B Percentage Interests are owned by Christopher A. Berardi, the President of NASDI’s parent company, which is a wholly owned subsidiary of the Company.
Joint Venture—Amboy Aggregates
The Company and a New Jersey aggregates company each own 50% of Amboy Aggregates, or Amboy.” Amboy was formed in December 1984 to mine sand from the entrance channel to New York Harbor to provide sand and aggregate for use in road and building construction. The Company’s dredging expertise and its partner’s knowledge of the aggregate market form the basis for the joint venture. The Company’s investment in Amboy is accounted for using the equity method.
Amboy is the only East Coast aggregate producer to mine sand from the ocean floor. Amboy has a specially designed dredge for sand mining, de-watering and dry delivery. No other vessel of this type operates in the U.S. Amboy’s ocean-based supply of sand provides a long-term competitive advantage in the Northeast as land-based sand deposits are depleted or rendered less cost competitive by escalating land values. Mining operations are performed pursuant to permits granted to Amboy by the federal government and the states of New York and New Jersey.
6
Table of Contents
Customers
Dredging
The dredging industry’s customers include federal, state and local governments, foreign governments and both domestic and foreign private concerns, such as utilities and oil companies. Most dredging projects are competitively bid, with the award going to the lowest qualified bidder. Customers generally have few economical alternatives to dredging services. The Corps is the largest dredging customer in the U.S. and has responsibility for federally funded projects related to navigation and flood control. In addition, the U.S. Coast Guard and the U.S. Navy are responsible for awarding federal contracts with respect to their own facilities. In 2009, approximately 61% of the Company’s dredging revenues were earned from approximately 52 different contracts with federal agencies or companies operating under contracts with federal agencies.
Foreign governments requiring infrastructure development are the primary dredging customers in international markets. Approximately 22% of the Company’s 2009 dredging revenues were earned from contracts with the government of Bahrain or entities supported by the government of Bahrain.
Demolition
NASDI’s customers include general contractors, corporations that commission projects, non-profit institutions such as universities and hospitals, and local government and municipal agencies. NASDI benefits from key relationships with certain customers in the general contracting and public infrastructure industries. The majority of NASDI’s demolition services are concentrated in New England. In 2009, one customer of NASDI contributed 10% to NASDI’s annual revenues; however, the loss of this customer would not have a material adverse effect on Great Lakes and its subsidiaries taken as a whole.
Bidding Process
Dredging
Most of our dredging contracts are obtained through competitive bidding on terms specified by the party inviting the bid. The types of equipment required to perform the specified service and the estimated project duration affect the cost of performing the contract and the price that dredging contractors will bid.
For contracts under its jurisdiction, the Corps typically prepares a fair and reasonable cost estimate based on the specifications of the project. To be successful, a bidder must be determined by the Corps to be a responsible bidder (i.e., a bidder that generally has the necessary equipment and experience to successfully complete the project as well as the ability to obtain a surety bid bond) and submit the lowest responsive bid that does not exceed 125% of the Corps’ original estimate. Contracts for state and local governments are generally awarded to the lowest qualified bidder. Contracts for private customers are awarded based on the contractor’s experience, equipment and schedule, as well as price. Substantially all of the Company’s dredging contracts are competitively bid, some government contracts are awarded through a sole source procurement process involving negotiation between the contractor and the government, while other projects are bid by the Corps through a “request for proposal” process.
Demolition
NASDI negotiates the majority of its demolition contracts and the remainder of its contracts are competitively bid. NASDI frequently receives revenues from change orders on existing contracts. NASDI has established a network of local contacts with developers and prime contractors that act as referral sources and frequently enable NASDI to procure demolition jobs on a sole-source basis. When NASDI bids on a project, it evaluates the contract specifications and develops a cost estimate to which it adds a reasonable margin. While there are numerous competitors in the demolition services market, NASDI benefits from its relationships and reputation. Therefore, there are occasions where NASDI is not the lowest bidder on a contract, but is still awarded the project based on its reputation and qualifications.
7
Table of Contents
Bonding and Foreign Project Guarantees
Dredging
For most domestic projects and some foreign projects, dredging service providers are required to obtain three types of bonds: bid bonds, performance bonds and payment bonds. These bonds are typically provided by large insurance companies. A bid bond is required to serve as a guarantee that if a service provider’s bid is chosen, the service provider will sign the contract. The amount of the bond is typically 20% of the service provider’s bid, up to a maximum bond of $3.0 million. After a contract is signed, the bid bond is replaced by a performance bond, the purpose of which is to guarantee that the job will be completed. If the Company fails to complete a job, the bonding company would be required to complete the job and would be entitled to be paid the contract price directly by the customer. Additionally, the bonding company would be entitled to be paid by the Company for any costs incurred in excess of the contract price. A company’s ability to obtain performance bonds with respect to a particular contract depends upon the size of the contract, as well as the size of the service provider and its financial position. A payment bond is also required to protect the service provider’s suppliers and subcontractors in the event that the service provider cannot make timely payments. Payment bonds are generally written at 100% of the contract value.
Great Lakes’ projects that require a surety guarantee are currently bonded by Travelers Casualty and Surety Company of America (“Travelers”). Great Lakes has never experienced difficulty in obtaining bonding for any of its projects. Travelers has been granted a security interest in a substantial portion of the Company’s operating equipment as collateral for the Company’s obligations to Travelers under its bonding agreement.
For most foreign dredging projects, letters of credit or bank guarantees issued by foreign banks are required as security for the bid, performance and, if applicable, advance payment guarantees. The Company obtains its letters of credit under its Credit Agreement or its separate facility which is supported by the Export-Import Bank of the United States (“Ex-Im”) under Ex-Im’s Working Capital Guarantee Program. Foreign bid guarantees are usually 2% to 5% of the service provider’s bid. Foreign performance and advance payment guarantees are each typically 5% to 10% of the contract value.
Demolition
NASDI contracts with both private, non-government customers and governmental entities. In general, NASDI is not required to secure bonding for projects with non-governmental customers and is required to secure bonding for projects with governmental entities. When NASDI does have bonding requirements, the bonds are also provided by Travelers.
Competition
Dredging
The U.S. dredging industry is highly fragmented with approximately 250 entities in the U.S. presently operating more than 900 dredges, most of which are smaller and service the inland, as opposed to coastal, waterways, and therefore, do not generally compete with Great Lakes. Competition is determined by the size and complexity of the job; equipment, bonding and certification requirements; and government regulations. Great Lakes and three other companies comprised 86% of the Company’s defined bid market over the last three years. Within the Company’s bid market, competition is determined primarily on the basis of price. In addition, the Foreign Dredge Act of 1906, or “Dredging Act”, and Section 27 of the Merchant Marine Act of 1920, or “Jones Act”, provide significant barriers to entry with respect to foreign competition. Together these two laws prohibit foreign-built, chartered or operated vessels from competing in the U.S. See “Business—Government Regulations”.
A foreign competitor owns a single hopper dredge that is grandfathered in under the Jones Act and is able to work in the U.S. market. The dredge has been working outside the U.S for several years. In February this competitor was the low bidder on a Mississippi River maintenance project. If this competitor continues to bid in the U.S. market, it would impact the competitive dynamic for hopper dredge work, primarily in the Gulf Coast.
8
Table of Contents
Competition in the international market is dominated by four large European dredging companies all of which operate larger equipment and fleets that are more extensive than the Company’s. The Company targets opportunities that are well suited to its equipment and where it can be most competitive. Most recently, the Company has focused on opportunities in the Middle East where the Company has cultivated close customer relationships and has pursued contracts compatible with the size of the Company’s vessels.
Demolition
The U.S. demolition and related services industry is highly fragmented and is comprised mostly of small regional companies. Unlike many of its competitors, NASDI is able to perform both small and larger, more complex projects. NASDI competes in the demolition and related services industry primarily on the basis of its experience, reputation, equipment, key client relationships and price.
Equipment
Dredging
Great Lakes’ fleet of dredges, material barges and other specialized equipment is the largest and most diverse in the U.S. The Company operates three principal types of dredging equipment: hopper dredges, hydraulic dredges and mechanical dredges.
Hopper Dredges. Hopper dredges are typically self-propelled and have the general appearance of an ocean-going vessel. The dredge has hollow hulls, or “hoppers,” into which material is suctioned hydraulically through drag-arms. Once the hoppers are filled, the dredge sails to the designated disposal site and either (i) bottom dumps the material or (ii) pumps the material from the hoppers through a pipeline to a designated site. Hopper dredges can operate in rough waters, are less likely than other types of dredges to interfere with ship traffic, and can be relocated quickly from one project to another.
Hydraulic Dredges. Hydraulic dredges remove material using a revolving cutterhead which cuts and churns the sediment on the channel or ocean floor and hydraulically pumps the material by pipe to the disposal location. These dredges are very powerful and can dredge some types of rock. Certain dredged materials can be directly pumped as far as seven miles with the aid of a booster pump. Hydraulic dredges work with an assortment of support equipment, which help with the positioning and movement of the dredge, handling of the pipelines, and the placement of the dredged material. Great Lakes operates the only two large electric hydraulic dredges in the U.S., which makes the Company particularly competitive in markets with stringent emissions standards, such as California and Houston. Unlike hopper dredges, it is complicated to relocate hydraulic dredges and all their ancillary equipment and their operations can be impacted by ship traffic and rough waters.
Mechanical Dredges. There are two basic types of mechanical dredges operating in the U.S.: clamshell and backhoe. In both types, the dredge uses a bucket to excavate material from the channel or ocean floor. The dredged material is placed by the bucket into material barges, or “scows,” for transport to the designated disposal area. The scows are emptied by bottom-dumping, direct pump-out or removal by a crane with a bucket. Mechanical dredges are capable of removing hard-packed sediments, blasted rock and debris and can work in tight areas such as along docks or terminals. Clamshell dredges with specialized buckets are ideally suited to handle material requiring environmentally controlled disposal. The Company has the largest fleet of material barges in the domestic industry, which provides cost advantages when dredged material is required to be disposed far offshore or when material requires controlled disposal. Additionally, the Company owns an electric clamshell dredge which provides an advantage in those markets with stringent emissions standards.
Great Lakes’ domestic dredging fleet is typically positioned on the East and Gulf Coasts, with a smaller number of vessels on the West Coast and on inland rivers. The mobility of the fleet enables the Company to move equipment in response to changes in demand. Great Lakes’ fleet also includes vessels currently positioned in the Middle East.
9
Table of Contents
The Company continually assesses its need to upgrade and expand its dredging fleet to take advantage of improving technology and to address the changing needs of the dredging market. The Company is also committed to preventive maintenance, which it believes is reflected in the long lives of most if its equipment and its low level of unscheduled downtime on jobs. To the extent that market conditions warrant the expenditures, Great Lakes can prolong the useful life of its vessels indefinitely.
Demolition
NASDI owns and operates specialized demolition equipment, including a fleet of excavators equipped with shears, pulverizers, processors, grapples, and hydraulic hammers that provide high-capacity processing of construction and demolition debris for recycling, reclamation and disposal. NASDI also owns and maintains a large number of skid-steer loaders, heavy-duty large-capacity loaders, cranes, recycling crushers, off-highway hauling units and a fleet of tractor-trailers for transporting equipment and materials to and from job sites. NASDI rents additional equipment on a project-by-project basis, which allows NASDI flexibility to adjust costs to the level of project activity.
Equipment Certification
Certification of equipment by the U.S. Coast Guard and establishment of the permissible loading capacity by the American Bureau of Shipping (“A.B.S.”) are important factors in the Company’s dredging business. Many projects, such as beach nourishment projects with offshore sand borrow sites and dredging projects in exposed entrance channels or with offshore disposal areas, are restricted by federal regulations to be performed only by dredges or scows that have U.S. Coast Guard certification and a load line established by the A.B.S. The certifications indicate that the dredge is structurally capable of operating in open waters. The Company has more certified dredging vessels than any of the Company’s domestic competitors and makes substantial investments to maintain these certifications.
Seasonality
Seasonality does not typically have a significant impact on the Company’s dredging operations. However, most East Coast beach nourishment projects are limited by environmental windows that require work to be performed in winter months to protect wildlife habitats. The Company can mitigate the impact of these environmental restrictions to a certain extent because the Company has the flexibility to reposition its equipment to project sites, if available, that are not limited by these restrictions. The Company’s demolition operations are not significantly impacted by seasonality.
Weather
The Company’s ability to perform its contracts may depend on weather conditions. Inclement weather can delay the completion of a project, thereby causing the Company to incur additional costs. As part of bidding on fixed price contracts, the Company makes allowances, consistent with historical weather data, for project downtime due to adverse weather conditions. In the event that the Company experiences adverse weather beyond these allowances, a project may require additional days to complete, resulting in additional costs and decreased gross profit margins. Conversely, favorable weather can accelerate the completion of the project, resulting in cost savings and increased gross profit margins. Typically, Great Lakes is exposed to significant weather in the first and fourth quarters, and certain projects can only be worked on during these periods. See “Business-Seasonality”.
Global warming, and the corresponding climate change, may cause weather that is more difficult to predict and varies from historical norms. As a result, global warming may cause a deviation from project weather allowances on a more frequent basis and consequently increase or decrease gross profit margin, as applicable, on a project-by-project basis. In a typical year, the Company works on many projects in multiple geographic locations and experiences both positive and negative deviations from project weather allowances. Accordingly, it is unlikely that climate change will have a material adverse effect on the Company’s results of operations.
10
Table of Contents
Backlog
The Company’s contract backlog represents its estimate of the revenues that will be realized under the portion of the contracts remaining to be performed. For dredging contracts these estimates are based primarily upon the time and costs required to mobilize the necessary assets to and from the project site, the amount and type of material to be dredged and the expected production capabilities of the equipment performing the work. For demolition contracts, these estimates are based on the time and remaining costs required to complete the project. However, these estimates are necessarily subject to variances based upon actual circumstances. Because of these factors, as well as factors affecting the time required to complete each job, backlog is not necessarily indicative of future revenues or profitability. In addition, a significant amount of the Company’s dredging backlog relates to federal government contracts, which can be canceled at any time without penalty, subject to the Company’s right, in some cases, to recover the Company’s actual committed costs and profit on work performed up to the date of cancellation. In addition, the Company’s backlog may fluctuate significantly from quarter to quarter based upon the type and size of the projects the Company is awarded from the bid market. A quarterly increase or decrease of the Company’s backlog does not necessarily result in an improvement or a deterioration of the Company’s business. The Company’s backlog includes only those projects for which the Company has obtained a signed contract with the customer. The components of the Company’s backlog are addressed in more detail in “Management’s Discussion and Analysis of Financial Condition and Results of Operations.”
Employees
Dredging
At December 31, 2009, the Company employed approximately 335 full-time salaried personnel in the U.S. In addition the Company employs U.S. hourly personnel, most of who are unionized, on a project-by-project basis. Crews are generally available for hire on relatively short notice. During 2009, the Company employed a daily average of 634 hourly personnel to meet domestic project requirements. In addition at December 31, 2009, the Company employed approximately 33 expatriates, 51 foreign nationals and 121 local staff to manage and administer its Middle East operations. During 2009 the Company also employed a daily average of 369 hourly personnel to meet project requirements in the Middle East.
Demolition
At December 31, 2009, the demolition segment employed approximately 41 full-time salaried administrative employees, in addition to an average of 110 unionized employees pursuant to four union agreements. The unionized employees are hired on a project-by-project basis and are generally available for hire on relatively short notice.
Safety
Safety of its employees is the highest priority of Great Lakes. The Company promotes a safety culture committed to training, awareness and mutual responsibility for the wellbeing of workers. Accident prevention, safety and environmental protection have top priority in the Company’s business planning, in the overall conduct of its business, and in the operation and maintenance of its vessels and facilities.
Unions
The Company is a party to numerous collective bargaining agreements in the U.S. that govern its relationships with its unionized hourly workforce. However, three primary agreements apply to approximately 84% of such employees. The Company’s two contracts with Local 25 Operators Union for the northern and southern regions, representing approximately 51% of its unionized workforce are set to expire in October 2012. The Company’s collective bargaining agreement with Seafarers International Union expires in February 2012. The Company has not experienced any major labor disputes in the past five years and believes it has good relationships with its significant unions; however, there can be no assurances that the Company will not experience labor strikes or disturbances in the future.
11
Table of Contents
Government Regulations
The Company is subject to government regulations pursuant to the Dredging Act, the Jones Act, the Shipping Act, 1916, or “Shipping Act”, and the vessel documentation laws set forth in Chapter 121 of Title 46 of the United States Code. These statutes require vessels engaged in dredging in the navigable waters of the United States to be documented with a coastwise endorsement, to be owned and controlled by U.S. citizens, to be manned by U.S. crews, and to be built in the United States. The U.S. citizen ownership and control standards require the vessel-owning entity to be at least 75% U.S. citizen owned and prohibit the chartering of the vessel to any entity that does not meet the 75% U.S. citizen ownership test.
Environmental Matters
The Company’s operations and facilities are subject to various environmental laws and regulations related to, among other things: dredging operations; the disposal of dredged material; protection of wetlands; storm water and waste water discharges; demolition activities; asbestos removal; transportation and disposal of other hazardous substances and materials; and air emissions. The Company is also subject to laws designed to protect certain marine species and habitats. Compliance with these statutes and regulations can delay appropriation and/or performance of particular projects and increase related costs.
The Company’s projects may involve demolition, excavation, transportation, management and disposal of hazardous waste and other hazardous substances and materials. Various laws strictly regulate the removal, treatment and transportation of hazardous water and other hazardous substances and materials and impose liability for human health effects and environmental contamination caused by these materials. The Company’s demolition business, for example, requires it to transport and dispose of hazardous substances and materials, such as asbestos. The Company takes steps to limit its potential liability by hiring qualified asbestos abatement subcontractors from time to time to remove such materials from its projects and some project contracts require the client to retain liability for hazardous waste generation.
Based on the Company’s experience, its management currently believes that the future cost of compliance with existing environmental laws and regulations (and liability for known environmental conditions) will not have a material adverse effect on its business, financial condition or results of operations. However, the Company cannot predict what environmental legislation or regulations will be enacted in the future, how existing or future laws or regulations will be enforced, administered or interpreted, or the amount of future expenditures that may be required to comply with these environmental or health and safety laws or regulations or to respond to future cleanup matters or other environmental claims. See “Risk Factors—Environmental regulations could force us to incur significant capital and operational costs.”
Executive Officers
The following table sets forth the names and ages of all of the Company’s executive officers and the positions and offices presently held by them.
| Name |
Age | Position | ||
| Douglas B. Mackie |
57 | President, Chief Executive Officer and Director | ||
| Richard M. Lowry |
54 | Executive Vice President and Chief Operating Officer | ||
| Deborah A. Wensel |
48 | Senior Vice President, Chief Financial Officer, Secretary & Treasurer | ||
| Kyle D. Johnson |
48 | Senior Vice President—Chief Contract Manager | ||
| John F. Karas |
49 | Senior Vice President—Chief Estimator | ||
| David E. Simonelli |
53 | Senior Vice President—Operations Support Group |
The annual appointment of each executive officer expires in May 2010.
12
Table of Contents
Douglas B. Mackie, President and Chief Executive Officer
Mr. Mackie has been President, Chief Executive Officer and a director of the Company since 1995. He joined the Company in 1978 as Corporate Counsel. In 1987 he was named Senior Vice President. Mr. Mackie earned an MBA from the University of Chicago and a J.D. from Northern Illinois University. He is a former President of the Dredging Contractors of America.
Richard M. Lowry, Executive Vice President and Chief Operating Officer
Mr. Lowry has been the Executive Vice President and Chief Operating Officer of the Company since 1995. He joined the Company in 1978 as a Project Engineer and has since held positions of increasing responsibility in the engineering and operations areas of the Company. In 1990 he was named Senior Vice President and Chief Engineer. Mr. Lowry received a Bachelors Degree (Honors) in Civil Engineering from Brighton Polytechnic in England.
Deborah A. Wensel, Senior Vice President, Chief Financial Officer, Secretary and Treasurer
Ms. Wensel has been the Chief Financial Officer and Treasurer of the Company since April 1999 and was named Senior Vice President in 2002. Ms. Wensel joined the Company in 1987 as Accounting and Financial Reporting Supervisor. In 1989, she was named Controller and Chief Accounting Officer. She is the current Treasurer of the Dredging Contractors of America. Ms. Wensel is a Certified Public Accountant and earned a BA from The University of Michigan and an MBA from the University of Chicago.
Kyle D. Johnson, Senior Vice President—Chief Contract Manager
Mr. Johnson was named Senior Vice President in February 2009 and has been Chief Contract Manager of the Company since 2006. He joined the Company in 1983 as a Mechanical Engineer and has since held positions of increasing responsibility in domestic and international engineering and operations, including Area Engineer, Special Projects Manager, and Manager of Production Engineering. Mr. Johnson was named Vice President in 2002. Mr. Johnson earned a BS in Engineering from Purdue University and an MS in Construction Engineering & Management from Stanford University.
John F. Karas, Senior Vice President—Chief Estimator
Mr. Karas was named Senior Vice President in February 2009 and has been Chief Estimator since 1992. He joined the Company in 1983 as Project Engineer in the Hopper Division. Mr. Karas earned a Bachelors degree in Finance from University of Notre Dame. He is a member of the Western Dredging Association.
David E. Simonelli, Senior Vice President—Operations Support Group
Mr. Simonelli was named Senior Vice President in February 2009. Mr. Simonelli is responsible for the Operations Support Group which includes Site Management, the Safety Health & Environmental Department, Field & Production Engineering and Risk Management. He was named a Vice President of the Company in 2002 and Special Projects Manager in 1996. He joined the Company in 1978 as a Field Engineer. Mr. Simonelli earned a BS in Civil and Environmental Engineering from the University of Rhode Island. He is a member of the Hydrographic Society, the American Society of Civil Engineers and the Western Dredging Association.
13
Table of Contents
| ITEM 1A. | Risk Factors |
We depend on our ability to continue to obtain federal government dredging contracts, and are therefore greatly impacted by the amount of government funding for dredging projects. A reduction in government funding for dredging contracts can materially reduce our revenues and profits.
A substantial portion of our revenue is derived from federal government dredging contracts. Revenues related to contracts with federal agencies or companies operating under contracts with federal agencies and its percentage as a total of dredging revenue for the years ended December 31, 2009, 2008 and 2007 were as follows:
| Year Ended December 31, | ||||||||||||
| 2009 | 2008 | 2007 | ||||||||||
| Federal government dredging revenue (in US$1,000) |
$ | 347,923 | $ | 285,183 | $ | 186,694 | ||||||
| Percent of dredging revenue from federal government |
61 | % | 59 | % | 42 | % | ||||||
Therefore, a reduction in government funding for dredging contracts can materially reduce our revenues and profits.
Our profitability is subject to inherent risks because of the fixed-price nature of most of our contracts.
Substantially all of our contracts with our customers are fixed-price contracts. Under a fixed-price contract, the customer agrees to pay a specified price for our performance. Fixed-price contracts carry inherent risks, including risks of losses from underestimating costs, operational difficulties and other changes that may occur over the contract period. One of the most significant factors affecting the profitability of a dredging project is the weather at the project site. Inclement or hazardous weather conditions that exceed our estimates can result in substantial delays in dredging and additional contract expenses. Due to these factors, it is possible that we will not be able to perform our obligations under fixed-price contracts without incurring additional expenses. If we were to significantly underestimate the costs on one or more significant contracts, the resulting losses could have a material adverse effect on our business, operating results, cash flows or financial condition.
Our quarterly operating results may vary significantly.
Our quarterly results of operations have fluctuated in the past and will continue to fluctuate in the future. You should not rely on the results of any past quarter or quarters as an indication of future performance in our business operations or stock price. Our operating results could vary greatly from quarter to quarter due to factors such as:
| • | inclement or hazardous weather conditions that may result in substantial delays in dredging and additional contract expenses; |
| • | unplanned equipment downtime; |
| • | environmental restrictions requiring that certain projects be performed in winter months to protect wildlife habitats; and |
| • | equipment mobilization to and from projects. |
If our results of operations from quarter to quarter fail to meet the expectations of public market analysts and investors, our stock price could suffer or be negatively impacted. See Item 7. “Management’s Discussion and Analysis of Financial Condition and Results of Operations—Primary Factors that Determine Operating Profitability”
14
Table of Contents
Our use of the percentage-of-completion method of accounting could result in a reduction or reversal of previously recorded revenue and profit.
We recognize contract revenue using the percentage-of-completion method. The majority of our work is performed on a fixed-price basis. Contract revenue is accrued based on engineering estimates for the physical percent complete for dredging and estimates of remaining costs to complete for demolition. We use accounting principles generally accepted in the United States for accounting policies relating to our use of the percentage-of-completion method, estimating costs, revenue recognition, combining and segmenting contracts and change order/claim recognition. Percentage-of-completion accounting relies on the use of significant estimates in the process of determining income earned. The cumulative impact of revisions to estimates is reflected in the period in which these changes become known. Due to the various estimates inherent in our contract accounting, actual results could differ from those estimates, which may result in a reduction or reversal of previously recorded revenue and profit.
We are subject to risks related to our international dredging operations.
Revenue from foreign contracts and its percentage to total dredging revenue for the years ended December 31, 2009, 2008 and 2007 is as follows:
| Year Ended December 31, | ||||||||||||
| 2009 | 2008 | 2007 | ||||||||||
| Foreign revenue (in US $1000) |
$ | 134,123 | $ | 172,345 | $ | 140,468 | ||||||
| Percent of dredging revenue from foreign countries |
23 | % | 36 | % | 32 | % | ||||||
International operations subject us to additional potential risks, including:
| • | uncertainties concerning import and export license requirements, tariffs and other trade barriers; |
| • | reduced Middle Eastern demand as a result of fluctuations in the price of oil, the primary export in the Middle East; |
| • | restrictions on repatriating foreign profits back to the United States; |
| • | changes in foreign laws, policies and regulatory requirements; |
| • | difficulties in staffing and managing international operations; |
| • | taxation issues; |
| • | greater difficulty in accounts receivable collection and longer collection periods; |
| • | compliance with the U.S. Foreign Corrupt Practices Act; |
| • | difficulty in enforcing the Company’s contractual rights; |
| • | currency fluctuations; and |
| • | political, cultural and economic uncertainties, including acts of terrorism. |
The work currently performed internationally is primarily with one customer.
Revenue from contracts with the government of Bahrain and entities with which it does business and its percentage to total foreign dredging revenue for the years ended December 31, 2009, 2008 and 2007 is as follows:
| Year Ended December 31, | ||||||||||||
| 2009 | 2008 | 2007 | ||||||||||
| Bahrain government dredging revenue (in US$ 1,000) |
$ | 126,026 | $ | 161,254 | $ | 106,119 | ||||||
| Percent of foreign dredging revenue from the Bahrain government |
94 | % | 94 | % | 76 | % | ||||||
15
Table of Contents
Revenue from foreign projects over the last three years has been concentrated in Bahrain and primarily with the government of Bahrain. The recent decline in oil prices and contraction in the Middle East real estate market has slowed the rate of the region’s infrastructure development. For example, the downturn has impacted the scope of our Diyar land reclamation project. In the first quarter of 2009, part of the contracted backlog became an option that the customer may or may not award. In addition, the renegotiated contract provides longer payment terms. As a result of these factors, we expect revenue from this customer to decline, and if the government of Bahrain further curtails its infrastructure investment or diversifies its use of dredging vendors, our revenue from this customer could decline further.
The amount of our estimated backlog is subject to change and not necessarily indicative of future revenues.
Our contract backlog represents our estimate of the revenues that we will realize under the portion of the contracts remaining to be performed. For dredging contracts these estimates are based primarily upon the time and costs required to mobilize the necessary assets to and from the project site, the amount and type of material to be dredged and the expected production capabilities of the equipment performing the work. For demolition contracts, these estimates are based on the time and remaining costs required to complete the project. However, these estimates are necessarily subject to variances based upon actual circumstances. Because of these factors, as well as factors affecting the time required to complete each job, backlog is not necessarily indicative of future revenues or profitability. In addition, a significant amount of our dredging backlog relates to federal government contracts, which can be canceled at any time without penalty, subject to our right, in some cases, to recover our actual committed costs and profit on work performed up to the date of cancellation.
Below is our dredging backlog from federal government contracts as of December 31, 2009, 2008 and 2007 and the percentage of those contracts to total backlog as of the same period.
| Year Ended December 31, | ||||||||||||
| 2009 | 2008 | 2007 | ||||||||||
| Federal government dredging backlog (in US $1,000) |
$ | 309,571 | $ | 180,002 | $ | 212,313 | ||||||
| Percent of dredging backlog from federal government |
85 | % | 50 | % | 66 | % | ||||||
If we fail to comply with government contracting regulations, our revenue could suffer.
Our contracts with federal, state and local governmental customers are subject to various procurement regulations and other contract provisions. Certain violations of government contracting regulations could result in the imposition of civil and criminal penalties, which may include termination of contracts, forfeiture of profits, suspension of payments and fines, and suspension from future government contracting. If we are suspended from government work for any reason, we could suffer a material reduction in revenue and cash flows.
In addition, we may be subject to litigation brought by private individuals on behalf of the government relating to our government contracts, referred to in this annual report as “qui tam”, which could include claims for up to treble damages. Qui tam actions are sealed by the court at the time of filing. The only parties privy to the information in the complaint are the complainant, the U.S. government, and the court. Therefore, it is possible that qui tam actions have been filed against us and that we are not aware of such actions or have been ordered by the court not to discuss them until the seal is lifted. Thus, it is possible that we are subject to liability exposure for qui tam actions.
We have a significant amount of indebtedness, which makes us more vulnerable to adverse economic and competitive conditions.
We have a significant amount of indebtedness. As of December 31, 2009, we had outstanding senior debt and senior subordinated notes of $186 million. This amount of debt is substantial and our debt could:
| • | require us to dedicate a substantial portion of our cash flow from operations to payments on our indebtedness, thereby reducing the availability of our cash flow to fund working capital and capital expenditures, pay dividends and other general corporate purposes; |
| • | limit our flexibility in planning for, or reacting to, changes in our business and our industries; |
16
Table of Contents
| • | place us at a competitive disadvantage compared to our less leveraged competitors; |
| • | increase our vulnerability to both general and industry-specific adverse economic conditions; and |
| • | limit, among other things, our ability to borrow additional funds. |
Our business is subject to significant operating risks and hazards that could result in damage or destruction to persons or property, which could result in losses or liabilities to us.
The dredging and demolition businesses are generally subject to a number of risks and hazards, including environmental hazards, industrial accidents, encountering unusual or unexpected geological formations, cave-ins below water levels, collisions, disruption of transportation services and flooding. These risks could result in damage to, or destruction of, dredges, transportation vessels, other maritime structures and buildings, and could also result in personal injury, environmental damage, performance delays, monetary losses or legal liability to third parties.
If we are unable, in the future, to obtain bonding or letters of credit for our dredging contracts, our ability to obtain future dredging contracts will be limited, thereby adversely affecting our business.
We, like all dredging service providers, are generally required to post bonds in connection with our domestic dredging contracts or letters of credit with our foreign dredging contracts to ensure job completion if we fail to finish a project. We have entered into a bonding agreement with Travelers, pursuant to which Travelers acts as surety, issues bid bonds, performance bonds and payment bonds, and provides guarantees required by us in the day-to-day operations of our dredging business. However, Travelers is not obligated under the bonding agreement to issue future bonds for us. With respect to our foreign dredging business, we generally obtain letters of credit under our senior credit facility and a separate facility which is supported by Ex-Im under Ex-Im’s Working Capital Guarantee Program. However, the amount of letters of credit under these facilities is limited. In addition, access to our senior credit facility and the Ex-Im facility may be limited by failure to meet certain financial requirements or other defined requirements. If we are unable to obtain bonds or letters of credit, our ability to take on future work would be severely limited.
Our business would be adversely affected if we failed to comply with the Jones Act provisions on coastwise trade, or if those provisions were modified or repealed.
We are subject to the Jones Act and other federal laws that restrict dredging in U.S. waters and maritime transportation between points in the United States to vessels operating under the U.S. flag, built in the United States, at least 75% owned and operated by U.S. citizens and manned by U.S. crews. Compliance with these laws increases our operating costs in comparison to non-U.S. dredging operations. We are responsible for monitoring the ownership of our common stock to ensure compliance with these laws. If we do not comply with these restrictions, we would be prohibited from operating our vessels in the U.S. market, and under certain circumstances we would be deemed to have undertaken an unapproved foreign transfer, resulting in severe penalties, including permanent loss of U.S. dredging rights for our vessels, fines or forfeiture of the vessels.
In the past, interest groups have lobbied Congress to modify or repeal the Jones Act to facilitate foreign flag competition for trades and cargoes currently reserved for U.S. flag vessels under the Jones Act. We believe that continued efforts may be made to modify or repeal the Jones Act laws currently benefiting U.S. flag vessels. If these efforts are successful, it could result in significantly increased competition and have a material adverse effect on our business, results of operations, cash flows or financial condition.
Capital expenditures and other costs necessary to operate and maintain our vessels tend to increase with the age of the vessel and may also increase due to changes in governmental regulations, safety or other equipment standards.
Capital expenditures and other costs necessary to operate and maintain our vessels tend to increase with the age of the vessel. Accordingly, it is likely that the operating costs of our vessels will increase.
17
Table of Contents
The average age of our more significant vessels as of December 31, 2009, by equipment type, is as follows:
| Type of Equipment |
Quantity | Average Age in Years | ||||||
| Hydraulic Dredges |
11 | 42 | ||||||
| Hopper Dredges |
10 | 28 | ||||||
| Mechanical Dredges |
5 | 34 | ||||||
| Unloaders |
2 | 32 | ||||||
| Drillboats |
2 | 19 | ||||||
| Material and Other Barges |
91 | 30 | ||||||
| Total |
121 | 31 | ||||||
Remaining economic life has not been presented because it is not reasonably quantifiable since, to the extent that market conditions warrant the expenditures, we can prolong the vessels’ lives indefinitely. We operate in an industry where a significant portion of competitors’ equipment is of a similar age. It is common in the dredging industry to make maintenance and capital expenditures in order to extend the economic life of equipment.
In addition, changes in governmental regulations, safety or other equipment standards, as well as compliance with standards imposed by maritime self-regulatory organizations and customer requirements or competition, may require us to make additional expenditures. For example, if the U.S. Coast Guard enacts new standards, we may be required to make significant expenditures for alterations or the addition of new equipment. In order to satisfy any such requirement, we may need to take our vessels out of service for extended periods of time, with corresponding losses of revenues. In the future, market conditions may not justify these expenditures or enable us to operate our older vessels profitably during the remainder of their economic lives.
Environmental regulations could force us to incur significant capital and operational costs.
Our operations and facilities are subject to various environmental laws and regulations relating to, among other things: dredging operations; the disposal of dredged material; protection of wetlands; storm water and waste water discharges; demolition activities; asbestos removal; transportation and disposal of other hazardous substances and materials; and air emissions. We are also subject to laws designed to protect certain marine species and habitats. Compliance with these statutes and regulations can delay permitting and/or performance of particular projects and increase related project costs. These delays and increased costs could have a material adverse effect on our results of operations or cash flows.
Our projects may involve demolition, excavation, transportation, management and disposal of hazardous waste and other hazardous substances and materials. Various laws strictly regulate the removal, treatment and transportation of hazardous waste and other hazardous substances and materials and impose liability for human health effects and environmental contamination caused by these materials. Our demolition business, for example, requires us to transport and dispose of hazardous substances and materials, such as asbestos. Services rendered in connection with hazardous substance and material removal and site development may involve professional judgments by licensed experts about the nature of soil conditions and other physical conditions, including the extent to which hazardous substances and materials are present, and about the probable effect of procedures to mitigate problems or otherwise affect those conditions. If the judgments and the recommendations based upon those judgments are incorrect, we may be liable for resulting damages that our customers incur, which may be material. The failure of certain contractual protections, including any indemnification from our customers or subcontractors, to protect us from incurring such liability could have a material adverse effect on our business, operating results, cash flows or financial condition.
18
Table of Contents
We may be affected by market or regulatory responses to climate change.
Growing concerns about climate change may result in the imposition of additional environmental regulations. For example, there is a growing consensus that new and additional regulations concerning greenhouse gas emissions and/or “cap and trade” legislation may be enacted, which could result in increased compliance costs for us and our customers. Legislation, international protocols, regulation or other restrictions on emissions could also affect our customers. Such legislation or restrictions could increase the costs of projects for our customers or, in some cases, prevent a project from going forward, thereby potentially reducing the need for our services which could in turn have a material adverse effect on our operations and financial condition. Additionally, in our normal course of operations, we use a significant amount of fossil fuels. The costs of controlling our emissions or obtaining required emissions allowances in response to any regulatory change could be significant. We cannot predict when or whether any of these various legislative and regulatory proposals may become law or what their effect will be on us or our customers.
Our business could suffer in the event of a work stoppage by our unionized labor force.
We are a party to numerous collective bargaining agreements in the U.S. that govern our relationships with our unionized hourly workforce. Specifically, three primary agreements apply to approximately 84% of these employees. Our two contracts with Local 25 Operators Union for the northern and southern regions, representing approximately 51% of our unionized workforce are set to expire in October 2012. Our agreement with Seafarers International Union expires in February 2012. The inability to successfully renegotiate contracts with these unions as they expire, any future strikes, employee slowdowns or similar actions by one or more unions could have a material adverse effect on our ability to operate our business.
Our employees are covered by federal laws that may provide seagoing employees remedies for job-related claims in addition to those provided by state laws.
All of our seagoing employees are covered by provisions of the Jones Act and general maritime law. These laws typically operate to make liability limits established by state workers’ compensation laws inapplicable to these employees and to permit these employees and their representatives to pursue actions against employers for job-related injuries in federal or state courts. Because we are not generally protected by the limits imposed by state workers’ compensation statutes, we have greater exposure for claims made by these employees as compared to employers whose employees are not covered by these provisions.
Our current insurance coverage may not be adequate, and we may not be able to obtain insurance at acceptable rates, or at all.
We maintain various insurance policies, including hull and machinery, general liability and personal injury. We partially self-insure risks covered by our policies. We are not required to, and do not, specifically set aside funds for the self-insured portion of claims. At any given time, we are subject to multiple personal injury claims and we maintain substantial loss accruals for these claims. Our insurance policies may not be adequate to protect us from liabilities that we incur in our business. We may not be able to obtain similar levels of insurance on reasonable terms, or at all. Our inability to obtain such insurance coverage at acceptable rates or at all could have a material adverse effect on our business, operating results, cash flows or financial condition.
A portion of our self-insurance for personal injury of our maritime workforce is effected through our membership in The West of England Ship Owners Mutual Insurance Association (Luxembourg) referred to in this annual report as “West of England”, an international protection and indemnity club that provides its members with liability insurance and ancillary cover. Under West of England’s rules, its members for any policy year are required to pay certain amounts (referred to as “calls”) to West of England based on its estimates of, among other things, requirements in respect of claims, reinsurance premiums, investment earnings and expenses for such policy year. For each policy year, West of England assesses members “advance calls” which constitute the members’ basic rate of contributions. West of England may also assess its members “additional calls” for any open policy year in order to provide West of England with the amount of funds needed to satisfy its liquidity needs for the applicable policy year. Accordingly, we have exposure to West of England’s investment volatility and claims experience.
19
Table of Contents
Our demolition business depends on key customer relationships and our reputation in the Boston construction market, both of which have been developed and maintained by one individual. Loss of any of these elements would materially reduce our demolition revenues and profits.
Demolition contracts are entered into on a project by project basis, so we do not have continuing contractual commitments with our demolition customers beyond the terms of the current contract. We benefit from key relationships with certain general and construction contractors in the Boston market. We also benefit from our reputation in the Boston market developed over years of successfully performing on projects. Both of these aspects of the business were developed and are maintained by the president of NASDI’s parent company. The inability to maintain relationships with these customers or obtain new customers based on NASDI’s reputation would reduce the revenue and profitability from demolition contracts. Our inability to retain this individual would have a material adverse affect on our demolition segment’s current customer relationships and reputation.
Our common stock is subject to restrictions on foreign ownership.
We are subject to government regulations pursuant to the Dredging Act, the Jones Act, the Shipping Act and the vessel documentation laws set forth in Chapter 121 of Title 46 of the United States Code. These statutes require vessels engaged in the transport of merchandise or passengers or dredging in the navigable waters of the U.S. to be owned and controlled by U.S. citizens. The U.S. citizenship ownership and control standards require the vessel-owning entity to be at least 75% U.S.-citizen owned. Our certificate of incorporation contains provisions limiting non-citizenship ownership of our capital stock. If our board of directors determines that persons who are not citizens of the U.S. own more than 22.5% of our outstanding capital stock or more than 22.5% of our voting power, we may redeem such stock. The required redemption price could be materially different from the current price of our common stock or the price at which the non-citizen acquired the common stock. If a non-citizen purchases our common stock, there can be no assurance that he will not be required to divest the shares and such divestiture could result in a material loss. Such restrictions and redemption rights may make our equity securities less attractive to potential investors, which may result in our common stock having a lower market price than it might have in the absence of such restrictions and redemption rights.
Delaware law and our charter documents may impede or discourage a takeover that you may consider favorable.
The provisions of our certificate of incorporation and bylaws may also deter, delay or prevent a third-party from acquiring us. These provisions include:
| • | limitations on the ability of stockholders to amend our charter documents, including stockholder supermajority voting requirements; |
| • | the inability of stockholders to call special meetings; |
| • | a classified board of directors with staggered three-year terms; |
| • | advance notice requirements for nominations for election to the board of directors and for stockholder proposals; |
| • | the authority of our board of directors to issue, without stockholder approval, up to 1,000,000 shares of preferred stock with such terms as the board of directors may determine and to issue additional shares of our common stock. |
We are also subject to the protections of Section 203 of the Delaware General Corporation Law, which prevents us from engaging in a business combination with a person who acquires at least 15% of our common stock for a period of three years from the date such person acquired such common stock, unless board or stockholder approval were obtained.
These provisions could have the effect of delaying, deferring or preventing a change in control of our company, discourage others from making tender offers for our shares, lower the market price of our stock or impede the ability of our stockholders to change our management, even if such changes would be beneficial to our stockholders.
20
Table of Contents
Our stockholders may not receive dividends because of restrictions in our debt agreements, Delaware law and state regulatory requirements.
Our ability to pay dividends is restricted by the agreements governing our debt, including our senior credit facilities and the indenture governing our senior subordinated notes, as well as Delaware law and state regulatory requirements. In addition, we are permitted under the terms of our debt agreements to incur additional indebtedness that may restrict or prohibit the payment of dividends. Under Delaware law, our board of directors may not authorize payment of a dividend unless it is either paid out of our surplus, as calculated in accordance with the Delaware General Corporation Law, or, if we do not have a surplus, it is paid out of our net profits for the fiscal year in which the dividend is declared and/or the preceding fiscal year. To the extent we do not have adequate surplus or net profits, we will be prohibited from paying dividends.
The market price of our common stock may fluctuate significantly, and this may make it difficult for holders to resell our common stock when they want or at prices that they find attractive.
The price of our common stock on the NASDAQ Global Market constantly changes. We expect that the market price of our common stock will continue to fluctuate. The market price of our common stock may fluctuate as a result of a variety of factors, many of which are beyond our control. These factors include:
| • | changes in market conditions; |
| • | quarterly variations in our operating results; |
| • | operating results that vary from the expectations of management, securities analysts and investors; |
| • | changes in expectations as to our future financial performance; |
| • | announcements of strategic developments, significant contracts, acquisitions and other material events by us or our competitors; |
| • | the operating and securities price performance of other companies that investors believe are comparable to us; |
| • | future sales of our equity or equity-related securities; |
| • | changes in the economy and the financial markets; |
| • | departures of key personnel; |
| • | changes in governmental regulations; and |
| • | geopolitical conditions, such as acts or threats of terrorism or military conflicts. |
In addition, in recent years, global stock markets have experienced extreme price and volume fluctuations. This volatility has had a significant effect on the market price of securities issued by many companies for reasons often unrelated to their operating performance. These broad market fluctuations may adversely affect the market price of our common stock, regardless of our operating results.
Future issuances of our common stock will dilute the ownership interests of stockholders and may adversely affect the trading price of our common stock.
Future sales of substantial amounts of our common stock or equity-related securities in the public market, or the perception that such sales could occur, could materially and adversely affect prevailing trading prices of our common stock.
21
Table of Contents
Adverse capital and credit market conditions may significantly affect our ability to meet liquidity needs, access to capital and cost of capital.
The domestic and worldwide capital and credit markets have experienced and are experiencing significant volatility, disruptions and dislocations with respect to price and credit availability. There is continued uncertainty as to if and when the capital and credit markets will improve. Should we need additional funds or to refinance our existing indebtedness, we may not be able to obtain such additional funds.
We need liquidity to pay our operating expenses, interest on our debt and dividends on our capital stock. Without sufficient liquidity, we will be forced to curtail our operations, and our business will suffer. The principal sources of our liquidity are cash flow from operations and borrowings under our senior credit facility. In the event these resources do not satisfy our liquidity needs, we may have to seek additional financing. The availability of additional financing will depend on a variety of factors such as market conditions, the general availability of credit, the volume of trading activities, our credit ratings and credit capacity, as well as the possibility that customers or lenders could develop a negative perception of our long- or short-term financial prospects if the level of our business activity decreased due to a market downturn. In late 2008, Lehman Brothers, a 6.5% participant in our credit facility, filed for bankruptcy and stopped funding its share of our revolver borrowings. As Lehman Brothers is a defaulting lender, we are no longer able to draw upon their pro-rata portion of the revolver commitment. As of December 31, 2009, we had drawn $0.7 million of the $10 million applicable to Lehman Brothers. As such, Lehman Brothers’ remaining $9.3 million commitment has not been included in our availability under our credit facility. It is uncertain whether a new lender will purchase Lehman Brothers’ interest in our senior credit facility and fund the shortfall. In addition, there can be no assurance that other lenders will continue to fund our senior credit facility. If internal sources of liquidity prove to be insufficient, we may not be able to successfully obtain additional financing on favorable terms, or at all.
The current weakness in the economic environment and other factors could lead to our goodwill and other intangible assets becoming impaired, which may require us to take significant non-cash charges against earnings.
Under current accounting guidelines, we must assess, at least annually and potentially more frequently, whether the value of our goodwill and other intangible assets have been impaired. Any impairment of goodwill or other intangible assets as a result of such analysis would result in a non-cash charge against earnings, which charge could materially adversely affect our reported net income and our stock price. We test goodwill annually for impairment in the third quarter of each year, or more frequently should circumstances dictate. A significant and sustained decline in the our future cash flows, a significant adverse change in the economic environment, slower growth rates or our stock price falling below our net book value per share for a sustained period could result in the need to perform additional impairment analysis in future periods. If we were to conclude that a future write-down of goodwill or other intangible assets is necessary, then we would be required to record a non-cash charge against earnings, which, in turn, could have a material adverse affect on our reported net income and the book value of our stockholders’ equity. See “Management’s Discussion and Analysis of Financial Condition and Results of Operations—Critical Accounting Policies and Estimates.”
| Item 1B. | Unresolved Staff Comments |
None.
22
Table of Contents
| Item 2. | Properties |
Dredging
Great Lakes’ dredging fleet is the largest in the U.S. and one of the largest dredging fleets in the world. The fleet consists of over 200 pieces of equipment, including most of the large hydraulic dredges in the U.S., and is sufficient to meet the Company’s project requirements.
The following table provides a listing of the Company’s fleet of dredging and attendant plant as of December 31, 2009, including equipment under long-term operating leases:
| Type of Equipment |
Quantity | |||
| Hydraulic Dredges |
11 | |||
| Hopper Dredges |
10 | |||
| Mechanical Dredges |
5 | |||
| Unloaders |
2 | |||
| Drillboats |
2 | |||
| Material Barges |
21 | |||
| Other Barges |
70 | |||
| Booster Pumps |
8 | |||
| Tugs |
6 | |||
| Launches and Survey Boats |
52 | |||
| Total |
187 | |||
In addition the Company has numerous pieces of smaller equipment that support its dredging operations.
A significant portion of the Company’s operating equipment is subject to liens in favor of the Company’s senior lenders and bonding company. See Note 5 “Property and Equipment,” Note 12 “Long-Term Debt,” and Note 15 “Lease Commitments” in the Notes to Consolidated Financial Statements.
The Company leases approximately 50,000 square feet of office facilities in Oak Brook, Illinois, which serves as its principal administrative facility. The primary lease for this property was renewed in 2008 and will expire in 2019. The Company owns property in Staten Island, New York, Morgan City, Louisiana and Channelview, Texas. The Company maintains its principal office in Texas at the Channelview site, which serves as an operations office and support yard. The Company also leases waterfront properties in Baltimore, Maryland and Green Cove Springs, Florida. These locations serve as mooring sites for idle equipment and inventory storage.
Demolition
NASDI leases 13,000 square feet of office, garage and maintenance facilities in Waltham, Massachusetts, from Christopher A. Berardi, the president of NASDI’s parent company, pursuant to a lease that expires in 2016. See Note 11 “Related Party” in the Notes to Consolidated Financial Statements. NASDI maintains a fleet of operating equipment including excavators, loaders, trucks, and similar equipment, to meet its project requirements. Certain pieces of equipment are obtained under equipment finance arrangements or rented on a project by project basis.
| Item 3. | Legal Proceedings |
For information regarding legal proceedings, see Item 8. Financial Statements And Supplementary Data—Note 21. Commitments and Contingencies, which information is incorporated herein by reference.
| Item 4. | Reserved |
23
Table of Contents
| Item 5. | Market for Registrant’s Common Equity, Related Stockholder Matters and Issuer Purchases of Equity Securities |
Market Information
Our common stock is traded under the symbol “GLDD” on the NASDAQ Global Market. The table below sets forth, for the calendar quarters indicated, the high and low sales prices of the common stock as reported by NASDAQ from January 1, 2008 through December 31, 2009.
| Common Stock | ||||||||
| High | Low | |||||||
| First Quarter 2008 |
$ | 8.78 | $ | 4.99 | ||||
| Second Quarter 2008 |
$ | 6.37 | $ | 5.05 | ||||
| Third Quarter 2008 |
$ | 7.92 | $ | 5.58 | ||||
| Fourth Quarter 2008 |
$ | 6.35 | $ | 2.64 | ||||
| Common Stock | ||||||||
| High | Low | |||||||
| First Quarter 2009 |
$ | 4.77 | $ | 1.78 | ||||
| Second Quarter 2009 |
$ | 5.98 | $ | 2.76 | ||||
| Third Quarter 2009 |
$ | 7.46 | $ | 4.18 | ||||
| Fourth Quarter 2009 |
$ | 7.25 | $ | 5.62 | ||||
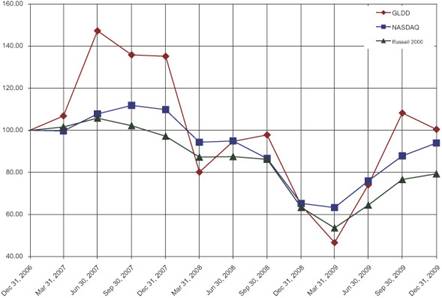
The graph shows the cumulative total return to stockholders of our common stock from December 27, 2006, the first day of trading of our common stock on the NASDAQ Global Market, through December 31, 2009, the last trading day of our 2009 fiscal year, compared with the return on both the NASDAQ Composite Index and the Russell 2000 Index. The graph assumes initial investments of $100 each on December 27, 2006, in GLDD stock (assuming reinvestment of all dividends paid during the period), the NASDAQ Composite Index and the Russell 2000 Index. The Russell 2000 Index, which includes Great Lakes, is derived from companies with market capitalization similar to our own. Due to the highly specialized nature of our primary business and the lack of publicly traded competitors in our industry, we do not believe we can reasonably identify either an applicable published industry or line-of-business index or comparable peer group.
24
Table of Contents
Holders of Record
As of March 4, 2010, the Company had approximately 44 shareholders of record of the Company’s common stock.
Dividends
Quarterly dividends per common share for the most recent two years are as follows:
| Dividend | ||||||||
| 2009 | 2008 | |||||||
| First Quarter |
$ | 0.017 | $ | 0.017 | ||||
| Second Quarter |
$ | 0.017 | $ | 0.017 | ||||
| Third Quarter |
$ | 0.017 | $ | 0.017 | ||||
| Fourth Quarter |
$ | 0.017 | $ | 0.017 | ||||
The declaration and payment of future dividends will be at the discretion of Great Lakes’ board of directors and depends on many factors, including general economic and business conditions, the Company’s strategic plans, financial results and condition, legal requirements including restrictions and limitations contained in the Company’s senior credit agreements and the indenture relating to the senior subordinated notes and other factors the board of directors deems relevant. Accordingly, the Company cannot assure the size of any such dividend or that the Company will pay any future dividend. The ability of the Company to pay dividends is restricted by certain covenants contained in the Company’s Credit Agreement, as well as subject to limitations contained in the Company’s indenture relating to its senior subordinated notes.
The Company is a holding company and has no direct operations. Our ability to pay cash dividends depends, in part, on the ability of the Company’s subsidiaries to pay cash dividends. The Company expects to cause the Company’s subsidiaries to pay distributions to us to fund the Company’s expected dividend payments, subject to applicable law and any restrictions contained in the Company’s debt agreements.
| Item 6. | Selected Financial Data |
The following table sets forth certain financial data regarding the Company and should be read in conjunction with the consolidated financial statements and notes thereto. See Item 15, “Financial Statements” and Item 7, “Management’s Discussion and Analysis of Financial Condition and Results of Operations”. The income statement and balance sheet data presented below have been derived from the Company’s consolidated financial statements.
On December 26, 2006, GLDD Acquisitions Corp., the Company’s then parent corporation, merged with a subsidiary of Aldabra. Aldabra was formed for the purpose of raising capital through an initial public offering with the intent to use the proceeds to merge with a business to build long term value. Under the terms of the Agreement and Plan of Merger entered into on June 20, 2006, the stockholders of GLDD Acquisitions Corp. received 28,906,189 shares of Aldabra common stock in exchange for all of GLDD Acquisitions Corp.’s common and preferred equity. Aldabra then merged into an indirect wholly-owned subsidiary and, in connection with this holding company merger, the stockholders of Aldabra, including the former GLDD Acquisitions Corp. stockholders, received stock in a new holding company that was subsequently renamed “Great Lakes Dredge & Dock Corporation.”
The merger with Aldabra was accounted for as a reverse acquisition. Under this method of accounting, Great Lakes was the acquiring company for financial reporting purposes. Accordingly, the merger was treated as the equivalent of Great Lakes issuing stock for the net monetary assets of Aldabra accompanied by a recapitalization. The net monetary assets of Aldabra, primarily cash, were stated at their fair value, which was equivalent to the carrying value, and accordingly no goodwill or other intangible assets were recorded. The following selected financial data as of and for the year ended December 31, 2005 reflects the financial position, results of operations and cash flows of GLDD Acquisition Corp. prior to the Merger. The accumulated deficit of GLDD Acquisition Corp. was carried forward to the recapitalized Company.
25
Table of Contents
Prior to the merger in 2006, the Company had Redeemable Preferred Stock. Dividends on the Company’s Series A and Series B Preferred Stock were cumulative semiannually and payable upon declaration at a rate of 8%. The preferred stock was recorded at its redemption and liquidation value of $1 per share, or $87 million plus accrued and unpaid dividends. Prior to the merger, there was $23.2 million in accumulated dividends outstanding. The holders of Preferred Stock were entitled to payment before any capital distribution was made with respect to any Junior Securities and had no voting rights. As a result of the merger on December 26, 2006, the preferred stock and accumulated dividends were exchanged for shares of Aldabra stock. The fair value of stock received was in excess of the carrying value of the Redeemable Preferred Stock at the time of the exchange. Therefore, the net loss available to common shareholders for the year ended December 31, 2006 was adjusted by $2.8 million in determining earnings per share. The historical results prior to the merger date of December 26, 2006, were that of GLDD Acquisitions Corp. As noted the merger was considered a reverse acquisition, and therefore the weighted-average shares outstanding for all prior periods were retroactively restated to reflect the shares that were issued to acquire GLDD Acquisitions Corp common stock. Accordingly, 9,287,669, were deemed to be outstanding at the beginning of the earliest period presented.
| Year Ended December 31, | ||||||||||||||||||||
| 2009 | 2008 | 2007 | 2006 | 2005 | ||||||||||||||||
| (in millions except share and per share data) | ||||||||||||||||||||
| Income Statement Data: |
||||||||||||||||||||
| Contract revenues |
$ | 622.2 | $ | 586.9 | $ | 515.8 | $ | 426.0 | $ | 423.4 | ||||||||||
| Costs of contract revenues |
534.0 | 517.6 | 447.8 | 369.0 | 372.0 | |||||||||||||||
| Gross profit |
88.2 | 69.3 | 67.9 | 57.0 | 51.4 | |||||||||||||||
| General and administrative expenses |
46.0 | 43.2 | 39.0 | 31.4 | 33.0 | |||||||||||||||
| Impairment of goodwill and intangibles |
— | — | — | — | 5.7 | |||||||||||||||
| Operating income |
42.3 | 26.1 | 29.0 | 25.6 | 12.7 | |||||||||||||||
| Interest expense, net |
(16.2 | ) | (17.0 | ) | (17.5 | ) | (24.3 | ) | (23.1 | ) | ||||||||||
| Equity in earnings (loss) of joint ventures |
(0.4 | ) | (0.0 | ) | 2.0 | 2.0 | 2.3 | |||||||||||||
| Income (loss) before income taxes |
25.7 | 9.1 | 13.5 | 3.3 | (8.1 | ) | ||||||||||||||
| Income tax benefit (provision) |
(11.0 | ) | (3.8 | ) | (6.4 | ) | (1.0 | ) | 1.4 | |||||||||||
| Net income (loss) |
14.7 | 5.3 | 7.1 | 2.3 | (6.6 | ) | ||||||||||||||
| Net (income) loss attributable to noncontrolling interests |
2.7 | (0.3 | ) | (0.1 | ) | (0.1 | ) | (0.3 | ) | |||||||||||
| Net income attributable to Great Lakes Dredge & Dock Corporation |
$ | 17.5 | $ | 5.0 | $ | 7.1 | $ | 2.2 | $ | (6.9 | ) | |||||||||
| Redeemable preferred stock dividends |
— | — | — | (8.2 | ) | (7.7 | ) | |||||||||||||
| Redemption of preferred stock |
— | — | — | (2.8 | ) | — | ||||||||||||||
| Net income (loss) available to common stockholders of Great Lakes Dredge & Dock Corporation |
$ | 17.5 | $ | 5.0 | $ | 7.1 | $ | (8.8 | ) | $ | (14.5 | ) | ||||||||
| Basic earnings (loss) per share (1) |
$ | 0.30 | $ | 0.09 | $ | 0.14 | $ | (0.90 | ) | $ | (1.57 | ) | ||||||||
| Basic weighted average shares |
58,506,608 | 58,469,431 | 48,911,491 | 9,779,781 | 9,287,699 | |||||||||||||||
| Diluted earnings (loss) per share (1) |
$ | 0.30 | $ | 0.09 | $ | 0.14 | $ | (0.90 | ) | $ | (1.57 | ) | ||||||||
| Diluted weighted average shares |
58,624,630 | 58,477,779 | 52,211,010 | 9,779,781 | 9,287,699 | |||||||||||||||
Note: Items may not sum due to rounding.
26
Table of Contents
| Year Ended December 31, | ||||||||||||||||||||
| 2009 | 2008 | 2007 | 2006 | 2005 | ||||||||||||||||
| Other Data: |
||||||||||||||||||||
| EBITDA (2) |
$ | 77.6 | $ | 55.9 | $ | 57.5 | $ | 52.6 | $ | 39.4 | ||||||||||
| Net cash flows from operating activities |
54.0 | 14.8 | (6.3 | ) | 33.9 | 10.3 | ||||||||||||||
| Net cash flows from investing activities |
(24.9 | ) | (26.3 | ) | (77.8 | ) | (21.5 | ) | (7.2 | ) | ||||||||||
| Net cash flows from financing activities |
(36.4 | ) | 13.7 | 88.6 | (9.4 | ) | (4.5 | ) | ||||||||||||
| Depreciation and amortization |
32.9 | 30.1 | 26.5 | 25.1 | 24.6 | |||||||||||||||
| Maintenance expense |
46.4 | 41.9 | 43.8 | 32.7 | 29.7 | |||||||||||||||
| Capital expenditures (3) |
27.3 | 44.6 | 111.0 | 29.8 | 12.7 | |||||||||||||||
| (1) | Refer to Note 1 in the Company’s Consolidated Financial Statements for the years ended December 31, 2009, 2008 and 2007 and above information for additional details regarding these calculations. |
| (2) | EBITDA in 2005 included the impact of a non-cash write down of goodwill and intangibles for $5.7 million for the demolition business. See definition of EBITDA below. |
| (3) | Capital expenditures in 2007 included the purchase of three vessels for $40.4 million. It also included the purchase of another vessel for $25.5 million, funded through a sale-leaseback transaction, as well as the buy-out of certain equipment previously under operating leases for $14.6 million. Capital expenditures in 2006 included approximately $3.9 million spent to buy out certain equipment previously under operating leases and $10.4 million related to the reconfiguration of a dredge into a material handling barge that was funded through a sale-leaseback transaction. |
| As of December 31, | ||||||||||||||||||||
| 2009 | 2008 | 2007 | 2006 | 2005 | ||||||||||||||||
| Balance Sheet Data: |
||||||||||||||||||||
| Cash and equivalents |
$ | 3.3 | $ | 10.5 | $ | 8.2 | $ | 3.6 | $ | 0.6 | ||||||||||
| Working capital |
91.3 | 87.7 | 82.3 | 42.9 | 48.4 | |||||||||||||||
| Total assets |
665.4 | 666.2 | 624.4 | 528.4 | 507.5 | |||||||||||||||
| Long term senior debt and subordinated notes |
186.0 | 216.5 | 196.5 | 194.7 | 250.8 | |||||||||||||||
| Total equity (deficit) |
245.8 | 228.1 | 230.4 | 130.5 | (24.1 | ) | ||||||||||||||
27
Table of Contents
EBITDA, as provided herein, represents net income (loss) attributable to Great Lakes Dredge & Dock Corporation, adjusted for net interest expense, income taxes, depreciation and amortization expense. The Company presents EBITDA as an additional measure by which to evaluate the Company’s operating trends. The Company believes that EBITDA is a measure frequently used to evaluate performance of companies with substantial leverage and that all of the Company’s primary stakeholders (i.e. its stockholders, bondholders and banks) use EBITDA to evaluate the Company’s period to period performance. Additionally, management believes that EBITDA provides a transparent measure of the Company’s recurring operating performance and allows management to readily view operating trends, perform analytical comparisons and identify strategies to improve operating performance. For this reason, the Company uses a measure based upon EBITDA to assess performance for purposes of determining compensation under the Company’s incentive plan. EBITDA should not be considered an alternative to, or more meaningful than, amounts determined in accordance with accounting principles generally accepted in the United States (“GAAP”) including: (a) operating income as an indicator of operating performance; or (b) cash flows from operations as a measure of liquidity. As such, the Company’s use of EBITDA, instead of a GAAP measure, has limitations as an analytical tool, including the inability to determine profitability or liquidity due to the exclusion of interest and income tax expense and the associated significant cash requirements and the exclusion of depreciation and amortization, which represent significant and unavoidable operating costs given the level of indebtedness and capital expenditures needed to maintain the Company’s business. For these reasons, the Company uses operating income to measure the Company’s operating performance and use EBITDA only as a supplement. The following is a reconciliation of EBITDA to net income (loss) attributable to Great Lakes Dredge and Dock Corporation:
| Year Ended December 31, | ||||||||||||||||||||
| 2009 | 2008 | 2007 | 2006 | 2005 | ||||||||||||||||
| Net income (loss) attributable to Great Lakes Dredge & Dock Corporation |
$ | 17.5 | $ | 5.0 | $ | 7.1 | $ | 2.2 | $ | (6.9 | ) | |||||||||
| Adjusted for: |
||||||||||||||||||||
| Interest expense, net |
16.2 | 17.0 | 17.5 | 24.3 | 23.1 | |||||||||||||||
| Income tax expense (benefit) |
11.0 | 3.8 | 6.4 | 1.0 | (1.4 | ) | ||||||||||||||
| Depreciation and amortization |
32.9 | 30.1 | 26.5 | 25.1 | 24.6 | |||||||||||||||
| EBITDA |
$ | 77.6 | $ | 55.9 | $ | 57.5 | $ | 52.6 | $ | 39.4 | ||||||||||
28
Table of Contents
NASDI, LLC Selected Financial Data
The following table sets forth certain financial data regarding NASDI and should be read in conjunction with the financial statements and notes thereto. See the NASDI Financial Statements and “Management’s Discussion and Analysis of Financial Condition and Results of Operations” that follows. The balance sheet and income statement data as of and for the years ended December 31, 2009, 2008, 2007 and 2005 presented below have been derived from NASDI’s audited financial statements. The balance sheet and income statement data as of and for the year ended December 31, 2006 presented below have been derived from NASDI’s unaudited financial statements. Effective April 30, 2008, North American Site Developers, Inc. was reorganized as NASDI, LLC. Just prior to the re-organization, $27.2 million of debt owed by NASDI to GLDD was converted into equity. All financial information below for periods prior to April 30, 2008 relates to North American Site Developers, Inc.
| Year Ended December 31, | ||||||||||||||||||||
| 2009 | 2008 | 2007 | 2006 | 2005 | ||||||||||||||||
| ( in thousands) | ||||||||||||||||||||
| Income Statement Data: |
||||||||||||||||||||
| Contract revenues |
$ | 43,790 | $ | 102,220 | $ | 75,923 | $ | 48,746 | $ | 49,137 | ||||||||||
| Costs of contract revenues |
45,466 | 90,017 | 64,996 | 41,340 | 41,089 | |||||||||||||||
| Gross profit |
(1,676 | ) | 12,203 | 10,927 | 7,406 | 8,048 | ||||||||||||||
| General and administrative expenses |
5,698 | 7,899 | 6,782 | 3,615 | 4,514 | |||||||||||||||
| Amortization of intangible assets |
151 | 299 | 121 | 82 | 330 | |||||||||||||||
| Impairment of goodwill and intangible assets |
— | — | — | — | 5,718 | |||||||||||||||
| Operating income (loss) |
(7,525 | ) | 4,005 | 4,024 | 3,709 | (2,514 | ) | |||||||||||||
| Interest expense, net |
(104 | ) | (190 | ) | (146 | ) | (72 | ) | (1 | ) | ||||||||||
| Interest expense to related party |
(217 | ) | (835 | ) | (2,745 | ) | (2,400 | ) | (2,308 | ) | ||||||||||
| Income (loss) before income taxes |
(7,846 | ) | 2,980 | 1,133 | 1,237 | (4,823 | ) | |||||||||||||
| Income tax provision |
— | (51 | ) | (909 | ) | (348 | ) | (2 | ) | |||||||||||
| Net income (loss) |
$ | (7,846 | ) | $ | 2,929 | $ | 224 | $ | 889 | $ | (4,825 | ) | ||||||||
| Year Ended December 31, | ||||||||||||||||||||
| 2009 | 2008 | 2007 | 2006 | 2005 | ||||||||||||||||
| ( in thousands) | ||||||||||||||||||||
| Other Data: |
||||||||||||||||||||
| Net cash flows from operating activities |
$ | (3,695 | ) | $ | 4,802 | $ | 3,078 | $ | (577 | ) | $ | 2,965 | ||||||||
| Net cash flows from investing activities |
(1,690 | ) | (1,353 | ) | (688 | ) | (3,509 | ) | (1,442 | ) | ||||||||||
| Net cash flows from financing activities |
5,463 | (3,729 | ) | (2,409 | ) | 4,344 | (1,496 | ) | ||||||||||||
| Depreciation and amortization |
2,484 | 2,373 | 1,854 | 1,240 | 1,499 | |||||||||||||||
| Capital expenditures |
2,103 | 1,376 | 688 | 1,694 | 1,710 | |||||||||||||||
| As of December 31, | ||||||||||||||||||||
| 2009 | 2008 | 2007 | 2006 | 2005 | ||||||||||||||||
| ( in thousands) | ||||||||||||||||||||
| Balance Sheet Data: |
||||||||||||||||||||
| Cash and equivalents |
$ | 194 | $ | 116 | $ | 396 | $ | 415 | $ | 157 | ||||||||||
| Working capital |
(7,710 | ) | 877 | (1,997 | ) | (3,681 | ) | 2,209 | ||||||||||||
| Total assets |
43,196 | 47,215 | 51,361 | 42,832 | 37,323 | |||||||||||||||
| Notes payable-related party |
— | — | 27,242 | 27,242 | 27,242 | |||||||||||||||
| Total members’ equity (deficit) |
22,610 | 30,627 | (1,307 | ) | (1,532 | ) | (2,422 | ) | ||||||||||||
29
Table of Contents
Yankee Environmental Services, LLC Selected Financial Data
The following table sets forth certain financial data regarding Yankee and should be read in conjunction with the financial statements and notes thereto. See the Yankee Financial Statements and “Management’s Discussion and Analysis of Financial Condition and Results of Operations” that follows. The balance sheet and income statement data as of and for the year ended December 31, 2009 presented below has been derived from the Yankee’s audited financial statements. The balance sheet and income statement data as of and for the year ended December 31, 2008, 2007, 2006 and 2005 presented below have been derived from the unaudited financial statements of Yankee Liquidation Corp. or formerly Yankee Environmental Services, Inc. (“Yankee, Inc.”). Yankee purchased the assets of Yankee, Inc. on January 1, 2009.
| Year Ended December 31, | ||||||||||||||||||||
| 2009 | 2008 | 2007 | 2006 | 2005 | ||||||||||||||||
| (in thousands) | ||||||||||||||||||||
| Income Statement Data: |
||||||||||||||||||||
| Contract revenues |
$ | 7,760 | $ | 14,181 | $ | 5,155 | $ | 5,533 | $ | 5,859 | ||||||||||
| Costs of contract revenues |
7,472 | 10,347 | 3,876 | 4,428 | 5,397 | |||||||||||||||
| Gross profit |
288 | 3,834 | 1,279 | 1,105 | 462 | |||||||||||||||
| General and administrative expenses |
554 | 1,190 | 837 | 813 | 777 | |||||||||||||||
| Amortization of intangible assets |
481 | — | — | — | — | |||||||||||||||
| Operating income (loss) |
(747 | ) | 2,644 | 442 | 292 | (315 | ) | |||||||||||||
| Interest expense, net |
115 | 63 | 112 | 123 | 73 | |||||||||||||||
| Income (loss) before income taxes |
(862 | ) | 2,581 | 330 | 169 | (388 | ) | |||||||||||||
| Income tax provision |
— | — | (1 | ) | (1 | ) | (1 | ) | ||||||||||||
| Net income (loss) |
$ | (862 | ) | $ | 2,581 | $ | 329 | $ | 168 | $ | (389 | ) | ||||||||
| Year Ended December 31, | ||||||||||||||||||||
| 2009 | 2008 | 2007 | 2006 | 2005 | ||||||||||||||||
| (in thousands) | ||||||||||||||||||||
| Other Data: |
||||||||||||||||||||
| Net cash flows from operating activities |
$ | (2,545 | ) | $ | 1,703 | $ | 397 | $ | 346 | $ | (236 | ) | ||||||||
| Net cash flows from investing activities |
(1,891 | ) | (248 | ) | — | (75 | ) | (225 | ) | |||||||||||
| Net cash flows from financing activities |
4,649 | (1,562 | ) | (295 | ) | (257 | ) | 430 | ||||||||||||
| Depreciation and amortization |
755 | 117 | 94 | 103 | 91 | |||||||||||||||
| Capital expenditures |
— | 248 | — | 98 | 225 | |||||||||||||||
| As of December 31, | ||||||||||||||||||||
| 2009 | 2008 | 2007 | 2006 | 2005 | ||||||||||||||||
| (in thousands) | ||||||||||||||||||||
| Balance Sheet Data: |
||||||||||||||||||||
| Cash |
$ | 213 | $ | 11 | $ | 118 | $ | 17 | $ | 3 | ||||||||||
| Working capital (deficiency) |
(69 | ) | 1,270 | 182 | (173 | ) | (309 | ) | ||||||||||||
| Total assets |
4,920 | 2,357 | 1,455 | 1,833 | 1,717 | |||||||||||||||
| Total equity (deficiency) |
1,029 | 1,657 | 250 | 22 | (77 | ) | ||||||||||||||
30
Table of Contents
Item 7. Management’s Discussion and Analysis of Financial Condition and Results of Operations
Overview
The Company is the largest provider of dredging services in the United States. In addition, the Company is the only U.S. dredging service provider with significant international operations, which represented approximately 30% of the Company’s dredging revenues for 2009, comparable to the Company’s three year average.
Dredging generally involves the enhancement or preservation of navigability of waterways or the protection of shorelines through the removal or replenishment of soil, sand or rock. The U.S. dredging market consists of three primary types of work: capital, beach nourishment and maintenance, in which sectors the Company has experienced an average combined bid market share in the U.S. of 46% over the past three years, including 62%, 43% and 35% of the capital, beach nourishment and maintenance sectors, respectively. Our bid market is defined as the aggregate dollar value of domestic projects on which the Company bids or could have bid if not for capacity constraints.
Our fleet of 26 dredges, of which 10 are deployed internationally, 21 material transportation barges, two drillboats, and numerous other specialized support vessels is the largest and most diverse fleet of any U.S. dredging company. The mobility of the Company’s fleet enables us to move equipment in response to changes in demand for dredging services to take advantage of the most attractive opportunities to employ its dredges. The Company estimates the replacement cost of the Company’s fleet to be in excess of $1.5 billion in the current market.
Our largest domestic dredging customer is the Army Corp of Engineers (“Corps”) which is responsible for federally funded projects related to navigation and flood control of U.S. waterways. Our dredging revenues for 2009 earned from contracts with federal government agencies, including the Corps as well as other federal entities such as the U.S. Coast Guard and the U.S. Navy, was approximately 61%, as compared with the Company’s three year average of 54%.
31
Table of Contents
The Company also owns a majority interest in NASDI, a demolition service provider located in the Boston, Massachusetts area. NASDI’s principal services consist of interior and exterior demolition of commercial and industrial buildings, salvage and recycling of related materials, and removal of hazardous substances and materials. The majority of NASDI’s work has historically been performed in the New England area; however, NASDI is currently expanding into New York and other New England states. In January 2009, the Company acquired a 65% interest in Yankee, a provider of environmental remediation services including asbestos abatement and removal of other hazardous materials for private and governmental entities. Prior to this acquisition, Yankee served as a subcontractor on many NASDI projects.
The Company has a 50% ownership interest in Amboy. Amboy’s primary business is mining sand from the entrance channel to New York harbor in order to provide sand and aggregate for use in road and building construction. Together with the Company’s Amboy joint venture partner, the Company owns a 50% interest in land that is adjacent to Amboy’s property and may be used in conjunction with Amboy’s operations. Our investment in Amboy is accounted for using the equity method.
The Company operates in two reportable segments: dredging and demolition.
Contract Revenues
Most of the Company’s dredging contracts are obtained through competitive bidding on terms specified by the party inviting the bid. The types of equipment required to perform the specified service and the estimated project duration affect the cost of performing the contract and the price that dredging contractors will bid.
The Company recognizes contract revenues under the percentage-of-completion method, based on the Company’s engineering estimates of the physical percentage completed for dredging projects and using a cost-to-cost approach for demolition projects. For dredging projects, costs of contract revenues are adjusted to reflect the gross profit percentage expected to be achieved upon ultimate completion of each dredging project. For demolition projects, contract revenues are adjusted to reflect the estimated gross profit percentage. Provisions for estimated losses on contracts in progress are made in the period in which such losses are determined. Claims for additional compensation due to the Company are not recognized in contract revenues until such claims are settled. Billings on contracts are generally submitted after verification with the customers of physical progress and may not match the timing of revenue recognition. The difference between amounts billed and recognized as revenue is reflected in the balance sheet as either contract revenues in excess of billings or billings in excess of contract revenues. Contract modifications may be negotiated when a change from the original contract specifications is encountered, necessitating a change in project scope or performance methodology and/or material disposal. Significant expenditures incurred incidental to major contracts are deferred and recognized as costs of contracts based on contract performance over the duration of the related project. These expenditures are reported as prepaid expenses.
Costs and Expenses
The components of costs of contract revenues include labor, equipment (including depreciation, maintenance, insurance, and long-term rentals), fuel, subcontracts, rentals, and project overhead. Hourly labor is generally hired on a project-by-project basis. Costs of contract revenues vary significantly depending on the type and location of work performed and assets utilized. Generally, capital projects have the highest margins due to the complexity of the projects, while beach nourishment projects have the most volatile margins because they are most often exposed to variability in weather conditions.
The Company’s cost structure includes significant annual equipment related costs, including depreciation, maintenance, insurance and long-term equipment rentals, averaging approximately 22% to 25% of total costs of contract revenues over the last three years. During the year, both equipment utilization and the timing of cost expenditures fluctuate significantly. Accordingly, the Company allocates these equipment costs to interim periods in proportion to revenues recognized over the year to better match revenues and expenses. Specifically, at each interim
32
Table of Contents
reporting date the Company compares actual revenues earned to date on the Company’s dredging contracts to expected annual revenues and recognizes equipment costs on the same proportionate basis. In the fourth quarter, any over and under allocated equipment costs are recognized such that the expense for the year equals actual equipment costs incurred during the year. As a result of this methodology, the recorded expense in any interim period may be higher or lower than the actual equipment costs incurred in that interim period.
Primary Factors that Determine Operating Profitability
Dredging. The Company’s results of operations for its dredging segment for a calendar or quarterly period are generally determined by the following three factors:
| • | Bid wins and dredge employment—The Company’s dredging segment generates revenues when the Company wins a bid for a dredging contract and starts that project. Although the Company’s dredging equipment is subject to downtime for scheduled periodic maintenance and repair, the Company seeks to maximize its revenues by employing its dredging equipment on a full-time basis. If a dredge is idle (i.e., the dredge is not employed on a dredging project or undergoing scheduled periodic maintenance and repair), the Company does not earn revenue with respect to that dredge during the time period for which it is idle. |
| • | Project and dredge mix—The Company’s domestic dredging projects generally involve domestic capital, maintenance and beach nourishment work and its foreign dredging projects generally involve capital work. In addition, the Company’s dredging projects vary in duration and, in general, projects of longer duration result in less dredge downtime in a given period. Moreover, the Company’s dredges have different physical capabilities and typically work on certain types of dredging projects. Accordingly, the Company’s dredges have different daily revenue generating capacities. |
The Company generally expects to achieve different levels of gross margin (i.e., gross profit divided by revenues) for work performed on the different types of dredging projects and for work performed by different types of dredges. The Company’s expected gross margin for a project is based upon the Company’s estimates at the time of the bid. Although the Company seeks to bid on and win projects that will maximize its gross margin, the Company cannot control the type of dredging projects that are bid from time to time, the type of dredge that is needed to complete these projects or the time schedule upon which these projects are required to be completed. As a result, in some quarters the Company works on a mix of dredging projects that, in the aggregate, have relatively high expected gross margins (based on project type and dredges employed) and in other quarters, the Company works on a mix of dredging projects that, in the aggregate, have relatively low expected gross margins (based on project type and dredges employed).
| • | Project execution—The Company seeks to execute all of its dredging projects consistent with its project estimates. In general, the Company’s ability to achieve its project estimates depends upon many factors including weather, variances from estimated project conditions, equipment mobilization time periods, unplanned equipment downtime or other events or circumstances beyond the Company’s control. If the Company experiences any of these events and circumstances, the completion of a dredging project will often be accelerated or delayed, as applicable, and, consequently, the Company will experience project results that are better or worse than its estimates. The Company does its best to estimate for events and circumstances that are not within its control; however, these situations are inherent in dredging. |
Demolition. The Company’s demolition segment generates revenues when the Company is awarded a contract for demolition services and performs the project. The Company’s revenues from its demolition segment increase or decrease based upon market demand. Like the Company’s dredging segment, results of operations for the Company’s demolition segment fluctuate based upon project mix and the Company’s ability to execute its projects consistent with its estimates.
Critical Accounting Policies and Estimates
Our significant accounting policies are discussed in the Notes to the Consolidated Financial Statements. The application of certain of these policies requires significant judgments or an estimation process that can affect the Company’s results of operations, financial position and cash flows, as well as the related footnote disclosures. The
33
Table of Contents
Company bases the Company’s estimates on historical experience and other assumptions that the Company believes are reasonable. If actual amounts are ultimately different from previous estimates, the revisions are included in the Company’s results of operations for the period in which the actual amounts become known. The following accounting policies comprise those that management believes are the most critical to aid in fully understanding and evaluating the Company’s reported financial results.
Percentage-of-completion method of revenue recognition—The Company’s contract revenues are recognized under the percentage-of-completion method, which is by its nature based on an estimation process. For dredging projects, the Company uses engineering estimates of the physical percentage of completion. For demolition projects, the Company uses estimates of remaining costs-to-complete to determine project percent complete. In preparing the Company’s estimates, the Company draws on the Company’s extensive experience in the dredging and demolition businesses and the Company’s database of historical information to assure that the Company’s estimates are as accurate as possible, given current circumstances. Provisions for estimated losses on contracts in progress are made in the period in which such losses are determined. Claims for additional compensation are not recognized in contract revenues until such claims are settled. Cost and profit estimates are reviewed on a periodic basis to reflect changes in expected project performance.
Impairment of goodwill—GAAP requires that goodwill be tested for impairment at the reporting unit level on an annual basis and between annual tests if an event occurs or circumstances change that would more likely than not reduce the fair value of the reporting unit below its carrying value. The Company believes that this estimate is a critical accounting estimate because: (i) goodwill is a material asset and (ii) the impact of an impairment could be material to the consolidated balance sheet and consolidated statement of operations. The Company performs the Company’s annual impairment test as of July 1 each year.
The Company assesses the fair values of its reporting units using both a market approach and an income approach. Under the income approach, the fair value of the reporting unit is based on the present value of estimated future cash flows. The income approach is dependent on a number of factors, including estimates of future market growth trends, forecasted revenues and expenses, expected periods the assets will be utilized, appropriate discount rates and other variables. The estimates are based on assumptions that the Company believes to be reasonable, but which are unpredictable and inherently uncertain. Changes in these estimates and assumptions could materially affect the determination of fair value, and may result in the impairment of goodwill in the event that actual results differ from those estimates.
The market approach measures the value of an entity through comparison to comparable companies. Under the market approach, the Company uses the guideline public company method by applying an estimated market-based enterprise value multiples to the reporting unit’s estimated revenue and EBITDA. The Company analyzed companies that performed similar services or are considered competitors. Due to the fact that there are no public companies that are our direct competitors, the Company weighed the results of this approach less than the income approach.
At December 31, 2009, the majority of goodwill represents the purchase price in excess of the net amount assigned to assets acquired and liabilities assumed by Madison Dearborn Capital Partners IV, L.P. on December 23, 2003. Goodwill was allocated between the Company’s two reporting segments, dredging and demolition, based on the value assigned to each segment at that time. At December 31, 2009 and 2008, dredging goodwill was $76.6 million in each year and demolition goodwill was $21.5 million and $21.2 million, respectively. The increase in demolition goodwill was the result of the January 1, 2009 acquisition of Yankee Environmental Services LLC. See Note 20 “Noncontrolling Interest Acquisitions” to Consolidated Financial Statements.
The Company performed its annual test of impairment as of July 1, 2009 for the goodwill in both the dredging and demolition segments with no indication of goodwill impairment as of the test date. The decline in the operating results and related cash flow forecasts in the demolition segment during the past year has reduced the amount by which the estimated fair value of the demolition segment exceeds the carrying value of the demolition segment’s assets. As of the measurement date, the fair value of the demolition segment was $1.8 million above the carrying value. A more than insignificant decline in the demolition segment’s future operating results or cash flow forecasts versus the segment’s current forecasts could potentially trigger a goodwill impairment charge in a future period. Early in 2010, the demolition segment was awarded over $30 million of new projects, a significant portion of which are in the New York market, where it has been gaining a foothold. No test was performed in the fourth quarter as based on the segment’s current forecasts triggering events which would require a test were deemed to not have occurred.
34
Table of Contents
The Company will continue to perform a goodwill impairment test as required on an annual basis, and between annual tests if events or conditions result in a triggering event, thus requiring a test.
Impairment of long-lived assets—In accordance with GAAP, the Company evaluates the carrying value of long-lived assets whenever events or changes in circumstances indicate that an impairment may exist. Our policy is to recognize an impairment charge when an asset’s carrying value exceeds its net undiscounted future cash flows. The amount of the charge is the difference between the asset’s book value and fair market value. Our policy is to estimate the undiscounted future cash flows using financial projections that require the exercise of significant judgment on the part of management. Changes in these projections may expose us to future impairment charges. If a triggering event requiring impairment testing occurs, the Company would evaluate the remaining useful lives of these assets to determine whether the lives are still appropriate.
Self-insurance reserves—The Company self-insures costs associated with its seagoing employees covered by the provisions of Jones Act, workers’ compensation claims, hull and equipment liability, and general business liabilities up to certain limits. Insurance reserves are established for estimates of the loss that the Company will ultimately incur on reported claims, as well as estimates of claims that have been incurred but not yet reported. In determining its estimates, the Company considers historical loss experience and judgments about the present and expected levels of cost per claim. Trends in actual experience are a significant factor in the determination of such reserves.
Income taxes—The Company calculates its current and deferred tax provision based on estimates and assumptions that could differ from the actual results reflected in income tax returns filed during the subsequent year. Adjustments based on filed returns are recorded when identified, which is generally in the third quarter of the subsequent year for U.S. federal and state provisions. The amount of income taxes the Company pays is subject to ongoing audits by federal, state and foreign tax authorities, which may result in proposed assessments. Our estimate for the potential outcome for any uncertain tax issue is highly judgmental. Management believes it has adequately provided for uncertain tax positions that are not more likely than not to be sustained upon examination. However, the Company’s future results may include favorable or unfavorable adjustments to estimated tax liabilities in the period the assessments are made or resolved or when statutes of limitation on potential assessments expire.
Results of Operations—Fiscal Years
The following table sets forth the components of net income as a percentage of contract revenues for the years ended December 31:
| 2009 | 2008 | 2007 | ||||||||||
| Contract revenues |
100.0 | % | 100.0 | % | 100.0 | % | ||||||
| Costs of contract revenues |
(85.8 | ) | (88.2 | ) | (86.8 | ) | ||||||
| Gross profit |
14.2 | 11.8 | 13.2 | |||||||||
| General and administrative expenses |
(7.4 | ) | (7.4 | ) | (7.6 | ) | ||||||
| Operating income |
6.8 | 4.4 | 5.6 | |||||||||
| Interest expense, net |
(2.6 | ) | (2.9 | ) | (3.4 | ) | ||||||
| Equity in earnings of joint ventures |
(0.1 | ) | — | 0.4 | ||||||||
| Income before income taxes |
4.1 | 1.5 | 2.6 | |||||||||
| Income tax provision |
(1.8 | ) | (0.7 | ) | (1.2 | ) | ||||||
| Net income (loss) |
2.3 | 0.8 | 1.4 | |||||||||
| Net (income) loss attributable to noncontrolling interests |
0.4 | — | — | |||||||||
| Net income attributable to Great Lakes Dredge & Dock Corporation |
2.7 | % | 0.8 | % | 1.4 | % | ||||||
35
Table of Contents
Components of Contract Revenues
The following table sets forth, by segment and type of work, the Company’s contract revenues for the years ended December 31 (in thousands):
| 2009 | 2008 | 2007 | ||||||||||
| Revenues |
||||||||||||
| Dredging: |
||||||||||||
| Capital—U.S. |
$ | 203,147 | $ | 153,414 | $ | 129,569 | ||||||
| Capital—foreign |
134,123 | 172,345 | 140,468 | |||||||||
| Beach nourishment |
62,133 | 63,550 | 90,142 | |||||||||
| Maintenance |
174,908 | 95,350 | 79,659 | |||||||||
| Demolition |
47,933 | 102,220 | 75,923 | |||||||||
| $ | 622,244 | $ | 586,879 | $ | 515,761 | |||||||
2009 Performance Overview
The Company earned record revenues and earnings in 2009, as the Company’s dredges were well deployed, its dredging project mix was favorable and, in the aggregate, the Company was able to execute its projects better than its estimates. The domestic bid market, a key measure of dredging activity in the U.S., was $1.1 billion in 2009, a 45% increase from the 2008 bid market of $783 million. Although, the Stimulus had a positive impact on the market, there was an underlying need for many projects that spurred the market even before projects supported by the Stimulus money were bid. Revenue and margins for the full year strengthened from prior years as a result of the increase in domestic activity, more than offsetting the slowdowns in both foreign operations and the demolition business.
Year Ended December 31, 2009 Compared to Year Ended December 31, 2008
Dredging revenues were $574.3 million in 2009, an increase of $89.6 million, or 18.7%, over 2008 dredging revenues of $484.7 million, due to a higher level of dredge deployment in 2009. In particular, the 2009 increase was the result of increased domestic dredging operations that more than offset decreased foreign dredging activity. Dredging gross margin was 15.6%, up from 11.8% in 2008, primarily due to increased dredging revenues and project execution that was better than the Company’s estimates for certain projects, particularly in the first half of the year. Highlights from the Company’s primary dredging sectors are as follows:
| • | Revenues from domestic capital dredging projects of $203.1 million in 2009 were up $49.7 million, or 32.4%, from 2008 revenues of $153.4. This increase was driven by additional capital projects, including deepening work in the ports of New York, New Jersey, Jacksonville and Tampa, Florida and three coastal restoration projects in Louisiana. |
| • | Revenues from beach nourishment projects of $62.1 million in 2009 decreased $1.4 million, or 2.2%, from $63.5 million in 2008. Beach revenues were negatively impacted throughout 2008 and the beginning of 2009 as state and local governments experienced delays in getting the necessary funding to put projects out to bid. More beach work was bid and worked in the second half of 2009. |
| • | Revenues from maintenance dredging projects in 2009 were $174.9 million, an increase of $79.6 million, or 83.4%, from $95.4 million in 2008. This increase was due to the Corps continuing to put out maintenance work that had long been delayed. The Company believes that many maintenance projects were supported by Stimulus funding. |
| • | Revenues from foreign dredging operations in 2009 totaled $134.1 million, a decrease of $38.2 million, or 22%, from 2008 revenues of $172.3 million. Revenues decreased due to the postponement of a portion of the Company’s largest foreign project and declining Middle Eastern demand resulting from the global recession, instability in oil prices and the deterioration of the region’s real estate market in 2008 and 2009. |
36
Table of Contents
Demolition revenues in 2009 were $47.9 million, a decrease of $54.3 million, or 53%, over 2008 revenues of $102.2 million. As the construction and real estate development market continued to slow in 2009, new project opportunities were scarce. In addition, a few projects that had been worked on in 2008 were canceled in 2009, resulting in write offs related to those projects. Moreover, several large demolition projects were worked on in 2008 and were not replaced in 2009. As a result, the demolition segment recorded negative gross profit margin of 1.8% compared to gross profit margin of 11.9% in 2008.
Dredging segment operating income for 2009 increased 124% reaching $49.8 million versus $22.2 million in 2008, as strong gross profit performance offset a 12.1% increase in general and administrative expenses. These expenses increased primarily due to higher payroll and incentive costs, legal expenses and other costs related to the Company’s August 2009 secondary offering of stock.
In 2009, the demolition segment produced an operating loss of $7.6 million, compared to operating income of $3.9 million in 2008 due to weaker gross profit performance including write offs related to canceled projects. Demolition segment general and administrative expenses for 2009 of $6.3 million decreased 21.6% compared with $8.0 million in 2008 primarily as a result of a decrease in incentive pay.
Consolidated general and administrative expenses as a percentage of revenue have been generally consistent, ranging between 7.3% and 7.5% of revenues over the last three years.
The Company’s net interest expense for the year ended December 31, 2009 totaled $16.2 million compared with $17.0 million in 2008. While average debt levels were consistent year over year, lower interest rates decreased interest expense. The Company entered into new interest rate swap agreements in 2009 for which the Company realized a $0.5 million gain during the year. In 2008 the Company also realized a $0.5 million gain on its former swap agreements.
The Company incurred income tax expense of $10.9 million compared with $3.8 million in 2009. This $7.4 million increase is primarily the result of the increase in the Company’s operating income. The effective tax rate for the year ended December 31, 2009 was 42.7% compared to 42.1% for the year ended December 31, 2008.
For the year ended December 31, 2009, net income attributable to Great Lakes was $17.5 million compared to $5.0 million for the year ended December 31, 2008. This $12.5 million increase was driven by higher operating income in 2009 as previously described.
Year Ended December 31, 2008 Compared to Year Ended December 31, 2007
Dredging revenues were $484.7 million in 2008, an increase of $44.9 million, or 10.2%, over 2007 dredging revenues of $439.8 million. Dredging gross margin was 11.8%, down from 13.0% in 2007 due to the negative impacts of unfavorable weather, the loss of the dredge New York for the majority of 2008 and a $2.2 million retroactive insurance premium.
| • | Revenues from domestic capital dredging projects of $153.4 million in 2008 were up $23.8 million, or 18%, from 2007 revenues of $129.6. This increase was driven by additional capital projects, including deepening work in the ports of New York, New Jersey and Boston, a deepening project in the Columbia River in Oregon, and two projects in the Gulf of Mexico. |
| • | Revenues from beach nourishment projects of $63.6 million decreased $26.5 million, or 30%, from $90.1 million in 2007. Beach revenues were negatively impacted throughout 2008 as state and local governments experienced delays in getting the necessary approvals to put projects out to bid. |
| • | Revenues from maintenance dredging projects in 2008 were $95.4 million, an increase of $15.7 million, or 19%, from $79.7 million in 2007. This increase was due to the Corps continuing to put out maintenance work, in addition to receiving emergency funds needed due to the flooding in the Mississippi River and hurricanes in the Gulf Coast. |
37
Table of Contents
| • | Revenues from foreign dredging operations in 2008 totaled $172.3 million an increase of $31.8 million, or 22%, from 2007 revenues of $140.5 million. Revenues increased from 2007 as the Company moved additional vessels to the Middle East to work on several large land reclamation projects in Bahrain. |
Demolition revenues were $102.2 million, an increase of $26.3 million, or 34%, over 2007 revenues of $75.9 million. This increase was due to several large projects which were substantially completed by mid-year. A significant portion of the work on these projects included subcontract work; consequently NASDI’s margins on these projects were not as high as NASDI typically generates. Gross profit of 11.9% in the demolition segment was down from 14.4% in 2007 due to the increase in subcontract work, a decrease in the price for scrap and the adverse impacts of project delays and a customer bankruptcy.
For the year ended December 31, 2008, consolidated general and administrative expenses totaled $42.8 million, compared with $38.7 million in 2007, an increase of $4.1 million, or 10.6%, due to payroll and health care cost increases. General and administrative expenses as a percentage of revenue have been generally consistent, ranging between 7.2% and 7.5% of revenues over the last three years.
In 2008, the dredging segment produced operating income of $22.2 million, down $2.8 million, or 11.2%, versus 2007 operating income of $25.0 million due to the factors described above. In 2008 demolition operating income was $3.9 million, on par with 2007 operating income of $4.0 million despite NASDI’s higher 2008 revenues.
The Company’s net interest expense for the year ended December 31, 2008 totaled $17.0 million compared with $17.5 million in 2007. The impact of higher average debt levels during the year were more than offset by lower interest rates. However, the Company had an unrealized gain of $0.4 million on the mark to market of its interest rate swap, compared to a $1.1 million gain last year. By virtue of a call provision contained in the swap agreements, the interest rate swaps were terminated by the Company’s counterparties in December 2008.
The Company incurred income tax expense of $3.8 million compared with $6.4 million in 2007. This $2.6 million decrease is primarily the result of the Company’s reduced operating income. The effective tax rate for the year ended December 31, 2008 was 42.1% compared to 47.4% for the year ended December 31, 2007. The effective rate was higher in 2007 as the Company increased its federal deferred tax rate to 35%. This increase in the deferred tax rate resulted in deferred tax expense of $0.9 million which increased the effective tax rate by 6.5%.
For the year ended December 31, 2008, the Company generated net income of $5.0 million compared to $7.1 million for the year ended December 31, 2007. This $2.1 million decrease in net income was driven by decreased operating income in 2008.
Bidding Activity and Backlog
The following table sets forth, by segment and type of dredging work, the Company’s backlog as of the dates indicated (in thousands):
| December 31, 2009 |
December 31, 2008 |
December 31, 2007 |
||||||||||
| Backlog |
||||||||||||
| Dredging: |
||||||||||||
| Capital—U.S. |
$ | 203,294 | $ | 176,051 | $ | 174,798 | ||||||
| Capital—foreign |
35,715 | 139,479 | * | 107,153 | ||||||||
| Beach nourishment |
63,390 | 18,934 | 30,614 | |||||||||
| Maintenance |
63,335 | 26,726 | 8,958 | |||||||||
| Demolition |
16,448 | 23,501 | 38,871 | |||||||||
| $ | 382,182 | $ | 384,691 | $ | 360,394 | |||||||
| * | Foreign backlog has been decreased for the portion of the Diyar contract that became an option pending award in the first quarter of 2009 |
38
Table of Contents
The Company’s contract backlog represents its estimate of the revenues that will be realized under the portion of the contracts remaining to be performed. For dredging contracts these estimates are based primarily upon the time and costs required to mobilize the necessary assets to and from the project site, the amount and type of material to be dredged and the expected production capabilities of the equipment performing the work. For demolition contracts, these estimates are based on the time and remaining costs required to complete the project. However, these estimates are necessarily subject to variances based upon actual circumstances. Because of these factors, as well as factors affecting the time required to complete each job, backlog is not necessarily indicative of future revenues or profitability. In addition, a significant amount of the Company’s dredging backlog relates to federal government contracts, which can be canceled at any time without penalty, subject to the Company’s right, in some cases, to recover the Company’s actual committed costs and profit on work performed up to the date of cancellation. In addition, the Company’s backlog may fluctuate significantly from quarter to quarter based upon the type and size of the projects the Company is awarded from the bid market. A quarterly increase or decrease of the Company’s backlog does not necessarily result in an improvement or a deterioration of the Company’s business. The Company’s backlog includes only those projects for which the Company has obtained a signed contract with the customer.
Dredging. The domestic dredging bid market for 2009 was $1.1 billion, a 45% increase from the 2008 bid market of $783 million. Maintenance work was the primary source of this increase, with $645 million in awards, nearly double the 2008 market of $351 million. The Company won contracts totaling $533 million, or 47% of the total bid domestic market, well above its five-year average of 41%, and $233 million more than it won in 2008.
The Company’s dredging backlog at December 31, 2009 totaled $365.7 million, compared to $361.2 million at December 31, 2008, reduced for the portion of the Diyar contract that became an option in the first quarter of 2009.
Approximately $203.3 million, or 55%, of the Company’s year-end dredging backlog consists of domestic capital dredging work, a substantial portion of which is expected to be performed in 2010. This level of capital backlog is higher than the prior year with the addition of deepening work in the ports of Jacksonville, Florida and Mobile, Alabama and the remaining work in the ports of New York and New Jersey. Predominantly all of the capital work in backlog at the end of 2009 is federally funded.
Beach nourishment backlog was $63.4 million at the end of 2009, a 235% increase from $19.0 million at the end of 2008. The 2009 beach nourishment bid market, which had been slow in 2008 and the first half of 2009, improved in the second half of 2009 and totaled $183 million, slightly above the average bid market over the last five years of $175 million. The Company won $93 million, over 50% of the 2009 work that was bid.
Maintenance backlog was $63.3 million at the end of 2009, more than twice the backlog of $26.7 million at the end of 2008. As noted above, the 2009 maintenance bid market was $645 million, which was above the five year average maintenance market of $251 million, primarily because the Corps received increased funding including Stimulus monies to focus on maintenance work that had been deferred. The Company’s share of the 2009 market was 33%, on par with its historical share of 35% over the last three years.
Foreign capital backlog decreased to $35.7 million at the end of 2009 from $139.5 million at the end of 2008, primarily as a result of the completion of projects that were in backlog at the end of 2008 and the slowdown in projects being bid and awarded.
Demolition. The Company’s demolition backlog at December 31, 2009 totaled $16.4 million, a 30% decrease from backlog of $23.5 million at December 31, 2008. The demolition market has slowed as a result of the decreased activity in the construction and real estate development markets.
Market Outlook
United States. The Water Resources Development Act (“WRDA”) is the primary vehicle for authorizing federal capital projects to deepen the nation’s ports. While WRDA authorizes capital projects, the budgeting process appropriates annual funding for projects. The President announced his budget for the fiscal year 2011. While it is down from the previous year, consistent with historical experience, this budget is likely to increase. As discussions for next year’s budget are starting early, there is a greater likelihood that a budget will be passed. The Corps is generally better able to bid and manage dredging work in fiscal years where the federal government operates under an approved budget, as opposed to a continuing resolution.
39
Table of Contents
The 2009 bid market was bolstered by the Stimulus. The Company believes that the majority of the work that is augmented by the Stimulus has been awarded and an ample amount of this work will be completed by the dredging industry in 2010.
While the Stimulus supplemented the Corps’ efforts to return our nation’s channels to their stated depths, the Company continues to believe that the long term solution for funding port maintenance involves the Harbor Maintenance Trust Fund (“HMTF”) initiative. Over the last 20 years, the HMTF has collected tax revenue annually that was originally designated to fund harbor maintenance. In recent years the gap between the amount collected under the tax and the amount allocated to harbor maintenance activities has grown significantly as the unallocated funds have been used for general budget purposes. Maintenance dredging in our nation’s ports has been underfunded for several years, leaving many ports at considerably less than their authorized depths. The maritime industry has formed an alliance that is working under the initiative referred to as RAMP, or Realize America’s Maritime Promise, that continues to work toward assuring all future tax receipts collected under the HMTF will be spent on port maintenance projects. Through the efforts of RAMP, Congress has increasingly recognized the need to maintain our ports to enable more efficient movement of shipping traffic, thereby reducing costs and promoting economic growth. The allocation of 100% of the HMTF funds to their intended purpose should ensure our harbors are continually maintained at their authorized depths. The Company believes that a new WRDA bill is likely to be introduced in the first half of 2010 with the HMTF legislation included. Although the Company is hopeful for passage of this bill before the end of this summer, the number of the current legislative priorities in Washington makes the timing uncertain.
The need to deepen U.S. ports, and not just maintain them, is expected to become more important over the next several years as deeper draft cargo ships are being built and the Panama Canal expansion moves forward. This is evidenced by the $350 million deepening project in the Delaware River, the first phase of which was bid last year, and the $600 million deepening project that is planned in Jacksonville, Florida. In the shorter term, the Company anticipates domestic capital projects that include deepening another section of New York harbor, work for the Navy in Norfolk, and other deepening work along the East and Gulf Coasts.
The Supplemental Appropriations Act of 2009 appropriates $400 million for barrier island and ecosystem restoration to rebuild shorelines impacted by historic levels of storm damage along the Mississippi Gulf Coast. The Corps is in the planning stages for this restoration and has indicated that it will start bidding projects in the fourth quarter of 2010.
The administration has indicated a willingness to reverse its previous opposition to funding beach projects, and provided for approximately $30 million of additional beach work than in previous years in the President’s budget. Although details have not been announced, the Company currently expects that as in past years, Congress will again request additional beach funding in its budget and given the administration’s current position, the Company would expect that negotiations will yield a larger federal beach market than in recent years.
Middle East. As global economic conditions improve and oil prices begin to stabilize, the Company believes that its Middle East customers are beginning to feel confident about moving forward with their infrastructure programs. However, these initiatives are not likely to be of the same magnitude as prior plans. The Company is cautiously optimistic about its Middle Eastern opportunities as a number of dredging projects have been announced. If a portion of these projects proceed, given the Company’s reduced presence in the region, the Company expects good employment of its vessels in the region going forward. Nevertheless, the timing of the international market’s recovery remains uncertain.
Demolition. Early in 2010, the demolition segment was awarded over $30 million of new projects, a significant portion of which are in the New York market where it has been gaining a foothold. This is a sizable amount of work to win in a short period of time and may be an early sign of economic recovery in the construction market.
40
Table of Contents
Liquidity and Capital Resources
The Company’s principal sources of liquidity are cash flow generated from operations and borrowings under its senior credit facility (see Note 12, “Long-Term Debt” in the Notes to Consolidated Financial Statements). The Company’s principal uses of cash are to meet debt service requirements, finance its capital expenditures, provide working capital and meet other general corporate purposes.
The Company’s net cash provided by (used in) operating activities for the years ended December 31, 2009, 2008 and 2007 totaled $54.0 million, $14.8 million and $(6.3) million, respectively. Normal increases or decreases in the level of working capital relative to the level of operational activity impact cash flow from operating activities. In 2009, increases in domestic accounts receivable due to an increase in domestic activity were offset by a decrease in pipe and spare parts inventory as well as other working capital items, including a release of working capital in our foreign operations. In 2008, the increase in investment in the Company’s foreign operations was partially offset by favorable billing terms on one domestic project. In 2007, there was a substantial investment in working capital due to expanded foreign dredging operations and demolition activities. Both 2008 and 2007 include significant investments in pipe and spare parts inventory.
The Company’s net cash flows used in investing activities for the years ended December 31, 2009, 2008 and 2007 totaled $24.9 million, $26.3 million and $77.8 million, respectively. Investing activities in 2009 primarily related to normal course upgrades and maintenance of our dredging fleet. In addition, the Company invested $1.2 million in Yankee, an addition to the demolition segment (see Note 20, “Noncontrolling Interest Acquisition” in the Notes to Consolidated Financial Statements). Investing activities in 2008 included $17.7 million of capital expenditures on the dredges Ohio, Reem Island and Noon Island for upgrades and other activities related to placing these vessels into service. Another $5.5 million was spent in 2008 on continuing construction of the power barge that enhanced the operating efficiency of the dredge Florida; $7.2 million was spent on this vessel in 2007. Work on this vessel was completed in October 2008 and the vessel was then sold via a sale leaseback for $16.6 million. An immaterial loss was fully recognized on this transaction. Investing activities in 2007 included significant vessel acquisitions made by the Company. In 2007, the Company purchased the dredge Ohio and attendant plant for $14.0 million and two hopper dredges, the Reem Island and Noon Island, for $26.4 million. Also, the dredge Terrapin Island was purchased for $25.5 million and subsequently refinanced through a sale leaseback arrangement. No gain or loss was recognized on this transaction. In addition, the Company exercised early buy-out options related to the operating leases for the dredges Texas and Pontchartrain and two scows for a total of $14.6 million. Capital spending for items exclusive of the dredge acquisitions, lease buyouts and the construction of the auxiliary vessel for the dredge Florida was $21.8 million.
The Company’s net cash flows provided by (used in) financing activities for the years ended December 31, 2009, 2008 and 2007 totaled ($36.4) million, $13.7 million and $88.6 million, respectively. The Company paid down $30.5 million of revolving credit borrowings in 2009, accounting for most of the use of cash in financing activities. In addition, $4.0 million was paid in dividends. Cash flow in 2008 was primarily generated by $20.0 million of revolver borrowings, offset by repayments of equipment debt and dividends. The higher cash flows in 2007 resulted primarily from the $91.8 million in funds received from the exercise of the Company’s outstanding warrants. Cash flow in 2007 also includes $21.5 million in revolver borrowings for working capital and equipment acquisitions as well as the repayment of $19.7 million in long term debt in connection with the refinancing of the Company’s senior credit facility described below.
On June 12, 2007, the Company entered into a new credit agreement (the “Credit Agreement”) with Bank of America N.A. and various other financial institutions as lenders. The Credit Agreement provides for a revolving credit facility of up to $155.0 million in borrowings and includes sublimits for the issuance of letters of credit and swingline loans. The revolving credit facility matures on June 12, 2012. The revolving credit facility bears interest at rates selected at the option of Great Lakes, currently equal to either LIBOR plus an applicable margin or the “Base Rate” plus an applicable margin. The applicable margins for LIBOR loans and Base Rate loans, as well as any non-use fee, are subject to adjustment based upon the Company’s ratio of Total Funded Debt to Adjusted Consolidated EBITDA (each as defined in the Credit Agreement). The obligations of Great Lakes under the Credit Agreement are unconditionally guaranteed by its direct and indirect domestic subsidiaries. Additionally, the obligations are secured
41
Table of Contents
by a perfected first priority lien on certain equipment of Great Lakes’ subsidiary, Great Lakes Dredge & Dock Company, LLC (“GLDD Company”); a perfected second priority lien on certain other equipment of GLDD Company, subject to a perfected first priority lien in favor of Great Lakes’ bonding company; a perfected first priority lien on the inter-company receivables of Great Lakes and its direct and indirect domestic subsidiaries and having an equal priority to the liens of Great Lakes’ bonding company; and a perfected second priority lien on the accounts receivable of Great Lakes and its direct and indirect subsidiaries that relate to bonded projects. The Credit Agreement contains various covenants and restrictions including (i) limitations on dividends to $5 million per year, (ii) limitations on redemptions and repurchases of capital stock, (iii) limitations on the incurrence of indebtedness, liens, leases and investments, and (iv) maintenance of certain financial covenants.
As of December 31, 2009, the Company had $11.0 million of borrowings and $17.1 million of letters of credit outstanding, resulting in $117.6 million of availability under, the Credit Agreement. In late 2008, Lehman Brothers, a 6.5% participant in the Company’s credit facility, filed for bankruptcy and stopped funding its share of the Company’s revolver borrowings. As Lehman Brothers is a defaulting lender, the Company is no longer able to draw upon Lehman Brothers’ pro-rata portion of the revolver commitment. As of December 31, 2009, the Company had drawn $0.7 million of the $10.0 million applicable to Lehman Brothers. As such, Lehman Brothers’ remaining $9.3 million commitment has not been included in the Company’s availability under the credit facility. However, as the Company has significant capacity on the revolver, this has not presently impacted the Company’s ability to fund working capital needs. Leading positions in the Company’s credit facility are held by Bank of America, Royal Bank of Scotland, GE Capital Corporation and Wells Fargo Bank.
On June 12, 2007, Great Lakes also entered into a fourth amendment to the third amended and restated underwriting and continuing indemnity agreement (the “Fourth Amendment”) with Travelers. The Fourth Amendment provides, among other things, for new equipment collateral securing the obligations under the Company’s bonding agreement and permits the Credit Agreement and related collateral securing the obligations under the Credit Agreement.
In addition to its credit facility, Great Lakes has a $24 million International Letter of Credit Facility with Wells Fargo HSBC Trade Bank. This facility is used for performance and advance payment guarantees on foreign contracts. The obligations under the agreement are guaranteed by the Company’s foreign accounts receivable under Ex-Im Bank’s Working Capital Guarantee Program which covers 90% of the obligations owing under the facility. The Company had $15.7 million of letters of credit issued under this facility at December 31, 2009.
The Company paid dividends of $1 million in each quarter of 2009 and 2008 and in the first quarter of 2010. The declaration and payment of dividends will be at the discretion of the Company’s board of directors and will depend on many factors, including general economic and business conditions, the Company’s strategic plans, its financial results and condition, legal requirements, including restrictions and limitations contained in its senior credit facility and the indenture relating to its senior subordinated debt, and other factors as the Company’s board of directors deems relevant. Accordingly, the Company cannot make any assurances as to the size of any such dividend or that it will pay any such dividend in future quarters.
The Company believes its anticipated cash flows from operations and availability under its revolving credit facility will be sufficient to fund the Company’s operations, capital expenditures and scheduled debt service requirements for the next twelve months.
Beyond the next twelve months, the Company’s ability to fund its working capital needs, planned capital expenditures, scheduled debt payments and dividends if any, and to comply with all of the financial covenants under the Credit Agreement and bonding agreement, depends on its future operating performance and cash flow, which in turn, are subject to prevailing economic conditions and to financial, business and other factors, some of which are beyond the Company’s control.
42
Table of Contents
Contractual Obligations
The following table summarizes the Company’s contractual cash obligations at December 31, 2009. Additional information related to these obligations can be found in Note 12 “Long-Term Debt” and Note 15 “Lease Commitments” to Consolidated Financial Statements.
| Total | Obligations coming due in year(s) ending: | |||||||||||||||||||
| 2010 | 2011- 2013 |
2014- 2016 |
2017 and beyond |
|||||||||||||||||
| (in millions) | ||||||||||||||||||||
| Long term bank debt (1) |
$ | 12.0 | $ | 0.3 | $ | 11.7 | $ | — | $ | — | ||||||||||
| Senior subordinated notes (2) |
229.3 | 13.6 | 215.7 | — | — | |||||||||||||||
| Operating lease commitments |
113.9 | 17.4 | 46.1 | 35.6 | 14.8 | |||||||||||||||
| Equipment notes |
1.4 | 1.2 | 0.2 | — | — | |||||||||||||||
| Total |
$ | 356.6 | $ | 32.5 | $ | 273.7 | $ | 35.6 | $ | 14.8 | ||||||||||
| (1) | Includes cash interest calculated at borrowing rates at December 31, 2009, assuming payments are made in accordance with the agreement terms. |
| (2) | Includes cash interest payments calculated at stated fixed rate of 7.75%. |
Excluded from the above table are $2.8 million in liabilities for uncertain tax positions for which the period of settlement is not determinable.
Other Off-Balance Sheet and Contingent Obligations
The Company had outstanding letters of credit relating to foreign contract guarantees and insurance payment liabilities totaling $32.8 million at December 31, 2009. All issued letters of credit were undrawn at year-end.
The Company has granted liens on a substantial portion of its owned operating equipment as security for borrowings under its Credit Agreement and its bonding agreement. The Company’s Credit Agreement and bonding agreement also contain provisions that require the Company to maintain certain financial ratios and restrict its ability to pay dividends, incur indebtedness, create liens, and take certain other actions.
The Company finances certain key vessels used in its operations with off-balance sheet lease arrangements with unrelated lessors, requiring annual rentals of $17.5 million which decline to $0.8 million over the next ten years. These off-balance sheet leases contain default provisions, which are triggered by an acceleration of debt maturity under the terms of the Company’s Credit Agreement. Additionally, the leases typically contain provisions whereby the Company indemnifies the lessors for the tax treatment attributable to such leases based on the tax rules in place at lease inception. The tax indemnifications do not have a contractual dollar limit. To date, no lessors have asserted any claims against the Company under these tax indemnification provisions.
Performance and bid bonds are customarily required for dredging and marine construction projects, as well as some demolition projects. The Company obtains its performance and bid bonds through its bonding agreement with Travelers, which has been granted a security interest in a substantial portion of the Company’s operating equipment with a net book value of $74.8 million at December 31, 2009. The bonding agreement contains provisions that require the Company to maintain certain financial ratios and that restrict the Company’s ability to pay dividends, incur indebtedness, create liens and take certain other actions. At December 31, 2009, the Company was in compliance with its covenants under the bonding agreement. Bid bonds are generally obtained for a percentage of bid value and amounts outstanding typically range from $1 million to $10 million. At December 31, 2009, the Company had outstanding performance bonds valued at approximately $550.5 million; however, the revenue value remaining in backlog related to these projects totaled approximately $320.0 million.
Certain foreign projects performed by the Company have warranty periods, typically spanning no more than three to five years beyond project completion, whereby the Company retains responsibility to maintain the project site to certain specifications during the warranty period. Generally, any potential liability of the Company is mitigated by insurance, shared responsibilities with consortium partners, and/or recourse to owner-provided specifications.
43
Table of Contents
The Company is a member of an insurance association that provides personal injury coverage for its maritime workforce in excess of self-insurance retention limits. The Company is subject to retroactive premium adjustments based on the association’s claims experience and investment performance. The Company accrues for retroactive premium adjustments when assessed by the insurance association. During the years ended December 31, 2009 and 2008, there were $2.0 million and $2.2 million recorded for retroactive assessments, respectively.
The Company considers it unlikely that it would have to perform under any of the aforementioned contingent obligations, other than operating leases and calls from West of England, the Company’s liability insurance provider, and performance has never been required in any of these circumstances in the past.
44
Table of Contents
NASDI, LLC Management’s Discussion and Analysis of Financial Condition and Results of Operations
Company Overview
NASDI is a demolition service provider headquartered in the Boston, Massachusetts area. NASDI’s principal services consist of interior and exterior demolition of commercial and industrial buildings, salvage and recycling of related materials, and removal of hazardous substances and materials. The majority of NASDI’s work has historically been performed in New England. However, NASDI is currently expanding its footprint, primarily into New York.
A wholly owned subsidiary of GLDD is the owner of 100% of the Class A interests. The holder of the Class A interests also owns 65% of the Class B interests, with the remaining 35% owned by Christopher A. Berardi, an employee of GLDD’s wholly owned subsidiary.
Pursuant to the terms of the NASDI, LLC Limited Liability Company Agreement, the Company has the ability to call Mr. Berardi’s 35% interest upon Mr. Berardi’s termination of employment, upon a change in control related to the Company or any time after December 31, 2010. The call payment is based upon NASDI LLC’s average annual EBITDA for a two year period, as adjusted for the Class A liquidation preference and outstanding indebtedness of NASDI LLC. The call payment is limited, in certain situations, to a maximum of $1.5 million.
Contract Revenues
NASDI recognizes contract revenues under the percentage-of-completion method, based on a cost-to-cost approach for demolition projects. Contract revenues are adjusted to reflect the estimated gross profit percentage. Provisions for estimated losses on contracts in progress are made in the period in which such losses are determined. Claims for additional compensation due to NASDI are not recognized in contract revenues until such claims are settled. Billings on contracts are generally submitted after verification with the customers of physical progress and may not match the timing of revenue recognition. The difference between amounts billed and recognized as revenue is reflected in the balance sheet as either contract revenues in excess of billings or billings in excess of contract revenues. Contract modifications may be negotiated when a change from the original contract specifications is encountered, necessitating a change in project scope or performance methodology and/or material disposal. Significant expenditures incurred incidental to major contracts are deferred and recognized as costs of contracts based on contract performance over the duration of the related project. These expenditures are reported as prepaid expenses.
Costs and Expenses
The components of costs of contract revenues include labor, equipment (including depreciation, maintenance, insurance, and long-term rentals), fuel, subcontracts, rentals, and project overhead. Hourly labor is generally hired on a project-by-project basis. Costs of contract revenues vary significantly depending on the type and location of work performed and assets utilized.
Primary Factors that Determine Operating Profitability
NASDI generates revenues when NASDI is awarded a contract for demolition services and performs the project. NASDI’s revenues increase or decrease based upon market demand. Results of operations for NASDI fluctuate based upon project mix and NASDI’s ability to execute its projects consistent with its estimates.
Results of Operations
The following table sets forth the components of net income (loss) as a percentage of contract revenues for the years ended December 31:
| 2009 | 2008 | 2007 | ||||||||||
| Contract revenues |
100.0 | % | 100.0 | % | 100.0 | % | ||||||
| Costs of contract revenues |
(103.8 | ) | (88.1 | ) | (85.6 | ) | ||||||
| Gross profit (loss) |
(3.8 | ) | 11.9 | 14.4 | ||||||||
| General and administrative expenses |
(13.0 | ) | (7.7 | ) | (8.9 | ) | ||||||
| Amortization of intangible assets |
(0.3 | ) | (0.3 | ) | (0.2 | ) | ||||||
| Operating income (loss) |
(17.1 | ) | 3.9 | 5.3 | ||||||||
| Interest expense, net |
(0.2 | ) | (0.2 | ) | (0.2 | ) | ||||||
| Interest expense to related party |
(0.5 | ) | (0.8 | ) | (3.6 | ) | ||||||
| Income (loss) before income taxes |
(17.8 | ) | 2.9 | 1.5 | ||||||||
| Income tax provision |
— | — | (1.2 | ) | ||||||||
| Net income (loss) |
(17.8 | ) | 2.9 | 0.3 | ||||||||
45
Table of Contents
Year Ended December 31, 2009 Compared to Year Ended December 31, 2008
Revenues were $43.8 million in 2009, a decrease of $58.4 million, or 57.1%, from $102.2 million in 2008. As the construction and real estate development market continued to slow in 2009, new project opportunities were scarce. In addition, a few projects that had been worked on in 2008 were canceled in 2009, resulting in write-offs of $3.4 million related to those projects. Moreover, several large demolition projects were worked on in 2008 and were not replaced in 2009. NASDI recorded negative gross profit margin of 3.8% in 2009 compared to gross profit margin of 11.9% in 2008 as a result of 2009 revenues that were not sufficient to offset fixed costs and the various project write-offs due to cancellations.
In 2009, NASDI produced an operating loss of $7.5 million, compared to operating income of $4.0 million in 2008 due to weaker gross profit performance including write offs related to canceled projects. NASDI general and administrative expenses for 2009 of $5.7 million decreased 27.8% compared with $7.9 million in 2008 primarily as a result of a decrease in incentive pay.
NASDI recorded a net loss of $7.8 million in 2009, compared to net income of $2.9 million in 2008. This was primarily due to the decrease in revenue.
Year Ended December 31, 2008 Compared to Year Ended December 31, 2007
NASDI revenues were $102.2 million, an increase of $26.3 million, or 34.7%, over 2007 revenues of $75.9 million. This increase was due to several large projects which were substantially completed by mid-year. A significant portion of the work on these projects included subcontract work; consequently NASDI’s margins on these projects were not as high as NASDI typically generates. Gross profit of 11.9% in the demolition segment was down from 14.4% in 2007 due to the increase in subcontract work, a decrease in the price for scrap and the adverse impacts of project delays and a customer bankruptcy.
For the year ended December 31, 2008, general and administrative expenses totaled $7.9 million, compared with $6.8 million in 2007, an increase of $1.1 million, or 16.2%, due to payroll cost increases.
In 2008, NASDI operating income was $4.0 million, comparable to 2007 operating income of $4.0 million despite NASDI’s higher 2008 revenues.
Backlog
NASDI’s backlog at December 31, 2009 totaled $16.2 million, a 31% decrease from backlog of $23.5 million at December 31, 2008. This decrease reflects the slowing of the demolition market as a result of the decreased activity in the construction and real estate development markets.
Liquidity and Capital Resources
NASDI’s principal source of liquidity is cash flow from operations; however, in recent periods its principal source of liquidity has been advances from its parent, GLDD or an affiliate of GLDD. GLDD or an affiliate has advanced additional funds to NASDI when its operations are unable to fully meet NASDI’s cash needs. NASDI’s principal uses of cash are to finance its capital expenditures, repay affiliate advances, provide working capital and meet other general corporate purposes.
NASDI’s net cash provided by (used in) operating activities for the years ended December 31, 2009, 2008 and 2007 totaled ($3.7) million, $4.8 million and $3.1 million, respectively. Operational results, as well as normal increases or decreases in the level of working capital relative to the level of operational activity impact cash flow from (or used in) operating activities.
NASDI’s net cash flows used in investing activities for the years ended December 31, 2009, 2008 and 2007 totaled $1.7 million, $1.4 million and $0.7 million, respectively. Investing activities in all periods consisted largely of purchases of new demolition equipment, including excavators and cranes.
NASDI’s net cash flows provided by (used in) financing activities for the years ended December 31, 2009, 2008 and 2007 totaled $5.5 million, ($3.7) million and ($2.4) million, respectively. In 2009, the cash provided related primarily to advances from GLDD. In 2008 and 2007 the amounts related to amounts paid to affiliates and payments of equipment debt.
46
Table of Contents
Contractual Obligations
The following table summarizes NASDI’s contractual cash obligations at December 31, 2009. Additional information related to these obligations can be found in Note 14 “Commitments and contingencies” to NASDI’s Financial Statements.
| Total | Obligations coming due in year(s) ending: |
|||||||||||||||||||
| 2010 | 2011- 2013 |
2014- 2016 |
2017
and beyond |
|||||||||||||||||
| (in millions) | ||||||||||||||||||||
| Related party debt |
$ | 8.1 | $ | — | $ | 8.1 | $ | — | $ | — | ||||||||||
| Interest on related party debt |
0.7 | 0.3 | 0.4 | — | — | |||||||||||||||
| Operating lease commitments |
2.1 | 0.3 | 0.9 | 0.9 | — | |||||||||||||||
| Capital lease obligations |
1.4 | 1.2 | 0.2 | — | — | |||||||||||||||
| Total |
$ | 12.3 | $ | 1.8 | $ | 9.6 | $ | 0.9 | $ | — | ||||||||||
The related party debt represents amounts payable to GLDD or one of its affiliates and is payable on demand; however, GLDD has provided a letter to NASDI indicating that it will not demand repayment prior to January 2, 2012. NASDI has no other contingent obligations.
Off-Balance Sheet Arrangements
NASDI, along with other subsidiaries of GLDD, has guaranteed the repayment of debt and interest under GLDD’s senior bank credit facility and subordinated notes. At December 31, 2009, total senior debt of GLDD was $11.0 and letters of credit outstanding was $17.1 under GLDD’s credit facility. The amount of GLDD’s subordinated notes guaranteed totaled $175.0 at December 31, 2009. The notes mature on December 15, 2013 and accrue interest at the rate of 7.75% annually.
Performance and/or bid bonds are occasionally required for NASDI’s demolition projects. NASDI obtains its performance and bid bonds through GLDD’s bonding agreement with its surety company.
47
Table of Contents
Yankee Environmental Services, LLC Management’s Discussion and Analysis of Financial Condition and Results of Operations
Company Overview
Yankee is a provider of environmental remediation services including asbestos abatement and removal of other hazardous materials in the Boston area. Yankee’s principal services consist of lead paint and asbestos abatement along with demolition services to private and government entities including schools, universities, hospitals and other businesses.
A wholly owned subsidiary of GLDD is the owner of 100% of Yankee’s Class A membership interests. Yankee’s Class B membership interests are held by third parties, one of which is Mr. Christopher A. Berardi, an employee of GLDD’s wholly-owned subsidiary. The holder of the Class A membership interest owns 65% of Yankee’s equity interests and the holders of Yankee’s Class B membership interests own 35% of Yankee’s equity.
The same wholly owned subsidiary also has a 65% interest in NASDI, LLC (“NASDI”), a demolition service provider headquartered in the Boston, Massachusetts area.
Contract Revenues
Yankee recognizes contract revenues under the percentage-of-completion method, based on a cost-to-cost approach for environmental remediation projects. Contract revenues are adjusted to reflect the estimated gross profit percentage. Provisions for estimated losses on contracts in progress are made in the period in which such losses are determined. Claims for additional compensation due to Yankee are not recognized in contract revenues until such claims are settled. Billings on contracts are generally submitted after verification with the customers of physical progress and may not match the timing of revenue recognition. The difference between amounts billed and recognized as revenue is reflected in the balance sheet as either contract revenues in excess of billings or billings in excess of contract revenues. Contract modifications may be negotiated when a change from the original contract specifications is encountered, necessitating a change in project scope or performance methodology and/or material disposal. Significant expenditures incurred incidental to major contracts are deferred and recognized as costs of contracts based on contract performance over the duration of the related project. These expenditures are reported as prepaid expenses.
Costs and Expenses
The components of costs of contract revenues include labor, equipment (including depreciation, maintenance, insurance, and long-term rentals), fuel, rentals, and project overhead. Hourly labor is generally hired on a project-by-project basis. Costs of contract revenues vary significantly depending on the type and location of work performed and assets utilized.
Primary Factors that Determine Operating Profitability
Yankee generates revenues when Yankee is awarded a contract for environmental remediation services and performs the project. Yankee’s revenues increase or decrease based upon market demand. Results of operations for Yankee fluctuate based upon project mix and Yankee’s ability to execute its projects consistent with its estimates.
Results of Operations
The following table sets forth the components of net income (loss) as a percentage of contract revenues for the five years ended December 31, 2009, 2008, 2007, 2006 and 2005:
| 2009 | 2008 | 2007 | 2006 | 2005 | ||||||||||||||||
| Contract revenues |
100.0 | % | 100.0 | % | 100.0 | % | 100.0 | % | 100.0 | % | ||||||||||
| Costs of contract revenues |
(96.3 | ) | (73.0 | ) | (75.2 | ) | (80.0 | ) | (92.1 | ) | ||||||||||
| Gross profit |
3.7 | 27.0 | 24.8 | 20.0 | 7.9 | |||||||||||||||
| General and administrative expenses |
(7.1 | ) | (8.4 | ) | (16.2 | ) | (14.7 | ) | (13.3 | ) | ||||||||||
| Amortization of intangible assets |
(6.2 | ) | — | — | — | — | ||||||||||||||
| Operating income (loss) |
(9.6 | ) | 18.6 | 8.6 | 5.3 | (5.4 | ) | |||||||||||||
| Interest expense, net |
(1.5 | ) | (0.4 | ) | (2.2 | ) | (2.2 | ) | (1.2 | ) | ||||||||||
| Income before income taxes |
(11.1 | ) | 18.2 | 6.4 | 3.1 | (6.6 | ) | |||||||||||||
| Income tax provision |
— | — | — | — | — | |||||||||||||||
| Net income (loss) |
(11.1 | )% | 18.2 | % | 6.4 | % | 3.1 | % | (6.6 | )% | ||||||||||
48
Table of Contents
Year Ended December 31, 2009 Compared to Year Ended December 31, 2008
Revenues were $7.8 million in 2009, a decrease of $6.4 million, or 45.1%, from $14.2 million in 2008. As the construction and real estate development market continued to slow in 2009, new project opportunities were scarce. In addition, Yankee’s largest customer, NASDI, was encountering similar issues and subcontracting less to Yankee. Moreover, several large demolition projects were worked on in 2008 and were not replaced in 2009. NASDI accounted for $4.1 million or 53% of Yankee’s total contract revenues in 2009. Contract revenues from NASDI were $13.1 million or 92.2% of total contract revenues in 2008.
As a result of the constricted market and reduced revenue Yankee recorded gross profit margin of 3.7% in 2009 compared to gross profit margin of 27.0% in 2008, The lower level of revenue in 2009 was not sufficient to cover all Yankee’s fixed costs, resulting in the significant decrease in gross profit margin.
In 2009, the Yankee recorded an operating loss of $0.7 million, compared to operating income of $2.6 million in 2008 due to weaker gross profit and the significant decrease in projects. Yankee general and administrative expenses for 2009 of $0.6 million decreased 50% compared with $1.2 million in 2008 primarily as a result of a decrease in payroll and incentive pay.
Yankee recorded a net loss of $0.9 million in 2009, compared to net income of $2.6 million in 2008. This was primarily due to the decrease in revenue at Yankee.
Year Ended December 31, 2008 Compared to Year Ended December 31, 2007
Yankee revenues in 2008 were $14.2 million, an increase of $9.0 million, or 173%, over 2007 revenues of $5.2 million. This increase was due to several large projects that had been worked on for NASDI, who became an affiliate in 2009. In 2008, $13.1 million, or 92.2%, of Yankee’s revenues were from NASDI, which worked on several large projects in 2008 that required the expertise of Yankee. In 2007, $2.3 million, or 44.2%, of Yankee’s revenues were from NASDI. Gross profit of 27% at Yankee in 2008 was up from 24.8% in 2007 due to this increase in work.
For the year ended December 31, 2008, general and administrative expenses totaled $1.2 million, compared with $0.8 million in 2007, an increase of $0.4 million, or 50%, due to payroll cost increases.
In 2008, Yankee operating income was $2.6 million, up significantly from 2007 operating income of $0.3 million due to the large increase in revenue noted above.
Backlog
Yankee’s backlog at December 31, 2009 totaled $0.9 million, a 61% decrease from backlog of $2.3 million at December 31, 2008. This decrease reflects the slowing of the demolition market as a result of the decreased activity in the construction and real estate development markets.
Liquidity and Capital Resources
Prior to 2009, Yankee’s principal source of liquidity was cash flow from operations, and in the future is expected to be as well, however in 2009 its principal source of liquidity has been advances from its parent, GLDD or an affiliate of GLDD. GLDD or an affiliate has advanced additional funds to Yankee when its operations are unable to fully meet Yankee’s cash needs. Yankee’s principal uses of cash are to finance its capital expenditures, provide working capital, repay affiliate advances and meet other general corporate purposes.
Yankee’s net cash provided by (used in) operating activities for the years ended December 31, 2009, 2008 and 2007 totaled ($2.5) million, $1.7 million and $0.4 million, respectively. Operational results, as well as normal increases or decreases in the level of working capital relative to the level of operational activity impact cash flow from (or used in) operating activities.
Yankee’s net cash flows used in investing activities for the years ended December 31, 2009 and 2008 totaled $1.9 million and $0.2 million, respectively. There were no investing activities which effected cash flow in 2007. 2009 activity represents the acquisition of Yankee, Inc. The 2008 purchases were primarily related to vehicles and tools.
Yankee’s net cash flows provided by (used in) financing activities for the years ended December 31, 2009, 2008 and 2007 totaled $4.6 million, ($1.6) million and ($0.3) million, respectively. In 2009, the cash provided related primarily to advances from GLDD, along with contributions to fund the acquisition of Yankee, Inc. In 2008 and 2007, the amounts related to amounts paid to shareholders and payments of debt.
49
Table of Contents
Contractual Obligations
The following table summarizes Yankee’s contractual cash obligations at December 31, 2009. Additional information related to these obligations can be found in Note 12 “Commitments and contingencies” to Yankee’s Financial Statements.
| Total | Obligations coming due in year(s) ending: | |||||||||||||||||||
| 2010 | 2011- 2013 |
2014- 2016 |
2017
and beyond |
|||||||||||||||||
| (in thousands) | ||||||||||||||||||||
| Related party debt |
2,758.0 | 2,758.0 | — | — | — | |||||||||||||||
| Interest on related party debt |
117.2 | 117.2 | — | — | — | |||||||||||||||
| Operating lease commitments |
23.0 | 23.0 | — | — | — | |||||||||||||||
| Total |
$ | 2,898.2 | $ | 2,898.2 | $ | — | $ | — | $ | — | ||||||||||
Yankee has no other contingent obligations.
Off-Balance Sheet Arrangements
Yankee, along with other subsidiaries of GLDD, has guaranteed the repayment of debt and interest under GLDD’s senior bank credit facility and subordinated notes. At December 31, 2009, total senior debt of GLDD was $11.0 and letters of credit outstanding was $17.1 under GLDD’s credit facility. The amount of GLDD’s subordinated notes guaranteed totaled $175.0 at December 31, 2009. The notes mature on December 15, 2013 and accrue interest at the rate of 7.75% annually.
Performance and/or bid bonds are occasionally required for the Yankee’s demolition projects. Yankee obtains its performance and bid bonds through GLDD’s bonding agreement with its surety company.
50
Table of Contents
| Item 7A. | Quantitative and Qualitative Disclosures about Market Risk |
A significant portion of the Company’s current dredging operations are conducted outside of the U.S., primarily in the Middle East. It is the Company’s policy to hedge foreign currency exchange risk on contracts denominated in currencies other than the U.S. dollar, if available. Currently, the majority of the Company’s foreign dredging work is in Bahrain. The currency in Bahrain, the Bahraini Dinar, is linked to the U.S. dollar. Therefore, the Company has not purchased any forward exchange contracts for trading purposes and has none outstanding at December 31, 2009 or 2008.
The Company’s obligations under its Credit Agreement expose its earnings to changes in short-term interest rates since interest rates on this debt are variable. An increase in interest rates of 1% would not have increased interest expense significantly for 2010.
At December 31, 2009 and 2008, the Company had long-term senior subordinated notes outstanding with a recorded book value of $175.0 million. The fair value of these notes, which bear interest at a fixed rate of 7.75%, was $173.3 million at December 31, 2009 based on market prices. Assuming a 10% decrease in interest rates from the rates at December 31, 2009 the fair value of this fixed rate debt would have increased to $179.7 million.
In May 2009, the Company entered into two interest rate swap arrangements, which are effective until December 15, 2012, to swap a notional amount of $50.0 million from a fixed rate of 7.75% to a floating LIBOR-based rate in order to manage the interest rate paid with respect to the Company’s 7.75% senior subordinated notes. The current portion of the fair value asset of the swaps at December 31, 2009 was $1.5 million is recorded in current assets. The long term portion of the fair value liability of the swaps at December 31, 2009 was $1.5 million and is recorded in other long term liabilities. The swap is not accounted for as a hedge; therefore, the changes in fair value are recorded as adjustments to interest expense in each reporting period. Assuming a 10% increase in interest rates at December 31, 2009, the fair value of the long-term liability would decline by $0.2 million.
A significant operating cost for the Company is diesel fuel, which represents approximately 10% of the Company’s costs of contract revenues. The Company uses fuel commodity forward contracts, typically with durations of less than one year, to reduce the impacts of changing fuel prices on operations. The Company does not purchase fuel hedges for trading purposes. Based on the Company’s 2010 projected domestic fuel consumption, a $0.10 increase in the average price per gallon of fuel would increase its fuel expense by less than $0.2 million, after the effect of fuel commodity contracts in place as of December 31, 2009. At December 31, 2009 the Company had outstanding arrangements to hedge the price of a portion of its fuel purchases related to domestic dredging work in backlog, representing approximately 62% of its anticipated domestic fuel requirements for 2010. As of December 31, 2009, there were 6.2 million gallons remaining on these contracts. Under these agreements, the Company will pay fixed prices ranging from $1.48 to $2.07 per gallon. At December 31, 2009, the fair value asset on these contracts was estimated to be $0.9 million, based on quoted market prices and is recorded in accrued expenses. A 10% change in forward fuel prices would result in an immaterial change in the fair value of fuel hedges outstanding at December 31, 2009.
| Item 8. | Financial Statements and Supplementary Data |
The consolidated financial statements (including financial statement schedules listed under Item 15 of this Report) of the Company called for by this Item, together with the Report of Independent Registered Public Accounting Firm dated March 9, 2010 (January 7, 2011 as to Note 21), are set forth on pages 65 to 102 inclusive, of this Report, and are hereby incorporated by reference into this Item. The financial statements of NASDI and Yankee called for by this Item, together with the related Reports of Independent Registered Public Accounting Firm dated January 7, 2011 as to NASDI and dated December 22, 2010 as to Yankee, are set forth on pages F-1 to F-15 and F-16 to F-38, respectively, of this Report, and are hereby incorporated by reference into this Item. Financial statement schedules not included in this Report have been omitted because they are not applicable or because the information called for is shown in the consolidated financial statements or notes thereto.
51
Table of Contents
Quarterly Results of Operations
The following tables set forth our unaudited quarterly results of operations for 2009 and 2008. We have prepared this unaudited information on a basis consistent with the audited consolidated financial statements contained in this report and this unaudited information includes all adjustments, consisting only of normal recurring adjustments that we consider necessary for a fair presentation of our results of operations for the quarters presented. You should read this quarterly financial data along with the Condensed Consolidated Financial Statements and the related notes to those statements included in our Quarterly Reports on Form 10-Q filed with the Commission. The operating results for any quarter are not necessarily indicative of the results for the annual period or any future period.
| Quarter Ended | ||||||||||||||||
| March 31, | June 30, | September 30, | December 31, | |||||||||||||
| Unaudited | ||||||||||||||||
| (in millions except share and per share data) | ||||||||||||||||
| 2009 |
||||||||||||||||
| Contract revenues |
$ | 179.2 | $ | 142.5 | $ | 140.0 | $ | 160.6 | ||||||||
| Costs of contract revenues |
(152.2 | ) | (113.9 | ) | (123.0 | ) | (145.0 | ) | ||||||||
| Gross profit |
27.0 | 28.6 | 17.0 | 15.6 | ||||||||||||
| General and administrative expenses |
(10.4 | ) | (11.6 | ) | (11.8 | ) | (12.2 | ) | ||||||||
| Amortization of intangible assets |
(0.2 | ) | (0.2 | ) | (0.2 | ) | 0.6 | |||||||||
| Operating income |
16.4 | 16.8 | 5.0 | 4.0 | ||||||||||||
| Interest expense, net |
(4.3 | ) | (4.7 | ) | (3.2 | ) | (3.9 | ) | ||||||||
| Equity in earnings (loss) of joint ventures |
(0.6 | ) | — | 0.2 | — | |||||||||||
| Income before income taxes |
11.6 | 12.0 | 2.0 | 0.0 | ||||||||||||
| Income tax provision |
(5.2 | ) | (4.6 | ) | (0.9 | ) | (0.3 | ) | ||||||||
| Net income |
6.4 | 7.4 | 1.1 | (0.3 | ) | |||||||||||
| Net loss attributable to noncontrolling interests |
0.9 | — | 0.5 | 1.3 | ||||||||||||
| Net income attributable to Great Lakes Dredge & Dock Corporation |
$ | 7.3 | $ | 7.4 | $ | 1.6 | $ | 1.0 | ||||||||
| Basic earnings per share |
$ | 0.13 | $ | 0.13 | $ | 0.03 | $ | 0.02 | ||||||||
| Basic weighted average shares |
58,488,394 | 58,499,312 | 58,506,332 | 58,532,394 | ||||||||||||
| Diluted earnings per share |
$ | 0.13 | $ | 0.13 | $ | 0.03 | $ | 0.02 | ||||||||
| Diluted weighted average shares |
58,488,394 | 58,553,842 | 58,688,696 | 58,745,421 | ||||||||||||
| Quarter Ended | ||||||||||||||||
| March 31, | June 30, | September 30, | December 31, | |||||||||||||
| Unaudited | ||||||||||||||||
| (in millions except share and per share data) | ||||||||||||||||
| 2008 |
||||||||||||||||
| Contract revenues |
$ | 135.7 | $ | 145.3 | $ | 142.8 | $ | 163.0 | ||||||||
| Costs of contract revenues |
(123.7 | ) | (123.7 | ) | (125.2 | ) | (144.9 | ) | ||||||||
| Gross profit |
12.0 | 21.6 | 17.6 | 18.1 | ||||||||||||
| General and administrative expenses |
(10.2 | ) | (11.2 | ) | (11.0 | ) | (10.4 | ) | ||||||||
| Amortization of intangible assets |
(0.1 | ) | (0.1 | ) | (0.2 | ) | (0.1 | ) | ||||||||
| Operating income |
1.7 | 10.3 | 6.4 | 7.6 | ||||||||||||
| Interest expense, net |
(3.6 | ) | (4.9 | ) | (4.3 | ) | (4.1 | ) | ||||||||
| Equity in earnings (loss) of joint ventures |
0.1 | 0.1 | 0.1 | (0.3 | ) | |||||||||||
| Income before income taxes |
(1.7 | ) | 5.5 | 2.2 | 3.2 | |||||||||||
| Income tax benefit (provision) |
0.7 | (2.4 | ) | (0.8 | ) | (1.3 | ) | |||||||||
| Net income (loss) |
(1.0 | ) | 3.1 | 1.4 | 1.9 | |||||||||||
| Net (income) attributable to noncontrolling interests |
(0.2 | ) | (0.1 | ) | — | (0.1 | ) | |||||||||
| Net income attributable to Great Lakes Dredge & Dock Corporation |
$ | (1.2 | ) | $ | 3.0 | $ | 1.4 | $ | 1.8 | |||||||
| Basic earnings (loss) per share |
$ | (0.02 | ) | $ | 0.05 | $ | 0.02 | $ | 0.03 | |||||||
| Basic weighted average shares |
58,459,824 | 58,464,444 | 58,472,824 | 58,480,633 | ||||||||||||
| Diluted earnings (loss) per share |
$ | (0.02 | ) | $ | 0.05 | $ | 0.02 | $ | 0.03 | |||||||
| Diluted weighted average shares |
58,459,824 | 58,470,065 | 58,498,950 | 58,482,278 | ||||||||||||
Note: Items may not sum due to rounding.
52
Table of Contents
| Item 9. | Changes in and Disagreements With Accountants on Accounting and Financial Disclosure |
None.
| Item 9A. | Controls and Procedures |
Disclosure Controls and Procedures.
Our management, with the participation of our Chief Executive Officer and Chief Financial Officer, has evaluated the effectiveness of the Company’s disclosure controls and procedures, as required by Rule 13a-15(b) and 15d-15(b) under the Securities Exchange Act of 1934 (the “Exchange Act”) as of December 31, 2009. Our disclosure controls and procedures are designed to reasonably assure that information required to be disclosed by us in reports we file or submit under the Exchange Act is accumulated and communicated to our management, including our Chief Executive Officer and Chief Financial Officer, as appropriate to allow timely decisions regarding disclosure and is recorded, processed, summarized and reported within the time periods specified in the Securities and Exchange Commission’s rules and forms.
Our management, with the participation of the Chief Executive Officer and Chief Financial Officer, believes that our disclosure controls and procedures are effective to provide such reasonable assurance. Our management, including the Chief Executive Officer and Chief Financial Officer, believes that any disclosure controls and procedures or internal controls and procedures, no matter how well conceived and operated, can provide only reasonable, not absolute, assurance that the objectives of the control system are met. Further, the design of a control system must consider the benefits of controls relative to their costs.
Inherent limitations within a control system include the realities that judgments in decision-making can be faulty, and that breakdowns can occur because of simple error or mistake. Additionally, controls can be circumvented by the individual acts of some persons, by collusion of two or more people, or by unauthorized override of the control. The design of any system of controls also is based in part upon certain assumptions about the likelihood of future events, and there can be no assurance that any design will succeed in achieving its stated goals under all potential future conditions. Accordingly, because of the inherent limitations in a cost effective control system, misstatements due to error or fraud may occur and may not be prevented or detected.
Our management has also conducted an assessment of the Company’s internal control over financial reporting as of December 31, 2009 as required by Section 404 of the Sarbanes-Oxley Act. Management’s report on our internal control over financial reporting is included on page 45. The Independent Registered Public Accounting Firm’s report with respect to the effectiveness of our internal control over financial reporting is included on page 46. Management has concluded that internal control over financial reporting is effective as of December 31, 2009.
Changes in Internal Controls.
There have been no changes in our internal controls over financial reporting during the fiscal quarter ended December 31, 2009 that have materially affected, or are reasonably likely to materially affect, our internal controls over financial reporting.
53
Table of Contents
Management’s Annual Report on Internal Control over Financial Reporting
The management of Great Lakes Dredge & Dock Corporation is responsible for establishing and maintaining adequate internal control over financial reporting (as defined in Rules 13a-15(f), and 15d-15(f) under the Securities Exchange Act of 1934). Management has used the framework set forth in the report entitled Internal Control— Integrated Framework published by the COSO of the Treadway Commission to evaluate the effectiveness of the Company’s internal control over financial reporting.
The internal control over financial reporting refers to the process designed by, or under the supervision of, our Chief Executive Officer and Chief Financial Officer, and overseen by our Board of Directors, management and other personnel, to provide reasonable assurance regarding the reliability of financial reporting and the preparation of financial statements for external purposes in accordance with generally accepted accounting principles, and includes those policies and procedures that:
| • | Pertain to the maintenance of records that, in reasonable detail, accurately and fairly reflect the transactions and dispositions of the assets of the Company; |
| • | Provide reasonable assurance that transactions are recorded as necessary to permit preparation of financial statements in accordance with general accepted accounting principles, and that receipts and expenditures of the Company are being made only in accordance with authorizations of management and directors of the Company; and |
| • | Provide reasonable assurance regarding prevention or timely detection of unauthorized acquisition, use or disposition of the Company’s assets that could have a material effect on the financial statements. |
Neither internal control over financial reporting nor disclosure controls and procedures can provide absolute assurance of achieving financial reporting objectives because of their inherent limitations. Internal control over financial reporting and disclosure controls are processes that involve human diligence and compliance, and are subject to lapses in judgment and breakdowns resulting from human failures. Internal control over financial reporting and disclosure controls also can be circumvented by collusion or improper management override. Because of such limitations, there is a risk that material misstatements may not be prevented, detected or reported on a timely basis by internal control over financial reporting or disclosure controls. However, these inherent limitations are known features of the financial reporting process. Therefore, it is possible to design safeguards for these processes that will reduce, although may not eliminate, these risks.
Our independent registered public accounting firm, Deloitte & Touche LLP, who audited Great Lakes’ consolidated financial statements included in this Form 10-K, has issued a report on Great Lakes’ internal control over financial reporting, which is included herein.
Management has concluded that our internal controls over financial reporting and our disclosure controls and procedures were effective as of December 31, 2009.
| /s/ DOUGLAS B. MACKIE |
| Douglas B. Mackie |
| President, Chief Executive Officer and Director |
| /s/ DEBORAH A. WENSEL |
| Deborah A. Wensel |
| Senior Vice President, Chief Financial Officer and Treasurer |
| March 9, 2010 |
54
Table of Contents
REPORT OF INDEPENDENT REGISTERED PUBLIC ACCOUNTING FIRM
To the Board of Directors and Stockholders of
Great Lakes Dredge & Dock Corporation
Oak Brook, Illinois
We have audited the internal control over financial reporting of Great Lakes Dredge & Dock Corporation and subsidiaries (the “Company”) as of December 31, 2009, based on criteria established in Internal Control—Integrated Framework issued by the Committee of Sponsoring Organizations of the Treadway Commission. The Company’s management is responsible for maintaining effective internal control over financial reporting and for its assessment of the effectiveness of internal control over financial reporting, included in the accompanying Management’s Annual Report on Internal Control over Financial Reporting. Our responsibility is to express an opinion on the Company’s internal control over financial reporting based on our audit.
We conducted our audit in accordance with the standards of the Public Company Accounting Oversight Board (United States). Those standards require that we plan and perform the audit to obtain reasonable assurance about whether effective internal control over financial reporting was maintained in all material respects. Our audit included obtaining an understanding of internal control over financial reporting, assessing the risk that a material weakness exists, testing and evaluating the design and operating effectiveness of internal control based on the assessed risk, and performing such other procedures as we considered necessary in the circumstances. We believe that our audit provides a reasonable basis for our opinion.
A company’s internal control over financial reporting is a process designed by, or under the supervision of, the company’s principal executive and principal financial officers, or persons performing similar functions, and effected by the Company’s board of directors, management, and other personnel to provide reasonable assurance regarding the reliability of financial reporting and the preparation of financial statements for external purposes in accordance with generally accepted accounting principles. A company’s internal control over financial reporting includes those policies and procedures that (1) pertain to the maintenance of records that, in reasonable detail, accurately and fairly reflect the transactions and dispositions of the assets of the Company; (2) provide reasonable assurance that transactions are recorded as necessary to permit preparation of financial statements in accordance with generally accepted accounting principles, and that receipts and expenditures of the Company are being made only in accordance with authorizations of management and directors of the Company; and (3) provide reasonable assurance regarding prevention or timely detection of unauthorized acquisition, use, or disposition of the Company’s assets that could have a material effect on the financial statements.
Because of the inherent limitations of internal control over financial reporting, including the possibility of collusion or improper management override of controls, material misstatements due to error or fraud may not be prevented or detected on a timely basis. Also, projections of any evaluation of the effectiveness of the internal control over financial reporting to future periods are subject to the risk that the controls may become inadequate because of changes in conditions, or that the degree of compliance with the policies or procedures may deteriorate.
In our opinion, the Company maintained, in all material respects, effective internal control over financial reporting as of December 31, 2009, based on the criteria established in Internal Control—Integrated Framework issued by the Committee of Sponsoring Organizations of the Treadway Commission.
We have also audited, in accordance with the standards of the Public Company Accounting Oversight Board (United States), the consolidated financial statements and financial statement schedule as of and for the year ended December 31, 2009 of the Company and our report dated March 9, 2010 (January 7, 2011 as to Note 21) expressed an unqualified opinion on those financial statements and financial statement schedule.
/s/ Deloitte & Touche LLP
Chicago, Illinois
March 9, 2010
55
Table of Contents
| Item 9B. | Other Information |
None.
56
Table of Contents
| Item 10. | Directors, Executive Officers and Corporate Governance |
Information regarding our executive officers is incorporated by reference herein from the discussion under Item 1. Business—Executive Officers in this Annual Report on Form 10-K.
Code of Ethics
The Company has adopted a written code of business conduct and ethics that applies to all of its employees, including its principal executive officer, principal financial officer, controller, and persons performing similar functions. The Company’s code of ethics can be found on its website at www.gldd.com. The Company will post on our website any amendments to or waivers of the code of business conduct and ethics for executive officers or directors, in accordance with applicable laws and regulations.
The remaining information called for by this Item 10 is incorporated by reference herein from the discussions under the headings “Election of Directors,” “Board of Directors and Corporate Governance” and “Security Ownership of Certain Beneficial Owners and Management” and “Section 16(a) Beneficial Ownership Reporting Compliance” in the definitive Proxy Statement for the 2010 Annual Meeting of Stockholders.
| Item 11. | Executive Compensation |
The information required by Item 11 of Form 10-K is incorporated by reference herein from the discussions under the headings “Executive Compensation” and “Compensation Discussion and Analysis” and “Board of Directors and Corporate Governance” in the definitive Proxy Statement for the 2010 Annual Meeting of Stockholders.
| Item 12. | Security Ownership of Certain Beneficial Owners and Management Related Stockholder Matters |
The information required by Item 12 of Form 10-K with respect to directors, executive officers and certain beneficial owners is incorporated by reference herein from the discussion under the heading “Security Ownership of Certain Beneficial Owners and Management” and “Change of Control of the Company” in our definitive Proxy Statement for the 2010 Annual Meeting of Stockholders.
| Item 13. | Certain Relationships and Related Transactions, and Director Independence |
The information required by Item 13 of Form 10-K is incorporated by reference herein from the discussions under the headings “Board of Directors and Corporate Governance” and “Change of Control of the Company” and “Certain Relationships and Related Transactions” in the definitive Proxy Statement for the 2010 Annual Meeting of Stockholders.
| Item 14. | Principal Accountant Fees and Services |
The information required by Item 14 of Form 10-K is incorporated by reference herein from the discussion under the heading “Matters Related to Independent Registered Public Accounting Firm” in the definitive Proxy Statement for the 2010 Annual Meeting of Stockholders.
57
Table of Contents
| Item 15. | Exhibits, Financial Statements Schedules |
| (a) | Documents filed as part of this report |
1. Financial Statements
The financial statements listed below are set forth on pages 67 to 101, F-3 to F-15 and F-18 to F-38 inclusive, of this Report and are incorporated by reference in Item 8 of this Report.
2. Financial Statement Schedules
All other schedules, except Schedule II—Valuation and Qualifying Accounts on page 102, are omitted because they are not required or the required information is shown in the financial statements or notes thereto
3. Exhibits
The exhibits required to be filed by Item 601 of Regulation S-K are listed in the “Exhibit Index” which is attached hereto and incorporated by reference herein.
58
Table of Contents
Pursuant to the requirements of Section 13 or 15(d) of the Securities Exchange Act of 1934, the registrant has duly caused this report to be signed on its behalf by the undersigned, thereunto duly authorized.
| GREAT LAKES DREDGE & DOCK CORPORATION | ||
| By: | /s/ BRUCE J. BIEMECK | |
| Bruce J. Biemeck | ||
| President and Chief Financial Officer | ||
| Date: January 7, 2011 | ||
59
Table of Contents
I. EXHIBIT INDEX
| Number |
Document Description | |
| 2.1 | Amended and Restated Agreement and Plan of Merger dated as of December 22, 2003, among Great Lakes Dredge & Dock Corporation, GLDD Acquisitions Corp., GLDD Merger Sub, Inc. and Vectura Holding Company LLC.(1) | |
| 2.2 | Agreement and Plan of Merger by and among GLDD Acquisitions Corp., Aldabra Acquisition Corporation, and certain shareholders of Aldabra Acquisition Corporation and GLDD Acquisitions Corp., dated as of June 20, 2006.(2) | |
| 2.3 | Agreement and Plan of Merger, dated as of August 21, 2006, among Great Lakes Dredge & Dock Holdings Corp., Aldabra Acquisition Corporation, and GLH Merger Sub, L.L.C.(3) | |
| 3.1 | Amended and Restated Certificate of Incorporation of Great Lakes Dredge & Dock Holdings Corp., effective December 26, 2006 (now renamed Great Lakes Dredge & Dock Corporation).(4) | |
| 3.2 | Second Amended and Restated Bylaws of Great Lakes Dredge & Dock Corporation, effective November 6, 2007.(5) | |
| 3.3 | Certificate of Ownership and Merger of Great Lakes Dredge & Dock Corporation with and into Great Lakes Dredge & Dock Holdings Corp.(6) | |
| 4.1 | Indenture, dated as of December 22, 2003, by and among GLDD Merger Sub, Inc. and BNY Midwest Trust Company, as trustee.(1) | |
| 4.2 | Supplemental Indenture, dated as of December 22, 2003, by and among Great Lakes Dredge & Dock Corporation, the guarantors party thereto and BNY Midwest Trust Company, as trustee.(1) | |
| 4.3 | Amendment to Indenture, dated as of January 30, 2004, by and among Great Lakes Dredge & Dock Corporation, and BNY Midwest Trust Company, as trustee.(7) | |
| 4.4 | Supplemental Indenture, dated as of February 27, 2004, by and among Great Lakes Dredge & Dock Corporation, the guarantors party thereto and BNY Midwest Trust Company, as trustee.(7) | |
| 4.5 | Second Supplemental Indenture, dated as of July 12, 2004, by and among Great Lakes Dredge & Dock Corporation, and BNY Midwest Trust Company, as trustee.(8) | |
| 4.6 | Third Supplemental Indenture, dated as of December 2, 2005, by and among Great Lakes Dredge & Dock Corporation, and BNY Midwest Trust Company, as trustee.(9) | |
| 4.7 | Fourth Supplemental Indenture, dated December 26, 2006, by and among Great Lakes Dredge & Dock Holdings Corp. (now known as Great Lakes Dredge & Dock Corporation), Great Lakes Dredge & Dock Corporation, the guarantors named therein and BNY Midwest Trust Company, as Trustee.(6) | |
| 4.8 | Fifth Supplemental Indenture, dated as of January 30, 2009, by and among Great Lakes Dredge & Dock Corporation, the guarantors named therein and the Bank of New York Mellon Trust Company, N.A., as trustee.(10) | |
| 4.9 | Form of 7 3/4% Senior Subordinated Note due 2013.(11) | |
| 4.10 | Form of Guarantee for 7 3/4% Senior Subordinated Note due 2013.(11) | |
| 4.11 | Specimen Common Stock Certificate for Great Lakes Dredge & Dock Corporation.(12) | |
| 10.1 | Credit Agreement, dated as of June 12, 2007, among Great Lakes Dredge & Dock Corporation, the other loan parties from time to time party thereto, the financial institutions from time to time party thereto and LaSalle Bank National Association, as Swing Line Lender, Sole Lead Arranger and Administrative Agent.(13) | |
60
Table of Contents
| Number |
Document Description | |
| 10.2 | Amendment No. 1 to Credit Agreement, dated as of January 30, 2009, among Great Lakes Dredge & Dock Corporation, the other loan parties from time to time party thereto, the financial institutions from time to time party thereto and Bank of America, N.A., as successor by merger to LaSalle Bank National Association, as Swing Line Lender, Sole Lead Arranger, Issuing Lender and Administrative Agent.(10) | |
| 10.3 | Third Amended and Restated Underwriting and Continuing Indemnity Agreement, dated as of December 22, 2003, among Great Lakes Dredge & Dock Corporation, certain of its subsidiaries, Travelers Casualty and Surety Company and Travelers Casualty and Surety Company of America.(1) | |
| 10.4 | First Amendment to Third Amended and Restated Underwriting and Continuing Indemnity Agreement, dated as of September 30, 2004, by and among Great Lakes Dredge & Dock Corporation, certain of its subsidiaries, Travelers Casualty and Surety Company and Travelers Casualty and Surety Company of America.(14) | |
| 10.5 | Second Amendment to Third Amended and Restated Underwriting and Continuing Indemnity Agreement, dated as of November 14, 2005, by and among the Great Lakes Dredge & Dock Corporation, the subsidiaries of Great Lakes Dredge & Dock Company, Travelers Casualty and Surety Company, United Pacific Insurance Company, Reliance National Insurance Company, Reliance Surety Company and Travelers Casualty and Surety Company of America.(15) | |
| 10.6 | Third Amendment to Third Amended and Restated Underwriting and Continuing Indemnity Agreement dated as of September 28, 2006, by and among Great Lakes Dredge & Dock Corporation, certain of its subsidiaries, Travelers Casualty and Surety Company and Travelers Casualty and Surety Company of America.(16) | |
| 10.7 | Fourth Amendment to Third Amended and Restated Underwriting and Continuing Indemnity Agreement dated as of June 12, 2007, by and among Great Lakes Dredge & Dock Corporation, certain of its subsidiaries, Travelers Casualty and Surety Company of America.(13) | |
| 10.8 | Fifth Amendment to Third Amended and Restated Underwriting and Continuing Indemnity Agreement dated as of April 27, 2009, by and among Great Lakes Dredge & Dock Corporation, certain of its subsidiaries, Travelers Casualty and Surety Company of America.(17) | |
| 10.9 | International Letter of Credit Agreement, dated September 29, 2006, by and among Great Lakes Dredge & Dock Corporation and Wells Fargo HSBC Trade Bank.(16) | |
| 10.10 | First Amendment to International Letter of Credit Agreement, dated July 16, 2007, by and among Great Lakes Dredge & Dock Corporation and Wells Fargo HSBC Trade Bank.(18) | |
| 10.11 | Second Amendment to International Letter of Credit Agreement dated September 29, 2009, by and among Great Lakes Dredge & Dock Corporation, Great Lakes Dredge & Dock Company, LLC and Wells Fargo HSBC Trade Bank, NA.(19) | |
| 10.12 | Reaffirmation, Ratification and Assumption Agreement dated December 26, 2006, by and between Great Lakes Dredge & Dock Corporation (formerly named Great Lakes Dredge & Dock Holdings Corp.) and Wells Fargo HSBC Trade Bank, N.A.(6) | |
| 10.13 | Amended and Restated Management Equity Agreement dated December 26, 2006 by and among Aldabra Acquisition Corporation, Great Lakes Dredge & Dock Holdings Corp. and each of the other persons identified on the signature pages thereto.†(6) | |
| 10.14 | Employment Agreement between the Company and Douglas B. Mackie.†(20) | |
| 10.15 | Employment Agreement between the Company and Richard Lowry.†(20) | |
| 10.16 | Employment Agreement between the Company and Deborah A. Wensel.†(20) | |
| 10.17 | Summary of Oral Employment Agreements with Named Executive Officers.†(12) | |
61
Table of Contents
| Number |
Document Description | |
| 10.18 | Great Lakes Dredge & Dock Company, LLC Annual Cash Bonus Plan Amended and Restated Effective January 1, 2009.†(21) | |
| 10.19 | 401(k) Savings Plan.†(22) | |
| 10.20 | 401(k) Lost Benefit Plan.†(12) | |
| 10.21 | Secured Promissory Note dated December 31, 2006 executed by MJC Berry Enterprises, LLC, in favor of North American Site Developers, Inc.(23) | |
| 10.22 | Lease Agreement between North American Site Developers, Inc. and MJC Berry Enterprises, LLC, dated as of December 31, 2006.(23) | |
| 10.23 | Form of Investor Rights Agreement among Aldabra Acquisition Corporation, Great Lakes Dredge & Dock Holdings Corp., Madison Dearborn Capital Partners IV, L.P., certain stockholders of Aldabra Acquisition Corporation and certain stockholders of GLDD Acquisitions Corp.(3) | |
| 10.24 | Asset Purchase Agreement between Bean Meridian L.L.C. and Great Lakes Dredge & Dock Company, LLC dated April 10, 2007.(24) | |
| 10.25 | Asset Purchase Agreement between Bean Dredging L.L.C. and Great Lakes Dredge & Dock Company, LLC dated April 10, 2007.(24) | |
| 10.26 | Purchase Agreement between Weeks-Marine, Inc. and Great Lakes Dredge & Dock Company, LLC dated April 13, 2007.(25) | |
| 10.27 | Purchase Agreement between Dragaport Ltda. and Great Lakes Dredge and Dock Company, LLC dated October 19, 2007.(26) | |
| 10.28 | Limited Liability Company Agreement, dated April 30, 2008, by and among NASDI Holdings Corporation, Christopher A. Berardi and NASDI, LLC.(27) | |
| 10.29 | Employment Agreement, dated as of April 30, 2008, by and between NADSI Holdings Corporation and Christopher A. Berardi.†(27) | |
| 10.30 | Great Lakes Dredge & Dock Corporation 2007 Long-Term Incentive Plan.†(28) | |
| 10.31 | Form of Great Lakes Dredge & Dock Corporation Non-Qualified Stock Option Agreement pursuant to the Great Lakes Dredge & Dock Corporation 2007 Long-Term Incentive Plan.†(29) | |
| 10.32 | Form of Great Lakes Dredge & Dock Corporation Restricted Stock Unit Award Agreement pursuant to the Great Lakes Dredge & Dock Corporation 2007 Long-Term Incentive Plan.†(29) | |
| 12.1 | Ratio of Earnings to Fixed Charges.* | |
| 14.1 | Code of Business Conduct and Ethics.(30) | |
| 21.1 | Subsidiaries of Great Lakes Dredge & Dock Corporation.* | |
| 23.1 | Consent of Deloitte & Touche LLP.* | |
| 23.2 | Consent of Deloitte & Touche LLP.* | |
| 23.3 | Consent of J.H. Cohn LLP.* | |
| 31.1 | Certification Pursuant to Rules 13a-14 and 15d-14 under the Securities Exchange Act of 1934, as Adopted Pursuant to Section 302 of the Sarbanes-Oxley Act of 2002.* | |
| 31.2 | Certification Pursuant to Rules 13a-14 and 15d-14 under the Securities Exchange Act of 1934, as Adopted Pursuant to Section 302 of the Sarbanes-Oxley Act of 2002.* | |
| 32.1 | Certification Pursuant to 18 U.S.C. Section 1350, as Adopted Pursuant to Section 906 of the Sarbanes-Oxley Act of 2002.* | |
| 32.2 | Certification Pursuant to 18 U.S.C. Section 1350, as Adopted Pursuant to Section 906 of the Sarbanes-Oxley Act of 2002.* | |
62
Table of Contents
| (1) | Incorporated by reference to Great Lakes Dredge & Dock Corporation’s Current Report on Form 8-K filed with the Commission on January 6, 2004 (Commission file no. 333-64687). |
| (2) | Incorporated by reference to Great Lakes Dredge & Dock Corporation’s Current Report on Form 8-K filed with the Commission on June 22, 2006 (Commission file no. 333-64687). |
| (3) | Incorporated by reference to Great Lakes Dredge & Dock Holding Corp.’s Registration Statement on Form S-4 filed with the Commission on August 24, 2006 (Commission file no. 333-136861-01). |
| (4) | Incorporated by reference to Great Lakes Dredge & Dock Corporation’s Registration Statement on Form 8-A filed with the Commission on December 26, 2006 (Commission file no. 001-33225). |
| (5) | Incorporated by reference to Great Lakes Dredge & Dock Corporation’s Current Report on Form 8-K filed with the Commission on November 13, 2007 (Commission file no. 001-33225). |
| (6) | Incorporated by reference to Great Lakes Dredge & Dock Corporation’s Current Report on Form 8-K filed with the Commission on December 29, 2006 (Commission file no. 001-33225). |
| (7) | Incorporated by reference to Great Lakes Dredge & Dock Corporation’s Registration Statement on Form S-4 filed with the Commission on March 31, 2004 (Commission file no. 333-114059-06). |
| (8) | Incorporated by reference to Great Lakes Dredge & Dock Corporation’s Quarterly Report on Form 10-Q filed with the Commission on May 12, 2005 (Commission file no. 333-64687). |
| (9) | Incorporated by reference to Great Lakes Dredge & Dock Corporation’s Current Report on Form 8-K filed with the Commission on December 8, 2005 (Commission file no. 333-64687). |
| (10) | Incorporated by reference to Great Lakes Dredge & Dock Corporation’s Current Report on Form 8-K filed with the Commission on February 5, 2009 (Commission file no. 001-33225). |
| (11) | Included as part of Exhibit 4.1 to this Annual Report on Form 10-K. |
| (12) | Incorporated by reference to Great Lakes Dredge & Dock Corporation’s Annual Report on Form 10-K filed with the Commission on March 22, 2007 (Commission file no. 001-33225). |
| (13) | Incorporated by reference to Great Lakes Dredge & Dock Corporation’s Current Report on Form 8-K filed with the Commission on June 15, 2007 (Commission file no. 001-33225). |
| (14) | Incorporated by reference to Great Lakes Dredge & Dock Corporation’s Current Report on Form 8-K filed with the Commission on October 5, 2004. (Commission file no. 333-64687). |
| (15) | Incorporated by reference to Great Lakes Dredge & Dock Corporation’s Current Report on Form 8-K filed with the Commission on November 17, 2005 (Commission file no. 333-64687). |
| (16) | Incorporated by reference to Great Lakes Dredge & Dock Corporation’s Current Report on Form 8-K filed with the Commission on October 4, 2006 (Commission file no. 333-64687). |
| (17) | Incorporated by reference to Great Lakes Dredge & Dock Corporation’s Current Report on Form 8-K filed with the Commission on April 29, 2009 (Commission file no. 001-33225). |
| (18) | Incorporated by reference to Great Lakes Dredge & Dock Corporation’s Current Report on Form 8-K filed with the Commission on July 20, 2007 (Commission file no. 001-33225). |
| (19) | Incorporated by reference to Great Lakes Dredge & Dock Corporation’s Current Report on Form 8-K filed with the Commission on October 5, 2009 (Commission file no. 001-33225). |
63
Table of Contents
| (20) | Incorporated by reference to Great Lakes Dredge & Dock Corporation’s Current Report on Form 8-K filed with the Commission on July 9, 2007 (Commission file no. 001-33225). |
| (21) | Incorporated by reference to Great Lakes Dredge & Dock Corporation’s Current Report on Form 8-K filed with the Commission on May 18, 2009 (Commission file no. 001-33225). |
| (22) | Incorporated by reference to Great Lakes Dredge & Dock Corporation’s Annual Report on Form 10-K filed with the Commission on March 30, 2005 (Commission file no. 333-64687). |
| (23) | Incorporated by reference to Great Lakes Dredge & Dock Corporation’s Current Report on Form 8-K filed with the Commission on February 20, 2007 (Commission file no. 001-33225). |
| (24) | Incorporated by reference to Great Lakes Dredge & Dock Corporation’s Current Report on Form 8-K filed with the Commission on April 10, 2007 (Commission file no. 001-33225). |
| (25) | Incorporated by reference to Great Lakes Dredge & Dock Corporation’s Current Report on Form 8-K filed with the Commission on April 16, 2007 (Commission file no. 001-33225) |
| (26) | Incorporated by reference to Great Lakes Dredge & Dock Corporation’s Current Report on Form 8-K filed with the Commission on October 24, 2007 (Commission file no. 001-33225). |
| (27) | Incorporated by reference to Great Lakes Dredge & Dock Corporation’s Current Report on Form 8-K filed with the Commission on May 6, 2008 (Commission file no. 001-33225). |
| (28) | Incorporated by reference to Great Lakes Dredge & Dock Corporation’s Registration Statement on Form S-8 filed with the Commission on April 3, 2008 (Commission file no. 333-150067). |
| (29) | Incorporated by reference to Great Lakes Dredge & Dock Corporation’s Current Report on Form 8-K filed with the Commission on May 22, 2008 (Commission file no. 001-33225). |
| (30) | Incorporated by reference to Great Lakes Dredge & Dock Corporation’s Current Report on Form 8-K filed with the Commission on October 24, 2005 (Commission file no. 333-64687). |
| * | Filed herewith |
| † | Compensatory plan or arrangement. |
64
Table of Contents
GREAT LAKES DREDGE & DOCK CORPORATION AND SUBSIDIARIES
| Page | ||||
| 66 | ||||
| CONSOLIDATED FINANCIAL STATEMENTS AS OF DECEMBER 31, 2009 AND 2008, AND FOR THE YEARS ENDED DECEMBER 31, 2009, 2008 AND 2007 |
||||
| 67 | ||||
| 68 | ||||
| 69 | ||||
| 70 | ||||
| 71-101 | ||||
65
Table of Contents
REPORT OF INDEPENDENT REGISTERED PUBLIC ACCOUNTING FIRM
To the Board of Directors and Stockholders of
Great Lakes Dredge & Dock Corporation
Oak Brook, Illinois
We have audited the accompanying consolidated balance sheets of Great Lakes Dredge & Dock Corporation and subsidiaries (the “Company”) as of December 31, 2009 and 2008, and the related consolidated statements of operations, equity, and cash flows for each of the three years in the period ended December 31, 2009. Our audits also included the financial statement schedule listed in the Index at Item 15. These financial statements and financial statement schedule are the responsibility of the Company’s management. Our responsibility is to express an opinion on the financial statements and financial statement schedule based on our audits.
We conducted our audits in accordance with the standards of the Public Company Accounting Oversight Board (United States). Those standards require that we plan and perform the audit to obtain reasonable assurance about whether the financial statements are free of material misstatement. An audit includes examining, on a test basis, evidence supporting the amounts and disclosures in the financial statements. An audit also includes assessing the accounting principles used and significant estimates made by management, as well as evaluating the overall financial statement presentation. We believe that our audits provide a reasonable basis for our opinion.
In our opinion, such consolidated financial statements present fairly, in all material respects, the financial position of Great Lakes Dredge & Dock Corporation and subsidiaries as of December 31, 2009 and 2008, and the results of their operations and their cash flows for each of the three years in the period ended December 31, 2009, in conformity with accounting principles generally accepted in the United States of America. Also, in our opinion, such financial statement schedule, when considered in relation to the basic consolidated financial statements taken as a whole, presents fairly, in all material respects, the information set forth therein.
We have also audited, in accordance with the standards of the Public Company Accounting Oversight Board (United States), the Company’s internal control over financial reporting as of December 31, 2009, based on the criteria established in Internal Control—Integrated Framework issued by the Committee of Sponsoring Organizations of the Treadway Commission and our report dated March 9, 2010 expressed an unqualified opinion on the Company’s internal control over financial reporting.
| /s/ Deloitte & Touche LLP |
| Chicago, Illinois |
| March 9, 2010 (January 7, 2011 as to Note 21) |
66
Table of Contents
GREAT LAKES DREDGE & DOCK CORPORATION AND SUBSIDIARIES
CONSOLIDATED BALANCE SHEETS
AS OF DECEMBER 31, 2009 AND 2008
(In thousands, except share and per share amounts)
| 2009 | 2008 | |||||||
| ASSETS |
||||||||
| CURRENT ASSETS: |
||||||||
| Cash and cash equivalents |
$ | 3,250 | $ | 10,478 | ||||
| Accounts receivable—net |
153,901 | 120,620 | ||||||
| Contract revenues in excess of billings |
28,004 | 30,916 | ||||||
| Inventories |
29,192 | 28,666 | ||||||
| Prepaid expenses |
2,644 | 4,684 | ||||||
| Other current assets |
15,445 | 20,994 | ||||||
| Total current assets |
232,436 | 216,358 | ||||||
| PROPERTY AND EQUIPMENT—Net |
291,157 | 296,885 | ||||||
| GOODWILL |
98,049 | 97,799 | ||||||
| OTHER INTANGIBLE ASSETS—Net |
1,037 | 931 | ||||||
| INVENTORIES—Noncurrent |
27,662 | 38,024 | ||||||
| INVESTMENTS IN JOINT VENTURES |
7,943 | 8,949 | ||||||
| OTHER |
7,142 | 7,209 | ||||||
| TOTAL |
$ | 665,426 | $ | 666,155 | ||||
| LIABILITIES AND EQUITY |
||||||||
| CURRENT LIABILITIES: |
||||||||
| Accounts payable |
$ | 83,783 | $ | 76,862 | ||||
| Accrued expenses |
31,265 | 30,442 | ||||||
| Billings in excess of contract revenues |
24,901 | 19,782 | ||||||
| Current portion of equipment debt |
1,200 | 1,553 | ||||||
| Total current liabilities |
141,149 | 128,639 | ||||||
| REVOLVING CREDIT FACILITY |
11,000 | 41,500 | ||||||
| 7.75% SENIOR SUBORDINATED NOTES |
175,000 | 175,000 | ||||||
| DEFERRED INCOME TAXES |
81,642 | 81,004 | ||||||
| OTHER |
12,086 | 11,899 | ||||||
| Total liabilities |
420,877 | 438,042 | ||||||
| COMMITMENTS AND CONTINGENCIES (Note 19) |
||||||||
| EQUITY |
||||||||
| Common stock—$0.0001 par value; authorized, 90,000,000 shares; issued and outstanding, 58,542,038 shares and 58,484,242 shares at December 31, 2009 and 2008, respectively |
6 | 6 | ||||||
| Additional paid-in capital |
263,579 | 262,501 | ||||||
| Accumulated deficit |
(18,336 | ) | (31,812 | ) | ||||
| Accumulated other comprehensive income (loss) |
539 | (3,415 | ) | |||||
| Total Great Lakes Dredge & Dock Corporation Stockholders’ Equity |
245,788 | 227,280 | ||||||
| NONCONTROLLING INTERESTS |
(1,239 | ) | 833 | |||||
| Total equity |
244,549 | 228,113 | ||||||
| TOTAL |
$ | 665,426 | $ | 666,155 | ||||
See notes to the consolidated financial statements.
67
Table of Contents
GREAT LAKES DREDGE & DOCK CORPORATION AND SUBSIDIARIES
CONSOLIDATED STATEMENTS OF OPERATIONS
FOR THE YEARS ENDED DECEMBER 31, 2009, 2008 AND 2007
(In thousands, except per share amounts)
| 2009 | 2008 | 2007 | ||||||||||
| CONTRACT REVENUES |
$ | 622,244 | $ | 586,879 | $ | 515,761 | ||||||
| COSTS OF CONTRACT REVENUES |
534,000 | 517,576 | 447,814 | |||||||||
| GROSS PROFIT |
88,244 | 69,303 | 67,947 | |||||||||
| OPERATING EXPENSES: |
||||||||||||
| General and administrative expenses |
45,220 | 42,766 | 38,705 | |||||||||
| Amortization of intangible assets |
773 | 440 | 262 | |||||||||
| Total operating income |
42,251 | 26,097 | 28,980 | |||||||||
| OTHER INCOME (EXPENSE): |
||||||||||||
| Interest expense—net |
(16,150 | ) | (16,971 | ) | (17,462 | ) | ||||||
| Equity in earnings (loss) of joint ventures |
(384 | ) | (15 | ) | 1,993 | |||||||
| Total other expense |
(16,534 | ) | (16,986 | ) | (15,469 | ) | ||||||
| INCOME BEFORE INCOME TAXES |
25,717 | 9,111 | 13,511 | |||||||||
| INCOME TAX PROVISION |
(10,983 | ) | (3,839 | ) | (6,399 | ) | ||||||
| NET INCOME |
14,734 | 5,272 | 7,112 | |||||||||
| Net (income) loss attributable to noncontrolling interests |
2,734 | (293 | ) | (56 | ) | |||||||
| NET INCOME AVAILABLE TO COMMON STOCKHOLDERS OF GREAT LAKES DREDGE & DOCK CORPORATION |
$ | 17,468 | $ | 4,979 | $ | 7,056 | ||||||
| Basic earnings per share attributable to Great Lakes Dredge & Dock Corporation |
$ | 0.30 | $ | 0.09 | $ | 0.14 | ||||||
| Basic weighted-average shares |
58,507 | 58,469 | 48,911 | |||||||||
| Diluted earnings per share attributable to Great Lakes Dredge & Dock Corporation |
$ | 0.30 | $ | 0.09 | $ | 0.14 | ||||||
| Diluted weighted-average shares |
58,612 | 58,478 | 52,221 | |||||||||
See notes to the consolidated financial statements.
68
Table of Contents
GREAT LAKES DREDGE & DOCK CORPORATION AND SUBSIDIARIES
CONSOLIDATED STATEMENTS OF EQUITY
FOR THE YEARS ENDED DECEMBER 31, 2009, 2008 AND 2007
(In thousands, except share and per share amounts)
| Shares of Common Stock |
Common Stock |
Additional Paid-In Capital |
Accumulated Deficit |
Accumulated Other Comprehensive Income (Loss) |
Noncontrolling Interests |
Total | ||||||||||||||||||||||
| BALANCE—January 1, 2007 |
39,985,678 | $ | 4 | $ | 168,830 | $ | (39,030 | ) | $ | (1,282 | ) | $ | 2,005 | $ | 130,527 | |||||||||||||
| Common shares issued |
120,511 | |||||||||||||||||||||||||||
| Common shares issued from exercise of outstanding warrants |
18,353,635 | 2 | 91,767 | — | — | — | 91,769 | |||||||||||||||||||||
| Correction to recapitalization expenses |
— | — | 72 | — | — | — | 72 | |||||||||||||||||||||
| Adoption of FIN 48 |
— | — | — | 158 | — | — | 158 | |||||||||||||||||||||
| Dividends declared and paid |
— | — | — | (994 | ) | — | — | (994 | ) | |||||||||||||||||||
| Comprehensive income: |
||||||||||||||||||||||||||||
| Net income |
— | — | — | 7,056 | — | 56 | 7,112 | |||||||||||||||||||||
| Reclassification of derivative gains (loss) to earnings (net of tax of $43) |
— | — | — | — | (67 | ) | — | (67 | ) | |||||||||||||||||||
| Change in fair value of derivatives (net of tax of $1,180) |
— | — | — | — | 1,819 | — | 1,819 | |||||||||||||||||||||
| Total comprehensive income |
56 | 8,864 | ||||||||||||||||||||||||||
| BALANCE—December 31, 2007 |
58,459,824 | 6 | 260,669 | (32,810 | ) | 470 | 2,061 | 230,396 | ||||||||||||||||||||
| Acquisition of NASDI Noncontrolling Interest |
— | — | 1,373 | — | — | (1,521 | ) | (148 | ) | |||||||||||||||||||
| Repurchase of shares |
(3,622 | ) | — | (6 | ) | — | — | — | (6 | ) | ||||||||||||||||||
| Share-based compensation |
28,040 | — | 465 | — | — | — | 465 | |||||||||||||||||||||
| Dividends declared and paid |
— | — | — | (3,981 | ) | — | — | (3,981 | ) | |||||||||||||||||||
| Comprehensive income (loss): |
||||||||||||||||||||||||||||
| Net income |
— | — | — | 4,979 | — | 293 | 5,272 | |||||||||||||||||||||
| Reclassification of derivative gains to earnings (net of tax of $145) |
— | — | — | — | 218 | — | 218 | |||||||||||||||||||||
| Change in fair value of derivatives (net of tax of $2,720) |
— | — | — | — | (4,103 | ) | — | (4,103 | ) | |||||||||||||||||||
| Total comprehensive income |
293 | 1,387 | ||||||||||||||||||||||||||
| BALANCE—December 31, 2008 |
58,484,242 | 6 | 262,501 | (31,812 | ) | (3,415 | ) | 833 | 228,113 | |||||||||||||||||||
| Acquisition of Yankee Environmental Services |
— | — | — | — | — | 662 | 662 | |||||||||||||||||||||
| Share-based compensation |
57,796 | — | 1,078 | — | — | — | 1,078 | |||||||||||||||||||||
| Dividends declared and paid |
— | — | — | (3,992 | ) | — | — | (3,992 | ) | |||||||||||||||||||
| Comprehensive income (loss): |
||||||||||||||||||||||||||||
| Net income (loss) |
— | — | — | 17,468 | — | (2,734 | ) | 14,734 | ||||||||||||||||||||
| Reclassification of derivative gains to earnings (net of tax of $2,101) |
— | — | — | — | 3,164 | — | 3,164 | |||||||||||||||||||||
| Change in fair value of derivatives (net of tax of $524) |
— | — | — | — | 790 | — | 790 | |||||||||||||||||||||
| Total comprehensive income |
(2,734 | ) | 18,688 | |||||||||||||||||||||||||
| BALANCE—December 31, 2009 |
58,542,038 | $ | 6 | $ | 263,579 | $ | (18,336 | ) | $ | 539 | $ | (1,239 | ) | $ | 244,549 | |||||||||||||
See notes to the consolidated financial statements.
69
Table of Contents
GREAT LAKES DREDGE & DOCK CORPORATION AND SUBSIDIARIES
CONSOLIDATED STATEMENTS OF CASH FLOWS
FOR THE YEARS ENDED DECEMBER 31, 2009, 2008 AND 2007
(In thousands)
| 2009 | 2008 | 2007 | ||||||||||
| OPERATING ACTIVITIES: |
||||||||||||
| Net income |
14,734 | 5,272 | 7,112 | |||||||||
| Adjustments to reconcile net income to net cash flows provided by (used in) operating activities: |
||||||||||||
| Depreciation and amortization |
33,023 | 30,124 | 26,537 | |||||||||
| Equity in earnings (loss) of joint ventures |
384 | 15 | (1,993 | ) | ||||||||
| Distribution from equity joint ventures |
621 | 625 | 2,400 | |||||||||
| Deferred income taxes |
1,401 | 1,596 | (918 | ) | ||||||||
| Gain on dispositions of property and equipment |
(651 | ) | (553 | ) | (440 | ) | ||||||
| Amortization of deferred financing fees |
1,677 | 1,892 | 2,670 | |||||||||
| Share-based compensation expense |
1,078 | 465 | — | |||||||||
| Changes in assets and liabilities: |
||||||||||||
| Accounts receivable |
(33,281 | ) | (4,911 | ) | (26,204 | ) | ||||||
| Contract revenues in excess of billings |
2,925 | (17,088 | ) | (4,267 | ) | |||||||
| Inventories |
9,836 | (16,218 | ) | (14,038 | ) | |||||||
| Prepaid expenses and other current assets |
3,529 | (986 | ) | (544 | ) | |||||||
| Accounts payable and accrued expenses |
12,591 | (2,068 | ) | 17,434 | ||||||||
| Billings in excess of contract revenues |
5,119 | 14,345 | (13,758 | ) | ||||||||
| Other noncurrent assets and liabilities |
1,012 | 2,295 | (275 | ) | ||||||||
| Net cash flows provided by (used in) operating activities |
53,998 | 14,805 | (6,284 | ) | ||||||||
| INVESTING ACTIVITIES: |
||||||||||||
| Purchases of property and equipment |
(24,666 | ) | (44,484 | ) | (110,988 | ) | ||||||
| Dispositions of property and equipment |
1,028 | 17,445 | 28,599 | |||||||||
| Acquisition of controlling interest in Yankee Environmental Services |
(1,229 | ) | — | — | ||||||||
| Changes in restricted cash |
— | 787 | 2,923 | |||||||||
| Purchase of noncontrolling interest |
— | (5 | ) | — | ||||||||
| Loan to related party |
— | — | 1,703 | |||||||||
| Net cash flows used in investing activities |
(24,867 | ) | (26,257 | ) | (77,763 | ) | ||||||
| FINANCING ACTIVITIES: |
||||||||||||
| Borrowings under revolving loans |
158,877 | 222,443 | 184,500 | |||||||||
| Repayments of revolving loans |
(189,377 | ) | (202,443 | ) | (163,000 | ) | ||||||
| Dividends paid |
(3,992 | ) | (3,981 | ) | (994 | ) | ||||||
| Repayments of long-term debt |
(1,774 | ) | (2,148 | ) | (19,685 | ) | ||||||
| Repayment of capital lease debt |
(93 | ) | (174 | ) | (1,843 | ) | ||||||
| Repurchase of preferred and common shares |
— | (6 | ) | — | ||||||||
| Issuance of common shares |
— | — | 91,769 | |||||||||
| Deferred financing fees |
— | — | (2,101 | ) | ||||||||
| Net cash flows provided by (used in) financing activities |
(36,359 | ) | 13,691 | 88,646 | ||||||||
| NET CHANGE IN CASH AND CASH EQUIVALENTS |
(7,228 | ) | 2,239 | 4,599 | ||||||||
| CASH AND CASH EQUIVALENTS—Beginning of year |
10,478 | 8,239 | 3,640 | |||||||||
| CASH AND CASH EQUIVALENTS—End of year |
$ | 3,250 | $ | 10,478 | $ | 8,239 | ||||||
| SUPPLEMENTAL DISCLOSURES OF CASH FLOW INFORMATION: |
||||||||||||
| Cash paid for interest |
$ | 14,764 | $ | 15,357 | $ | 15,959 | ||||||
| Cash paid for taxes |
$ | 8,677 | $ | 4,695 | $ | 6,730 | ||||||
| NONCASH INVESTING ACTIVITY |
||||||||||||
| Property and equipment purchased but not yet paid |
$ | 4,187 | $ | 3,187 | $ | 3,078 | ||||||
| Property and equipment purchased on equipment notes |
$ | 615 | $ | 2,213 | $ | 1,803 | ||||||
See notes to the consolidated financial statements.
70
Table of Contents
GREAT LAKES DREDGE & DOCK CORPORATION AND SUBSIDIARIES
NOTES TO CONSOLIDATED FINANCIAL STATEMENTS
AS OF DECEMBER 31, 2009 AND 2008 AND FOR THE
YEARS ENDED DECEMBER 31, 2009, 2008 AND 2007
(In thousands, except share and per share amounts)
1. NATURE OF BUSINESS AND SUMMARY OF SIGNIFICANT ACCOUNTING POLICIES
Organization—Great Lakes Dredge & Dock Corporation and its subsidiaries (the “Company” or “Great Lakes”) are in the business of marine construction, primarily dredging, and commercial and industrial demolition. The Company’s primary dredging customers are domestic and foreign government agencies, as well as private entities, and its primary demolition customers are general contractors, corporations that commission projects, nonprofit institutions such as universities and hospitals, and local government and municipal agencies.
Principles of Consolidation and Basis of Presentation—The consolidated financial statements include the accounts of Great Lakes Dredge & Dock Corporation and its majority-owned subsidiaries. All intercompany accounts and transactions are eliminated in consolidation. The equity method of accounting is used for investments in unconsolidated investees in which the Company has significant influence, but not control. Other investments, if any, are carried at cost.
Use of Estimates—The preparation of financial statements in conformity with accounting principles generally accepted in the United States of America (“GAAP”) requires management to make estimates and assumptions that affect certain reported amounts and disclosures. Accordingly, actual results could differ from those estimates.
Revenue and Cost Recognition on Contracts—Substantially all of the Company’s contracts for dredging services are fixed-price contracts, which provide for remeasurement based on actual quantities dredged. The majority of the Company’s demolition contracts are also fixed-price contracts, with others managed as time-and-materials. Contract revenues are recognized under the percentage-of-completion method, based on the Company’s engineering estimates of the physical percentage completed for dredging projects and using a cost-to-cost approach for demolition projects. For dredging projects, costs of contract revenues are adjusted to reflect the gross profit percentage expected to be achieved upon ultimate completion. For demolition contracts, contract revenues are adjusted to reflect the estimated gross profit percentage. Provisions for estimated losses on contracts in progress are made in the period in which such losses are determined. Claims for additional compensation due to the Company are not recognized in contract revenues until such claims are settled. Billings on contracts are generally submitted after verification with the customers of physical progress and may not match the timing of revenue recognition. The difference between amounts billed and recognized as revenue is reflected in the balance sheet as either contract revenues in excess of billings or billings in excess of contract revenues. Modifications may be negotiated when a change from the original contract specification is encountered, and a change in project scope, performance methodology and/or material disposal is necessary. Thus, the resulting modification is considered a change in the scope of the original project to which it relates. Significant expenditures incurred incidental to major contracts are deferred and recognized as contract costs based on contract performance over the duration of the related project. These expenditures are reported as prepaid expenses.
The components of costs of contract revenues include labor, equipment (including depreciation, maintenance, insurance and long-term rentals), subcontracts, fuel and project overhead. Hourly labor is generally hired on a project-by-project basis. Costs of contract revenues vary significantly depending on the type and location of work performed and assets utilized. Generally, capital projects have the highest margins due to the complexity of the projects, while beach nourishment projects have the most volatile margins because they are most often exposed to variability in weather conditions.
71
Table of Contents
1. NATURE OF BUSINESS AND SUMMARY OF SIGNIFICANT ACCOUNTING POLICIES (Continued)
The Company’s cost structure includes significant annual equipment-related costs, including depreciation, maintenance, insurance and long-term rentals. These costs have averaged approximately 22% to 25% of total costs of contract revenues over the last three years. During the year, both equipment utilization and the timing of fixed cost expenditures fluctuate significantly. Accordingly, the Company allocates these fixed equipment costs to interim periods in proportion to revenues recognized over the year, to better match revenues and expenses. Specifically, at each interim reporting date the Company compares actual revenues earned to date on its dredging contracts to expected annual revenues and recognizes equipment costs on the same proportionate basis. In the fourth quarter, any over and under allocated equipment costs are recognized such that the expense for the year equals actual equipment costs incurred during the year.
Classification of Current Assets and Liabilities—The Company includes in current assets and liabilities amounts realizable and payable in the normal course of contract completion, unless completion of such contracts extends significantly beyond one year.
Correction of Statement of Cash Flows—The Company has corrected the presentation of borrowings and payments on its revolving credit facility for 2008 and 2007. Such amounts had previously been presented on a net basis, rather than on a gross basis in accordance with Accounting Standards Codification Topic (“ASC”) 230. The correction had no effect on net cash provided by (used in) financing activities.
Cash Equivalents—The Company considers all highly liquid investments with a maturity at purchase of three months or less to be cash equivalents.
Accounts receivable-net—Accounts receivable represent amounts due or billable under the terms of contracts with customers, including amounts related to retainage. The Company anticipates collection of retainage generally within one year, and accordingly presents retainage as a current asset. The Company provides an allowance for estimated uncollectible accounts receivable when events or conditions indicate that amounts outstanding are not recoverable.
Inventories—Inventories consist of pipe and spare parts used in the Company’s dredging operations. Pipe and spare parts are purchased in large quantities; therefore, a certain amount of pipe and spare part inventories is not anticipated to be used within the current year and is classified as long-term. Inventories are stated at the weighted average historical cost.
Property and Equipment—Capital additions, improvements, and major renewals are classified as property and equipment and are carried at depreciated cost. Maintenance and repairs that do not significantly extend the useful lives of the assets or enhance the capabilities of such assets are charged to expenses as incurred. Depreciation is recorded over the estimated useful lives of property and equipment using the straight-line method and the mid-year depreciation convention. The estimated useful lives by class of assets are:
| Class |
Useful Life (years) |
|||
| Buildings and improvements |
10 | |||
| Furniture and fixtures |
5-10 | |||
| Vehicles, dozers, and other light operating equipment and systems |
3-5 | |||
| Heavy operating equipment (dredges and barges) |
10-30 | |||
Leasehold improvements are amortized over the shorter of their remaining useful lives or the remaining terms of the leases.
Goodwill and Other Intangibles—Goodwill represents the excess of cost over fair value. Other identifiable intangibles mainly represent developed technology and databases, customer relationships, and customer contracts acquired in business combinations and are being amortized over a 7 to 10-year period. Goodwill is tested annually for impairment in the third quarter of each year, or more frequently should circumstances dictate. GAAP requires that goodwill of a reporting unit be tested for impairment between annual tests if an event occurs or circumstances change that would more likely than not reduce the fair value of a reporting unit below its carrying amount.
72
Table of Contents
1. NATURE OF BUSINESS AND SUMMARY OF SIGNIFICANT ACCOUNTING POLICIES (Continued)
The Company assesses the fair values of its reporting units using both a market-based approach and an income-based approach. Under the income approach, the fair value of the reporting unit is based on the present value of estimated future cash flows. The income approach is dependent on a number of factors, including estimates of future market growth trends, forecasted revenues and expenses, expected periods the assets will be utilized, appropriate discount rates and other variables. The estimates are based on assumptions that the Company believes to be reasonable, but which are unpredictable and inherently uncertain. Changes in these estimates and assumptions could materially affect the determination of fair value, and may result in the impairment of goodwill in the event that actual results differ from those estimates.
The market approach measures the value of an entity through comparison to comparable companies. Under the market approach, the Company uses the guideline public company method by applying an estimated market-based enterprise value multiples to the reporting unit’s estimated revenue and EBITDA. The Company analyzed companies that performed similar services or are considered peers. Due to the fact that there are no public companies that are our direct competitors, the Company weighed the results of this approach less than the income approach.
The Company performed its annual test of impairment as of July 1, 2009 for the goodwill in both the dredging and demolition segments with no indication of goodwill impairment as of the test date. The decline in the operating results and related cash flow forecasts in the demolition segment during the past year has reduced the amount by which the estimated fair value of the demolition segment exceeds the carrying value of the demolition segment’s assets. As of the measurement date, the fair value of the demolition segment was $1.8 million above the carrying value. A more than insignificant decline in the demolition segment’s future operating results or cash flow forecasts versus the segment’s current forecasts could potentially trigger a goodwill impairment charge in a future period. No test was performed in the fourth quarter as based on the segment’s current forecasts no triggering events which would require a test were deemed to have occurred.
Long-Lived Assets—Long-lived assets are comprised of property and equipment and intangible assets subject to amortization. Long-lived assets to be held and used are reviewed for possible impairment whenever events indicate that the carrying amount of such assets may not be recoverable by comparing the undiscounted cash flows associated with the assets to their carrying amounts. If such a review indicates an impairment, the carrying amount would be reduced to fair value. If long-lived assets are to be disposed, depreciation is discontinued, if applicable, and the assets are reclassified as held for sale at the lower of their carrying amounts or fair values less estimated costs to sell. No triggering events were identified in 2009, 2008 or 2007.
Self-insurance Reserves—The Company self-insures costs associated with its seagoing employees covered by the provisions of Jones Act, workers’ compensation claims, hull and equipment liability, and general business liabilities up to certain limits. Insurance reserves are established for estimates of the loss that the Company will ultimately incur on reported claims, as well as estimates of claims that have been incurred but not yet reported. In determining its estimates, the Company considers historical loss experience and judgments about the present and expected levels of cost per claim. Trends in actual experience are a significant factor in the determination of such reserves.
The Company is a member of an insurance association that provides personal injury coverage for its maritime workforce in excess of self-insurance retention limits. The Company is subject to retroactive premium adjustments based on the association’s claims experience and investment performance. The Company accrues for retroactive premium adjustments when assessed by the insurance association. During the years ended December 31, 2009 and 2008, there were $1,983 and $2,183 recorded for retroactive assessments, respectively. There were no retroactive adjustments recorded in 2007.
Income Taxes—The provision for income taxes includes federal, foreign, and state income taxes currently payable and those deferred because of temporary differences between the financial statement and tax bases of assets and liabilities. Recorded deferred income tax assets and liabilities are based on the estimated future tax effects of differences between the financial and tax basis of assets and liabilities, given the effect of currently enacted tax laws.
73
Table of Contents
1. NATURE OF BUSINESS AND SUMMARY OF SIGNIFICANT ACCOUNTING POLICIES (Continued)
Fair Value of Financial Instruments—The carrying value of financial instruments included in current assets and current liabilities approximates fair values due to the short-term maturities of these instruments. The fair value of the Company’s long-term senior subordinated notes is discussed in Note 13, and the fair value of other financial instruments approximate their carrying values at December 31, 2009.
Noncontrolling Interest—The Company previously owned 85% of the capital stock of North American Site Developers, Inc. (“NASDI Inc”), a demolition service provider located in the Boston, Massachusetts area. On April 30, 2008, the Company acquired the remaining 15% of the capital stock from Christopher A. Berardi, the then President of NASDI Inc. Additionally, the Company entered into a series of transactions for the purpose of restructuring the Company’s arrangements with Mr. Berardi. Noncontrolling interest as currently recorded represents the 35% Class B interests in NASDI, LLC (“NASDI”) currently owned by Mr. Berardi. (See Note 20)
On January 1, 2009 the Company acquired a 65% interest in Yankee Environmental Services (“Yankee”) (See Note 20)
Earnings Per Share—Basic earnings per share is computed by dividing net income available to common stockholders by the weighted-average number of common shares outstanding during the reporting period. Diluted earnings per share is computed similar to basic earnings per share except that it reflects the potential dilution that could occur if dilutive securities or other obligations to issue common stock were exercised or converted into common stock. At December 31, 2009, the dilutive impact of options to purchase 727,483 shares of common stock (“NQSO”) and 285,600 issued restricted stock units (“RSUs”) is included in the calculation of diluted earnings per share based on the application of the treasury stock method. At December 31, 2008, 356,774 stock options and 137,388 restricted stock units would have had an antidilutive effect on earnings per share and therefore are excluded from the calculation. In 2007, the warrants were dilutive until they were all exercised or redeemed and were therefore included in the calculation of diluted earnings per share.
The computations for basic and diluted earnings per share for the years ended December 31, 2009, 2008 and 2007 are as follows:
| 2009 | 2008 | 2007 | ||||||||||
| Net income available to common shareholders of Great Lakes Dredge & Dock Corporation |
$ | 17,468 | $ | 4,979 | $ | 7,056 | ||||||
| Weighted-average common shares outstanding—basic |
58,507 | 58,469 | 48,911 | |||||||||
| Effect of stock warrants outstanding |
— | — | 3,310 | |||||||||
| Effect of stock options and restricted stock units |
105 | 9 | — | |||||||||
| Weighted-average common shares outstanding—diluted |
58,612 | 58,478 | 52,221 | |||||||||
| Earnings per share—basic |
$ | 0.30 | $ | 0.09 | $ | 0.14 | ||||||
| Earnings per share—diluted |
$ | 0.30 | $ | 0.09 | $ | 0.14 | ||||||
New Accounting Pronouncements—In January 2010, the Financial Accounting Standards Board (“FASB”) issued Accounting Standards Update (“ASU”) 2010-06, Improving Disclosures About Fair Value Measurements (“ASU 2010-06”) that amended ASC Topic 820-10, Fair Value Measurements and Disclosure s to add new requirements for disclosures about transfers into and out of Levels 1 and 2 measurements and additional disclosures about purchases, sales, issuances, and settlements relating to Level 3 measurements. The update is effective as of January 1, 2010. The update clarifies that disclosures about the valuation techniques and inputs used to measure fair value is required for both recurring and nonrecurring fair value measurements. In addition, those disclosures are required for fair value measurements classified either as Level 2 or Level 3. If the valuation technique has changed, entities should disclose that change and the reason for the change. Adoption of ASU 2010-06 is not expected to have a significant impact on the financial statements as the Company currently discloses the method for valuing Level 2 and Level 3 inputs. See Note 13.
74
Table of Contents
1. NATURE OF BUSINESS AND SUMMARY OF SIGNIFICANT ACCOUNTING POLICIES (Continued)
In 2009 the FASB issued ASU 2009-17, which amended ASC 810, Consolidation, and is effective as of January 1, 2010. ASU 2009-17 addresses information a reporting entity provides in its financial statements about the transfer of financial assets; the effects of a transfer on its financial position, financial performance, and cash flows; and a transferor’s continuing involvement in transferred financial assets. Also, the amended topic removes the concept of a qualifying special purpose entity, limits the circumstances in which a transferor derecognizes a portion or component of a financial asset, defines participating interest and enhances the information provided to financial statement users to provide greater transparency. The Company is currently evaluating the impact adoption will have on the Company’s consolidated financial position, results of operations and cash flows, and does not expect the impact to be material.
2. ACCOUNTS RECEIVABLE
Accounts receivable at December 31, 2009 and 2008, are as follows:
| 2009 | 2008 | |||||||
| Completed contracts |
$ | 19,468 | $ | 37,119 | ||||
| Contracts in progress |
105,717 | 61,010 | ||||||
| Retainage |
29,966 | 23,741 | ||||||
| 155,151 | 121,870 | |||||||
| Allowance for doubtful accounts |
(1,250 | ) | (1,250 | ) | ||||
| Total accounts receivable—net |
$ | 153,901 | $ | 120,620 | ||||
3. CONTRACTS IN PROGRESS
The components of contracts in progress at December 31, 2009 and 2008, are as follows:
| 2009 | 2008 | |||||||
| Costs and earnings in excess of billings: |
||||||||
| Costs and earnings for contracts in progress |
$ | 264,073 | $ | 409,304 | ||||
| Amounts billed |
(236,780 | ) | (378,732 | ) | ||||
| Costs and earnings in excess of billings for contracts in progress |
27,293 | 30,572 | ||||||
| Costs and earnings in excess of billings for completed contracts |
711 | 344 | ||||||
| Total contract revenues in excess of billings |
$ | 28,004 | $ | 30,916 | ||||
| Billings in excess of costs and earnings: |
||||||||
| Amounts billed |
$ | (434,893 | ) | $ | (145,441 | ) | ||
| Costs and earnings for contracts in progress |
409,992 | 125,659 | ||||||
| Total billings in excess of contract revenues |
$ | (24,901 | ) | $ | (19,782 | ) | ||
75
Table of Contents
4. GOODWILL
The change in the carrying amount of goodwill during the years ended December 31, 2009, 2008 and 2007 is as follows (See note 20 for more information regarding acquisitions):
| Dredging Segment |
Demolition Segment |
Total | ||||||||||
| Balance—January 1, 2008 |
||||||||||||
| Goodwill |
$ | 76,575 | $ | 24,466 | $ | 101,041 | ||||||
| Accumulated impairment losses |
— | (4,816 | ) | (4,816 | ) | |||||||
| 76,575 | 19,650 | 96,225 | ||||||||||
| Goodwill acquired during 2008 |
||||||||||||
| Acquisition of NASDI noncontrolling interest |
— | 1,574 | 1,574 | |||||||||
| Balance—December 31, 2008 |
76,575 | 21,224 | 97,799 | |||||||||
| Goodwill acquired during 2008 |
||||||||||||
| Acquisition Yankee Environmental Services Inc. |
— | 250 | 250 | |||||||||
| Balance—December 31, 2009 |
$ | 76,575 | $ | 21,474 | $ | 98,049 | ||||||
5. PROPERTY AND EQUIPMENT
Property and equipment at December 31, 2009 and 2008 are as follows:
| 2009 | 2008 | |||||||
| Land |
$ | 2,870 | $ | 2,870 | ||||
| Buildings and improvements |
4,629 | 3,677 | ||||||
| Furniture and fixtures |
2,737 | 1,849 | ||||||
| Operating equipment |
435,103 | 411,594 | ||||||
| Total property and equipment |
445,339 | 419,990 | ||||||
| Accumulated depreciation |
(154,182 | ) | (123,105 | ) | ||||
| Property and equipment—net |
$ | 291,157 | $ | 296,885 | ||||
Depreciation expense was $32,251, $29,684, and $26,275 for the years ended December 31, 2009, 2008, and 2007, respectively.
6. SHARE-BASED COMPENSATION
The Company’s 2007 Long-Term Incentive Plan (the “Incentive Plan”), as approved by the Board of Directors on September 18, 2007, permits the grant of stock options, stock appreciation rights, restricted stock and restricted stock units to its employees and directors for up to 5.8 million shares of common stock.
In May of 2009 and 2008, the Company granted NQSOs and RSUs to certain employees pursuant to the plan. Compensation cost charged to income related to these stock-based compensation arrangements was $1,078 and $315 for the years ended December 31, 2009 and 2008, respectively.
Non-qualified stock options
The NQSO awards were granted with an exercise price equal to the market price of the Company’s common stock at the date of grant. The option awards generally vest in three equal annual installments commencing on the first anniversary of the grant date, and have 10-year exercise periods.
76
Table of Contents
6. SHARE-BASED COMPENSATION (Continued)
The fair value of the NQSOs was determined at the grant date using a Black-Scholes option pricing model, which requires the Company to make several assumptions. The risk-free interest rate is based on the U.S. Treasury yield curve in effect for the expected term of the option at the time of grant. The annual dividend yield on the Company’s common stock is based on estimates of future dividends during the expected term of the NQSOs. The expected life of the NQSOs was determined based upon a simplified assumption that the NQSOs will be exercised evenly from vesting to expiration, as the Company does not have sufficient historical exercise data to provide a reasonable basis upon which to estimate the expected life.
The volatility assumptions were based upon historical volatilities of comparable companies whose shares are traded using daily stock price returns equivalent to the expected term of the option. Due to a lack of sufficient historical information at the time these NQSOs were issued (since the Company’s shares were not publicly traded until December of 2006) the historical volatility data for the Company was not considered in determining expected volatility. The Company also considered implied volatility data for comparable companies, using current exchange traded options. There is not an active market for options on the Company’s common stock and, as such, implied volatility for the Company’s stock was not considered. Additionally, the Company’s general policy is to issue new shares of registered common stock to satisfy stock option exercises or grants of restricted stock.
The weighted-average grant-date fair value of options granted during the years ended December 31, 2009 and 2008 was $1.86 and $2.24, respectively. The fair value of each option was estimated using the following assumptions:
| 2009 | 2008 | |||||||
| Expected volatility |
60.0 | % | 45.0 | % | ||||
| Expected dividends |
1.8 | % | 1.3 | % | ||||
| Expected term (in years) |
5.0 - 6.0 | 5.5 - 6.5 | ||||||
| Risk free rate |
2.2 | % | 3.0 | % | ||||
A summary of stock option activity under the Incentive Plan as of December 31, 2009 and 2008, and changes during the years ended December 31, 2009 and 2008 is presented below:
| Options |
Shares | Weighted Average Exercise Price |
Weighted- Average Remaining Contract Term (yrs) |
Aggregate Intrinsic Value ($000’s) |
||||||||||||
| Outstanding as of January 1, 2009 |
356,774 | $ | 5.41 | |||||||||||||
| Granted |
371,069 | |||||||||||||||
| Exercised |
— | |||||||||||||||
| Forfeited or Expired |
— | |||||||||||||||
| Outstanding as of December 31, 2009 |
727,843 | $ | 4.60 | 8.9 | $ | 690 | ||||||||||
| Vested at December 31, 2009 |
118,925 | $ | 5.41 | 8.4 | $ | 382 | ||||||||||
| Vested or expected to vest at December 31, 2009 |
697,761 | $ | 4.61 | 8.9 | $ | 688 | ||||||||||
No NQSOs were exercised during the year ended December 31, 2009.
77
Table of Contents
6. SHARE-BASED COMPENSATION (Continued)
Restricted stock units
RSUs generally vest in one installment on the third anniversary of the grant date. The fair value of RSUs was based upon the Company’s stock price on the date of grant. A summary of the status of the Company’s non-vested RSUs as of December 31, 2009 and 2008, and changes during the years ended December 31, 2009 and 2008 is presented below:
| Nonvested Restricted Stock Units |
Shares | Grant Date Price |
Weighted- Average Grant- Date Fair Value |
|||||||||
| Outstanding as of January 1, 2009 |
145,736 | $ | 5.41 | $ | 5.41 | |||||||
| Granted |
139,864 | 3.82 | 3.82 | |||||||||
| Vested |
— | — | — | |||||||||
| Forfeited |
— | — | — | |||||||||
| Outstanding as of December 31, 2009 |
285,600 | $ | 4.63 | $ | 4.63 | |||||||
| Vested at December 31, 2009 |
— | $ | — | $ | — | |||||||
| Vested or expected to vest at December 31, 2009 |
243,984 | $ | 4.63 | $ | 4.63 | |||||||
As of December 31, 2008, there was $1.5 million of total unrecognized compensation cost related to non-vested NQSOs and RSUs granted under the Plan. That cost is expected to be recognized over a weighted-average period of 1.1 years.
Director Compensation
Beginning in May 2008, the Company used a combination of cash and stock-based compensation to attract and retain qualified candidates to serve on our Board of Directors. Compensation is paid to non-employee directors. Directors who are not outside directors receive no additional compensation for services as members of the Board or any of its committees. All of our directors are outside directors other than Douglas B. Mackie. Two of the Company’s outside directors waived their right to director’s compensation for the 2008 fiscal year and through the first three quarters of 2009. One of these directors resigned from the board in August 2009 and the other began receiving director compensation in October 2009. Stock-based compensation is paid pursuant to the Incentive Plan. For the 2008 fiscal year each director received compensation of $60,000, 50% in cash and 50% payable in unrestricted shares of the Company’s common stock. In 2009, each non-employee director of the Company received an annual retainer of $125,000, payable quarterly in arrears, and was paid 50% in cash and 50% in common stock of the Company. The annual retainer was increased to correct the existing variance between the amount of compensation paid by the Company to its non-employee directors and the amount comparable corporations pay to their non-employee directors.
As of December 31, 2009 and 2008, 57,796 and 28,040 shares of the Company’s common stock were issued to non-employee directors under the Incentive Plan.
78
Table of Contents
7. INVESTMENTS IN JOINT VENTURES
The Company has a 50% ownership interest in Amboy Aggregates (“Amboy”), whose primary business is the dredge mining and sale of fine aggregate. The Company accounts for its investment in Amboy using the equity method. The following table includes Amboy’s summarized financial information for the periods presented.
| 2009 | 2008 | 2007 | ||||||||||
| Current assets |
$ | 7,510 | $ | 8,301 | $ | 9,682 | ||||||
| Noncurrent assets |
8,162 | 8,602 | 8,937 | |||||||||
| Total assets |
15,672 | 16,903 | 18,619 | |||||||||
| Total liabilities |
(1,318 | ) | (1,131 | ) | (1,568 | ) | ||||||
| Equity |
$ | 14,354 | $ | 15,772 | $ | 17,051 | ||||||
| Revenue |
$ | 16,987 | $ | 23,812 | $ | 27,821 | ||||||
| Gross profit (loss) |
$ | (2,028 | ) | $ | (1,345 | ) | $ | 3,853 | ||||
| Net income (loss) |
$ | (874 | ) | $ | (29 | ) | $ | 3,946 | ||||
Amboy has a revolving loan with a bank for up to $3,000, which contains certain restrictive covenants, including limitations on the amount of distributions to its joint venture partners. It is the intent of the joint venture partners to periodically distribute Amboy’s earnings, to the extent allowed by Amboy’s bank agreement.
The Company holds a 50% interest in land, which is adjacent to the Amboy property and may be used in connection with the Amboy operations. The Company’s investment in its share of the land is $766 and is reflected in investments in joint ventures. The Company recorded income of $53, $0 and $19 in connection with this land investment for the years ended December 31, 2009, 2008, and 2007, respectively.
For the years ended December 31, 2009, 2008, and 2007, the Company received distributions from Amboy and the adjacent land investment totaling $621, $625, and $2,400, respectively.
8. INTANGIBLE ASSETS
At December 31, 2009, the net book value of identifiable intangible assets was as follows:
| As of December 31, 2009 |
Cost | Accumulated Amortization |
Net | |||||||||
| Demolition segment customer relationships |
$ | 1,481 | $ | 1,047 | $ | 434 | ||||||
| Demolition backlog |
480 | 480 | — | |||||||||
| Software and databases |
1,209 | 849 | 360 | |||||||||
| Non-compete agreement |
205 | 68 | 137 | |||||||||
| Trade names |
88 | 18 | 70 | |||||||||
| Other |
83 | 47 | 36 | |||||||||
| $ | 3,546 | $ | 2,509 | $ | 1,037 | |||||||
At December 31, 2008, the net book value of identifiable intangible assets was as follows:
| As of December 31, 2008 |
Cost | Accumulated Amortization |
Net | |||||||||
| Demolition segment customer relationships |
$ | 1,300 | $ | 871 | $ | 429 | ||||||
| Demolition backlog |
158 | 158 | — | |||||||||
| Software and databases |
1,209 | 707 | 502 | |||||||||
| Total |
$ | 2,667 | $ | 1,736 | $ | 931 | ||||||
79
Table of Contents
8. INTANGIBLE ASSETS (Continued)
On April 30, 2008 the Company acquired the remaining 15% interest in NASDI Inc. resulting in the recognition of additional intangible assets including customer relationships and backlog (see Note 20). The weighted average amortization period for intangible assets acquired in 2008 is 6.5 years.
On January 1, 2009 the Company acquired a 65% interest in Yankee Environmental Services, Inc. (“Yankee”) resulting in the recognition of additional intangible assets (See Note 20). The weighted average amortization period for intangible assets acquired in 2009 is 3.2 years
Amortization expense related to these intangible assets is estimated to be $427 in 2010, $227 in 2011, $146 annually in 2012 and 2013 and $92 in 2014.
9. OTHER NONCURRENT ASSETS
At December 31, 2009 and 2008, other noncurrent assets includes $1,500 of cash held in escrow as security for the Company’s lease rental obligation under a long-term equipment operating lease.
10. ACCRUED EXPENSES
Accrued expenses at December 31, 2009 and 2008 are as follows:
| 2009 | 2008 | |||||||
| Payroll and employee benefits |
$ | 11,233 | $ | 9,968 | ||||
| Insurance |
8,521 | 10,367 | ||||||
| Percentage of completion adjustment |
5,901 | — | ||||||
| Income and other taxes |
4,094 | 2,488 | ||||||
| Interest |
726 | 1,037 | ||||||
| Fuel hedge liability |
— | 5,682 | ||||||
| Other |
790 | 900 | ||||||
| Total accrued expenses |
$ | 31,265 | $ | 30,442 | ||||
11. RELATED-PARTY TRANSACTIONS
The demolition business is operated out of a building owned by Christopher A. Berardi, who has a 35% profits interest in NASDI. In 2009, 2008 and 2007, NASDI paid Mr. Berardi $312, $359 and $306, respectively, for rent and property taxes.
12. LONG-TERM DEBT
Long-term debt at December 31, 2009 and 2008 is as follows:
| 2009 | 2008 | |||||||
| Equipment notes payable |
$ | 1,450 | $ | 2,607 | ||||
| Revolving credit facility |
11,000 | 41,500 | ||||||
| 7.75% senior subordinated notes |
175,000 | 175,000 | ||||||
| Subtotal |
187,450 | 219,107 | ||||||
| Current portion of equipment debt |
(1,200 | ) | (1,553 | ) | ||||
| Total |
$ | 186,250 | $ | 217,554 | ||||
80
Table of Contents
12. LONG-TERM DEBT (Continued)
On June 12, 2007, the Company entered into a new credit agreement (the “Credit Agreement”) with Bank of America N.A. as Administrative Agent and Issuing Lender, various other financial institutions as lenders and certain subsidiaries of the Company as Loan Parties. The Credit Agreement, which refinanced and replaced the Company’s former credit agreement, provides for a revolving credit facility of up to $155,000 in borrowings and includes sublimits for the issuance of letters of credit and swingline loans. The revolving credit facility matures on June 12, 2012. The revolving credit facility bears interest at rates selected at the option of Great Lakes, currently equal to either LIBOR plus an applicable margin or the Base Rate plus an applicable margin. The applicable margins for LIBOR loans and Base Rate loans, as well as any non-use fee, are subject to adjustment based upon the Company’s ratio of Total Funded Debt to Adjusted Consolidated Earnings before interest, taxes, depreciation and amortization (“EBITDA”) (each as defined in the Credit Agreement).
The obligations of Great Lakes under the Credit Agreement are unconditionally guaranteed by its direct and indirect domestic subsidiaries. Additionally, the obligations are secured by a perfected first priority lien on certain equipment of Great Lakes’ subsidiary, Great Lakes Dredge & Dock Company, LLC (“GLDD Company”); a perfected second priority lien on certain other equipment of GLDD Company, subject to a perfected first priority lien in favor of Great Lakes’ bonding company; a perfected first priority lien on the intercompany receivables of Great Lakes and its direct and indirect domestic subsidiaries and having an equal priority to the liens of Great Lakes’ bonding company; and a perfected second priority lien on the accounts receivable of Great Lakes and its direct and indirect subsidiaries that relate to bonded projects. The Credit Agreement contains various covenants and restrictions, including (i) limitations on dividends to $5 million per year, (ii) limitations on redemptions and repurchases of capital stock, (iii) limitations on the incurrence of indebtedness, liens, leases, and investments, and (iv) maintenance of certain financial covenants.
As of December 31, 2009, the Company had $11,000 of borrowings and $17,101 of letters of credit outstanding, resulting in $117,608 of availability under the Credit Agreement. In late 2008, Lehman Brothers, a 6.5% participant in our credit facility, filed for bankruptcy and stopped funding its share of the Company’s revolver borrowings. As Lehman Brothers is a defaulting lender, the Company is no longer able to draw upon Lehman Brothers’ pro-rata portion of the revolver commitment. As of December 31, 2009, the Company had drawn $710 of the $10,000 applicable to Lehman Brothers. As such, Lehman Brothers’ remaining $9,290 commitment has not been included in our availability under the credit facility.
During a year, the Company frequently borrows and repays amounts under its revolving credit facility. The net activity in 2009 and 2008 resulted in an increase (decrease) in debt balances of ($30,500) and $20,000, respectively.
At December 31, 2009 and 2008, the Company’s weighted-average borrowing rate under its Credit Agreement was 8.51% and 6.92%, respectively, including amortization of deferred financing fees related to the Credit Agreement of 5.36% and 1.42%, respectively.
At December 31, 2009, the Company was in compliance with its various covenants under its Credit Agreement.
Great Lakes has a $24,000 International Letter of Credit Facility with Wells Fargo HSBC Trade Bank. This facility is used for performance and advance payment guarantees on foreign contracts, including our long-term land reclamation project in Bahrain (“Diyar”). The Company’s obligations under the agreement are guaranteed by the Company’s foreign accounts receivable. In addition, the Export-Import Bank of the United States (“Ex-Im”) has issued a guarantee under the Ex-Im Bank’s Working Capital Guarantee Program, which covers 90% of the obligations owing under the facility. At December 31, 2009, there were $15,703 letters of credit outstanding on this facility.
The Company has $175,000 of 7.75% senior subordinated notes (“Notes”) outstanding that mature on December 15, 2013. The Notes are general unsecured obligations of the Company, subordinated in right of payment to all existing and future senior debt, including borrowings under the Credit Agreement. The Company’s obligations under the Notes are guaranteed on a senior subordinated basis by all of the Company’s domestic subsidiaries.
81
Table of Contents
12. LONG-TERM DEBT (Continued)
The scheduled principal payments through the maturity date of the Company’s long-term debt, excluding equipment notes, at December 31, 2009, are as follows:
| Years Ending December 31 |
||||
| 2010 |
$ | — | ||
| 2011 |
— | |||
| 2012 |
11,000 | |||
| 2013 |
175,000 | |||
| 2014 |
— | |||
| Total |
$ | 186,000 | ||
The Company may redeem all or a portion of the Notes at once or over time at the following redemption prices, plus accrued and unpaid interest and other applicable amounts, if any:
| Prior to December 15, 2010 |
102.583 | % | ||
| Prior to December 15, 2011 |
101.292 | % | ||
| Thereafter |
100.000 | % |
The Company sometimes enters into equipment note arrangements to finance the acquisition of dozers and excavators. In 2009 and 2008, the Company entered into equipment notes totaling $615 and $2,213, respectively. The current portion of equipment notes payable is $1,200 and $1,553, at December 31, 2009 and 2008, respectively. The long-term portion of these equipment notes is included in other long-term liabilities and totaled $250 and $1,054 at December 31, 2009 and 2008, respectively. The terms of these equipment notes extend through 2012. The net book value of the related assets was $3,499 and $4,212 at December 31, 2009 and 2008, respectively. Payments on these equipment notes will be $1,200, $243, and $6 in 2010, 2011, and 2012.
13. RISK MANAGEMENT ACTIVITIES
Fair value is defined as the exchange price that would be received for an asset or paid to transfer a liability (an exit price) in the principal or most advantageous market for the asset or liability in an orderly transaction between market participants on the measurement date. A fair value hierarchy has been established by GAAP that requires an entity to maximize the use of observable inputs and minimize the use of unobservable inputs when measuring fair value. The accounting guidance describes three levels of inputs that may be used to measure fair value:
Level 1—Quoted prices in active markets for identical assets or liabilities.
Level 2—Observable inputs other than Level 1 prices such as quoted prices for similar assets or liabilities; quoted prices in markets that are not active; or other inputs that are observable or can be corroborated by observable market data for substantially the full term of the assets or liabilities.
Level 3—Unobservable inputs that are supported by little or no market activity and that are significant to the fair value of the assets or liabilities.
82
Table of Contents
13. RISK MANAGEMENT ACTIVITIES (Continued)
The Company utilizes the market approach to measure fair value for its financial assets and liabilities. The market approach uses prices and other relevant information generated by market transactions involving identical or comparable assets or liabilities. At December 31, 2009, the Company held certain derivative contracts that it uses to manage commodity price risk and interest rate risk. Such instruments are not used for trading purposes. The fair value of these derivative contracts is summarized as follows:
| Description |
At December 31, 2009 |
Fair Value Measurements at Reporting Date Using |
||||||||||||||
| Quoted Prices in Active Markets for Identical Assets (Level 1) |
Significant Other Observable Inputs (Level 2) |
Significant Unobservable Inputs (Level 3) |
||||||||||||||
| Fuel hedge contracts |
$ | 897 | $ | — | $ | 897 | $ | — | ||||||||
| Interest rate swap contracts-assets |
1,529 | — | — | 1,529 | ||||||||||||
| Interest rate swap contracts-liabilities |
(1,549 | ) | — | — | (1,549 | ) | ||||||||||
| Total assets measured at fair value |
$ | 877 | $ | — | $ | 897 | $ | (20 | ) | |||||||
| Fair Value Measurements at Reporting
Date Using |
||||||||||||||||
| Description |
At December 31, 2008 |
Quoted Prices in Active Markets for Identical Assets (Level 1) |
Significant Other Observable Inputs (Level 2) |
Significant Unobservable Inputs (Level 3) |
||||||||||||
| Fuel hedge contracts |
$ | (5,682 | ) | $ | — | $ | (5,682 | ) | $ | — | ||||||
Interest Rate Swaps
In May 2009, the Company entered into two interest rate swap arrangements, which are effective through December 15, 2012, to swap a notional amount of $50 million from a fixed rate of 7.75% to a floating LIBOR-based rate in order to manage the interest rate paid with respect to the Company’s 7.75% senior subordinated notes. The current portion of the fair value asset of the swaps at December 31, 2009 is $1,529 and is recorded in current assets. The long term portion of the fair value liability of the swaps at December 31, 2009 was $1,549 and is recorded in other long term liabilities. The swap is not accounted for as a hedge; therefore, the changes in fair value are recorded as adjustments to interest expense in each reporting period.
83
Table of Contents
13. RISK MANAGEMENT ACTIVITIES (Continued)
The Company verifies the fair value of the interest rate swaps using a quantitative model that contains both observable and unobservable inputs. The unobservable inputs relate primarily to the LIBOR rate and long-term nature of the contracts. The Company believes that these unobservable inputs are significant and accordingly the Company determines the fair value of these interest rate swap contracts using Level 3 inputs.
| Fair Value Measurements Using Significant Unobservable Inputs (Level 3) Interest Rate Swaps |
||||
| Balance at January 1, 2008 |
$ | (365 | ) | |
| Transfers to Level 3 |
— | |||
| Total unrealized gains or (losses) included in earnings |
826 | |||
| Total gains or (losses) included in other comprehensive income |
— | |||
| Purchases and settlements |
(461 | ) | ||
| Balance at December 31, 2008 |
$ | — | ||
| Transfers to Level 3 |
— | |||
| Total unrealized gains or (losses) included in earnings |
485 | |||
| Total gains or (losses) included in other comprehensive income |
— | |||
| Purchases and settlements |
(465 | ) | ||
| Balance at December 31, 2009 |
$ | (20 | ) | |
Fuel Hedge Contracts
The Company is exposed to certain market risks, primarily commodity price risk as it relates to the diesel fuel purchase requirements that occur in the normal course of business. The Company enters into heating oil commodity swap contracts to hedge the risk that fluctuations in diesel fuel prices will have an adverse impact on cash flows associated with its domestic dredging contracts. The Company does not hold or issue derivatives for speculative or trading purposes. The Company’s goal is to hedge approximately 80% of the fuel requirements for work in backlog.
As of December 31, 2009, the Company was party to various swap arrangements to hedge the price of a portion of its diesel fuel purchase requirements for work in its backlog to be performed through November 2010. As of December 31, 2009, there were 6.2 million gallons remaining on these contracts which represent approximately 62% of the Company’s forecasted fuel purchases. Under these swap agreements, the Company will pay fixed prices ranging from $1.48 to $2.10 per gallon.
The Company designates the commodity swap contracts as a cash flow hedge as defined by GAAP. Accordingly, the Company formally documents, at the inception of each hedge, all relationships between hedging instruments and hedged items, as well as our risk-management objective and strategy for undertaking hedge transactions. This process includes linking all derivatives to highly-probable forecasted transactions. Changes in the fair value of these hedge positions are recognized as adjustments to the costs of contract revenues, in the consolidated statement of operations, and of the gain or loss from the hedged item.
The Company formally assesses, at inception and on an ongoing basis, the effectiveness of hedges in offsetting changes in the cash flows of hedged items. Hedge accounting treatment is discontinued when (1) it is determined that the derivative is no longer highly effective in offsetting changes in the cash flows of a hedged item (including hedged items for forecasted fuel purchases), (2) the derivative expires or is sold, terminated or exercised, (3) it is no longer probable that the forecasted transaction will occur or (4) management determines that designating the derivative as a hedging instrument is no longer appropriate. If management elects to stop hedge accounting for its fuel hedges, it would be on a prospective basis and any hedges in place would be recognized in Other Comprehensive Income until all the related forecasted fuel purchases were made.
84
Table of Contents
13. RISK MANAGEMENT ACTIVITIES (Continued)
The Company is exposed to counterparty credit risk associated with non-performance of its hedging instruments. The Company’s risk would be limited to any unrealized gains on current positions. To help mitigate this risk, the Company transacts only with counterparties that are rated as investment grade or higher. In addition, all counterparties are monitored on a continuous basis.
At each balance sheet date, unrealized gains and losses on fuel hedge contracts are recorded as a component of comprehensive income (loss) in the consolidated balance sheets. Gains and losses realized upon settlement of fuel hedge contracts are recorded as a reduction of fuel expense, which is a component of costs of contract revenues in the consolidated statements of operations.
At December 31, 2009 and December 31, 2008, the fair value asset (liability) on the fuel hedge contracts was estimated to be $897 and $(5,682), respectively, and is recorded in other current assets in 2009 and accrued expenses in 2008. The change in fair value of derivatives, net of cash settlements and taxes, as of the year ended December 31, 2009 was $790. The remaining gains included in accumulated other comprehensive income at December 31, 2009 will be reclassified into earnings over the next eleven months, corresponding to the period during which the hedged fuel is expected to be utilized. The fair values of fuel hedges are corroborated using inputs that are readily observable in public markets; therefore, the Company determines fair value of these fuel hedges using Level 2 inputs.
The fair value of interest rate and fuel hedge contracts outstanding as of December 31, 2009 is as follows:
| Fair Value of Derivatives At December 31, 2009 |
||||||||||||||||
| Balance
Sheet Location |
Fair Value Asset |
Balance
Sheet Location |
Fair Value Liability |
|||||||||||||
| Interest rate swaps |
Current assets | $ | 1,529 | Other liabilities | $ | (1,549 | ) | |||||||||
| Fuel hedge contracts |
Current assets | 897 | Accrued expenses | — | ||||||||||||
| Total Derivatives |
$ | 2,426 | $ | (1,549 | ) | |||||||||||
14. INCOME TAXES
The provision for income taxes as of December 31, 2009, 2008, and 2007 is as follows:
| 2009 | 2008 | 2007 | ||||||||||
| Federal: |
||||||||||||
| Current |
$ | 7,632 | $ | 1,057 | $ | 6,207 | ||||||
| Deferred |
1,737 | 1,896 | (705 | ) | ||||||||
| State: |
||||||||||||
| Current |
1,967 | 1,186 | 1,099 | |||||||||
| Deferred |
(521 | ) | (300 | ) | (213 | ) | ||||||
| Foreign—current |
168 | — | 11 | |||||||||
| Total |
$ | 10,983 | $ | 3,839 | $ | 6,399 | ||||||
During 2007, the Company increased its federal deferred tax rate to 35%. This increase in the tax rate resulted in deferred tax expense of $889, which adversely impacted the effective tax rate by 6.5%.
85
Table of Contents
14. INCOME TAXES (Continued)
The Company’s income tax provision reconciles to the provision at the statutory U.S. federal income tax rate as of December 31, 2009, 2008, and 2007 as follows:
| 2009 | 2008 | 2007 | ||||||||||
| Tax provision at statutory U.S. federal income tax rate |
$ | 9,001 | $ | 3,189 | $ | 4,729 | ||||||
| State income tax—net of federal income tax benefit |
729 | 519 | 599 | |||||||||
| Increase federal deferred tax rate |
— | — | 889 | |||||||||
| Secondary offering expenses |
207 | — | 249 | |||||||||
| Tax on (income) loss attributable to noncontrolling interests |
957 | (103 | ) | (20 | ) | |||||||
| Foreign tax credits |
— | — | (300 | ) | ||||||||
| Other |
89 | 234 | 253 | |||||||||
| Income tax provision |
$ | 10,983 | $ | 3,839 | $ | 6,399 | ||||||
At December 31, 2009 and 2008, the Company had net operating loss carryforwards for state income tax purposes totaling $7,778 and $2,443, respectively. The outstanding carryforwards will expire in 2024.
The Company also has foreign net operating loss carryforwards of approximately $5,445 and $5,832 as of December 31, 2009 and 2008, respectively. The net operating losses expire between 2010 and 2029. At December 31, 2009 and 2008, a full valuation allowance has been established for the deferred tax asset of $1,477 and $1,466 respectively, related to foreign net operating loss carryforwards, as the Company believes it is more likely than not that the net operating loss carryforwards will not be realized.
As a result of the implementation of ASC 740 related to uncertain tax positions, the Company recognized a $1,458 decrease in the liability for unrecognized tax benefits. This was accounted for as an increase in retained earnings of $158 and a decrease to goodwill of $1,300. As of December 31, 2009 and 2008, the Company had $2,038 and $2,220, respectively, in unrecognized tax benefits, the recognition of which would have an impact of $1,078 and $1,091 on the effective tax rate.
The Company does not expect that total unrecognized tax benefits will significantly increase or decrease within the next 12 months. Below is a tabular reconciliation of the total amounts of unrecognized tax benefits at the beginning and end of the period.
| 2009 | 2008 | 2007 | ||||||||||
| Unrecognized tax benefits—January 1 |
$ | 2,220 | $ | 1,867 | $ | 1,354 | ||||||
| Gross increases—tax positions in prior period |
142 | 169 | 280 | |||||||||
| Gross increases—current period tax positions |
69 | 184 | 233 | |||||||||
| Gross decreases—expirations in prior period |
(231 | ) | — | — | ||||||||
| Gross decreases—tax positions in prior period |
(42 | ) | — | — | ||||||||
| Settlements |
(120 | ) | — | — | ||||||||
| Unrecognized tax benefits—December 31, |
$ | 2,038 | $ | 2,220 | $ | 1,867 | ||||||
The Company’s policy is to recognize interest and penalties related to income tax matters in income tax expense. As of December 31, 2009 and 2008, the Company had approximately $765 and $911, respectively, of interest and penalties recorded.
The Company files income tax returns at the U.S. federal level and in various state and foreign jurisdictions. U.S. federal income tax years prior to 2006 are closed and no longer subject to examination. With few exceptions, the statute of limitations in state taxing jurisdictions in which the Company operates has expired for all years prior to 2005. In foreign jurisdictions in which the Company operates all significant years prior to 2004 are closed and are no longer subject to examination. Ongoing, routine examinations in Egypt are not expected to result in any material adjustments.
86
Table of Contents
14. INCOME TAXES (Continued)
The Company’s deferred tax assets (liabilities) at December 31, 2009 and 2008 are as follows:
| 2009 | 2008 | |||||||
| Deferred tax assets: |
||||||||
| Accrued liabilities |
$ | 7,075 | $ | 7,867 | ||||
| Fuel hedges |
— | 2,267 | ||||||
| Foreign NOLs |
1,477 | 1,466 | ||||||
| State NOLs |
625 | 100 | ||||||
| Valuation allowance-foreign NOLs |
(1,477 | ) | (1,466 | ) | ||||
| Total deferred tax assets |
7,700 | 10,234 | ||||||
| Deferred tax liabilities: |
||||||||
| Depreciation and amortization |
(83,694 | ) | (82,332 | ) | ||||
| Investment in NASDI, LLC and Yankee Environmental Services |
(576 | ) | (804 | ) | ||||
| Fuel hedges |
(358 | ) | — | |||||
| Total deferred tax liabilities |
(84,628 | ) | (83,136 | ) | ||||
| Net deferred tax liabilities |
$ | (76,928 | ) | $ | (72,902 | ) | ||
| As reported in the balance sheet: |
||||||||
| Net current deferred tax assets (included in other current assets) |
$ | 4,714 | $ | 8,102 | ||||
| Net noncurrent deferred tax liabilities |
(81,642 | ) | (81,004 | ) | ||||
| Net deferred tax liabilities |
$ | (76,928 | ) | $ | (72,902 | ) | ||
Deferred tax assets relate primarily to reserves and other liabilities for costs and expenses not currently deductible for tax purposes. Deferred tax liabilities relate primarily to the cumulative difference between book depreciation and amounts deducted for tax purposes. With the exception of the foreign net operating loss carryforwards, a valuation allowance has not been recorded to reduce the balance of deferred tax assets at either December 31, 2009, nor December 31, 2008, because the Company believes that it is more likely than not that the deferred income tax assets will ultimately be realized.
15. LEASE COMMITMENTS
The Company leases certain operating equipment and office facilities under long-term operating leases expiring at various dates through 2020. The equipment leases contain renewal or purchase options that specify prices at the then fair value upon the expiration of the lease terms. The leases also contain default provisions that are triggered by an acceleration of debt maturity under the terms of the Company’s Credit Agreement, or, in certain instances, cross default to other equipment leases and certain lease arrangements require that the Company maintain certain financial ratios comparable to those required by its Credit Agreement. Additionally, the leases typically contain provisions whereby the Company indemnifies the lessors for the tax treatment attributable to such leases based on the tax rules in place at lease inception. The tax indemnifications do not have a contractual dollar limit. To date, no lessors have asserted any claims against the Company under these tax indemnification provisions.
In November 2008, the Company entered into a sale-leaseback transaction for the vessel GL177. The Company sold the vessel for $16,665, and an immaterial loss was recorded on the sale. Proceeds of the sale were used for general corporate purposes. The Company will lease the vessel through November 2017 under a long-term operating lease.
87
Table of Contents
15. LEASE COMMITMENTS (Continued)
Future minimum operating lease payments at December 31, 2009, are as follows:
| 2010 |
$ | 17,493 | ||
| 2011 |
16,814 | |||
| 2012 |
15,369 | |||
| 2013 |
13,885 | |||
| 2014 |
11,879 | |||
| Thereafter |
38,517 | |||
| Total minimum operating lease payments |
$ | 113,957 | ||
Total rent expense under long-term operating lease arrangements for the years ended December 31, 2009, 2008 and 2007 was $17,718, $17,480, and $17,170, respectively. This excludes expenses for equipment and facilities rented on a short-term, as-needed basis.
16. RETIREMENT PLANS
The Company sponsors three 401(k) savings plans, one covering substantially all non-union salaried employees (“Salaried Plan”), a second covering its non-union hourly employees (“Hourly Plan”) and a third plan specifically for its employees that are members of a tugboat union. Under the Salaried Plan and Hourly Plan, individual employees may contribute a percentage of compensation and the Company will match a portion of the employees’ contributions. Additionally, the Salaried Plan includes a profit-sharing component, permitting the Company to make discretionary employer contributions to all eligible employees of the Salaried Plan. The Company’s expense for matching and discretionary contributions for 2009, 2008, and 2007, was $4,086, $3,853, and $3,510, respectively. Participation in and contributions to the plan for the tugboat union employees are not significant.
The Company also contributes to various multi-employer pension plans pursuant to collective bargaining agreements. In the event of a plan’s termination or the Company’s withdrawal from a plan, the Company may be liable for a portion of the plan’s unfunded vested benefits. However, information from the plans’ administrators is not available to permit the Company to determine its share, if any, of unfunded vested benefits. Total contributions to multi-employer pension plans for the years ended December 31, 2009, 2008, and 2007, were $6,662, $6,013, and $5,650, respectively.
88
Table of Contents
17. SEGMENT INFORMATION
The Company and its subsidiaries currently operate in two reportable segments: dredging and demolition. The Company’s financial reporting systems present various data for management to run the business, including profit and loss statements prepared according to the segments presented. Management uses operating income to evaluate performance between the two segments. Segment information for 2009, 2008, and 2007, is provided as follows:
| 2009 | 2008 | 2007 | ||||||||||
| Dredging: |
||||||||||||
| Contract revenues |
$ | 574,311 | $ | 484,659 | $ | 439,838 | ||||||
| Operating income |
49,844 | 22,209 | 24,956 | |||||||||
| Depreciation and amortization |
29,853 | 27,751 | 24,682 | |||||||||
| Total assets |
626,746 | 591,179 | 576,320 | |||||||||
| Property and equipment—net |
281,520 | 287,614 | 288,926 | |||||||||
| Goodwill |
76,575 | 76,575 | 76,575 | |||||||||
| Investment in joint venture |
7,943 | 8,949 | 9,589 | |||||||||
| Capital expenditures |
23,924 | 43,224 | 108,843 | |||||||||
| Demolition: |
||||||||||||
| Contract revenues |
47,933 | 102,220 | 75,923 | |||||||||
| Operating income (loss) |
(7,593 | ) | 3,888 | 4,024 | ||||||||
| Depreciation and amortization |
3,170 | 2,373 | 1,854 | |||||||||
| Total assets |
38,680 | 74,976 | 48,042 | |||||||||
| Property and equipment—net |
9,637 | 9,271 | 7,795 | |||||||||
| Goodwill |
21,474 | 21,224 | 19,650 | |||||||||
| Capital expenditures |
3,375 | 3,678 | 3,017 | |||||||||
| Total: |
||||||||||||
| Contract revenues |
622,244 | 586,879 | 515,761 | |||||||||
| Operating income |
42,251 | 26,097 | 28,980 | |||||||||
| Depreciation and amortization |
33,023 | 30,124 | 26,536 | |||||||||
| Total assets |
665,426 | 666,155 | 624,362 | |||||||||
| Property and equipment—net |
291,157 | 296,885 | 296,721 | |||||||||
| Goodwill |
98,049 | 97,799 | 96,225 | |||||||||
| Investment in joint venture |
7,943 | 8,949 | 9,589 | |||||||||
| Capital expenditures |
27,299 | 46,902 | 111,860 | |||||||||
The Company classifies the revenue related to its dredging projects into the following types of work:
| 2009 | 2008 | 2007 | ||||||||||
| Capital dredging—U.S. |
$ | 203,147 | $ | 153,414 | $ | 129,569 | ||||||
| Capital dredging—foreign |
134,123 | 172,345 | 140,468 | |||||||||
| Beach nourishment dredging |
62,133 | 63,550 | 90,142 | |||||||||
| Maintenance dredging |
174,908 | 95,350 | 79,659 | |||||||||
| Total |
$ | 574,311 | $ | 484,659 | $ | 439,838 | ||||||
The Company derived revenues and gross profit from foreign project operations for the years ended December 31, 2009, 2008, and 2007, as follows:
| 2009 | 2008 | 2007 | ||||||||||
| Contract revenues |
$ | 134,123 | $ | 172,345 | $ | 140,468 | ||||||
| Costs of contract revenues |
(124,355 | ) | (143,333 | ) | (121,258 | ) | ||||||
| Gross profit |
$ | 9,768 | $ | 29,012 | $ | 19,210 | ||||||
89
Table of Contents
17. SEGMENT INFORMATION (Continued)
In 2009, 2008, and 2007, the majority of the Company’s foreign revenue came from projects in the Middle East, primarily Bahrain. The majority of the Company’s long-lived assets are marine vessels and related equipment. At any point in time, the Company may employ certain assets outside of the U.S., as needed, to perform work on the Company’s foreign projects. As of December 31, 2009, 2008, and 2007, long-lived assets with a net book value of $102,285, $131,106, and $73,044, respectively, were located outside of the U.S.
18. CONCENTRATIONS OF RISK
The Company’s primary dredging customer is the U.S. Army Corps of Engineers (the “Corps”), which has responsibility for federally funded projects related to waterway navigation and flood control. In 2009, 2008, and 2007, 56.0%, 48.6%, and 36.2%, respectively, of contract revenues were earned from dredging contracts with federal government agencies, including the Corps, as well as other federal entities such as the U.S. Coast Guard and U.S. Navy. At December 31, 2009 and 2008, approximately 47.4% and 29.6%, respectively, of accounts receivable, including contract revenues in excess of billings, were due on dredging contracts with federal government agencies. The Company depends on its ability to continue to obtain federal government dredging contracts, and indirectly, on the amount of federal funding for new and current government dredging projects. Therefore, the Company’s dredging operations can be influenced by the level and timing of federal funding.
In addition, the Company’s work overseas is primarily with the government of Bahrain which accounted for 20.3%, 27.5%, and 20.6% of total revenue in 2009, 2008, and 2007, respectively. At December 31, 2009 and 2008, approximately 35.5% and 47.4%, respectively, of accounts receivable, including contract revenues in excess of billings, were due on dredging contracts with the government of Bahrain. There is a dependence on future projects in the Bahrain region, as vessels are currently located there. However, certain of the vessels located in Bahrain can be moved back to the US or all can be moved to other international markets as opportunities arise.
19. COMMITMENTS AND CONTINGENCIES
Performance and bid bonds are customarily required for dredging and marine construction projects, as well as some demolition projects. The Company obtains its performance and bid bonds through a bonding agreement with a surety company that has been granted a security interest in a substantial portion of the Company’s operating equipment with a net book value of $74,847 at December 31, 2009. The bonding agreement contains provisions requiring the Company to maintain certain financial ratios and restricting the Company’s ability to pay dividends, incur indebtedness, create liens and take certain other actions. At December 31, 2009, the Company was in compliance with its various covenants under the bonding agreement. Bid bonds are generally obtained for a percentage of bid value and amounts outstanding typically range from $1 million to $10 million. At December 31, 2009, the Company had outstanding performance bonds valued at approximately $550,450; however, the revenue value remaining in backlog related to these projects totaled approximately $329,030.
As is customary with negotiated contracts and modifications or claims to competitively bid contracts with the federal government, the government has the right to audit the books and records of the Company to ensure compliance with such contracts, modifications, or claims, and the applicable federal laws. The government has the ability to seek a price adjustment based on the results of such audit. Any such audits have not had, and are not expected to have, a material impact on the financial position, operations, or cash flows of the Company.
Various legal actions, claims, assessments and other contingencies arising in the ordinary course of business are pending against the Company and certain of its subsidiaries. These matters are subject to many uncertainties, and it is possible that some of these matters could ultimately be decided, resolved, or settled adversely. Although the Company is subject to various claims and legal actions that arise in the ordinary course of business, except as described below, the Company is not currently a party to any material legal proceedings or environmental claims.
90
Table of Contents
19. COMMITMENTS AND CONTINGENCIES (Continued)
The Company or its former subsidiary, NATCO Limited Partnership, is named as a defendant in approximately 264 lawsuits, the majority of which were filed between 1989 and 2000. In these lawsuits, the plaintiffs allege personal injury, primarily pleural abnormality or asbestosis, from exposure to asbestos on our vessels. The vast majority of these lawsuits have been filed in the Northern District of Ohio and a few in the Eastern District of Michigan. All of the cases filed against the Company prior to 1996 were administratively dismissed in May 1996 and any cases filed since that time have similarly been administratively transferred to the inactive docket. Plaintiffs in these cases could seek to reinstate the cases at a future date without being barred by the statute of limitations. By order dated October 29, 2009, however, the presiding judge reactivated 512 lawsuits in an effort to clean out the administrative docket and has stated that he intends to reactivate approximately 250 cases each month. Five of the cases reactivated to date name the Company as a defendant. Of these five cases, one of the plaintiffs has elected not to pursue his claims. The remaining four cases are proceeding through the discovery process. Management does not believe that these cases will have a material adverse impact on the business.
On April 24, 2006, a class action complaint was filed in the U.S. District Court for the Eastern District of Louisiana, on behalf of Louisiana citizens who allegedly suffered property damage from the floodwaters that flooded New Orleans and surrounding areas when Hurricane Katrina hit the area on August 29, 2005 (the “Reed Complaint”). The Reed Complaint names as defendants the U.S. government, Great Lakes Dredge & Dock Company and numerous other dredging companies that completed dredging projects on behalf of the Army Corps of Engineers in the Mississippi River Gulf Outlet (“MRGO”) between 1993 and 2005. The Reed Complaint alleges that the dredging of MRGO caused the destruction of Louisiana wetlands, which had provided a natural barrier against some storms and hurricanes. The Reed Complaint alleges that this loss of natural barriers contributed to the failure of levees as Katrina floodwaters damaged plaintiffs’ property. The Reed Complaint asserts claims of negligence, warranty, concealment and violations of the Water Pollution Control Act. Other plaintiffs have filed similar class action complaints and one mass tort case (together with the Reed Complaint, the “Katrina Claims”). All of these cases raise the same claims as the Reed Complaint. The amount of claimed damages in these claims is not stated, but is presumed to be significant. On March 9, 2007, the District Court dismissed with prejudice the Katrina Claims against Great Lakes and those plaintiffs filed an appeal to the U.S. Court of Appeals for the Fifth Circuit (the “Fifth Circuit”). On November 25, 2009, the Fifth Circuit affirmed the dismissal of the Katrina Claims. The plaintiffs have the right to appeal this decision to the U.S. Supreme.
On October 19, 2006, Great Lakes and the other dredging companies filed in federal district court for exoneration or limitation of liability under the Limitation of Liability Act (the “Limitation Action”). The Limitation Action stays all outstanding Katrina Claims against Great Lakes in the district court, pending resolution of the Limitation Action. Approximately 40,000 claims by individuals, businesses, and the State of Louisiana were filed against Great Lakes asserting the same basic theory of liability as in the Katrina Claims and seeking damages significantly in excess of the $55 million limitation bond posted by Great Lakes. In addition, all of the dredging companies, including Great Lakes, filed cross-claims against each other in the Limitation Action seeking contribution and indemnification. Great Lakes currently believes that it has meritorious claims for either exoneration from all liability or limitation of liability to not more than $55 million, which is the value of the vessels which conducted the MRGO dredging work. These defenses include arguments for both statutory and constitutional immunity from liability. On September 7, 2007, Great Lakes filed a motion to dismiss the plaintiffs’ claims. The District Court granted the motion on June 12, 2008, dismissing these claims with prejudice. The plaintiffs filed a notice of appeal in the Fifth Circuit. The Fifth Circuit stayed the appeal pending issuance of its opinion in the Katrina Claims. Following the Fifth Circuit’s affirmance of the dismissal of the Katrina Claims, briefing on this appeal was completed. Oral arguments are expected to take place on this appeal during the second quarter of 2010. Great Lakes maintains $150 million in insurance coverage for the Katrina Claims and these claims. Great Lakes currently believes that these claims will not have a material adverse impact on its financial condition or results of operations and cash flows.
On August 26, 2009, NASDI received a letter stating that the Attorney General for the Commonwealth of Massachusetts is investigating alleged violations of the Massachusetts Solid Waste Act. NASDI believes that the Attorney General is investigating illegal dumping activities at a dump site NASDI contracted with to have waste
91
Table of Contents
19. COMMITMENTS AND CONTINGENCIES (Continued)
materials disposed of between September 2007 and July 2008. Although the matter remains open, no lawsuit has been filed. Per the Attorney General’s request, NASDI executed a tolling agreement regarding the matter. Should charges be brought, NASDI intends to defend itself vigorously on this matter. Based on consideration of all of the facts and circumstances now known, the Company does not believe this claim will have a material adverse impact on the business.
20. NONCONTROLLING INTEREST ACQUISITIONS
NASDI
On April 30, 2008 the Company acquired the remaining 15% noncontrolling interest in NASDI Inc., which it did not previously own, from Christopher A. Berardi, then President of NASDI Inc. Additionally, the Company entered into a series of transactions for the purpose of restructuring the Company’s arrangements with Mr. Berardi.
As a result of these transactions, the operations of NASDI Inc. were contributed into NASDI, LLC, a newly formed Delaware limited liability company, which issued Class A and Class B member interests. The Company is the owner of 100% of the Class A interests, which provide a $28,000 liquidation preference with respect to proceeds upon disposition of NASDI, LLC. The Company also owns 65% of the Class B interests, with the remaining 35% owned by Mr. Berardi. The holders of Class B interests are entitled to receive periodic distributions of future profits based on available cash flows from operations on a pro rata basis in proportion to their percentage ownership interest.
Pursuant to the terms of the NASDI, LLC Limited Liability Company Agreement, the Company has the ability to call Mr. Berardi’s 35% interest upon Mr. Berardi’s termination of employment, upon a change in control related to the Company or any time after December 31, 2010. The call payment is based upon NASDI LLC’s average annual EBITDA for a two year period, as adjusted for the Class A liquidation preference and outstanding indebtedness of NASDI LLC. The call payment is limited, in certain situations, to a maximum of $1,500.
The Company, through its 100%-owned subsidiary NASDI Holdings Corporation (“NASDI Holdings”, the parent company of NASDI, LLC), also entered into an employment agreement with Mr. Berardi that establishes the terms of Mr. Berardi’s salary and benefits as an employee of NASDI Holdings. Additionally, in the event of sale of all or a material portion of NASDI LLC, Mr. Berardi is entitled to a cash payment equal to 35% of the proceeds received by the Company in connection with the sale of NASDI to a third party, but such payment shall not exceed $9,800.
The acquisition was accounted for as a purchase, with a purchase price of $1,939 equal to the fair value of consideration received by Mr. Berardi, including the 35% interest in Class B shares, a cash payment of $5 and the fair value of future obligations of the Company to Mr. Berardi. Accordingly, the assets and liabilities associated with this 15% interest were adjusted to their estimated fair values. A summary of the allocation of purchase price to the assets acquired is as follows:
| Property, plant and equipment |
$ | (28 | ) | |
| Intangible assets |
365 | |||
| Goodwill |
1,574 | |||
| Other assets and liabilities |
28 | |||
| Total |
$ | 1,939 | ||
Amortization expense related to these intangible assets is estimated to be $30 annually from 2010 through 2014.
Yankee
On January 1, 2009, the Company acquired Yankee. The acquisition of this business was accomplished as an asset purchase through a new subsidiary, Yankee Environmental Services, LLC. The total purchase price was $1,891 of which NASDI Holdings, contributed 65% of the purchase price, $1,229, with the remaining 35% of the purchase
92
Table of Contents
20. NONCONTROLLING INTEREST ACQUISITIONS (Continued)
price paid by other investors, one of which is Christopher A. Berardi. Yankee provides environmental remediation services including asbestos abatement and removal of other hazardous materials to private and government entities including schools, universities, hospitals and other businesses throughout the New England area. Yankee has previously been a subcontractor on many NASDI projects. The acquisition of Yankee provides an avenue to diversify the Company’s demolition business to include abatement capabilities and make NASDI more competitive on jobs requiring these services. Yankee operates within the demolition segment. The Company has omitted proforma presentation of prior period financial information for Yankee as the amounts are immaterial.
The assets and liabilities associated with this 65% interest were adjusted to their estimated fair values. A summary of the allocation of purchase price to the assets acquired is as follows:
| Property, plant and equipment |
$ | 725 | ||
| Intangible assets |
879 | |||
| Goodwill |
250 | |||
| Other assets and liabilities |
37 | |||
| Total |
$ | 1,891 | ||
| Noncontrolling interests |
(662 | ) | ||
| Company’s interest in Yankee |
$ | 1,229 | ||
Amortization expense related to these intangible assets is estimated to be $135 in 2010, $125 in 2011, $43 in 2012 and 2013 and $26 in 2014. See note 4 for more details on intangible assets.
21. SUBSIDIARY GUARANTORS
The Company’s long-term debt includes $175,000 of 7.75% senior subordinated notes which mature on December 15, 2013. The Company’s obligations under the senior subordinated notes are guaranteed by the Company’s domestic subsidiaries (the “Subsidiary Guarantors”). Such guarantees are full, unconditional and joint and several.
The following supplemental financial information sets forth for the Company’s 100%-Owned Subsidiary Guarantors (on a combined basis), each of the Company’s Non 100%-Owned Subsidiary Guarantors, the Company’s non-guarantor subsidiary and Great Lakes Dredge & Dock Corporation, exclusive of its subsidiaries (“GLDD Corporation”):
| (i) | balance sheets as of December 31, 2009 and 2008; |
| (ii) | statements of operations for the years ended December 31, 2009, 2008 and 2007; and |
| (iii) | statements of cash flows for the year ended December 31, 2009, 2008 and 2007. |
The Company has adjusted the presentation of its separate condensed consolidating financial information as of December 31, 2009 and December 31, 2008, and for the years ended December 31, 2009, 2008, and 2007 to separately disclose its Non 100%-Owned Subsidiary Guarantors, NASDI and Yankee Environmental Services, LLC (“Yankee”). These adjustments had no impact on consolidated results as previously reported.
The Company’s Form 10-K/A for the period ended December 31, 2009 includes separate financial statements for NASDI and Yankee. The separate financial information for NASDI and Yankee reconciles to the respective NASDI and Yankee financial information included in this supplemental consolidating financial information after considering timing differences in reflecting audit adjustments for each company that are immaterial to the Company’s consolidated financial statements. The NASDI difference results from a 2009 audit adjustment that was made to its separate financial statements in April 2010, subsequent to the filing of 2009 supplemental consolidating financial statements in the Company’s 2009 Form 10-K. The Yankee difference also results from a 2009 audit adjustment to its separate financial statements. That adjustment was identified upon completion of the Yankee 2009 audit in December 2010. The adjustments will be reflected in 2010 activity.
93
Table of Contents
GREAT LAKES DREDGE & DOCK CORPORATION AND SUBSIDIARIES
CONDENSED CONSOLIDATING BALANCE SHEET
AS OF DECEMBER 31, 2009
(In thousands)
| Subsidiary Guarantors | Non-Guarantor Subsidiary |
GLDD Corporation |
Eliminations | Consolidated Totals |
||||||||||||||||||||||||
| 100%-Owned | NASDI | Yankee | ||||||||||||||||||||||||||
| ASSETS |
||||||||||||||||||||||||||||
| CURRENT ASSETS: |
||||||||||||||||||||||||||||
| Cash and cash equivalents |
$ | 2,834 | $ | 194 | $ | 213 | $ | 9 | $ | — | $ | — | $ | 3,250 | ||||||||||||||
| Accounts receivable—net |
142,080 | 10,194 | 1,627 | — | — | — | 153,901 | |||||||||||||||||||||
| Receivables from affiliates |
4,558 | — | 1,918 | 2,743 | 17,881 | (27,100 | ) | — | ||||||||||||||||||||
| Contract revenues in excess of billings |
25,560 | 2,444 | 42 | — | — | (42 | ) | 28,004 | ||||||||||||||||||||
| Inventories |
29,192 | — | — | — | — | — | 29,192 | |||||||||||||||||||||
| Prepaid expenses |
2,363 | 80 | — | — | 201 | — | 2,644 | |||||||||||||||||||||
| Other current assets |
9,123 | 49 | 38 | — | 6,235 | — | 15,445 | |||||||||||||||||||||
| Total current assets |
215,710 | 12,961 | 3,838 | 2,752 | 24,317 | (27,142 | ) | 232,436 | ||||||||||||||||||||
| PROPERTY AND EQUIPMENT—Net |
281,520 | 9,187 | 450 | — | — | — | 291,157 | |||||||||||||||||||||
| GOODWILL |
76,575 | 21,224 | 250 | — | — | — | 98,049 | |||||||||||||||||||||
| OTHER INTANGIBLE ASSETS—Net |
360 | 279 | 398 | — | — | — | 1,037 | |||||||||||||||||||||
| INVESTMENTS IN SUBSIDIARIES |
27,094 | — | — | — | 490,191 | (517,285 | ) | — | ||||||||||||||||||||
| NOTES RECEIVABLE FROM AFFILIATES |
61 | — | — | — | — | (61 | ) | — | ||||||||||||||||||||
| INVENTORIES—Noncurrent |
27,662 | — | — | — | — | — | 27,662 | |||||||||||||||||||||
| INVESTMENTS IN JOINT VENTURES |
7,943 | — | — | — | — | — | 7,943 | |||||||||||||||||||||
| OTHER ASSETS |
2,074 | — | — | — | 5,509 | (441 | ) | 7,142 | ||||||||||||||||||||
| TOTAL |
$ | 638,999 | $ | 43,651 | $ | 4,936 | $ | 2,752 | $ | 520,017 | $ | (544,929 | ) | $ | 665,426 | |||||||||||||
| LIABILITIES AND EQUITY |
||||||||||||||||||||||||||||
| CURRENT LIABILITIES: |
||||||||||||||||||||||||||||
| Accounts payable |
$ | 75,765 | $ | 7,623 | $ | 395 | $ | — | $ | — | $ | — | $ | 83,783 | ||||||||||||||
| Payables to affiliates |
15,300 | 9,084 | 2,758 | — | — | (27,142 | ) | — | ||||||||||||||||||||
| Accrued expenses |
26,597 | 1,457 | 306 | — | 2,905 | — | 31,265 | |||||||||||||||||||||
| Billings in excess of contract revenues |
23,910 | 791 | 200 | — | — | — | 24,901 | |||||||||||||||||||||
| Current portion of equipment debt |
— | 1,200 | — | — | — | — | 1,200 | |||||||||||||||||||||
| Total current liabilities |
141,572 | 20,155 | 3,659 | — | 2,905 | (27,142 | ) | 141,149 | ||||||||||||||||||||
| REVOLVING CREDIT FACILITY |
— | — | — | — | 11,000 | — | 11,000 | |||||||||||||||||||||
| 7 3/4% SENIOR SUBORDINATED NOTES |
— | — | — | — | 175,000 | — | 175,000 | |||||||||||||||||||||
| NOTES PAYABLE TO AFFILIATES |
— | 61 | — | — | — | (61 | ) | — | ||||||||||||||||||||
| DEFERRED INCOME TAXES |
2 | — | — | — | 82,081 | (441 | ) | 81,642 | ||||||||||||||||||||
| OTHER |
7,234 | 370 | — | — | 4,482 | — | 12,086 | |||||||||||||||||||||
| Total liabilities |
148,808 | 20,586 | 3,659 | — | 275,468 | (27,644 | ) | 420,877 | ||||||||||||||||||||
| Total Great Lakes Dredge & Dock Corporation Equity |
490,191 | 23,065 | 1,277 | 2,752 | 245,788 | (517,285 | ) | 245,788 | ||||||||||||||||||||
| NONCONTROLLING INTERESTS |
— | — | — | — | (1,239 | ) | — | (1,239 | ) | |||||||||||||||||||
| TOTAL EQUITY |
490,191 | 23,065 | 1,277 | 2,752 | 244,549 | (517,285 | ) | 244,549 | ||||||||||||||||||||
| TOTAL |
$ | 638,999 | $ | 43,651 | $ | 4,936 | $ | 2,752 | $ | 520,017 | $ | (544,929 | ) | $ | 665,426 | |||||||||||||
94
Table of Contents
GREAT LAKES DREDGE & DOCK CORPORATION AND SUBSIDIARIES
CONDENSED CONSOLIDATING BALANCE SHEET
AS OF DECEMBER 31, 2008
(In thousands)
| Subsidiary Guarantors | Non-Guarantor Subsidiary |
GLDD Corporation |
Eliminations | Consolidated Totals |
||||||||||||||||||||
| 100%-Owned | NASDI | |||||||||||||||||||||||
| ASSETS |
||||||||||||||||||||||||
| CURRENT ASSETS: |
||||||||||||||||||||||||
| Cash and cash equivalents |
$ | 10,357 | $ | 116 | $ | 5 | $ | — | $ | — | $ | 10,478 | ||||||||||||
| Accounts receivable—net |
110,908 | 9,712 | — | — | — | 120,620 | ||||||||||||||||||
| Receivables from affiliates |
15,372 | — | 2,748 | 11,107 | (29,227 | ) | — | |||||||||||||||||
| Contract revenues in excess of billings |
24,453 | 6,463 | — | — | — | 30,916 | ||||||||||||||||||
| Inventories |
28,666 | — | — | — | — | 28,666 | ||||||||||||||||||
| Prepaid expenses |
2,877 | — | — | 1,807 | — | 4,684 | ||||||||||||||||||
| Other current assets |
13,423 | — | — | 8,099 | (528 | ) | 20,994 | |||||||||||||||||
| Total current assets |
206,056 | 16,291 | 2,753 | 21,013 | (29,755 | ) | 216,358 | |||||||||||||||||
| PROPERTY AND EQUIPMENT—Net |
287,614 | 9,271 | — | — | — | 296,885 | ||||||||||||||||||
| GOODWILL |
76,575 | 21,224 | — | — | — | 97,799 | ||||||||||||||||||
| OTHER INTANGIBLE ASSETS—Net |
502 | 429 | — | — | — | 931 | ||||||||||||||||||
| INVESTMENTS IN SUBSIDIARIES |
33,380 | — | — | 502,722 | (536,102 | ) | — | |||||||||||||||||
| INVENTORIES—Noncurrent |
38,024 | — | — | — | — | 38,024 | ||||||||||||||||||
| INVESTMENTS IN JOINT VENTURES |
8,949 | — | — | — | — | 8,949 | ||||||||||||||||||
| OTHER ASSETS |
1,697 | — | — | 5,512 | — | 7,209 | ||||||||||||||||||
| TOTAL |
$ | 652,797 | $ | 47,215 | $ | 2,753 | $ | 529,247 | $ | (565,857 | ) | $ | 666,155 | |||||||||||
| LIABILITIES AND EQUITY |
||||||||||||||||||||||||
| CURRENT LIABILITIES: |
||||||||||||||||||||||||
| Accounts payable |
$ | 68,955 | $ | 7,908 | $ | — | $ | (1 | ) | $ | — | $ | 76,862 | |||||||||||
| Payables to affiliates |
5,644 | 1,738 | — | — | (7,382 | ) | — | |||||||||||||||||
| Accrued expenses |
25,604 | 3,371 | — | 1,995 | (528 | ) | 30,442 | |||||||||||||||||
| Billings in excess of contract revenues |
18,938 | 844 | — | — | — | 19,782 | ||||||||||||||||||
| Current portion of equipment debt |
— | 1,553 | — | — | — | 1,553 | ||||||||||||||||||
| Total current liabilities |
119,141 | 15,414 | — | 1,994 | (7,910 | ) | 128,639 | |||||||||||||||||
| REVOLVING CREDIT FACILITY |
— | — | — | 41,500 | — | 41,500 | ||||||||||||||||||
| 7 3/4% SENIOR SUBORDINATED NOTES |
— | — | — | 175,000 | — | 175,000 | ||||||||||||||||||
| NOTES PAYABLE TO AFFILIATES |
21,845 | — | — | — | (21,845 | ) | — | |||||||||||||||||
| DEFERRED INCOME TAXES |
738 | — | — | 80,266 | — | 81,004 | ||||||||||||||||||
| OTHER |
7,518 | 1,174 | — | 3,207 | — | 11,899 | ||||||||||||||||||
| Total liabilities |
149,242 | 16,588 | — | 301,967 | (29,755 | ) | 438,042 | |||||||||||||||||
| Total Great Lakes Dredge & Dock Corporation Equity |
502,722 | 30,627 | 2,753 | 227,280 | (536,102 | ) | 227,280 | |||||||||||||||||
| NONCONTROLLING INTERESTS |
833 | — | — | — | — | 833 | ||||||||||||||||||
| TOTAL EQUITY |
503,555 | 30,627 | 2,753 | 227,280 | (536,102 | ) | 228,113 | |||||||||||||||||
| TOTAL |
$ | 652,797 | $ | 47,215 | $ | 2,753 | $ | 529,247 | $ | (565,857 | ) | $ | 666,155 | |||||||||||
95
Table of Contents
GREAT LAKES DREDGE & DOCK CORPORATION AND SUBSIDIARIES
CONDENSED CONSOLIDATING STATEMENT OF OPERATIONS
FOR THE YEAR ENDED DECEMBER 31, 2009
(In thousands)
| Subsidiary Guarantors | Non-Guarantor Subsidiary |
GLDD Corporation |
Eliminations | Consolidated Totals |
||||||||||||||||||||||||
| 100%-Owned | NASDI | Yankee | ||||||||||||||||||||||||||
| CONTRACT REVENUES |
$ | 574,311 | $ | 44,245 | $ | 7,776 | $ | — | $ | — | $ | (4,088 | ) | $ | 622,244 | |||||||||||||
| COSTS OF CONTRACT REVENUES |
(485,337 | ) | (45,466 | ) | (7,240 | ) | — | (45 | ) | 4,088 | (534,000 | ) | ||||||||||||||||
| GROSS PROFIT (LOSS) |
88,974 | (1,221 | ) | 536 | — | (45 | ) | — | 88,244 | |||||||||||||||||||
| OPERATING EXPENSES |
||||||||||||||||||||||||||||
| General and administrative expenses |
(35,960 | ) | (5,849 | ) | (1,034 | ) | — | (3,150 | ) | — | (45,993 | ) | ||||||||||||||||
| Total operating income (loss) |
53,014 | (7,070 | ) | (498 | ) | — | (3,195 | ) | — | 42,251 | ||||||||||||||||||
| INTEREST EXPENSE (Net) |
280 | (321 | ) | (115 | ) | — | (15,994 | ) | — | (16,150 | ) | |||||||||||||||||
| EQUITY IN EARNINGS (LOSS) OF SUBSIDIARIES |
(8,004 | ) | — | — | — | 47,308 | (39,304 | ) | — | |||||||||||||||||||
| EQUITY IN EARNINGS (LOSS) OF JOINT VENTURE |
(384 | ) | — | — | — | — | — | (384 | ) | |||||||||||||||||||
| INCOME (LOSS) BEFORE INCOME TAXES |
44,906 | (7,391 | ) | (613 | ) | — | 28,119 | (39,304 | ) | 25,717 | ||||||||||||||||||
| INCOME TAX (PROVISION) BENEFIT |
2,402 | — | — | — | (13,385 | ) | — | (10,983 | ) | |||||||||||||||||||
| NET INCOME (LOSS) |
47,308 | (7,391 | ) | (613 | ) | — | 14,734 | (39,304 | ) | 14,734 | ||||||||||||||||||
| NET LOSS ATTRIBUTABLE TO NONCONTROLLING INTERESTS |
— | — | — | — | 2,734 | — | 2,734 | |||||||||||||||||||||
| NET INCOME (LOSS) ATTRIBUTABLE TO GREAT LAKES DREDGE & DOCK CORPORATION |
$ | 47,308 | $ | (7,391 | ) | $ | (613 | ) | $ | — | $ | 17,468 | $ | (39,304 | ) | $ | 17,468 | |||||||||||
96
Table of Contents
GREAT LAKES DREDGE & DOCK CORPORATION AND SUBSIDIARIES
CONDENSED CONSOLIDATING STATEMENT OF OPERATIONS
FOR THE YEAR ENDED DECEMBER 31, 2008
(In thousands)
| Subsidiary Guarantors | Non-Guarantor |
GLDD Corporation |
Eliminations | Consolidated Totals |
||||||||||||||||||||
| 100%-Owned | NASDI | |||||||||||||||||||||||
| CONTRACT REVENUES |
$ | 484,659 | $ | 102,220 | $ | — | $ | — | $ | — | $ | 586,879 | ||||||||||||
| COSTS OF CONTRACT REVENUES |
(427,362 | ) | (90,017 | ) | — | (197 | ) | — | (517,576 | ) | ||||||||||||||
| GROSS PROFIT |
57,297 | 12,203 | — | (197 | ) | — | 69,303 | |||||||||||||||||
| OPERATING EXPENSES |
||||||||||||||||||||||||
| General and administrative expenses |
(33,288 | ) | (8,198 | ) | (64 | ) | (1,656 | ) | — | (43,206 | ) | |||||||||||||
| Total operating income (loss) |
24,009 | 4,005 | (64 | ) | (1,853 | ) | — | 26,097 | ||||||||||||||||
| INTEREST EXPENSE—Net |
(2 | ) | (1,025 | ) | — | (15,944 | ) | — | (16,971 | ) | ||||||||||||||
| EQUITY IN EARNINGS (LOSS) OF SUBSIDIARIES |
2,887 | — | — | 25,946 | (28,833 | ) | — | |||||||||||||||||
| EQUITY IN EARNINGS (LOSS) OF JOINT VENTURE |
(15 | ) | — | — | — | — | (15 | ) | ||||||||||||||||
| INCOME (LOSS) BEFORE INCOME TAXES |
26,879 | 2,980 | (64 | ) | 8,149 | (28,833 | ) | 9,111 | ||||||||||||||||
| INCOME TAX (PROVISION) BENEFIT |
(933 | ) | (51 | ) | 22 | (2,877 | ) | — | (3,839 | ) | ||||||||||||||
| NET INCOME (LOSS) |
25,946 | 2,929 | (42 | ) | 5,272 | (28,833 | ) | 5,272 | ||||||||||||||||
| NET (INCOME) LOSS ATTRIBUTABLE TO NONCONTROLLING INTEREST |
— | — | — | (293 | ) | — | (293 | ) | ||||||||||||||||
| NET INCOME (LOSS) LOSS ATTRIBUTABLE TO GREAT LAKES DREDGE & DOCK CORPORATION |
$ | 25,946 | $ | 2,929 | $ | (42 | ) | $ | 4,979 | $ | (28,833 | ) | $ | 4,979 | ||||||||||
97
Table of Contents
GREAT LAKES DREDGE & DOCK CORPORATION AND SUBSIDIARIES
CONDENSED CONSOLIDATING STATEMENT OF OPERATIONS
FOR THE YEAR ENDED DECEMBER 31, 2007
(In thousands)
| Subsidiary Guarantors | Non-Guarantor Subsidiary |
GLDD Corporation |
Eliminations | Consolidated Totals |
||||||||||||||||||||
| 100%-Owned | NASDI | |||||||||||||||||||||||
| CONTRACT REVENUES |
$ | 439,838 | $ | 75,923 | $ | — | $ | — | $ | — | $ | 515,761 | ||||||||||||
| COSTS OF CONTRACT REVENUES |
(381,734 | ) | (64,996 | ) | — | (1,084 | ) | — | (447,814 | ) | ||||||||||||||
| GROSS PROFIT |
58,104 | 10,927 | — | (1,084 | ) | — | 67,947 | |||||||||||||||||
| OPERATING EXPENSES |
||||||||||||||||||||||||
| General and administrative expenses |
(30,854 | ) | (6,903 | ) | (70 | ) | (1,140 | ) | — | (38,967 | ) | |||||||||||||
| Total operating income (loss) |
27,250 | 4,024 | (70 | ) | (2,224 | ) | — | 28,980 | ||||||||||||||||
| INTEREST EXPENSE—Net |
(442 | ) | (2,891 | ) | — | (14,129 | ) | — | (17,462 | ) | ||||||||||||||
| EQUITY IN EARNINGS (LOSS) OF SUBSIDIARIES |
179 | — | — | 29,016 | (29,195 | ) | — | |||||||||||||||||
| EQUITY IN EARNINGS (LOSS) OF JOINT VENTURE |
1,993 | — | — | — | — | 1,993 | ||||||||||||||||||
| INCOME (LOSS) BEFORE INCOME TAXES |
28,980 | 1,133 | (70 | ) | 12,663 | (29,195 | ) | 13,511 | ||||||||||||||||
| INCOME TAX (PROVISION) BENEFIT |
36 | (909 | ) | 25 | (5,551 | ) | — | (6,399 | ) | |||||||||||||||
| NET INCOME (LOSS) |
29,016 | 224 | (45 | ) | 7,112 | (29,195 | ) | 7,112 | ||||||||||||||||
| NET (INCOME) LOSS ATTRIBUTABLE TO NONCONTROLLING INTEREST |
— | — | — | (56 | ) | — | (56 | ) | ||||||||||||||||
| NET INCOME (LOSS) LOSS ATTRIBUTABLE TO GREAT LAKES DREDGE & DOCK CORPORATION |
$ | 29,016 | $ | 224 | $ | (45 | ) | $ | 7,056 | $ | (29,195 | ) | $ | 7,056 | ||||||||||
98
Table of Contents
GREAT LAKES DREDGE & DOCK CORPORATION AND SUBSIDIARIES
CONDENSED CONSOLIDATING STATEMENT OF CASH FLOWS
FOR THE YEAR ENDED DECEMBER 31, 2009
(In thousands)
| Subsidiary Guarantors | Non-Guarantor Subsidiary |
GLDD Corporation |
Eliminations | Consolidated Totals |
||||||||||||||||||||||||
| 100%-Owned | NASDI | Yankee | ||||||||||||||||||||||||||
| OPERATING ACTIVITIES— |
||||||||||||||||||||||||||||
| Net cash flows provided by (used in) operating activities |
$ | 86,641 | $ | (3,695 | ) | $ | (2,545 | ) | $ | — | $ | (26,403 | ) | $ | — | $ | 53,998 | |||||||||||
| INVESTING ACTIVITIES: |
||||||||||||||||||||||||||||
| Purchases of property and equipment |
(22,563 | ) | (2,103 | ) | — | — | — | — | (24,666 | ) | ||||||||||||||||||
| Dispositions of property and equipment |
615 | 413 | — | — | — | — | 1,028 | |||||||||||||||||||||
| Acquisition of controlling interest in Yankee Environmental Services |
(1,229 | ) | — | (1,891 | ) | — | — | 1,891 | (1,229 | ) | ||||||||||||||||||
| Net cash flows used in investing activities |
(23,177 | ) | (1,690 | ) | (1,891 | ) | — | — | 1,891 | (24,867 | ) | |||||||||||||||||
| FINANCING ACTIVITIES: |
||||||||||||||||||||||||||||
| Borrowings under revolving loans |
— | — | — | — | 158,877 | — | 158,877 | |||||||||||||||||||||
| Repayments of revolving loans |
— | — | — | — | (189,377 | ) | — | (189,377 | ) | |||||||||||||||||||
| Dividends paid |
— | — | — | — | (3,992 | ) | — | (3,992 | ) | |||||||||||||||||||
| Members’ capital contribution to acquire assets of Yankee |
— | — | 1,891 | — | — | (1,891 | ) | — | ||||||||||||||||||||
| Net change in accounts with affiliates |
(71,064 | ) | 7,407 | 2,758 | 4 | 60,895 | — | — | ||||||||||||||||||||
| Repayments of long-term debt |
(1 | ) | (1,773 | ) | — | — | — | — | (1,774 | ) | ||||||||||||||||||
| Repayment of capital lease debt |
(93 | ) | — | — | — | — | — | (93 | ) | |||||||||||||||||||
| Distributions from subsidiaries |
171 | (171 | ) | — | — | — | — | — | ||||||||||||||||||||
| Net cash flows provided by (used in) financing activities |
(70,987 | ) | 5,463 | 4,649 | 4 | 26,403 | (1,891 | ) | (36,359 | ) | ||||||||||||||||||
| NET CHANGE IN CASH AND EQUIVALENTS |
(7,523 | ) | 78 | 213 | 4 | — | — | (7,228 | ) | |||||||||||||||||||
| CASH AND CASH EQUIVALENTS— Beginning of year |
10,357 | 116 | — | 5 | — | — | 10,478 | |||||||||||||||||||||
| CASH AND CASH EQUIVALENTS— |
$ | 2,834 | $ | 194 | $ | 213 | $ | 9 | $ | — | $ | — | $ | 3,250 | ||||||||||||||
99
Table of Contents
GREAT LAKES DREDGE & DOCK CORPORATION AND SUBSIDIARIES
CONDENSED CONSOLIDATING STATEMENT OF CASH FLOWS
FOR THE YEAR ENDED DECEMBER 31, 2008
(In thousands)
| Subsidiary Guarantors | Non-Guarantor Subsidiary |
GLDD Corporation |
Eliminations | Consolidated Totals |
||||||||||||||||||||
| 100%-Owned | NASDI | |||||||||||||||||||||||
| OPERATING ACTIVITIES— |
||||||||||||||||||||||||
| Net cash flows provided by (used in) operating activities |
$ | 34,018 | $ | 4,802 | $ | (42 | ) | $ | (23,973 | ) | $ | — | $ | 14,805 | ||||||||||
| INVESTING ACTIVITIES: |
||||||||||||||||||||||||
| Purchases of property and equipment |
(43,108 | ) | (1,376 | ) | — | — | — | (44,484 | ) | |||||||||||||||
| Dispositions of property and equipment |
17,422 | 23 | — | — | — | 17,445 | ||||||||||||||||||
| Changes in restricted cash |
787 | — | — | — | — | 787 | ||||||||||||||||||
| Purchase NASDI minority interest shares |
(5 | ) | — | — | — | — | (5 | ) | ||||||||||||||||
| Net cash flows used in investing activities |
(24,904 | ) | (1,353 | ) | — | — | — | (26,257 | ) | |||||||||||||||
| FINANCING ACTIVITIES: |
||||||||||||||||||||||||
| Borrowings under revolving loans |
— | — | — | 222,443 | — | 222,443 | ||||||||||||||||||
| Repayments of revolving loans |
— | — | — | (202,443 | ) | — | (202,443 | ) | ||||||||||||||||
| Dividends paid |
(3,981 | ) | — | — | — | — | (3,981 | ) | ||||||||||||||||
| Net change in accounts with affiliates |
(2,439 | ) | (1,581 | ) | 41 | 3,979 | — | — | ||||||||||||||||
| Repayments of long-term debt |
— | (2,148 | ) | — | — | — | (2,148 | ) | ||||||||||||||||
| Repayment of capital lease debt |
(174 | ) | — | — | — | — | (174 | ) | ||||||||||||||||
| Repurchase of preferred and common shares |
— | — | — | (6 | ) | — | (6 | ) | ||||||||||||||||
| Net cash flows provided by (used in) financing activities |
(6,594 | ) | (3,729 | ) | 41 | 23,973 | — | 13,691 | ||||||||||||||||
| NET CHANGE IN CASH AND EQUIVALENTS |
2,520 | (280 | ) | (1 | ) | — | — | 2,239 | ||||||||||||||||
| CASH AND CASH EQUIVALENTS— |
7,837 | 396 | 6 | — | — | 8,239 | ||||||||||||||||||
| CASH AND CASH EQUIVALENTS— |
$ | 10,357 | $ | 116 | $ | 5 | $ | — | $ | — | $ | 10,478 | ||||||||||||
100
Table of Contents
GREAT LAKES DREDGE & DOCK CORPORATION AND SUBSIDIARIES
CONDENSED CONSOLIDATING STATEMENT OF CASH FLOWS
FOR THE YEAR ENDED DECEMBER 31, 2007
(In thousands)
| Subsidiary Guarantors | Non-Guarantor Subsidiary |
GLDD Corporation |
Eliminations | Consolidated Totals |
||||||||||||||||||||
| 100%-Owned | NASDI | |||||||||||||||||||||||
| OPERATING ACTIVITIES— |
||||||||||||||||||||||||
| Net cash flows provided by (used in) operating activities |
$ | 14,964 | $ | 3,078 | $ | (45 | ) | $ | (24,281 | ) | $ | — | $ | (6,284 | ) | |||||||||
| INVESTING ACTIVITIES: |
||||||||||||||||||||||||
| Purchases of property and equipment |
(110,300 | ) | (688 | ) | — | — | — | (110,988 | ) | |||||||||||||||
| Dispositions of property and equipment |
28,599 | — | — | — | — | 28,599 | ||||||||||||||||||
| Changes in restricted cash |
2,923 | — | — | — | — | 2,923 | ||||||||||||||||||
| Loan to related party |
1,703 | — | — | — | — | 1,703 | ||||||||||||||||||
| Net cash flows used in investing activities |
(77,075 | ) | (688 | ) | — | — | — | (77,763 | ) | |||||||||||||||
| FINANCING ACTIVITIES: |
||||||||||||||||||||||||
| Borrowings under revolving loans |
— | — | — | 184,500 | — | 184,500 | ||||||||||||||||||
| Repayments of revolving loans |
— | — | — | (163,000 | ) | — | (163,000 | ) | ||||||||||||||||
| Net change in accounts with affiliates |
88,781 | (828 | ) | 41 | (88,988 | ) | — | (994 | ) | |||||||||||||||
| Repayments of long-term debt |
(18,104 | ) | (1,581 | ) | — | — | — | (19,685 | ) | |||||||||||||||
| Repayment of capital lease debt |
(1,843 | ) | — | — | — | — | (1,843 | ) | ||||||||||||||||
| Issuance of common shares |
— | — | — | 91,769 | — | 91,769 | ||||||||||||||||||
| Financing fees |
(2,101 | ) | — | — | — | — | (2,101 | ) | ||||||||||||||||
| Net cash flows provided by (used in) financing activities |
66,733 | (2,409 | ) | 41 | 24,281 | — | 88,646 | |||||||||||||||||
| NET CHANGE IN CASH AND EQUIVALENTS |
4,622 | (19 | ) | (4 | ) | — | — | 4,599 | ||||||||||||||||
| CASH AND CASH EQUIVALENTS— |
3,215 | 415 | 10 | — | — | 3,640 | ||||||||||||||||||
| CASH AND CASH EQUIVALENTS— |
$ | 7,837 | $ | 396 | $ | 6 | $ | — | $ | — | $ | 8,239 | ||||||||||||
101
Table of Contents
Great Lakes Dredge & Dock Corporation
Schedule II - Valuation and Qualifying Accounts
For the Years Ended December 31, 2009, 2008 and 2007
(In thousands)
| Additions | ||||||||||||||||||||
| Beginning Balance |
Charged to costs and expenses |
Charged to other accounts |
Deductions | Ending balance |
||||||||||||||||
| Description |
||||||||||||||||||||
| Year ended December 31, 2007 |
||||||||||||||||||||
| Allowances deducted from assets to which they apply: |
||||||||||||||||||||
| Allowances for doubtful accounts |
$ | 757 | $ | 750 | $ | (18 | ) | $ | 1,489 | |||||||||||
| Year ended December 31, 2008 |
||||||||||||||||||||
| Allowances deducted from assets to which they apply: |
||||||||||||||||||||
| Allowances for doubtful accounts |
$ | 1,489 | $ | 0 | $ | (239 | ) | $ | 1,250 | |||||||||||
| Year ended December 31, 2009 |
||||||||||||||||||||
| Allowances deducted from assets to which they apply: |
||||||||||||||||||||
| Allowances for doubtful accounts |
$ | 1,250 | $ | 69 | $ | (69 | ) | $ | 1,250 | |||||||||||
NASDI, LLC
Schedule II - Valuation and Qualifying Accounts
For the Years Ended December 31, 2009, 2008 and 2007
(In thousands)
| Additions | ||||||||||||||||||||
| Beginning Balance |
Charged to costs and expenses |
Charged to other accounts |
Deductions | Ending balance |
||||||||||||||||
| Description |
||||||||||||||||||||
| Year ended December 31, 2007 |
||||||||||||||||||||
| Allowances deducted from assets to which they apply: |
||||||||||||||||||||
| Allowances for doubtful accounts |
$ | 757 | — | — | $ | (18 | ) | $ | 739 | |||||||||||
| Year ended December 31, 2008 |
||||||||||||||||||||
| Allowances deducted from assets to which they apply: |
||||||||||||||||||||
| Allowances for doubtful accounts |
$ | 739 | — | — | $ | (239 | ) | $ | 500 | |||||||||||
| Year ended December 31, 2009 |
||||||||||||||||||||
| Allowances deducted from assets to which they apply: |
||||||||||||||||||||
| Allowances for doubtful accounts |
$ | 500 | $ | 69 | — | $ | (69 | ) | $ | 500 | ||||||||||
102
Table of Contents
NASDI, LLC
| Page | ||||
| F-2 | ||||
| FINANCIAL STATEMENTS AS OF DECEMBER 31, 2009 AND 2008, AND FOR THE YEARS ENDED DECEMBER 31, 2009, 2008 AND 2007 |
||||
| F-3 | ||||
| F-4 | ||||
| F-5 | ||||
| F-6 | ||||
| F-7 | ||||
F-1
Table of Contents
REPORT OF INDEPENDENT REGISTERED PUBLIC ACCOUNTING FIRM
To the Board of Managers
NASDI, LLC
Waltham, Massachusetts
We have audited the accompanying balance sheets of NASDI, LLC (formerly, North American Site Developers, Inc.) (the “Company”) as of December 31, 2009 and 2008, and the related statements of operations, members’ equity, and cash flows for each of the three years in the period ended December 31, 2009. Our audits also included the financial statement schedule listed in the Index at Item 15. These financial statements and financial statement schedule are the responsibility of the Company’s management. Our responsibility is to express an opinion on these financial statements and financial statement schedule based on our audits.
We conducted our audits in accordance with auditing standards of the Public Company Accounting Oversight Board (United States). Those standards require that we plan and perform the audit to obtain reasonable assurance about whether the financial statements are free of material misstatement. The Company is not required to have, nor were we engaged to perform, an audit of its internal control over financial reporting. Our audits included consideration of internal control over financial reporting as a basis for designing audit procedures that are appropriate in the circumstances, but not for the purpose of expressing an opinion on the effectiveness of the Company’s internal control over financial reporting. Accordingly, we express no such opinion. An audit also includes examining, on a test basis, evidence supporting the amounts and disclosures in the financial statements, assessing the accounting principles used and significant estimates made by management, as well as evaluating the overall financial statement presentation. We believe that our audits provide a reasonable basis for our opinion.
In our opinion, such financial statements present fairly, in all material respects, the financial position of the Company as of December 31, 2009 and 2008, and the results of its operations and its cash flows for each of the three years in the period ended December 31, 2009, in conformity with accounting principles generally accepted in the United States of America. Also, in our opinion, such financial statement schedule, when considered in relation to the basic financial statements taken as a whole, presents fairly, in all material respects, the information set forth therein.
As indicated in Note 1 to the financial statements, on April 30, 2008, Great Lakes Dredge & Dock Corporation (“GLDD”) acquired the 15% of North American Site Developers, Inc. it did not already own, and then converted the Company into a limited liability company, NASDI, LLC. Accordingly, the financial information included in the accompanying financial statements for the periods prior to April 30, 2008 represents the financial information of North American Site Developers, Inc.
Also as indicated in Note 1 to the financial statements, the Company is a subsidiary of GLDD. The accompanying financial statements have been prepared from the records maintained by the Company and GLDD and may not necessarily be indicative of the conditions that would have existed or the results of the operations if the Company had been operated as an unaffiliated company. Portions of certain income and expenses represent allocations made from GLDD’s income and expenses applicable to GLDD as a whole. GLDD has provided a letter to the Company indicating that it will not demand the Company repay the amounts payable to GLDD prior to January 2, 2012 even though such payables are due on demand.
/s/ Deloitte & Touche LLP
Chicago, Illinois
January 7, 2011
F-2
Table of Contents
NASDI, LLC
DECEMBER 31, 2009 AND 2008
(in thousands)
| 2009 | 2008 | |||||||
| ASSETS |
||||||||
| CURRENT ASSETS: |
||||||||
| Cash and cash equivalents |
$ | 194 | $ | 116 | ||||
| Accounts receivable - net |
10,194 | 9,712 | ||||||
| Contract revenues in excess of billings |
1,989 | 6,463 | ||||||
| Prepaid expenses and other current assets |
129 | — | ||||||
| Total current assets |
12,506 | 16,291 | ||||||
| PROPERTY AND EQUIPMENT - Net |
9,187 | 9,271 | ||||||
| GOODWILL |
21,224 | 21,224 | ||||||
| OTHER INTANGIBLE ASSETS - Net |
279 | 429 | ||||||
| TOTAL |
$ | 43,196 | $ | 47,215 | ||||
| LIABILITIES AND MEMBERS’ EQUITY |
||||||||
| CURRENT LIABILITIES: |
||||||||
| Accounts payable |
$ | 7,623 | $ | 7,908 | ||||
| Payables to parent |
8,078 | 1,738 | ||||||
| Payables to affiliate |
1,067 | — | ||||||
| Accrued liabilities |
1,457 | 3,371 | ||||||
| Billings in excess of contract revenues |
791 | 844 | ||||||
| Current portion of equipment debt |
1,200 | 1,553 | ||||||
| Total current liabilities |
20,216 | 15,414 | ||||||
| OTHER |
370 | 1,174 | ||||||
| Total liabilities |
20,586 | 16,588 | ||||||
| COMMITMENTS AND CONTINGENCIES (NOTE 14) |
||||||||
| MEMBERS’ EQUITY |
22,610 | 30,627 | ||||||
| TOTAL |
$ | 43,196 | $ | 47,215 | ||||
See Notes to Financial Statements
F-3
Table of Contents
NASDI, LLC
YEARS ENDED DECEMBER 31, 2009, 2008, and 2007
(in thousands)
| 2009 | 2008 | 2007 | ||||||||||
| CONTRACT REVENUES |
$ | 43,790 | $ | 102,220 | $ | 75,923 | ||||||
| COSTS OF CONTRACT REVENUES |
45,466 | 90,017 | 64,996 | |||||||||
| GROSS PROFIT (LOSS) |
(1,676 | ) | 12,203 | 10,927 | ||||||||
| OPERATING EXPENSES: |
||||||||||||
| General and administrative expenses |
5,698 | 7,899 | 6,782 | |||||||||
| Amortization of intangible assets |
151 | 299 | 121 | |||||||||
| Total operating expenses |
5,849 | 8,198 | 6,903 | |||||||||
| OPERATING INCOME (LOSS): |
(7,525 | ) | 4,005 | 4,024 | ||||||||
| OTHER INCOME (EXPENSE) |
||||||||||||
| Interest income |
— | 3 | 30 | |||||||||
| Interest expense |
(104 | ) | (193 | ) | (176 | ) | ||||||
| Interest expense to related party |
(217 | ) | (835 | ) | (2,745 | ) | ||||||
| Total other expense |
(321 | ) | (1,025 | ) | (2,891 | ) | ||||||
| INCOME (LOSS) BEFORE INCOME TAXES |
(7,846 | ) | 2,980 | 1,133 | ||||||||
| INCOME TAX EXPENSE |
— | 51 | 909 | |||||||||
| NET (LOSS) INCOME |
$ | (7,846 | ) | $ | 2,929 | $ | 224 | |||||
See Notes to Financial Statements
F-4
Table of Contents
NASDI, LLC
YEARS ENDED DECEMBER 31, 2009, 2008 and 2007
(in thousands)
| Common Stock |
Members’ Equity |
Additional Paid-In Capital |
Accumulated Deficit |
Total | ||||||||||||||||
| BALANCE — January 1, 2007 |
$ | — | $ | 3,655 | $ | (5,186 | ) | $ | (1,531 | ) | ||||||||||
| Net income |
— | — | 224 | 224 | ||||||||||||||||
| BALANCE — December 31, 2007 |
— | 3,655 | (4,962 | ) | (1,307 | ) | ||||||||||||||
| Conversion of debt from affiliate into equity (Note 1) |
27,242 | — | 27,242 | |||||||||||||||||
| Acquisition of remaining 15% interest and conversion to a limited liability company (Note 1) |
— | $ | 30,305 | (30,897 | ) | 2,355 | 1,763 | |||||||||||||
| Net income |
322 | — | 2,607 | 2,929 | ||||||||||||||||
| BALANCE — December 31, 2008 |
30,627 | — | — | 30,627 | ||||||||||||||||
| Distributions |
(171 | ) | (171 | ) | ||||||||||||||||
| Net loss |
(7,846 | ) | — | — | (7,846 | ) | ||||||||||||||
| BALANCE — December 31, 2009 |
$ | 22,610 | $ | — | $ | — | $ | 22,610 | ||||||||||||
See Notes to Financial Statements
F-5
Table of Contents
NASDI, LLC
YEARS ENDED DECEMBER 31, 2009, 2008 AND 2007
(in thousands)
| 2009 | 2008 | 2007 | ||||||||||
| OPERATING ACTIVITIES: |
||||||||||||
| Net (loss) income |
$ | (7,846 | ) | $ | 2,929 | $ | 224 | |||||
| Adjustments to reconcile net (loss) income to net cash (used in) provided by operating activities: |
||||||||||||
| Depreciation and amortization |
2,484 | 2,373 | 1,854 | |||||||||
| Deferred income taxes |
— | (873 | ) | 151 | ||||||||
| Loss (gain) on dispositions of property and equipment |
56 | (12 | ) | (143 | ) | |||||||
| Changes in assets and liabilities: |
||||||||||||
| Accounts receivable |
(482 | ) | 9,633 | (9,122 | ) | |||||||
| Accounts receivable - related party |
— | — | 1,704 | |||||||||
| Contract revenues in excess of billings |
4,474 | (3,169 | ) | (335 | ) | |||||||
| Prepaid expenses and other current assets |
(129 | ) | 640 | (114 | ) | |||||||
| Accounts payable and accrued liabilities |
(2,199 | ) | (4,723 | ) | 8,123 | |||||||
| Billings in excess of contract revenues |
(53 | ) | (97 | ) | (86 | ) | ||||||
| Other noncurrent assets and liabilities |
— | (1,899 | ) | 822 | ||||||||
| Net cash (used in) provided by operating activities |
(3,695 | ) | 4,802 | 3,078 | ||||||||
| INVESTING ACTIVITIES: |
||||||||||||
| Purchases of property and equipment |
(2,103 | ) | (1,376 | ) | (688 | ) | ||||||
| Dispositions of property and equipment |
413 | 23 | — | |||||||||
| Net cash used in investing activities |
(1,690 | ) | (1,353 | ) | (688 | ) | ||||||
| FINANCING ACTIVITIES: |
||||||||||||
| Change in payable to affiliates |
7,407 | (1,581 | ) | (828 | ) | |||||||
| Repayments of equipment debt |
(1,773 | ) | (2,148 | ) | (1,581 | ) | ||||||
| Distributions |
(171 | ) | — | — | ||||||||
| Net cash provided by (used in) financing activities |
5,463 | (3,729 | ) | (2,409 | ) | |||||||
| Net change in cash and cash equivalents |
78 | (280 | ) | (19 | ) | |||||||
| Cash and cash equivalents - Beginning of year |
116 | 396 | 415 | |||||||||
| Cash and cash equivalents - End of year |
$ | 194 | $ | 116 | $ | 396 | ||||||
| SUPPLEMENTAL DISCLOSURES OF CASH FLOW INFORMATION: |
||||||||||||
| Cash paid for interest |
$ | 104 | $ | 193 | $ | 176 | ||||||
| Cash paid for income taxes |
$ | — | $ | 835 | $ | 480 | ||||||
| NONCASH INVESTING ACTIVITY |
||||||||||||
| Property and equipment purchased on equipment notes |
$ | 615 | $ | 2,213 | $ | 1,998 | ||||||
| NONCASH FINANCING ACTIVITY |
||||||||||||
| Non cash conversion of debt to equity |
$ | — | $ | 27,242 | $ | — | ||||||
See Notes to Financial Statements
F-6
Table of Contents
NOTES TO FINANCIAL STATEMENTS
AS OF DECEMBER 31, 2009 AND 2008 AND FOR THE
YEARS ENDED DECEMBER 31, 2009, 2008, AND 2007
(Dollars in thousands)
| 1. | NATURE OF BUSINESS AND REMAINING INTEREST ACQUISITION |
Organization — NASDI, LLC (the “Company”) is a demolition service provider located in the Boston, Massachusetts area. The Company’s principal services consist of interior and exterior demolition of commercial and industrial buildings, salvage and recycling of related materials, and removal of hazardous substances and materials.
NASDI Holdings Corporation (“NASDI Holdings”), a wholly owned subsidiary of Great Lakes Dredge & Dock Corporation (“GLDD”), is the owner of 100% of the Class A interests, which provide a $28,000 liquidation preference with respect to proceeds upon disposition of the Company. NASDI Holdings also owns 65% of the Class B interests, with the remaining 35% owned by Christopher A. Berardi. The holders of Class B interests are entitled to receive periodic distributions of future profits based on available cash flows from operations on a pro rata basis in proportion to their percentage ownership interest.
The accompanying financial statements have been prepared from the records maintained by the Company and GLDD and may not necessarily be indicative of the conditions that would have existed or the results of the operations if the Company had been operated as an unaffiliated company. Portions of certain income and expenses represent allocations made from GLDD’s income and expenses applicable to GLDD as a whole. GLDD has provided a letter to the Company indicating that it will not demand the Company repay the amounts payable to GLDD prior to January 2, 2012 even though such payables are due on demand.
Remaining 15% Interest Acquisition by GLDD — On April 30, 2008, GLDD acquired the remaining 15% interest in North American Site Developers, Inc. (“NASDI Inc.”), which it did not previously own, from Christopher A. Berardi, then President of NASDI Inc. Following the acquisition of this remaining interest, GLDD converted $27,242 of debt owed to GLDD by NASDI Inc. into equity. Additionally, the Company also entered into a series of transactions for the purpose of restructuring the Company’s arrangements with Mr. Berardi. As a result of these transactions, the operations of NASDI Inc. were contributed into the Company, a newly formed Delaware limited liability company, which then issued the Class A and Class B member interests. Accordingly, the operations for the period from January 1, 2007 to April 30, 2008 reflected in these financial statements are of NASDI, Inc., the predecessor company. Also, throughout this same period, NASDI, Inc. had 1,000 shares of common stock (par value of $0.01 per share) authorized, issued and outstanding.
Pursuant to the terms of the Company’s Limited Liability Company Agreement, GLDD has the ability to call Mr. Berardi’s 35% interest upon Mr. Berardi’s termination of employment, upon a change in control related to GLDD or any time after December 31, 2010. The call payment is based on a formula that considers the Company’s average annual EBITDA for a two-year period, as adjusted for the Class A liquidation preference and outstanding indebtedness of the Company. The call payment is limited, in certain situations, to a maximum of $1,500.
GLDD, through its NASDI Holdings subsidiary, also entered into an employment agreement with Mr. Berardi that establishes the terms of Mr. Berardi’s salary and benefits as an employee of NASDI Holdings. Additionally, in the event of a sale of all or a material portion of the Company, Mr. Berardi is entitled to a cash payment equal to 35% of the proceeds received by GLDD in connection with the sale of the Company to a third party, but such payment shall not exceed $9,800.
F-7
Table of Contents
The acquisition of the remaining interest was accounted for as a purchase with a purchase price of $1,939 equal to the fair value of consideration received by Mr. Berardi, including the 35% interest in Class B shares, a cash payment of $5 and the fair value of future obligations of GLDD to Mr. Berardi. Accordingly, the assets and liabilities associated with this 15% interest were adjusted to their estimated fair values. A summary of the allocation of purchase price, which was pushed down to the assets and liabilities of the Company, is as follows:
| Property, plant and equipment |
$ | (28) | ||
| Intangible assets |
365 | |||
| Goodwill |
1,574 | |||
| Other assets and liabilities |
28 | |||
| Total |
$ | 1,939 | ||
Correction of 2008 Statement of Members’ Equity — The Company has corrected errors in the presentation of Additional Paid-in Capital and Accumulated Deficit as of January 1, 2008 and the line item titled “Acquisition of remaining 15% interest and conversion to a limited liability company” in its 2008 Statement of Members’ Equity which resulted from an error in the accounting for the Company’s equity balances on a standalone basis. The effect of the correction was to increase Additional Paid-in Capital and increase the Accumulated Deficit by $1,357 as of January 1, 2008 and to change the amounts reflected in the Additional Paid-in Capital and Accumulated Deficit columns in the line item titled “Acquisition of remaining 15% interest and conversion to a limited liability company” in the 2008 statement of members’ equity by an equal offsetting amount. The correction had no effect on total equity for any of the periods presented.
| 2. | SUMMARY OF SIGNIFICANT ACCOUNTING POLICIES |
Use of Estimates — The preparation of financial statements in conformity with accounting principles generally accepted in the United States of America (“GAAP”) requires management to make estimates and assumptions that affect certain reported amounts and disclosures. Accordingly, actual results could differ from those estimates.
Revenues and Cost Recognition on Contracts — The majority of the Company’s contracts for demolition services are fixed-price contracts, with others managed as time and materials or equipment rental projects. Substantially all of the Company’s contract revenues are recognized under the percentage-of-completion method, using a cost-to-cost method to measure the extent of progress toward completion. Contract revenues are adjusted to reflect the gross profit percentage expected to be achieved upon ultimate completion of each project. Revenue for salvage is recognized as realized. Provisions for estimated losses on contracts in progress are made in the period in which such losses are determined. Claims for additional compensation due to the Company are not recognized in contract revenues until such claims are settled. Billings on contracts are generally submitted after verification with the customers of physical progress and may not match the timing of revenue recognition. The difference between amounts billed and recognized as revenue is reflected in the balance sheet as either contract revenues in excess of billings or billings in excess of contract revenues. Change orders are often negotiated when a change in conditions from the original contract specifications is encountered, necessitating a change in project performance methodology. Such change orders are considered changes in the scope of the original projects to which they relate and the project estimates are adjusted accordingly.
The components of costs of contract revenues include labor, equipment (including depreciation, maintenance, insurance, and rentals), subcontracts, and project overhead. Hourly labor is generally hired on a project-by-project basis. Costs of contract revenues vary significantly depending on the type and location of work performed. Contract revenues include revenues from salvage for the years ended December 31, 2009, 2008, and 2007 totaling $5,235, $10,973, and $6,904, respectively.
Classification of Current Assets and Liabilities — The Company includes in current assets and liabilities amounts realizable and payable in the normal course of contract completion, unless completion of such contracts extends significantly beyond one year.
Cash and Cash Equivalents — The Company considers all highly liquid investments purchased with an initial maturity of three months or less to be cash equivalents.
F-8
Table of Contents
Accounts Receivable — Net — Accounts receivable represent amounts due or billable under the terms of contracts with customers, including amounts related to retainage. The Company anticipates collection of retainage within one year, and accordingly presents retainage as a current asset. The Company provides an allowance for estimated uncollectible receivables when events or conditions indicate that amounts outstanding are not recoverable.
Property and Equipment — Net — Capital additions, improvements, and major renewals are classified as property and equipment and are carried at depreciated cost. Maintenance and repairs that do not significantly extend the useful lives of the assets or enhance the capabilities of such assets are charged to earnings as incurred. Depreciation is recorded over the estimated useful lives of property and equipment using the straight-line method and the mid-year depreciation convention. The estimated useful lives by class of assets are:
| Class |
Age (years) | |||
| Leasehold improvements |
10 | |||
| Furniture and fixtures |
5-10 | |||
| Vehicles, dozers, excavators and other operating equipment and systems |
3-10 | |||
Goodwill and Other Intangible Assets — Goodwill represents the excess of cost over fair value. Other identifiable intangibles mainly represent developed technology and databases, customer relationships, and customer contracts acquired in business combinations and are being amortized over a 7 to 10-year period. Goodwill is tested annually for impairment in the third quarter of each year, or more frequently should circumstances dictate. Goodwill of a reporting unit is tested for impairment between annual tests if an event occurs or circumstances change that would more likely than not reduce the fair value of a reporting unit below its carrying amount.
The Company assesses the fair values of its reporting units using both a market-based approach and an income-based approach. Under the income approach, the fair value of the reporting unit is based on the present value of estimated future cash flows. The income approach is dependent on a number of factors, including estimates of future market growth trends, forecasted revenues and expenses, expected periods the assets will be utilized, appropriate discount rates and other variables. The estimates are based on assumptions that the Company believes to be reasonable, but which are unpredictable and inherently uncertain. Changes in these estimates and assumptions could materially affect the determination of fair value, and may result in the impairment of goodwill in the event that actual results differ from those estimates.
The market approach measures the value of an entity through comparison to comparable companies. Under the market approach, the Company uses the guideline public company method by applying an estimated market-based enterprise value multiple to the reporting unit’s estimated revenue and EBITDA. The Company analyzes companies that perform similar services or are considered peers. Due to the fact that there are no public companies that are our direct competitors, the Company weighed the results of this approach less than the income approach.
The Company performed its annual test of impairment as of July 1, 2009 with no indication of goodwill impairment as of the test date. The decline in the Company’s operating results and related cash flow forecasts during the past year has reduced the amount by which the estimated fair value exceeds the carrying value of assets. As of the measurement date, the estimated fair value was $1.8 million above the carrying value. A more than insignificant decline in the Company’s future operating results or cash flow forecasts versus its current forecasts could potentially trigger a goodwill impairment charge in a future period. No test was performed as of December 31, 2009 as based on the Company’s current forecasts, no triggering events which would require a test were deemed to have occurred.
Long-Lived Assets — Long-lived assets are composed of property and equipment and intangible assets subject to amortization. Long-lived assets to be held and used are reviewed for possible impairment whenever events indicate that the carrying amount of such assets may not be recoverable by comparing the undiscounted cash flows associated with the assets to their carrying amounts. If such a review indicates an impairment, the carrying amount would be reduced to fair value. If long-lived assets are to be disposed, depreciation is discontinued, if applicable, and the assets are reclassified as held for sale at the lower of their carrying amounts or fair values less estimated costs to sell. No triggering events were identified in 2009, 2008 or 2007.
F-9
Table of Contents
Self-Insurance Reserves — Effective January 1, 2008, the Company self-insures costs associated with its employees, workers’ compensation claims, and general business liabilities up to certain limits via participation in GLDD’s insurance programs. Insurance reserves are established for estimates of the loss that the Company will ultimately incur on reported claims, as well as estimates of claims that have been incurred but not yet reported. In determining its estimates, the Company incorporates historical loss experience and judgments about the present and expected levels of cost per claim. Trends in actual experience are a significant factor in the determination of such reserves. Prior to 2008, the Company participated in the insurance programs of GLDD by paying an annual premium to GLDD, with any losses in excess of the premiums paid being absorbed by GLDD. Accordingly, any losses incurred subsequent to January 1, 2008 related to claims for events prior to that date are expensed by GLDD with no further charges to the Company.
Income Taxes — Subsequent to April 30, 2008, income or loss of the Company is included in the income tax returns of the members in proportion to their respective Class B interests. All income tax provisions relate to operations of the predecessor company, NASDI Inc., for the period from January 1, 2007 to April 30, 2008.
For periods prior to April 30, 2008, the provision for income taxes includes federal and state income taxes currently payable and those deferred because of temporary differences between the financial statement and tax bases of assets and liabilities. Recorded deferred income tax assets and liabilities are based on the estimated future tax effects of differences between the financial and tax basis of assets and liabilities, given the effect of currently enacted tax laws.
Fair Value of Financial Instruments — The carrying value of financial instruments included in current assets and current liabilities approximates fair value due to the short-term maturities of these instruments.
Comprehensive Income (Loss) — Comprehensive income (loss) is equal to net income (loss) as presented in the statement of operations.
New Accounting Pronouncements — In January 2010, the Financial Accounting Standards Board (“FASB”) issued Accounting Standards Update (“ASU”) 2010-06, Improving Disclosures About Fair Value Measurements (“ASU 2010-06”) that amended Accounting Standards Codification (“ASC”) Topic 820-10, Fair Value Measurements and Disclosures to add new requirements for disclosures about transfers into and out of Levels 1 and 2 measurements and additional disclosures about purchases, sales, issuances, and settlements relating to Level 3 measurements. The update is effective as of January 1, 2010. The update clarifies that disclosures about the valuation techniques and inputs used to measure fair value is required for both recurring and nonrecurring fair value measurements. In addition, those disclosures are required for fair value measurements classified either as Level 2 or Level 3. If the valuation technique has changed, entities should disclose that change and the reason for the change. Adoption of ASU 2010-06 is not expected to have a significant impact on the financial statements of the Company.
In 2009 the FASB issued ASU 2009-17, which amended ASC Topic 810, Consolidation, and is effective as of January 1, 2010. ASU 2009-17 addresses information a reporting entity provides in its financial statements about the transfer of financial assets; the effects of a transfer on its financial position, financial performance, and cash flows; and a transferor’s continuing involvement in transferred financial assets. Also, the amended topic removes the concept of a qualifying special-purpose entity, limits the circumstances in which a transferor derecognizes a portion or component of a financial asset, defines participating interest and enhances the information provided to financial statement users to provide greater transparency. The Company has evaluated the impact adoption will have on the Company’s consolidated financial position, results of operations and cash flows, and does not expect the impact to be material.
F-10
Table of Contents
| 3. | ACCOUNTS RECEIVABLE |
Accounts receivable at December 31, 2009 and 2008 are as follows:
| 2009 | 2008 | |||||||
| Completed contracts |
$ | 2,799 | $ | 1,897 | ||||
| Contracts in progress |
4,558 | 3,279 | ||||||
| Retainage |
3,337 | 5,036 | ||||||
| 10,694 | 10,212 | |||||||
| Allowance for doubtful accounts |
(500 | ) | (500 | ) | ||||
| Total accounts receivable — net |
$ | 10,194 | $ | 9,712 | ||||
| 4. | CONTRACTS IN PROGRESS |
The components of contracts in progress at December 31, 2009 and 2008 are as follows:
| 2009 | 2008 | |||||||
| Costs and earnings in excess of billings: |
||||||||
| Costs and earnings for contracts in progress |
$ | 25,238 | $ | 45,554 | ||||
| Amounts billed |
(23,612 | ) | (39,091 | ) | ||||
| Costs and earnings in excess of billings for contracts in progress |
1,626 | 6,463 | ||||||
| Costs and earnings in excess of billings for completed contracts |
363 | — | ||||||
| Total contract revenues in excess of billings |
$ | 1,989 | $ | 6,463 | ||||
| Billings in excess of costs and earnings: |
||||||||
| Amounts billed |
$ | (13,903 | ) | $ | (9,446 | ) | ||
| Costs and earnings for contracts in progress |
13,112 | 8,602 | ||||||
| Total billings in excess of contract revenues |
$ | (791 | ) | $ | (844 | ) | ||
As of December 31, 2008, the Company had contract revenues in excess of billings of $6,463, of which $2,359 related to a single project. During 2009 approximately $166 of the amount related to this project was invoiced and collected. Work at this project site has ceased as the developer of the site has postponed completion due to financial difficulties related to that project. Accordingly, during 2009, uncertainty arose as to when, if ever, the Company would be able to resume work at this site, complete its work under the contract, and invoice the remaining contractual billings. Due to this uncertainty, the Company reduced revenue related to this project by approximately $2,500 in 2009.
| 5. | GOODWILL |
The change in the carrying amount of goodwill during the years ended December 31, 2009 and 2008 is as follows:
| Balance - January 1, 2008 |
$ | 19,650 | ||
| Acquisition of NASDI noncontrolling interest |
1,574 | |||
| Balance - December 31, 2008 |
$ | 21,224 | ||
| Balance - December 31, 2009 |
$ | 21,224 | ||
F-11
Table of Contents
| 6. | PROPERTY AND EQUIPMENT |
Property and equipment at December 31, 2009 and 2008 are as follows:
| 2009 | 2008 | |||||||
| Leasehold improvements |
$ | 1,740 | $ | 1,716 | ||||
| Furniture and fixtures |
59 | 59 | ||||||
| Operating equipment |
15,277 | 13,754 | ||||||
| Total property and equipment |
17,076 | 15,529 | ||||||
| Accumulated depreciation |
(7,889 | ) | (6,258 | ) | ||||
| Property and equipment — net |
$ | 9,187 | $ | 9,271 | ||||
| 7. | INTANGIBLE ASSETS |
At December 31, 2009 and 2008, the net book value of identifiable intangible assets was as follows:
| As of December 31, 2009 |
Cost | Accumulated Amortization |
Net | |||||||||
| Customer relationships |
$ | 1,300 | $ | 1,021 | $ | 279 | ||||||
| Backlog |
158 | 158 | — | |||||||||
| $ | 1,458 | $ | 1,179 | $ | 279 | |||||||
| As of December 31, 2008 |
Cost | Accumulated Amortization |
Net | |||||||||
| Customer relationships |
$ | 1,300 | $ | 871 | $ | 429 | ||||||
| Backlog |
158 | 158 | — | |||||||||
| $ | 1,458 | $ | 1,029 | $ | 429 | |||||||
Amortization expense related to these intangible assets is estimated to be $151 in 2010 and $30 annually from 2011 through 2014.
| 8. | ACCRUED LIABILITIES |
Accrued liabilities at December 31, 2009 and 2008 are as follows:
| 2009 | 2008 | |||||||
| Insurance |
$ | 1,041 | $ | 700 | ||||
| Payroll and employee benefits |
214 | 2,102 | ||||||
| Other taxes |
100 | — | ||||||
| Other |
102 | 569 | ||||||
| Total accrued liabilities |
$ | 1,457 | $ | 3,371 | ||||
F-12
Table of Contents
| 9. | INCOME TAXES |
The income tax expense (benefit) for the years ended December 31, 2008 and 2007 is as follows:
| 2008 | 2007 | |||||||
| Federal: |
||||||||
| Current |
$ | 565 | 361 | |||||
| Deferred |
(743 | ) | 128 | |||||
| State: |
||||||||
| Current |
359 | 397 | ||||||
| Deferred |
(130 | ) | 23 | |||||
| Total |
$ | 51 | $ | 909 | ||||
The Company’s income tax provision reconciles to the provision at the statutory U.S. federal income tax rate as of December 31, 2007 as follows:
| 2007 | ||||
| Tax provision at statutory U.S. federal income tax rate |
$ | 397 | ||
| State income tax-net of federal income tax benefit |
100 | |||
| Income tax matters related to uncertain tax positions |
278 | |||
| Other |
134 | |||
| Income tax provision |
$ | 909 | ||
The tax provision recorded for 2008 is based on the results of operations for the four-month period ended April 30, 2008, the date on which the Company was converted from a C-corporation to a limited liability company. Beginning May 1, 2008, the Company is treated as a partnership for federal and state income tax purposes; therefore, the income or loss of the limited liability company is includible in the income tax returns of the Class B members in proportion to their respective interests. Accordingly, there is no provision for income taxes in the financial statements for periods after April 30, 2008. In addition, all recorded deferred income tax balances of NASDI, Inc. were credited against income tax expense at the time of conversion to a limited liability company.
Below is a tabular reconciliation of the total amounts of unrecognized tax benefits at the beginning and end of 2008 and 2007:
| 2008 | 2007 | |||||||
| Unrecognized tax benefits-January 1, |
$ | 1,282 | $ | 1,062 | ||||
| Gross increases-current period tax positions |
73 | 220 | ||||||
| Gross decreases-writeoff of tax positions with conversion to limited liability corporation |
(1,355 | ) | ||||||
| Unrecognized tax benefits-December 31, |
$ | — | $ | 1,282 | ||||
NASDI, Inc. filed income tax returns at the U.S. federal level and in several states. U.S. federal income tax years prior to 2005 are closed and no longer subject to examination. With few exceptions, the statute of limitations in state taxing jurisdictions in which the Company operates has expired for all years prior to 2005. An Internal Revenue Service examination of the tax years 2003 through 2006 was completed during 2008 with no adjustments proposed by the Service.
| 10. | LONG-TERM DEBT |
The Company has certain equipment notes with the portion due within 12 months designated as current portion of equipment debt and the portion extending beyond one year recorded as other noncurrent liabilities. The equipment notes are collateralized by the underlying equipment to which the notes relate and carry interest rates ranging from 5.00% to 8.95%. Future cash payments on the notes are $1,200 in 2010, $243 in 2011, and $7 in 2012. Long-term debt at December 31, 2009 and 2008 is as follows:
| 2009 | 2008 | |||||||
| Eqiupment notes |
$ | 1,450 | $ | 2,607 | ||||
| Current portion of equipment debt |
(1,200 | ) | (1,553 | ) | ||||
| Total |
$ | 250 | $ | 1,054 | ||||
| 11. | RETIREMENT PLANS |
Employees of the Company are eligible to participate in GLDD’s 401(k) savings plans, including one covering nonunion salaried employees (“Salaried Plan”) and the second covering nonunion hourly employees (“Hourly Plan”). Under both plans, individual employees may contribute a percentage of compensation and the Company will match a portion of the employees’ contributions. Additionally, the
F-13
Table of Contents
Salaried Plan includes a profit-sharing component, permitting the Company to make discretionary employer contributions to all eligible employees of the Salaried Plan. The Company’s expense for matching and discretionary profit-sharing contributions for 2009, 2008 and 2007 was $134, $437 and $382, respectively. The Company also contributes to a number of multi-employer pension plans pursuant to collective bargaining agreements. In the event of a plan’s termination or Company withdrawal from a plan, the Company may be liable for a portion of the plan’s unfunded vested benefits. However, since the number of Company employees participating in any given plan is generally insignificant, management does not expect that such amounts would be significant to the Company’s results of operations. Contributions to multi-employer pension plans for the years ended December 31, 2009, 2008 and 2007 were $2,120, $3,132 and $2,694, respectively.
| 12. | MAJOR CUSTOMERS AND CONCENTRATIONS OF RISK |
For the years ended December 31, 2009, 2008 and 2007, 10%, 22% and 18%, respectively, of the Company’s revenues were derived from a single distinct customer (which was a different entity each period). At December 31, 2009 and 2008, approximately 8% and 13%, respectively, of accounts receivable, including contract revenues in excess of billings, was due on contracts with one customer.
| 13. | RELATED-PARTY TRANSACTIONS |
For the years ended December 31, 2009, 2008, and 2007, the Company incurred interest expense to GLDD totaling $217, $835, and $2,745, respectively. The 2007 and 2008 interest expense related primarily to debt that existed between GLDD and NASDI Inc. prior to the April 30, 2008 transactions. The majority of the intercompany debt, $27,242, was converted into equity on April 30, 2008. The remaining debt is related to periodic advances from GLDD to fund the Company’s working capital needs. The net of such amounts is shown as payables to parent in the balance sheet. The amount advanced by GLDD accrues interest at a per annum rate of not less than the higher of (a) the Prime Rate plus 1% or (b) 0.50% per annum above the Federal Funds Rate plus 1%, and is payable quarterly. The prime rate was 3.25% at December 31, 2009 and 2008.
The Company is also charged a management fee by GLDD to compensate GLDD for certain administrative fees and services such as accounting and tax functions performed by GLDD on the Company’s behalf, as well as for any payroll and incentive compensation paid directly by GLDD. During 2009, 2008 and 2007, the Company incurred expense of $412, $1,673 and $2,126, respectively, related to such charges. The amount payable to affiliate relates to the intercompany transactions for subcontract work performed by an affiliate of the Company.
| 14. | COMMITMENTS AND CONTINGENCIES |
The Company, along with other subsidiaries of GLDD, has guaranteed the repayment of debt and interest under GLDD’s senior bank credit facility and subordinated notes. At December 31, 2009 and 2008, total senior debt of GLDD was $11,000 and $41,500, respectively and letters of credit outstanding were $17,101 and $17,982, respectively. The amount of GLDD’s subordinated notes guaranteed totaled $175,000 at December 31, 2009 and 2008. The notes mature on December 15, 2013 and accrue interest at the rate of 7.75% annually.
Performance and/or bid bonds are occasionally required for the Company’s demolition projects. The Company obtains its performance and bid bonds through GLDD’s bonding agreement with its surety company.
The Company is a defendant in various legal proceedings. On August 26, 2009, the Company received a letter stating that the Attorney General for the Commonwealth of Massachusetts is investigating alleged violations of the Massachusetts Solid Waste Act. The Company believes that the Attorney General is investigating illegal dumping activities at a dump site where the Company contracted to have waste materials disposed of between September 2007 and July 2008. Although the matter remains open, no lawsuit has been filed. Per the Attorney General’s request, the Company executed a tolling agreement (which allows for extending the statute of limitations) regarding the matter. Should charges be brought, the Company intends to defend itself vigorously on this matter. Based on consideration of all of the facts and circumstances now known, the Company does not believe this claim will have a material adverse impact on the Company’s financial position, results of operations or cash flows.
F-14
Table of Contents
The Company is also involved in property damage claims arising during a former project. During 2009 and early 2010, many of the claims settled; however, approximately $300 remains outstanding. The Company is covered by insurance in this matter under GLDD’s insurance programs and since the claims relate to a 2007 event, GLDD maintains all loss exposure related to this matter and the Company therefore does not believe that such matter will materially affect its financial position, results of operations or cash flows.
Future minimum operating lease payments relating to office space rental at December 31, 2009, are as follows:
| Years Ending December 31 |
||||
| 2010 |
$ | 312 | ||
| 2011 |
312 | |||
| 2012 |
312 | |||
| 2013 |
312 | |||
| 2014 |
312 | |||
| Thereafter |
623 | |||
| $ | 2,183 | |||
Total rent expense under long-term operating lease arrangements for the years ended December 31, 2009, 2008, and 2007 was $361, $332, and $291, respectively. This excludes expenses for equipment and facilities rented on a short-term, as-needed basis.
******
F-15
Table of Contents
YANKEE ENVIRONMENTAL SERVICES, LLC
| Page | ||||
| F-17 | ||||
| FINANCIAL STATEMENTS AS OF DECEMBER 31, 2009 AND FOR THE YEAR ENDED DECEMBER 31, 2009 |
||||
| F-18 | ||||
| F-19 | ||||
| F-20 | ||||
| F-21 | ||||
| F-22 | ||||
F-16
Table of Contents
Report of Independent Registered Public Accounting Firm
To the Members and Board of Directors
Yankee Environmental Services, LLC
We have audited the accompanying balance sheet of Yankee Environmental Services, LLC (A Limited Liability Company) as of December 31, 2009 and the related statements of operations, members’ equity and cash flows for the year then ended. These financial statements are the responsibility of the management of Yankee Environmental Services, LLC. Our responsibility is to express an opinion on these financial statements based on our audit.
We conducted our audit in accordance with the standards of the Public Company Accounting Oversight Board (United States). Those standards require that we plan and perform the audit to obtain reasonable assurance about whether the financial statements are free of material misstatement. An audit includes examining, on a test basis, evidence supporting the amounts and disclosures in the financial statements. An audit also includes assessing the accounting principles used and significant estimates made by management, as well as evaluating the overall financial statement presentation. We believe that our audit provides a reasonable basis for our opinion.
In our opinion, the financial statements referred to above present fairly, in all material respects, the financial position of Yankee Environmental Services, LLC as of December 31, 2009 and its results of operations and cash flows for the year then ended, in conformity with accounting principles generally accepted in the United States of America.
| /s/ J.H. Cohn LLP |
| White Plains, New York December 22, 2010 |
F-17
Table of Contents
YANKEE ENVIRONMENTAL SERVICES, LLC
DECEMBER 31, 2009
(IN THOUSANDS)
| ASSETS | ||||
| Current assets: |
||||
| Cash |
$ | 213 | ||
| Accounts receivable |
1,627 | |||
| Accounts receivable - affiliate |
1,918 | |||
| Contract revenues in excess of billings |
26 | |||
| Prepaid expenses and other current assets |
38 | |||
| Total current assets |
3,822 | |||
| Equipment - net |
450 | |||
| Goodwill |
250 | |||
| Intangible assets - net |
398 | |||
| Total |
$ | 4,920 | ||
| LIABILITIES AND MEMBERS’ EQUITY | ||||
| Current liabilities: |
||||
| Accounts payable |
$ | 395 | ||
| Payable to parents |
2,758 | |||
| Accrued liabilities |
538 | |||
| Billings in excess of contract revenues |
200 | |||
| Total current liabilities |
3,891 | |||
| Commitments and contingencies |
||||
| Members’ equity |
1,029 | |||
| Total |
$ | 4,920 | ||
See Notes to Financial Statements
F-18
Table of Contents
YANKEE ENVIRONMENTAL SERVICES, LLC
YEAR ENDED DECEMBER 31, 2009
(IN THOUSANDS)
| Contract revenues |
$ | 7,760 | ||
| Cost of revenues |
7,472 | |||
| Gross profit |
288 | |||
| General and administrative expenses |
554 | |||
| Amortization of intangible assets |
481 | |||
| Operating loss |
(747 | ) | ||
| Related party interest expense |
(115 | ) | ||
| Net loss |
$ | (862 | ) | |
See Notes to Financial Statements
F-19
Table of Contents
YANKEE ENVIRONMENTAL SERVICES, LLC
STATEMENT OF MEMBERS’ EQUITY
YEAR ENDED DECEMBER 31, 2009
(IN THOUSANDS)
| Balance, January 1, 2009 |
$ | — | ||
| Members’ contributions |
1,891 | |||
| Net loss |
(862 | ) | ||
| Balance, December 31, 2009 |
$ | 1,029 | ||
See Notes to Financial Statements
F-20
Table of Contents
YANKEE ENVIRONMENTAL SERVICES, LLC
YEAR ENDED DECEMBER 31, 2009
(IN THOUSANDS)
| Operating activities: |
||||
| Net loss |
$ | (862 | ) | |
| Adjustments to reconcile net loss to net cash used in operating activities: |
||||
| Depreciation and amortization |
755 | |||
| Accrued loss on uncompleted contract |
234 | |||
| Changes in operating assets and liabilities: |
||||
| Accounts receivable |
(1,627 | ) | ||
| Accounts receivable - affiliate |
(1,918 | ) | ||
| Contract revenues in excess of billings |
(26 | ) | ||
| Prepaid expenses and other current assets |
12 | |||
| Accounts payable and accrued liabilities |
687 | |||
| Billings in excess of contract revenues |
200 | |||
| Net cash used in operating activities |
(2,545 | ) | ||
| Investing activities: |
||||
| Acquisition of business |
(1,891 | ) | ||
| Net cash used in investing activities |
(1,891 | ) | ||
| Financing activities: |
||||
| Contributions from members |
1,891 | |||
| Change in payable to parents |
2,758 | |||
| Net cash provided by financing activities |
4,649 | |||
| Net increase in cash |
213 | |||
| Cash, beginning of year |
— | |||
| Cash, end of year |
$ | 213 | ||
See Notes to Financial Statements
F-21
Table of Contents
YANKEE ENVIRONMENTAL SERVICES, LLC
NOTES TO FINANCIAL STATEMENTS
(IN THOUSANDS)
Note 1 - Nature of business and remaining interest acquisition:
Organization:
Yankee Environmental Services, LLC (the “Company”) was formed as a Delaware limited liability company pursuant to the Limited Liability Company Agreement dated December 22, 2008. The Company is a provider of environmental remediation services including asbestos abatement and removal of other hazardous materials in the Boston, Massachusetts area. The Company’s principal services consist of lead paint and asbestos abatement along with demolition services to private and government entities including schools, universities, hospitals and other businesses.
The Company is owned by NASDI Holdings Corporation (“NASDI Holdings”), a wholly-owned subsidiary of Great Lakes Dredge & Dock Corporation (“GLDD”), and three individuals. NASDI Holdings is the owner of 100% of the Class A interests (voting) which represent 65% of the Company’s equity. The Class B interests (non-voting) are held by three individuals, one of which is Christopher A. Berardi, the president of NASDI Holdings, and represent 35% of the Company’s equity. The holders of the Class A and Class B interests are entitled to receive periodic distributions of profits based on available cash flows from operations on a pro rata basis in proportion to their percentage ownership interest. The member, manager or officer of the Company are not personally liable for the Company’s debt, obligations or liabilities.
Acquisition:
On January 1, 2009, the Company acquired Yankee Environmental Services, Inc. (“Yankee Inc.”), through an asset purchase agreement. Yankee Inc. was a provider of environmental remediation services including asbestos abatement and removal of other hazardous materials. The aggregate purchase price was $1,891. The costs related to the acquisition were not material. The allocation of the purchase price and the estimated values of assets acquired at the date of acquisition are as follows:
| Equipment |
$ | 725 | ||
| Intangible assets |
879 | |||
| Goodwill |
250 | |||
| Other assets and liabilities |
37 | |||
| Total |
$ | 1,891 | ||
F-22
Table of Contents
Note 1 - Nature of business and remaining interest acquisition (concluded):
The acquired intangible assets making up the above amount include:
| Value | Weighted Avg Life (yrs) |
|||||||
| Customer relations |
$ | 181 | 7.0 | |||||
| Backlog |
322 | 1.0 | ||||||
| Non-compete |
205 | 3.0 | ||||||
| Trade names |
88 | 5.0 | ||||||
| License |
40 | 3.0 | ||||||
| Leases |
33 | 1.4 | ||||||
| Other |
10 | 1.0 | ||||||
Note 2 - Summary of significant accounting policies:
Use of estimates:
The preparation of financial statements in conformity with accounting principles generally accepted in the United States of America requires management to make estimates and assumptions that affect certain reported amounts and disclosures. Accordingly, actual results could differ from those estimates.
Revenues and cost recognitions:
The majority of the Company’s contracts for asbestos abatement services are fixed-price contracts, with others managed as time and materials. Substantially all of the Company’s contract revenues are recognized under the percentage-of-completion method, using a cost-to-cost method to measure the extent of progress towards completion. Contract revenues are adjusted to reflect the gross profit percentage expected to be achieved upon the ultimate completion of each project. Provisions for estimated losses on contracts in progress are made in the period in which such losses are determined. Claims for additional compensation due to the Company are not recognized in contract revenues until such claims are settled. Billings on contracts are generally submitted after verification with the customers of physical progress and may not match the timing of revenue recognition. The difference between amounts billed and recognized as revenues is reflected in the balance sheet as either contract revenues in excess of billings or billings in excess of contract revenues. Change orders are often negotiated when a change in conditions from the original contract specifications is encountered, necessitating a change in project performance methodology. Such change orders are considered changes in the scope of the original projects to which they relate and the project estimates are adjusted accordingly.
The components of costs of contract revenues include labor, equipment (including depreciation, maintenance, insurance and rentals) and project overhead. Hourly labor is generally hired on a project-by-project basis. Costs of contract revenues vary significantly depending on the type and location of work performed.
F-23
Table of Contents
Note 2 - Summary of significant accounting policies (continued):
Classification of current assets and liabilities:
The Company includes in current assets and liabilities amounts realizable and payable in the normal course of contract completion, unless completion of such contracts extends significantly beyond one year.
Accounts receivable:
Accounts receivable represent amounts due or billable under the terms of contracts with customers, including amounts related to retainage. The Company anticipates collection of retainage within one year and, accordingly, presents retainage as a current asset. The Company provides an allowance for estimated uncollectible receivables when events or conditions indicate that amounts outstanding are not recoverable.
Equipment - net:
Capital additions, improvements and major renewals are classified as equipment and are carried at depreciated cost. Maintenance and repairs that do not significantly extend the useful lives of the assets or enhance the capabilities of such assets are charged to earnings as incurred. Depreciation is recorded over the estimated useful lives of three to ten years using the straight-line method and the mid-year depreciation convention.
Goodwill and intangible assets:
Goodwill represents the excess of cost over fair value. Other identifiable intangibles mainly represent developed technology and databases, customer relationships and customer contracts acquired in business combinations and are being amortized over a one to seven year period. Goodwill is tested annually for impairment in the third quarter of each year, or more frequently should circumstances dictate. Goodwill of a reporting unit is tested for impairment between annual tests if an event occurs or circumstances change that would more likely than not reduce the fair value of a reporting unit below its carrying amount.
The Company performed its most recent annual test of impairment as of July 1, 2009 for goodwill with no indication of impairment as of the test date. The Company’s operating results and related cash flow forecasts during the past year has resulted in a large difference between the amount by which the estimated fair value exceeds the carrying value of assets. A more than insignificant decline in the Company’s future operating results or cash flow forecasts versus its current forecasts could potentially trigger a goodwill impairment charge in a future period. No test was performed as of December 31, 2009 as based on the Company’s current forecasts, no triggering events which would require a test were deemed to have occurred.
The Company will perform its next scheduled annual test of goodwill in the third quarter of 2010 should no triggering events occur which would require a test prior to the next annual test.
F-24
Table of Contents
Note 2 - Summary of significant accounting policies (concluded):
Long-lived assets:
Long-lived assets are composed of equipment and intangible assets subject to amortization. Long-lived assets to be held and used are reviewed for possible impairment whenever events indicate that the carrying amount of such assets may not be recoverable by comparing the undiscounted cash flows associated with the assets to their carrying amounts. If such a review indicates an impairment, the carrying amount would be reduced to fair value. If long-lived assets are to be disposed of, depreciation is discontinued, if applicable, and the assets are reclassified as held for sale at the lower of their carrying amounts or fair values less estimated costs to sell. No triggering events were identified in 2009.
Self-insurance reserves:
The Company self-insures costs associated with its employees, workers’ compensation claims and general business liabilities up to certain limits via participation in GLDD’s insurance programs. Insurance reserves are established for estimates of the loss that the Company will ultimately incur on reported claims, as well as estimates of claims that have been incurred but not yet reported. In determining its estimates, the Company incorporates historical loss experience and judgments about the present and expected levels of cost per claim. Trends in actual experience are a significant factor in the determination of such reserves.
Income taxes:
No provision for income taxes is included in the accompanying financial statements since the Company is taxed as a partnership. Accordingly, the members report their respective share of partnership taxable income or loss in their income tax returns.
The Company adopted the new accounting for uncertainty in income taxes guidance on January 1, 2009. The adoption of that guidance did not result in the recognition of any unrecognized tax benefits and the Company has no unrecognized tax benefit at December 31, 2009. Management continually evaluates expiring statutes of limitations, audits, proposed settlements, changes in tax law and new authoritative rulings.
If necessary, the Company would recognize interest and penalties associated with tax matters as operating expenses and would include accrued interest and penalties in accounts payable and accrued expenses on the balance sheet.
Fair value:
The carrying value of accounts receivable and accounts payable approximates fair value due to the short-term maturities of these instruments.
F-25
Table of Contents
Note 3 - Accounts receivable:
Accounts receivable consist of the following at December 31, 2009:
| Non- related Party |
Related Party |
Total | ||||||||||
| Contracts in progress |
$ | 1,318 | $ | — | $ | 1,318 | ||||||
| Completed contracts |
289 | 1,560 | 1,849 | |||||||||
| Retainage receivable |
20 | 358 | 378 | |||||||||
| 1,627 | 1,918 | 3,545 | ||||||||||
| Less allowance for doubtful accounts |
— | — | — | |||||||||
| Totals |
$ | 1,627 | $ | 1,918 | $ | 3,545 | ||||||
Note 4 - Contracts in progress:
The components of contracts in progress at December 31, 2009 are as follows:
Costs and earnings in excess of billings:
| Costs and earnings for contract in progress |
$ | 26 | ||
| Amounts billed |
(— | ) | ||
| Total contract revenues in excess of billings |
$ | 26 | ||
Billings in excess of costs and earnings:
| Amounts billed |
$ | (1,353 | ) | |
| Costs and earnings for contract in progress |
1,153 | |||
| Total billings in excess of contract revenues |
$ | (200 | ) | |
Note 5 - Goodwill:
Goodwill resulted from the acquisition of Yankee Inc. in 2009. The change in the carrying amount of goodwill during the year ended December 31, 2009 is as follows:
| Balance, January 1, 2009 |
$ | — | ||
| Acquisition of business |
250 | |||
| Balance, December 31, 2009 |
$ | 250 | ||
Note 6 - Equipment - net:
Equipment –net consists of the following at December 31, 2009:
| Operating equipment |
$ | 725 | ||
| Less accumulated depreciation |
(275 | ) | ||
| Total |
$ | 450 | ||
F-26
Table of Contents
Note 7 - Intangible assets:
At December 31, 2009, the net book value of identifiable assets was as follows:
| Cost | Accumulated Amortization |
Net | ||||||||||
| Customer relationships |
$ | 181 | $ | 26 | $ | 155 | ||||||
| Backlog |
322 | 322 | — | |||||||||
| Non-compete agreement |
205 | 68 | 137 | |||||||||
| Trade names |
88 | 18 | 70 | |||||||||
| Other |
83 | 47 | 36 | |||||||||
| Totals |
$ | 879 | $ | 481 | $ | 398 | ||||||
Amortization expense related to these intangible assets is estimated to be $134 in 2010, $125 in 2011, $44 in 2012, $44 in 2013 and $26 in 2014.
Note 8 - Accrued liabilities:
Accrued liabilities at December 31, 2009 are as follows:
| Insurance |
$ | 270 | ||
| Accrued loss on uncompleted contract |
234 | |||
| Payroll and employee benefits |
34 | |||
| Total |
$ | 538 | ||
Note 9 - Members’ equity:
The change in the members’ equity during the year ended December 31, 2009 is as follows:
| Class A | Class B | Total | ||||||||||
| Balance, January 1, 2009 |
$ | — | $ | — | $ | — | ||||||
| Members’ contributions |
1,229 | 662 | 1,891 | |||||||||
| Net loss |
(560 | ) | (302 | ) | (862 | ) | ||||||
| Balance, December 31, 2009 |
$ | 669 | $ | 360 | $ | 1,029 | ||||||
Note 10 - Retirement plans:
Employees of the Company are eligible to participate in GLDD’s 401(k) savings plans, including one covering nonunion salaried employees (“Salaried Plan”) and the second covering nonunion hourly employees (“Hourly Plan”). Under both plans, individual employees may contribute a percentage of compensation and the Company will match a portion of the employees’ contributions. Additionally, the Salaried Plan includes a profit-sharing component, permitting the Company to make discretionary employer contributions to all eligible employees of the Salaried Plan. The Company’s expense for matching and discretionary profit-sharing contributions for 2009 was $4.
F-27
Table of Contents
Note 10 - Retirement plans (concluded):
The Company also contributes to a number of multi-employer pension plans pursuant to collective bargaining agreements. Government regulations impose certain requirements relative to multi-employer plans. In the event of plan termination or employer withdrawal, an employer may be liable for a portion of the plan’s unfunded vested benefits. The Company has not received information from the plans’ administrators to determine its share of unfunded vested benefits. The Company does not anticipate withdrawal from the plans, nor is the Company aware of any expected plan terminations. Contributions to multi-employer pension plans for the year ended December 31, 2009 was $1,204.
Note 11 - Related party transactions:
For the year ended December 31, 2009, the Company incurred interest expense to GLDD totaling $115. The interest expense relates primarily to debt for periodic advances from GLDD to fund the Company’s working capital needs. The net of such amounts payable to GLDD at December 31, 2009 was $2,719. The amount advanced by GLDD accrues interest at a per annum rate of not less than the higher of (a) the Prime Rate plus 1% or (b) 0.50% per annum above the Federal Funds Rate plus 1%, and is payable quarterly. The effective rate was 4.25% at December 31, 2009. The Company also received advances from NASDI Holdings of $39.
The Company is also charged a management fee by GLDD to compensate GLDD for certain administrative fees and services such as accounting and tax functions performed by GLDD on the Company’s behalf, as well as for any payroll and incentive compensation paid directly by GLDD. During 2009, the Company incurred expense of $38.
Note 12 - Commitments and contingencies:
The Company, along with other subsidiaries of GLDD, has guaranteed the repayment of debt and interest under GLDD’s senior bank credit facility and subordinated notes. At December 31, 2009, total senior debt of GLDD was $11,000 and letters of credit outstanding was $17,101 under GLDD’s credit facility. The amount of GLDD’s subordinated notes guaranteed totaled $175,000 at December 31, 2009. The notes mature on December 15, 2013 and accrue interest at the rate of 7.75% annually.
Performance and/or bid bonds are occasionally required for the Company’s demolition projects. The Company obtains its performance and bid bonds through GLDD’s bonding agreement with its surety company.
F-28
Table of Contents
Note 12 - Commitments and contingencies (concluded):
Future minimum operating lease payments relating to office space rental at December 31, 2009 are as follows:
| Year Ending |
||||
| December 31, 2010 |
$ | 23 | ||
| Total |
$ | 23 | ||
Total rent expense under long-term operating lease arrangements for the year ended December 31, 2009 was $55. This excludes expenses for equipment and facilities rented on a short-term, as needed basis.
Note 13 - Concentration risks:
Customers:
The Company obtains its contract work primarily through a competitive bid process. This may result in the Company earning a substantial portion of its revenue from relatively few customers in any given year. During the year ended December 31, 2009, the Company earned approximately 97% of its revenue from two customers, of which 53% was derived from NASDI, LLC, an affiliate and 44% was derived from Dominion Energy. At December 31, 2009, the Company has approximately 98% of its accounts receivable balance, including contract revenues in excess of billings, due from the two major customers, of which 54% is due from NASDI, LLC, an affiliate and 44% was due from Dominion Energy.
Labor concentrations:
The Company’s direct labor is supplied primarily by unions, which have collective bargaining agreements expiring through May 31, 2012. Although the Company’s past experience has been favorable with respect to resolving conflicting demands with these unions, it is always possible that a protracted conflict may occur which could impact the renewal of the collective bargaining agreements. At December 31, 2009, 89% of the Company’s labor force is subject to collective bargaining agreements.
Note 14 - Subsequent events:
The Company has evaluated all events or transactions that occurred after December 31, 2009 up through December 22, 2010, the date these financial statements were available for issuance.
F-29
Table of Contents
Explanatory Note
The accompanying financial statements of Yankee’s predecessor, Yankee Liquidation Corp. (formerly known as Yankee Environmental Services, Inc., and referred to hereafter as “Seller”), as of December 31, 2008 and for the years ended December 31, 2008 and 2007 are unaudited. As a non 100%-owned subsidiary guarantor of the Company’s senior subordinated notes, Rule 3-10 of Regulation S-X requires that Yankee provide separate financial statements in accordance with Regulation S-X, including audited annual financial statements, including financial statements of the Seller for periods prior to the acquisition by Yankee (the Seller was not a guarantor of the Company’s senior subordinated notes). As the accompanying financial statements are unaudited, they are not in compliance with Rule 3-10 of Regulation S-X.
Yankee was formed for the purpose of purchasing substantially all of the assets of Seller. On January 1, 2009, Yankee acquired the assets for a purchase price of $1.9 million. Effective upon the closing of the asset purchase, Seller ceased to conduct any business. Seller’s financial statements were not audited for any period prior to January 1, 2009. Yankee believes that the completion of an audit for Seller’s 2008 and 2007 financial statements is impractical for the following reasons:
| • | Yankee did not acquire Seller’s accounting books and records. At the time, the Company and Yankee considered this unnecessary due to the nature of the assets purchased, the immateriality of the acquisition, and because Yankee was required to initiate its accounting records pursuant to the purchase accounting method. |
| • | Yankee did not obtain the right to access Seller’s accounting books and records after the January 1, 2009 closing date. Neither Seller nor Seller’s owner has any obligation to provide Seller’s accounting books and records to Yankee. |
| • | Prior to the January 1, 2009 completion of the asset purchase, Seller’s business was conducted entirely by Seller and none of Yankee, the Company nor any of its subsidiaries conducted any portion thereof. Accordingly, an audit of Seller’s 2008 and 2007 financial statements would require Yankee to consider Seller’s internal control over financial reporting, none of which have been in place or operative since completion of the January 1, 2009 asset purchase transaction (i.e., for almost two years). |
| • | Although Seller’s owner became a Yankee employee as part of the transaction, effective January 2010, Seller’s owner resigned his employment with Yankee, relocated his residence away from the Boston area, and no longer maintains any other business relationship with Yankee. |
| • | Yankee does not know where Seller’s accounting books and records are located, the breadth or depth of information contained therein, or the accuracy or completeness thereof. |
Yankee believes that the unaudited financial statements of Seller present fairly, in all material respects, the financial position of Seller as of December 31, 2008, and the results of its operations and its cash flows for the years ended December 31, 2008 and 2007 in conformity with accounting principles generally accepted in the United States of America.
F-30
Table of Contents
Yankee Environmental Services, Inc.
| FINANCIAL STATEMENTS AS OF DECEMBER 31, 2008 AND 2007, AND FOR THE YEARS ENDED DECEMBER 31, 2008 AND 2007 |
||||
| F-32 | ||||
| F-33 | ||||
| F-34 | ||||
| F-35 | ||||
| F-36 | ||||
F-31
Table of Contents
Yankee Environmental Services, Inc.
AS OF DECEMBER 31, 2008 AND 2007
(unaudited and in thousands)
| Unaudited | ||||||||
| 2008 | 2007 | |||||||
| ASSETS |
||||||||
| CURRENT ASSETS: |
||||||||
| Cash and cash equivalents |
$ | 11 | $ | 118 | ||||
| Accounts receivable |
1,892 | 1,006 | ||||||
| Prepaid expenses and other current assets |
67 | 76 | ||||||
| Total current assets |
1,970 | 1,200 | ||||||
| PROPERTY AND EQUIPMENT - Net |
387 | 255 | ||||||
| TOTAL |
$ | 2,357 | $ | 1,455 | ||||
| LIABILITIES AND SHAREHOLDERS’ EQUITY |
||||||||
| CURRENT LIABILITIES: |
||||||||
| Accounts payable |
$ | 445 | $ | 378 | ||||
| Lines of credit |
250 | 325 | ||||||
| Accrued liabilities |
5 | 179 | ||||||
| Billings in excess of contract revenues |
— | 11 | ||||||
| Current maturities of long-term debt |
— | 125 | ||||||
| Total current liabilities |
700 | 1,018 | ||||||
| LONG TERM DEBT |
— | 187 | ||||||
| Total liabilities |
700 | 1,205 | ||||||
| COMMITMENTS AND CONTINGENCIES |
||||||||
| Common stock—$0.00 par value; 200 issued and authorized, |
— | — | ||||||
| Additional paid-in capital |
23 | 23 | ||||||
| Retained earnings |
1,634 | 227 | ||||||
| SHAREHOLDERS’ EQUITY |
1,657 | 250 | ||||||
| TOTAL |
$ | 2,357 | $ | 1,455 | ||||
F-32
Table of Contents
Yankee Environmental Services, Inc.
FOR THE YEARS ENDED DECEMBER 31, 2008 AND 2007
(unaudited and in thousands)
| Unaudited | ||||||||
| 2008 | 2007 | |||||||
| REVENUES: |
||||||||
| Contract revenues |
$ | 14,181 | $ | 5,155 | ||||
| Costs of contract revenues |
10,347 | 3,876 | ||||||
| GROSS PROFIT |
3,834 | 1,279 | ||||||
| OPERATING EXPENSES: |
||||||||
| General and administrative expenses |
1,190 | 837 | ||||||
| OPERATING INCOME: |
2,644 | 442 | ||||||
| OTHER EXPENSE: |
||||||||
| Interest expense |
(63 | ) | (112 | ) | ||||
| INCOME BEFORE INCOME TAXES |
2,581 | 330 | ||||||
| INCOME TAX EXPENSE |
— | 1 | ||||||
| NET INCOME |
$ | 2,581 | $ | 329 | ||||
See notes to financial statements.
F-33
Table of Contents
Yankee Environmental Services, Inc.
STATEMENTS OF SHAREHOLDERS’ EQUITY
FOR THE YEARS ENDED DECEMBER 31, 2008 AND 2007
(unaudited and in thousands)
| Additional Paid In Capital |
Retained Earnings |
Total | ||||||||||
| BALANCE — January 1, 2007 |
$ | 23 | $ | (1 | ) | $ | 22 | |||||
| Net income |
— | 329 | 329 | |||||||||
| Sub S distributions |
— | (101 | ) | (101 | ) | |||||||
| BALANCE — December 31, 2007 |
$ | 23 | $ | 227 | $ | 250 | ||||||
| Net income |
— | 2,581 | 2,581 | |||||||||
| Sub S distributions |
— | (1,174 | ) | (1,174 | ) | |||||||
| BALANCE — December 31, 2008 |
$ | 23 | $ | 1,634 | $ | 1,657 | ||||||
See notes to financial statements.
F-34
Table of Contents
Yankee Environmental Services, Inc.
FOR THE YEARS ENDED DECEMBER 31, 2008 AND 2007
(unaudited and in thousands)
| Unaudited | ||||||||
| 2008 | 2007 | |||||||
| OPERATING ACTIVITIES: |
||||||||
| Net income |
$ | 2,581 | $ | 329 | ||||
| Adjustments to reconcile net income to net cash provided by operating activities: |
||||||||
| Depreciation and amortization |
117 | 94 | ||||||
| Changes in assets and liabilities: |
||||||||
| Accounts receivable |
(886 | ) | 381 | |||||
| Prepaid expenses and other current assets |
9 | 4 | ||||||
| Accounts payable and accrued expenses |
(107 | ) | (137 | ) | ||||
| Billings in excess of contract revenues |
(11 | ) | (274 | ) | ||||
| Net cash provided by operating activities |
1,703 | 397 | ||||||
| INVESTING ACTIVITIES: |
||||||||
| Purchases of property and equipment |
(248 | ) | — | |||||
| Net cash used in investing activities |
(248 | ) | — | |||||
| FINANCING ACTIVITIES: |
||||||||
| Borrowings (repayments) of lines of credit |
(75 | ) | (275 | ) | ||||
| Repayments of long-term debt |
(313 | ) | 81 | |||||
| Distributions |
(1,174 | ) | (101 | ) | ||||
| Net cash used in financing activities |
(1,562 | ) | (295 | ) | ||||
| Net change in cash and cash equivalents |
(107 | ) | 102 | |||||
| Cash and cash equivalents - Beginning of year |
118 | 16 | ||||||
| Cash and cash equivalents - End of year |
$ | 11 | $ | 118 | ||||
See notes to financial statements.
F-35
Table of Contents
YANKEE ENVIRONMENTAL SERVICES, INC.
AS OF AND FOR THE YEAR ENDED DECEMBER 31, 2008 AND 2007
(Unaudited and dollars in thousands)
| 1. | NATURE OF BUSINESS AND REMAINING INTEREST ACQUISITION |
Organization — Yankee Environmental Services, Inc (the “Company”) is a provider of environmental remediation services including asbestos abatement and removal of other hazardous materials in the Boston area. Yankee’s principal services consist of lead paint and asbestos abatement along with demolition services to private and government entities including schools, universities, hospitals and other businesses. On January 1, 2009, the assets of the Company were acquired by Yankee Environmental Services, LLC for a purchase price of $1.9 million. Effective upon the closing of the asset purchase, the Company ceased to conduct any business
| 2. | SUMMARY OF SIGNIFICANT ACCOUNTING POLICIES |
Use of Estimates — The preparation of financial statements in conformity with accounting principles generally accepted in the United States of America (“GAAP”) requires management to make estimates and assumptions that affect certain reported amounts and disclosures. Accordingly, actual results could differ from those estimates.
Revenues and Cost Recognition on Contracts — The majority of Yankee’s contracts for asbestos abatement services are fixed-price contracts, with others managed as time and materials. Substantially all of Yankee’s contract revenues are recognized under the percentage-of-completion method, using a cost-to-cost method to measure the extent of progress toward completion. Contract revenues are adjusted to reflect the gross profit percentage expected to be achieved upon ultimate completion of each project. Provisions for estimated losses on contracts in progress are made in the period in which such losses are determined. Claims for additional compensation due to Yankee are not recognized in contract revenues until such claims are settled. Billings on contracts are generally submitted after verification with the customers of physical progress and may not match the timing of revenue recognition. The difference between amounts billed and recognized as revenue is reflected in the balance sheet as either contract revenues in excess of billings or billings in excess of contract revenues. Change orders are often negotiated when a change in conditions from the original contract specifications is encountered, necessitating a change in project performance methodology. Such change orders are considered changes in the scope of the original projects to which they relate and the project estimates are adjusted accordingly.
The components of costs of contract revenues include labor, equipment (including depreciation, maintenance, insurance, and rentals), and project overhead. Hourly labor is generally hired on a project-by-project basis. Costs of contract revenues vary significantly depending on the type and location of work performed.
Classification of Current Assets and Liabilities — The Company includes in current assets and liabilities amounts realizable and payable in the normal course of contract completion, unless completion of such contracts extends significantly beyond one year.
Cash and Cash Equivalents — The Company considers all highly liquid investments purchased with an initial maturity of three months or less to be cash equivalents.
Accounts Receivable — Net — Accounts receivable represent amounts due or billable under the terms of contracts with customers, including amounts related to retainage. The Company anticipates collection of retainage within one year, and accordingly presents retainage as a current asset. The Company provides an allowance for estimated uncollectible receivables when events or conditions indicate that amounts outstanding are not recoverable.
F-36
Table of Contents
Property and Equipment — Net — Capital additions, improvements, and major renewals are classified as property and equipment and are carried at depreciated cost. Maintenance and repairs that do not significantly extend the useful lives of the assets or enhance the capabilities of such assets are charged to earnings as incurred. Depreciation is recorded over the estimated useful lives of property and equipment using the straight-line method and the mid-year depreciation convention. The estimated useful lives by class of assets are:
| Class |
Age (years) |
|||
| Operating equipment and systems |
5-7 | |||
Long-lived assets to be held and used are reviewed for possible impairment whenever events indicate that the carrying amount of such assets may not be recoverable by comparing the undiscounted cash flows associated with the assets to their carrying amounts. If such a review indicates an impairment, the carrying amount would be reduced to fair value. If long-lived assets are to be disposed, depreciation is discontinued, if applicable, and the assets are reclassified as held for sale at the lower of their carrying amounts or fair values less estimated costs to sell. No triggering events were identified in 2008 or 2007.
Concentration of Credit Risk — The Company grants credit to its customers. Generally, no collateral is required. The Company maintains reserves for potential credit losses and such losses, in aggregate, have not exceeded management’s expectations.
Income Taxes — Effective January 1, 1991, the Company elected, by unanimous consent of its shareholders, to be taxed under provisions of Subchapter S of the Internal Revenue Code. Under such election, the Company’s federal and state taxable income or loss is passed through to the individual shareholders. However, the state of Massachusetts the state of incorporation, does impose a tangible tax on the value of inventory and net fixed assets.
| 3. | ACCOUNTS RECEIVABLE |
Accounts receivable at December 31, 2008 and 2007 are as follows:
| 2008 | 2007 | |||||||
| Unaudited | ||||||||
| Accounts receivable |
$ | 1,354 | $ | 808 | ||||
| Retainage |
538 | 198 | ||||||
| Total accounts receivable - net |
$ | 1,892 | $ | 1,006 | ||||
| 4. | CONTRACTS IN PROGRESS |
The components of contracts in progress at December 31, 2008 and 2007 are as follows:
| 2008 | 2007 | |||||||
| Unaudited | ||||||||
| Billings in excess of costs and earnings: |
||||||||
| Amounts billed |
$ | — | $ | (416 | ) | |||
| Costs and earnings for contracts in progress |
— | 405 | ||||||
| Total billings in excess of contract revenues |
$ | — | $ | (11 | ) | |||
F-37
Table of Contents
| 5. | COMMITMENTS AND CONTINGENCIES |
During 2002, the Company secured a revolving line of credit with a bank. The credit limit was $600 through April 2007. In April 2007, $200 of the line of credit was converted to a term loan creating a new limit of $400. Advances bear interest at a rate of 1.50% over the bank’s prime rate. The line of credit is secured by all business assets. The balances of the line of credit at December 31, 2008 and 2007 are as follows:
| 2008 | 2007 | |||||||
| Unaudited | ||||||||
| Line of credit |
$ | 250 | $ | 325 | ||||
The Company had notes payable, which were all paid in full during 2008. The balances at December 31, 2008 and 2007 are as follows:
| 2008 | 2007 | |||||||
| Unaudited | ||||||||
| Note payable to leasing company |
$ | — | $ | 65 | ||||
| Note payable to bank |
— | 16 | ||||||
| Note payable to bank |
— | 154 | ||||||
| Note payable to financing company |
— | 104 | ||||||
| Total long term debt |
339 | |||||||
| Less interest |
— | (27 | ) | |||||
| Less current maturities |
— | (125 | ) | |||||
| Net long term debt |
$ | — | $ | 187 | ||||
* * * * * *
F-38