Attached files
| file | filename |
|---|---|
| 8-K - EXHIBIT 8-K - Encompass Health Corp | form8k-01102011presentation.htm |

29th Annual JP Morgan Healthcare Conference
San Francisco | January 10, 2011
San Francisco | January 10, 2011
Jay Grinney, President and Chief Executive Officer
1
Exhibit 99.1

The information contained in this presentation includes certain estimates, projections and other
forward-looking information that reflect our current views with respect to future events and financial
performance. These estimates, projections and other forward-looking information are based on
assumptions that HealthSouth believes, as of the date hereof, are reasonable. Inevitably, there will
be differences between such estimates and actual results, and those differences may be material.
There can be no assurance that any estimates, projections or forward-looking information will be
realized.
realized.
All such estimates, projections and forward-looking information speak only as of the date hereof.
HealthSouth undertakes no duty to publicly update or revise the information contained herein.
HealthSouth undertakes no duty to publicly update or revise the information contained herein.
You are cautioned not to place undue reliance on the estimates, projections and other forward-
looking information in this presentation as they are based on current expectations and general
assumptions and are subject to various risks, uncertainties and other factors, including those set
forth in the Form 10-K for the year ended December 31, 2009, our Form 10-Q for the quarters ended
March 31, 2010, June 30, 2010, and September 30, 2010, and in other documents we previously filed
with the SEC, many of which are beyond our control, that may cause actual results to differ
materially from the views, beliefs and estimates expressed herein.
Note Regarding Presentation of Non-GAAP Financial Measures
The following presentation includes certain “non-GAAP financial measures” as defined in
Regulation G under the Securities Exchange Act of 1934. Schedules are attached that reconcile
the non-GAAP financial measures included in the following presentation to the most directly
comparable financial measures calculated and presented in accordance with Generally
Accepted Accounting Principles in the United States. Our Form 8-K, dated January 10, 2011, to
which the following supplemental slides are attached as Exhibit 99.1, provides further explanation
and disclosure regarding our use of non-GAAP financial measures and should be read in
conjunction with these supplemental slides.
Forward-Looking Statements
2
Exhibit 99.1

|
Inpatient Rehabilitation Hospitals (“IRF”)
|
|
|
Outpatient Rehabilitation Satellite Clinics
|
|
|
Long-Term Acute Care Hospitals (“LTCH”)
|
|
|
Hospital-Based Home Health Agencies
|
|
|
Employees
|
|
|
Revenue in 2009
|
|
|
Inpatient Discharges in 2009
|
|
|
Outpatient Visits in 2009
|
|
|
Number of States
|
|
|
Exchange (Symbol)
|
|
3
Largest Provider of Inpatient Rehabilitative Healthcare Services in the U.S.
Our Company
|
Marketshare
|
|
~ 8% of IRFs
~ 17% of Licensed Beds ~ 22% of Patients Served |
Exhibit 99.1
Our Hospitals
Major Services
• Rehabilitation Physicians: manage and treat medical needs of patients
• Rehabilitation Nurses: oversee treatment programs of patients
• Physical Therapists: address physical function, mobility, safety
• Occupational Therapists: promote independence and re-integration
• Speech-Language Therapists: treat communication & swallowing disorders
• Case Managers: coordinate care plan with physician, caregivers and family
• Post-discharge services: outpatient therapy and home health
4
Exhibit 99.1

Our Patients
5
Most Common Conditions (Q3 2010)
1.Stroke 17.6%
2.Neurological 15.3%
3.Fracture of the lower extremity 11.1%
4.Debility 11.0%
5.Knee/Hip replacement 9.4%
6.Other orthopedic conditions 9.3%
7.Brain injury 7.4%
8.Cardiac conditions 4.3%
9.Spinal cord injury 3.6%
10.All other 11.0%
Referral Sources
94% Acute Care Hospitals
5% Physician Offices
1% Skilled Nursing Facilities
Admission to an IRF
• Physicians and acute care
hospital case managers are key
decision-makers.
hospital case managers are key
decision-makers.
• All IRF patients must meet
reasonable and necessary criteria
and must be admitted by a
physician.
reasonable and necessary criteria
and must be admitted by a
physician.
• All IRF patients must be medically
stable and have potential to
tolerate three hours of therapy per
day (minimum).
stable and have potential to
tolerate three hours of therapy per
day (minimum).
• IRF patients receive 24-hour, 7
days a week nursing care.
days a week nursing care.
• Average length of stay (ALOS) =
14.3 days
14.3 days
Exhibit 99.1

Our Quality
FIM Gain
Change in
Functional
Independence
Measurement
(based on an 18
point assessment)
from admission to
discharge
Functional
Independence
Measurement
(based on an 18
point assessment)
from admission to
discharge
LOS Efficiency
Functional gain
divided by length
of stay
divided by length
of stay
6
(1) Average = Expected, Risk-adjusted
Exhibit 99.1

(1) The 1,171 total and the 91 for HLS do not include HealthSouth Rehabilitation Hospital of Northern Virginia; Rehabilitation Hospital of Southwest Virginia;
Rehabilitation Hospital of Mesa, AZ; and Rehabilitation Hospital of Fredericksburg, VA. that were opened after the data collection. Desert Canyon
Rehabilitation Hospital and HealthSouth Sugar Land Rehabilitation Hospital, currently owned by HLS, were included in the 139 non-HLS freestanding.
Rehabilitation Hospital of Mesa, AZ; and Rehabilitation Hospital of Fredericksburg, VA. that were opened after the data collection. Desert Canyon
Rehabilitation Hospital and HealthSouth Sugar Land Rehabilitation Hospital, currently owned by HLS, were included in the 139 non-HLS freestanding.
(2) In 2009, HealthSouth averaged 1,177 total Medicare and non-Medicare discharges in its 90 consolidated hospitals and 6 long-term acute care hospitals.
Sources: FY 2011 CMS Rate Setting File - see slide 30.
7
Total Inpatient Rehabilitation Facilities (IRFs): 1,171(1)
Our Cost-Effectiveness
Exhibit 99.1

Our Payors
Prospective Payment System (“PPS”)
• Payments based on Case Mix Groups
(“CMGs”)
(“CMGs”)
– Diagnosis of patient’s illness
• Fixed payment per CMG adjusted for:
– Acuity/severity
– Regional wage differential
• Per diems for “short stays”
Per Diem or CMG
• Negotiated rate
• Some are “tiered” for acuity/severity
Variety of methodologies
Varies by state
Variety of methodologies
Medicare
Managed Care
• Includes managed
Medicare
Medicare
Other Third-Party Payors
Medicaid
Workers’ Comp./
Patients/Other
Patients/Other
Payment Methodology
Payor Source
8
70.1%
21.8%
2.3%
4.0%
1.8%
Exhibit 99.1

Note: These numbers are program spending only and do not include beneficiary copayments.
Source: Centers for Medicare and Medicaid Services, Office of the Actuary (MedPAC June 2010 Data Book - Page 130), 2009 and 2010
Medical Trustee Report
Medical Trustee Report
Medicare Spending on Post-Acute Services
Skilled nursing
facilities 18.1%
facilities 18.1%
Home health
agencies 17.7%
agencies 17.7%
Inpatient
rehabilitation
hospitals 8.4%
Long-term acute
care hospitals 5.7%
9
2009
Medicare
Margin
Medicare
Margin
Post-Acute Settings
Inpatient rehabilitation
spending (% of total
Medicare spending)
spending (% of total
Medicare spending)
Exhibit 99.1

|
Future Regulatory Risk
|
Inpatient
Rehabilitation Facility |
Skilled Nursing
Facility |
Long-Term Acute
Care Hospital |
Home Health
|
|
1. Re-basing payment system
|
No
|
Yes; RUGS IV and MDS
3.0 being implemented FY 2011/2012 |
No
|
Yes; would be required
as part of PPACA starting in 2014 |
|
2. Major outlier payment adjustments
|
No
|
No
|
Yes; will occur when
MMSEA relief expires (short stay outliers) |
Yes; 10% cap per agency;
2.5% taken out of outlier
pool (per PPACA) |
|
3. Upcoding adjustments
|
No
|
Yes; occurring in
FY 2010 |
Yes; occurring in FY
2010 and proposed (2.5%) for FY 2011 |
Yes; occurring in CYs
2010 (-2.75%), and proposed (-3.79%) for 2011 and 2012 |
|
4. Patient criteria
|
No; 60% Rule
already in place
|
No
|
Study dictated as
part of MMSEA |
PPACA requires a patient -
physician “face-to-face” encounter; new therapy coverage proposed
|
|
5. Healthcare Reform
|
|
|
|
|
|
• Market basket update reductions
|
• Known
|
• Known
|
• Known
|
• Known
|
|
• Productivity adjustments
|
• Begins FY 2012
|
• Begins FY 2012
|
• Begins FY 2012
|
• Begins FY 2015
|
|
• Bundling
|
• Pilot to be
established by 2013 |
• Pilot to be
established by 2013 |
• Pilot to be
established by 2013 |
• Pilot to be
established by 2013 |
|
• Independent Payment Advisory Board
|
• FY 2019
|
• FY 2015
|
• FY 2019
|
• CY 2015
|
|
• New quality reporting requirements
|
• Begins FY 2014
|
• N/A
|
• Begins FY 2014
|
• N/A
|
|
• Value based purchasing
|
• Pilot begins 2016
|
• Post 2012
|
• Pilot begins 2016
|
• Post 2012
|
|
6. Other
|
N/A
|
Forecast error
being implemented in FY 2011 |
25% Rule regulatory
relief expires in 2012/2013; prohibition on new LTCHs through 2012 |
Limits on transfer
of ownership |
Post-Acute Regulatory Risks
Sources: Healthcare Reform Bill (PPACA, HERA),CMS Regulatory published rules and MMSEA
10
Exhibit 99.1
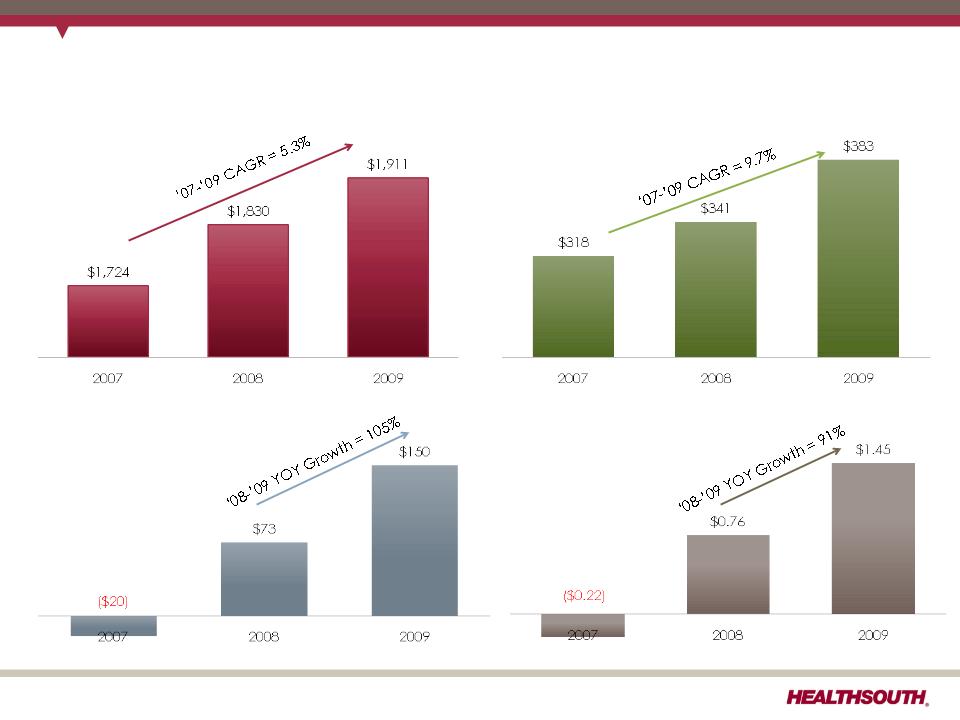
Our Track Record
11
Revenue
($ in millions, except adjusted EPS)
Adjusted EBITDA
Adjusted Net Income
Adjusted EPS
(1) Reconciliation to GAAP provided on slides 27, 31-35.
(1)
(1)
(1)
(1)
Exhibit 99.1

Our Track Record (cont’d)
12
Leverage Ratio(1)
(billions)
(1) Reconciliation to GAAP provided on slides 27-29, 31-35.
Interest Expense
$229
$126
(1)
Exhibit 99.1

• Volume:
– 5.3% discharge growth vs. Q4 2009 (2.8% for FY 2010 vs. FY 2009)
– 2.9% same store discharge growth vs. Q4 2009 (1.2% for FY 2010 vs. FY
2009)
2009)
• Pricing:
– 2.5%-2.7% increase in net revenue per discharge vs. Q4 2009
• Expense Management:
– SWB as a percent of net revenue < 50.0%
– Bad debt as a percent of net revenue better than expected and
consistent with Q3 2010
consistent with Q3 2010
• Adjusted EPS: (1)
– October refinancing will result in approximately $12.0 million, or $0.11
per diluted share, loss on early extinguishment of debt and $3.4 million,
or $0.03 per diluted share, higher interest expense in Q4 2010.
per diluted share, loss on early extinguishment of debt and $3.4 million,
or $0.03 per diluted share, higher interest expense in Q4 2010.
Q4 2010 Initial Observations
13
(1) Adjusted income from continuing operations per share; reconciliation to GAAP provided on slides 31-35.
Exhibit 99.1
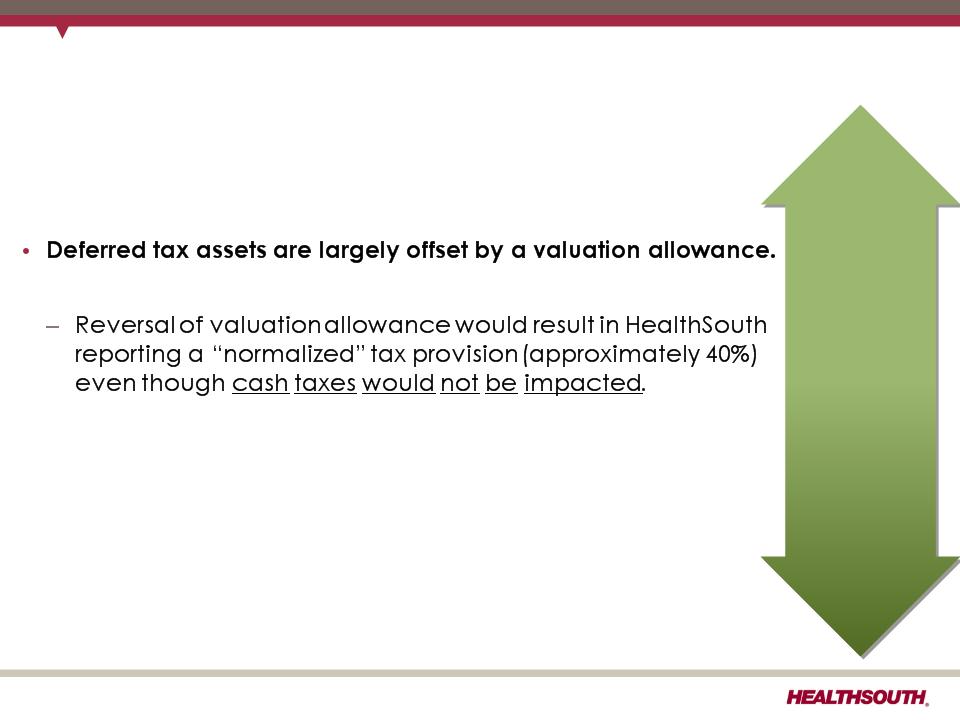
Future Adjusted EPS(1) Guidance Considerations
• Refinancing activities significantly impact adjusted EPS.
– Loss on early extinguishment of debt (many companies
exclude)
exclude)
– Valuation allowance is assessed quarterly.
• Historical adjustments to EPS are expected to roll-off during
2011.
2011.
– Loss/gain on interest rate swaps
– Government, class action and related settlements
expense
expense
– Professional fees - accounting, tax and legal
14
These
factors
may
warrant a
change in
our
definition
of adjusted
EPS.
factors
may
warrant a
change in
our
definition
of adjusted
EPS.
(1) Adjusted income from continuing operations per share; reconciliation to GAAP provided on slides 31-35.
Exhibit 99.1

Updated 2010 Guidance
|
|
15
Adjusted Consolidated EBITDA (1) $418 million to $421 million
Adjusted Earnings per Share (1) $1.67 to $1.70
(1) Adjusted income from continuing operations per share; reconciliation to GAAP provided on slides 27, 31-35.
• The Company has not yet closed its books for
Q4 and YE 2010.
Q4 and YE 2010.
• Q4 2010 and YE 2010 results and 2011 guidance
will be provided after market close on Feb. 17,
2011, and discussed during an investor
conference call at 9:30 a.m. EST on
Feb. 18, 2011.
will be provided after market close on Feb. 17,
2011, and discussed during an investor
conference call at 9:30 a.m. EST on
Feb. 18, 2011.
Exhibit 99.1

Our Business Outlook: 2011 to 2013
Business Model
• Adjusted Consolidated EBITDA CAGR: 5-8% (1)
• Adjusted Free Cash Flow CAGR: 12-17% (1)
Strategy
2010
2011
2012
2013
Deleveraging
(2)
(2)
Goal: < 4.0x
debt to EBITDA
debt to EBITDA
Goal: ~ 3.5x
debt to EBITDA
debt to EBITDA
Longer-Term Goal: ~ 3.0x
debt to EBITDA
debt to EBITDA
Growth
Organic growth (includes capacity expansions)
De novos (~ 2-3/year)
IRF acquisitions (~ 2-3/year)
Opportunistic, disciplined acquisitions
of complementary post-acute services
of complementary post-acute services
Key Operational
Initiatives
Initiatives
• Labor / outcomes / quality optimization
• TeamWorks = Care Management
• “CPR” (Comfort, Professionalism, Respect) Initiative
16
(1) Reconciliation to GAAP provided on slides 27-29, 31-35.
(2) Exclusive of any E&Y recovery.
Exhibit 99.1

Deleveraging: Remains a Top Priority
• The 10.75% notes have an initial call date of June 2011 and represent
our most attractive debt repayment/refinancing opportunity.
our most attractive debt repayment/refinancing opportunity.
• We have at least three potential funding sources for reducing the
10.75% notes:
10.75% notes:
Free Cash Flow
― Benefiting in 2011 from the expiration of the interest rate swaps
― Also will be used to fund growth opportunities
― Capital allocation based predominately on economic returns
Revolving Credit Facility
― Capacity determined by liquidity considerations
New Debt Issuances
― Interest rate arbitrage opportunity determined by prevailing debt
market conditions
market conditions
17
Exhibit 99.1

Revenue Assumptions
18
Revenue
Volume
• 2.5% to 3.5% annual growth (excludes
acquisitions)
acquisitions)
• Includes bed expansions, de novos
and unit consolidations
and unit consolidations
Medicare
Managed
Care
Care
Other
(1) We believe based on the 2011 Medicare rule for IRFs, HealthSouth should realize an increase of approximately 2.1%
annually.
annually.
(2) Management estimates
Exhibit 99.1
(1) Data provided by UDSMR, a data gathering and analysis organization for the rehabilitation industry; represents ~ 65-70% of industry,
including HealthSouth sites.
including HealthSouth sites.
(2) Includes consolidated HealthSouth inpatient rehabilitation hospitals and long-term acute care hospitals classified as same store during
that time period.
that time period.
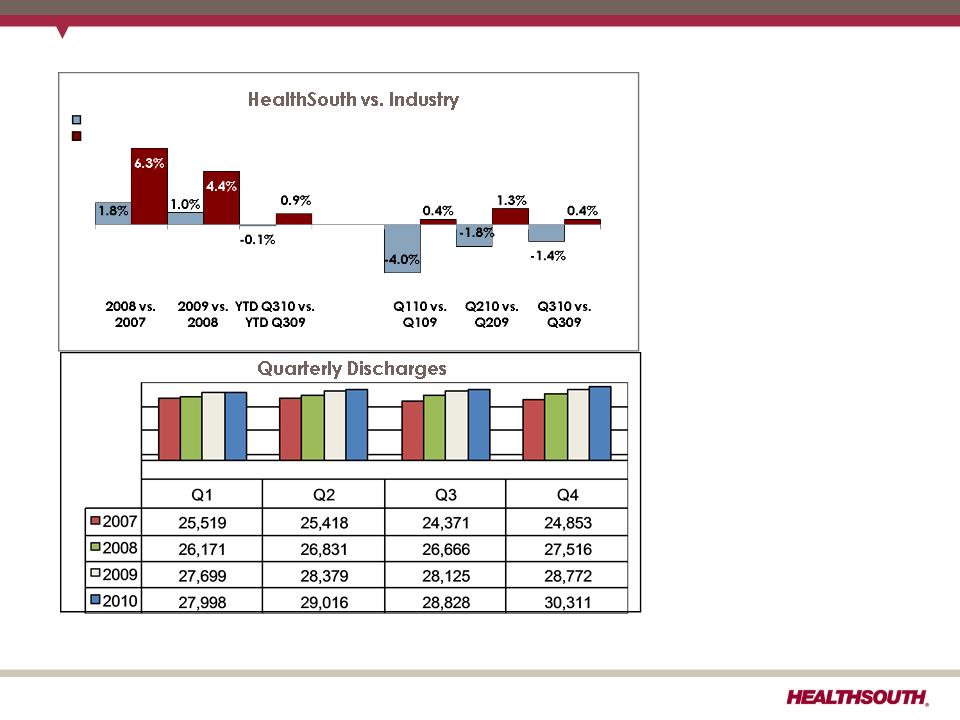
Historic Discharge Growth vs. Industry
• HealthSouth’s
volume growth has
outpaced
competitors’.
volume growth has
outpaced
competitors’.
• TeamWorks =
standardized and
enhanced sales &
marketing
standardized and
enhanced sales &
marketing
• Bed additions will
help facilitate
continued organic
growth:
help facilitate
continued organic
growth:
― Anticipate ~100
beds/year
beds/year
(+/- 20 beds)
UDS Industry Sites (1)
HLS Same Store (2)
19
est.
Exhibit 99.1

Expense Assumptions
20
Expense
Salaries & Benefits (1)
Hospital Expenses
•Other operating and supplies
tracking with inflation
tracking with inflation
4.5% of revenue
(excludes stock-based compensation)
Salaries
& Benefits
Hospital
Expenses
Expenses
(1) ~85% Salary; ~15% Benefits
Exhibit 99.1

Portfolio Growth
Cash Payback Period
Year 1 Year 2 Year 3 Year 4 Year 5 Year 6 Year
7
7
Acquisitions
De novos (1)
(1) Assumes average investment per bed: ~ $450K.
21
• Target: 2-3 de novos and acquisitions/yr
• All projects have minimum IRR of 15%.
• Longer payback on de novos versus
acquisitions is attributable to:
acquisitions is attributable to:
- 12-15 month construction period
- Initial ramp-up of operations on de novos
Exhibit 99.1

22
Acute Care
Hospital
Hospital
Discharge
Hospice
Inpatient
Rehabilitation
Facility (1)
Rehabilitation
Facility (1)
Skilled
Nursing
Facility
Nursing
Facility
Home
Health (1)
Health (1)
(Highest Acuity)
(Lowest Acuity)
Future Growth: Complementary Post-Acute Care Services
Source: MedPac, CMS and Wall Street research
(1) For information on HealthSouth’s hospital portfolio, see slide 3.
Exhibit 99.1

• Growth strategies will complement deleveraging priority.
- “Highest and best use” of FCF will determine where to invest.
• The company continues to have excellent organic growth opportunities.
- Locations in above-average “Rehab CAGR” markets
- Non-discretionary nature of many conditions served
- Track record of consistent market share gains
• De novos and targeted IRF acquisitions will allow entry to, and growth in,
new markets.
new markets.
- Disciplined evaluation process
- Proven track record of success
• Longer-term consideration of acquiring complementary post-acute
services predicated on:
services predicated on:
- Achieving deleveraging objective
- Obtaining regulatory clarity
- Favorable market conditions
Growth: Summary
23
Exhibit 99.1

Free Cash Flow Reinvestment
24
• $500 million of 10.75% notes callable June 2011
• Growth in core business
• Bed expansions
• Hospital acquisitions
• Acute care IRF unit acquisition/consolidation
• De novo hospitals
• Lower capital cost
• Share repurchase
• Offset shares underlying convertible preferred
shares
shares
• Offset shares issued in settlement of securities
litigation
litigation
Adjusted free cash flow CAGR: 12-17%
• Acquisitions of complementary business
Exhibit 99.1

(1) Reconciliation to GAAP provided on slides 27-29, 31-35.
The HealthSouth Value Proposition
Poised for Growth
Financial Strength/Strong
Cash Flow Generation
Cash Flow Generation
Industry Leading Position
Attractive Healthcare Sector
25
Exhibit 99.1

Appendix
26
Exhibit 99.1

(1) Notes on page 35.
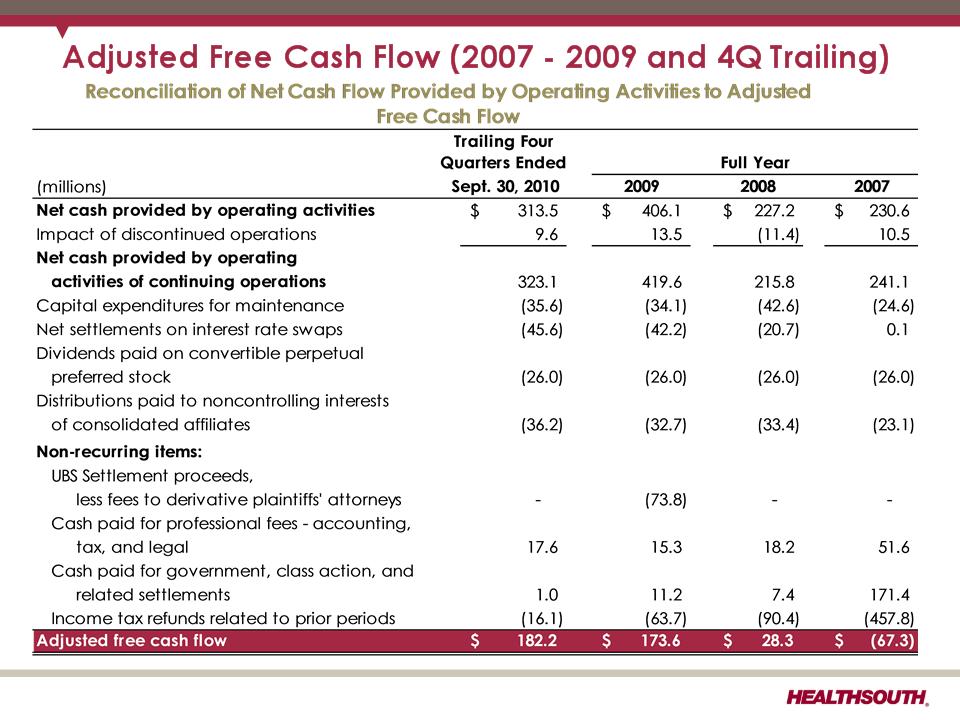
Net Cash Provided by Operating Activities
27
Exhibit 99.1

Adjusted Free Cash Flow (2010 vs. 2009)
(1) Q3 2009 working capital benefited as a result of $19 million for working capital related to the interest payment accrual timing and $28
million in receivables due to suspension of Medicare denials and enhanced collections.
million in receivables due to suspension of Medicare denials and enhanced collections.
28
Exhibit 99.1
29
Exhibit 99.1

CMS Fiscal Year 2011 IRF Rate Setting File Analysis
Notes:
(1) All data provided was filtered and compiled from the Centers for Medicare and
Medicaid Services (CMS) Fiscal Year 2011 IRF rate setting Final Rule file found at
http://www.cms.hhs.gov/InpatientRehabFacPPS/07_DataFiles.asp#TopOfPage. The
data presented was developed entirely by CMS and is based on its definitions
which are different in form and substance from the criteria HealthSouth uses for
external reporting purposes. Because CMS does not provide its detailed
methodology, HealthSouth is not able to reconstruct the CMS projections or the
calculation.
(2) The CMS file contains data for each of the 1,171 inpatient rehabilitation facilities
used to estimate the policy updates for the FY 2011 IRF-PPS Final Rule. Most of the
data represents historical information from the CMS fiscal year 2009 period and
does not reflect the same HealthSouth hospitals in operation today. The data
presented was separated into three categories: Freestanding, Units, and
HealthSouth. HealthSouth is a subset of Freestanding and the Total.
30
Exhibit 99.1

(1) (2) (3) (4) - Notes on page 35.
31
Exhibit 99.1

32
(1) (2) (3) (4) - Notes on page 35.
Exhibit 99.1

33
(1) (2) (3) (4) - Notes on page 35.
Exhibit 99.1

34
(1) (2) (3) (4) - Notes on page 35.
Exhibit 99.1

Reconciliation Notes
1. Adjusted income from continuing operations and Adjusted Consolidated EBITDA are
non-GAAP financial measures. The Company’s leverage ratio (total consolidated debt
to Adjusted Consolidated EBITDA for the trailing four quarters) is, likewise, a non-GAAP
financial measure. Management and some members of the investment community
utilize adjusted income from continuing operations as a financial measure and
Adjusted Consolidated EBITDA and the leverage ratio as liquidity measures on an
ongoing basis. These measures are not recognized in accordance with GAAP and
should not be viewed as an alternative to GAAP measures of performance or liquidity.
In evaluating these adjusted measures, the reader should be aware that in the future
HealthSouth may incur expenses similar to the adjustments set forth above.
2. Per share amounts for each period presented are based on basic weighted average
common shares outstanding for all amounts except adjusted income from continuing
operations per diluted share, which is based on diluted weighted average shares
outstanding. The difference in shares between the basic and diluted shares
outstanding is primarily related to our convertible perpetual preferred stock.
3. Adjusted income from continuing operations per diluted share and Adjusted
Consolidated EBITDA are two components of our guidance.
Consolidated EBITDA are two components of our guidance.
4. The Company’s credit agreement allows certain other items to be added to arrive at
Adjusted Consolidated EBITDA, and there may be certain other deductions required.
Adjusted Consolidated EBITDA, and there may be certain other deductions required.
35
Exhibit 99.1