Attached files
UNITED STATES SECURITIES AND EXCHANGE COMMISSION
Washington, D.C. 20549
FORM 10-K
x ANNUAL REPORT UNDER SECTION 13 OR 15(d) OF THE SECURITIES EXCHANGE ACT OF 1934 (FEE REQUIRED)
For the fiscal year ended September 30, 2010
o TRANSACTION REPORT UNDER SECTION 13 OR 15(d) OF THE SECURITIES EXCHANGE ACT OF 1934 (NO FEE REQUIRED)
For the transaction period from ________ to ________
Commission File number 0-25541

VISUALANT, INC.
(Exact name of registrant as specified in its charter)
|
Nevada
|
91-1948357
|
|
(State or other jurisdiction of incorporation
|
(I.R.S. Employer
|
|
or organization)
|
Identification No.)
|
|
500 Union Street, Suite 406
|
|
|
Seattle, Washington
|
98101
|
|
(Address of principal executive offices)
|
(Zip Code)
|
|
Issuer's telephone number, including area code
|
206-903-1351
|
|
Securities registered pursuant to Section 12 (b) of the Exchange Act:
|
|
|
Common
|
OTCBB
|
|
(Title of each class)
|
(Name of each exchange on which registered)
|
|
Securities registered pursuant to Section 12 (g) of the Exchange Act:
|
|
|
None
|
|
|
(Title of Class)
|
Indicate by check mark if the registrant is a well-known seasoned issuer, as defined in Rule 405 of the Securities Act. o Yes ý No
Indicate by check mark if the registrant is not required to file reports pursuant to Section 13 or Section 15(d) of the Exchange Act. o Yes ý No
1
Indicate by check mark whether the registrant (1) has filed all reports required to be filed by Section 13 or 15(d) of the Exchange Act during the past 12 months (or for such shorter period that the registrant was required to file such reports), and (2) has been subject to such filing requirements for the past 90 days. ý Yes o No
Indicate by check mark whether the registrant has submitted electronically and posted on its corporate Web site, if any, every Interactive Data File required to be submitted and posted pursuant to Rule 405 of Regulation S-T during the preceding 12 months (or for such shorter period that the registrant was required to submit and post such files). o Yes o No
Indicate by check mark if disclosure of delinquent filers in response to Item 405 of Regulation S-K (§229.405) is not contained herein, and will not be contained, to the best of registrant’s knowledge, in definitive proxy or information statements incorporated by reference in Part III of this Form 10-K or any amendment to this Form 10-K. o
Indicate by check mark whether the registrant is a large accelerated filer, an accelerated filer, a non-accelerated filer, or a smaller reporting company. See the definitions of "large accelerated filer," "accelerated filer," and "smaller reporting company" in Rule 12b-2 of the Exchange Act. (Check one):
|
Large accelerated filer
|
o
|
Accelerated filer
|
o
|
Non-accelerated filer
|
o
|
Smaller reporting company
|
ý
|
|
(Do not check if a smaller reporting company)
|
Indicate by check mark whether the registrant is a shell company (as defined in Rule 12b-2 of the Exchange Act). o Yes ý No
As of March 31, 2010 (the last business day of our most recently completed second fiscal quarter), based upon the last reported trade on that date, the aggregate market value of the voting and non-voting common equity held by non-affiliates (for this purpose, all outstanding and issued common stock minus stock held by the officers, directors and known holders of 10% or more of the Company’s common stock) was $1,232,812.
As of December 30, 2010, the Company had 38,249,374 shares of common stock issued.
2
|
TABLE OF CONTENTS
|
|
Page
|
||
|
PART 1
|
||
|
ITEM 1.
|
Description of Business
|
4 |
|
ITEM 1A.
|
Risk Factors
|
7 |
|
ITEM 1B
|
Unresolved Staff Comments
|
10 |
|
ITEM 2.
|
Properties
|
10 |
|
ITEM 3.
|
Legal Proceedings
|
10 |
|
ITEM 4.
|
Submission of Matters to Vote of Securities Holders
|
10 |
|
PART II
|
||
|
ITEM 5.
|
Market for Common Equity, Related Stockholder Matters and Issuer Purchases of Equity Securities
|
11 |
|
ITEM 6.
|
Selected Financial Data
|
12 |
|
ITEM 7.
|
Management’s Discussion and Analysis of Financial Condition and Results of Operations
|
12 |
|
ITEM 7A.
|
Quantitative and Qualitative Disclosures About Market Risk
|
16 |
|
ITEM 8.
|
Financial Statements and Supplementary Data
|
16 |
|
ITEM 9.
|
Changes in and Disagreements with Accountants on Accounting and Financial Disclosure
|
16 |
|
ITEM 9A.
|
Controls and Procedures
|
16 |
|
ITEM 9B.
|
Other Information
|
17 |
|
PART III
|
||
|
ITEM 10.
|
Directors, Executive Officers and Corporate Governance
|
17 |
|
ITEM 11.
|
Executive Compensation
|
19 |
|
ITEM 12.
|
Security Ownership of Certain Beneficial Owners and Management and Related Stockholder Matters
|
19 |
|
ITEM 13.
|
Certain Relationships and Related Transactions, and Director Independence
|
19 |
|
ITEM 14.
|
Principal Accounting Fees and Services
|
19 |
|
PART IV
|
||
|
ITEM 15.
|
Exhibits, Financial Statement Schedules
|
19 |
|
SIGNATURES
|
22 |
3
PART I
DISCLOSURE REGARDING FORWARD-LOOKING STATEMENTS
The following discussion, in addition to the other information contained in this report, should be considered carefully in evaluating us and our prospects. This report (including without limitation the following factors that may affect operating results) contains forward-looking statements (within the meaning of Section 27A of the Securities Act of 1933, as amended ("Securities Act") and Section 21E of the Securities Exchange Act of 1934, as amended ("Exchange Act") regarding us and our business, financial condition, results of operations and prospects. Words such as "expects," "anticipates," "intends," "plans," "believes," "seeks," "estimates" and similar expressions or variations of such words are intended to identify forward-looking statements, but are not the exclusive means of identifying forward-looking statements in this report. Additionally, statements concerning future matters such as revenue projections, projected profitability, growth strategies, development of new products, enhancements or technologies, possible changes in legislation and other statements regarding matters that are not historical are forward-looking statements.
Forward-looking statements in this report reflect the good faith judgment of our management and the statements are based on facts and factors as we currently know them. Forward-looking statements are subject to risks and uncertainties and actual results and outcomes may differ materially from the results and outcomes discussed in the forward-looking statements. Factors that could cause or contribute to such differences in results and outcomes include, but are not limited to, those discussed below and in "Management's Discussion and Analysis of Financial Condition and Results of Operations" as well as those discussed elsewhere in this report. Readers are urged not to place undue reliance on these forward-looking statements which speak only as of the date of this report. We undertake no obligation to revise or update any forward-looking statements in order to reflect any event or circumstance that may arise after the date of this report.
ITEM 1. DESCRIPTION OF BUSINESS
THE COMPANY AND OUR BUSINESS
Visualant, Inc. (the “Company” or “Visualant”) was incorporated under the laws of the State of Nevada on October 8, 1998 with authorized common stock of 200,000,000 shares at $0.001 par value. On September 13, 2002, 50,000,000 shares of preferred stock with a par value of $0.001 were authorized by the shareholders. There are no preferred shares issued and the terms have not been determined. Our executive offices are located in Seattle, Washington. As of June 8, 2010, we are no longer in the development stage.
We develop low-cost, high speed, light-based security and quality control solutions for use in homeland security, anti-counterfeiting, forgery/fraud prevention, brand protection and process control applications. Our patent-pending technology uses controlled illumination with specific bands of light, to establish a unique spectral signature for both individual and classes of items. When matched against existing databases, these spectral signatures allow precise identification and authentication of any item or substance. This breakthrough optical sensing and data capture technology is called Spectral Pattern Matching (SPM). SPM technology can be miniaturized and is easily integrated into a variety of hand-held or fixed mount configurations, and can be combined in the same package as a bar-code or biometric scanner. As of September 30, 2010, we had six utility patent applications with the U.S. Patent Office and one patent pending in Japan.
Through our wholly owned subsidiary, TransTech Systems, Inc., we provide security and authentication solutions to security and law enforcement markets throughout the United States.
ACQUISITION OF TRANSTECH SYSTEMS, INC. (“TransTech”)
We closed the acquisition of TransTech of Aurora, OR on June 8, 2010 and recorded the results from June 8, 2010 to September 30, 2010.
TransTech, founded in 1994, is a distributor of access control and authentication systems serving the security and law enforcement markets. With recorded revenues of $10 million in 2009, TransTech has a respected national reputation for outstanding product knowledge, sales and service excellence.
This acquisition is expected to accelerate market entry and penetration through the acquisition of well-operated and positioned distributors of security and authentication systems like TransTech, thus creating a natural distribution channel for products featuring our proprietary SPM technology.
Our strategy of the next 18 to 24 months is to generate substantially increase revenues through the further acquisition of other high quality companies complementary to TransTech, growth of TransTech and the sale and license of SPM products.
4
PROPOSED ACQUISITION OF RATLAB LLC (“RATLab”)
On October 1, 2010, we signed a Letter of Intent to acquire all Visualant related assets of the RATLab.
The RATLab is a Seattle based research and development laboratory created by Dr. Tom Furness, founder and Director of the HITLab International, with labs at Seattle, University of Canterbury in New Zealand, and the University of Tasmania in Australia. The RATLab is guided by Dr. Tom Furness and Dr. Brian Schowengerdt, a research scientist in the field of optics and vision science, who developed the Spectral Pattern Matching (“SPM”) technology under contract for Visualant.
With this acquisition, we will consolidate all intellectual property relating to the SPM technology in the Company. In addition to its current authentication and security applications of SPM, we will now own all other applications including the important fields of medicine, agriculture, and the environment and begin the creation of the Visualant Laboratory.
Upon the closing of this asset acquisition transaction, Dr. Tom Furness and Dr. Brian Schowengerdt will continue to provide technology leadership to us, under terms that are still subject to negotiation.
We are proposing to acquire the Visualant related assets of the RATLab as follows:
a. One million shares (1,000,000) of the Company’s common stock at closing valued at twenty cents ($0.20) per share, the price during the negotiation of this agreement.
b. Two hundred and fifty thousand dollars ($250,000), with one hundred thousand dollars ($100,000) payable at closing and one hundred and fifty thousand dollars ($150,000) to be paid no later than the first anniversary of closing.
c. The outstanding promissory note owing to Tom Furness in the amount of $65,000 with accrued interest is to be paid at closing. The interest is to be calculated on a 7% annualized basis beginning September 1, 2006.
The acquisition of the Visualant related assets of the RATLab is expected to close during the first calendar quarter of 2011.
OTHER
On December 7, 2009, we obtained $250,000 of financing from Coach Capital pursuant to a Convertible Promissory Note. Interest accrues at 8% and the $250,000 may be converted into restricted common stock on November 27, 2010 at $0.15 per share. This financing places certain restrictions on us. In addition, Coach Capital received warrants to purchase 833,333 shares of the Company’s common stock at $0.15 per share. The warrant expires 3 years from the date of issuance.
As was disclosed in the Company’s 8-K filing, on November 17, 2009, Mr. Erickson has assumed the positions of CEO, President and interim CFO, Secretary and Treasurer as a result of the resignation of Mr. Bradley Sparks from those positions. Mr. Sparks continues to serve as a Director of the Company. On May 10, 2010, Mr. Erickson resigned from the positions of CFO, Secretary and Treasurer and Mark Scott was appointed to those positions. These management changes were disclosed in our 8-K filing on May 12, 2010.
CORPORATE INFORMATION
We were incorporated in Delaware on November 12, 1998. The Company’s executive offices are located at 500 Union Street, Suite 406, Seattle, WA 98101. The Company’s telephone number is (206) 903-1351 and its principal website address is located at www.visualant.net. The information on our website is not incorporated as a part of this Form 10-K.
THE COMPANY’S COMMON STOCK
Our common stock trades on the OTCBB Exchange under the symbol “VSUL.OB.”
INDUSTRY OVERVIEW
Visualant’s SPM technology resides in the general marketplace for spectroscopy (measurement of light according to its spectrum) and spectrometry (the measurement of the chemical or atomic components as a function of light reflected or absorbed by them). These analytic tools are typically fragile and expensive often costing tens or hundreds of thousands of dollars. The Visualant SPM technology is flexible, sturdy and has a very low cost.
The Visualant SPM technology can used to create low cost, ubiquitous analytic devices that can be used in numerous applications in the broad. There is no room for error in security and authentication, hence the industry requires layers of redundancies in order to provide hoped for failsafe security. The security and authentication industry uses numerous tools in its pursuit of security. These include RFID chips and holograms for access control cards, threads and holograms in currency, and other means of marking to thwart counterfeiting. Visualant SPM technology provides a level of redundancy without the addition of any specific marking. The SPM technology simply sees the colors present and determines those colors accuracy as against the prescribed standard. In this case, Visualant SPM technology exists in the broad industry of component providing solutions for security and authentication.
5
TransTech, our wholly-owned subsidiary, is a security and authentication distribution company selling products to over 500 dealers in the United States. TransTech’s products include a variety of security and authentication products including printers, access control devices and numerous components. Distribution is fragmented in the security and authentication marketplace. There are large companies, including Scan Source Security, Wynit, Inc. and Plasco ID, whom increasingly sell directly to customers via the Internet and smaller regional and national distributors who sell to these same customers and provide value added services and support. Often called value added resellers or VARs, distributors such as TransTech work hard to maintain their customers through service and support.
KEY MARKET PRIORITIES
Currently, our key market priorities are, among other things, to:
|
•
|
Commercialize the Visualant technology and close sales in the United States and Japan.
|
|
•
|
Implement synergies between TransTech acquisition and the Company.
|
|
•
|
Develop license and royalty producing opportunities for the SPM technology outside the core security and authentication marketplace to include medical, agricultural and environmental diagnostics.
|
|
|
•
|
Close the acquisition of the Visualant related assets of the RATLab LLC.
|
|
|
•
|
Pursue additional acquisitions which extend the product range and geographic reach of TransTech.
|
|
•
|
Improve profitability of the Company by increasing sales and managing expenses.
|
|
•
|
Acquire growth businesses at discounted prices in our target sectors and markets in conjunction with business partners. We expect to focus on growth opportunities with distressed businesses that require improvements in management, financial processes and liquidity to be successful.
|
|
•
|
Leverage our presence in Asia utilizing our Japanese directors.
|
|
•
|
Enhance our investor relations services.
|
PRIMARY RISKS AND UNCERTAINTIES
We are exposed to various risks related to our need for additional financing, the sale of significant numbers of our shares, a volatile market price for our common stock and our merger and acquisition activities. These risks and uncertainties are discussed in more detail below in Part I, Item 1A.
DISTRIBUTION METHODS
Distribution is fragmented in the security and authentication marketplace. There are large companies who increasingly sell directly to customers via the Internet and smaller regional and national distributors who sell to these same customers and provide value added services and support. Often called value added resellers or VARs, distributors such as TransTech work hard to maintain their customers through service and support.
The Visualant SPM technology, as focused upon the security and authentication marketplace will provide TransTech with higher margin proprietary products. Visualant will be able to leverage its built-in channel of distribution at TransTech and obtain speed to market advantage. At the same time, where appropriate, Visualant will utilize broad global channels of distribution for its SPM technology. The Company also expects to enter into joint ventures with co-development partners who may have their own channels of distribution.
COMPETITION
We are not aware of any direct competitors using technology with capabilities of the Visualant SPM technology in the security and authentication marketplace. There are several indirect competitors in the form of other methods for determining the authenticity of products and people. These competitive products include the use of RFID chips, holograms, iris scans, fingerprints and other means of determining whether a person or product is authentic. Many companies compete in the security and authentication marketplace with various solutions many of which perform with excellence. We believe that we can provide an accurate, cost effective component which will add value to customers looking for additional inexpensive redundancies to solve their security and authentication problems.
6
As discussed above under “Distribution Methods,” TransTech does face direct competition from both OEMs selling directly to end users/customers and from other distributors of both the same products as TransTech distributes and competing products.
GEOGRAPHICAL MARKETS
We primarily operate in the U.S. and Japan. The Company is seeking acquisitions in other markets in order to expand its reach to the global marketplace.
DEVELOPMENT OF SPECTRUM PATTERN MATCHING TECHNOLOGY
On October 23, 2008, the Company and RATLab entered into definitive agreements which provide for a non-commercial non-exclusive license of the Company’s technology to RATLab for the purpose of continuing research and development with a license back to the Company for enhancements that are developed. Further, an exclusive license was entered into between the Company and RATLab for four fields of use: medical, agricultural, environmental and jewelry. This exclusive license provides for certain performance milestones, a market-rate royalty to the Company and an equity participation in an entity to be formed by RATLab to commercialize the Company’s technology in the enumerated fields of use. In accordance with the definitive agreements, RATLab formed Novabeam, Inc.(“Novabeam”)-, an affiliate for purposes of commercializing the intellectual property, of which 10% was sold and transferred to the Company for $50. Finally, in satisfaction of outstanding matters, a total of 1,850,000 shares of the Company’s common stock was issued, subject to certain restrictions, to current and former RATLab employees and consultants.
The Company now intends to acquire all Visualant related assets of the RATLab LLC pursuant to the Letter of Intent executed between the Company and the RATLab on October 1, 2010.
The Company has six patents pending in the United States and one patent pending in Japan. The Company has received notification from the U.S. Patent and Trademark Office that the original patent filed was denied. It was determined by the Company that it was not economically feasible to contest the finding. As of the report date, the Company has not received any notification from the U.S. Patent and Trademark Office as to whether any of the patents filed in 2007 will be granted.
EMPLOYEES
As of September 30, 2010, we had 12 full-time and 3 part-time employees and four contractors. Most employees were based in Oregon. The Chief Executive Officer and Chief Financial Officer are based out of the Seattle, Washington office.
WEBSITE ACCESS TO UNITED STATES SECURITIES AND EXCHANGE COMMISSION REPORTS
We file annual and quarterly reports, proxy statements and other information with the Securities and Exchange Commission ("SEC"). You may read and copy any document we file at the SEC's Public Reference Room at 100 F Street, N.E., Washington D.C. 20549. Please call the SEC at 1-800-SEC-0330 for further information on the public reference room. The SEC maintains a website at http://www.sec.gov that contains reports, proxy and information statements and other information concerning filers. We also maintain a web site at http://www.visualant.net that provides additional information about our Company and links to documents we file with the SEC. The Company's charters for the Audit Committee, the Compensation Committee, and the Nominating Committee; and the Code of Conduct & Ethics are also available on our website. The information on our website is not part of this Form 10-K.
ITEM 1A. RISK FACTORS
WE WILL NEED ADDITIONAL FINANCING TO SUPPORT OUR TECHNOLOGY DEVELOPMENT, ACQUIRING OR INVESTING IN NEW BUSINESSES AND ONGOING OPERATIONS.
The Company business will need to obtain additional financing in order to continue our current technology development, acquire businesses and fund ongoing operations. There can be no assurance that we will be able to secure funding, or that if such funding is available, the terms or conditions would be acceptable to us. If the Company is unable to obtain additional financing, we may need to restructure our operations, divest all or a portion of our business or file for bankruptcy.
Our recent efforts to generate additional liquidity, including through sales of our common stock, are described in more detail in the financial statement notes set forth in this report.
If we raise additional capital through borrowing or other debt financing, we will incur substantial interest expense. Sales of additional equity securities will dilute on a pro rata basis the percentage ownership of all holders of common stock. When we raise more equity capital in the future, it will result in substantial dilution to our current stockholders.
7
THE SALE OF A SIGNIFICANT NUMBER OF OUR SHARES OF COMMON STOCK COULD DEPRESS THE PRICE OF OUR COMMON STOCK.
Sales or issuances of a large number of shares of common stock in the public market or the perception that sales may occur could cause the market price of our common stock to decline. As of December 30, 2010, there were 38.2 million shares of common stock issued and outstanding. Significant shares of common stock are held by our principal shareholders, other Company insiders and other large shareholders. As “affiliates” (as defined under Rule 144 of the Securities Act (“Rule 144”)) of the Company, our principal shareholders, other Company insiders and other large shareholders may only sell their shares of common stock in the public market pursuant to an effective registration statement or in compliance with Rule 144.
Some of the present shareholders have acquired shares at prices as low as $0.001 per share, whereas other shareholders have purchased their shares at prices ranging from $0.15 to $0.75 per share.
WE MAY ENGAGE IN ACQUISITIONS, MERGERS, STRATEGIC ALLIANCES, JOINT VENTURES AND DIVESTITURES THAT COULD RESULT IN FINANCIAL RESULTS THAT ARE DIFFERENT THAN EXPECTED.
In the normal course of business, we engage in discussions relating to possible acquisitions, equity investments, mergers, strategic alliances, joint ventures and divestitures. Such transactions are accompanied by a number of risks, including:
- Use of significant amounts of cash,
- Potentially dilutive issuances of equity securities on potentially unfavorable terms,
- Incurrence of debt on potentially unfavorable terms as well as impairment expenses related to goodwill and amortization expenses related to other intangible assets, and
- The possibility that we may pay too much cash or issue too many of our shares as the purchase price for an acquisition relative to the economic benefits that we ultimately derive from such acquisition.
- The process of integrating any acquisition may create unforeseen operating difficulties and expenditures. The areas where we may face difficulties include:
- Diversion of management time, during the period of negotiation through closing and after closing, from its focus on operating the businesses to issues of integration,
- Decline in employee morale and retention issues resulting from changes in compensation, reporting relationships, future prospects or the direction of the business,
- The need to integrate each Company's accounting, management information, human resource and other administrative systems to permit effective management, and the lack of control if such integration is delayed or not implemented,
- The need to implement controls, procedures and policies appropriate for a public Company that may not have been in place in private companies, prior to acquisition,
- The need to incorporate acquired technology, content or rights into our products and any expenses related to such integration, and
- The need to successfully develop any acquired in-process technology to realize any value capitalized as intangible assets.
From time to time, we have also engaged in discussions with candidates regarding the potential acquisitions of our product lines, technologies and businesses. If a divestiture such as this does occur, we cannot be certain that our business, operating results and financial condition will not be materially and adversely affected. A successful divestiture depends on various factors, including our ability to:
- Effectively transfer liabilities, contracts, facilities and employees to any purchaser,
- Identify and separate the intellectual property to be divested from the intellectual property that we wish to retain,
- Reduce fixed costs previously associated with the divested assets or business, and
- Collect the proceeds from any divestitures.
8
In addition, if customers of the divested business do not receive the same level of service from the new owners, this may adversely affect our other businesses to the extent that these customers also purchase other products offered by us. All of these efforts require varying levels of management resources, which may divert our attention from other business operations.
If we do not realize the expected benefits or synergies of any divestiture transaction, our consolidated financial position, results of operations, cash flows and stock price could be negatively impacted.
WE MAY INCUR LOSSES IN THE FUTURE.
We have experienced net losses since inception. There can be no assurance that we will achieve or maintain profitability.
THE MARKET PRICE OF OUR COMMON STOCK MAY BE VOLATILE.
The market price of our common stock has been and is likely in the future to be volatile. Our common stock price may fluctuate in response to factors such as:
|
•
|
Announcements by us regarding liquidity, significant acquisitions, equity investments and divestitures, strategic relationships, addition or loss of significant customers and contracts, capital expenditure commitments, loan, note payable and agreement defaults, loss of our subsidiaries and impairment of assets,
|
|
|
•
|
Issuance of convertible or equity securities for general or merger and acquisition purposes,
|
|
|
•
|
Issuance or repayment of debt, accounts payable or convertible debt for general or merger and acquisition purposes,
|
|
|
•
|
Sale of a significant number of our common stock by shareholders,
|
|
|
•
|
General market and economic conditions,
|
|
|
•
|
Quarterly variations in our operating results,
|
|
|
•
|
Investor relation activities,
|
|
|
•
|
Announcements of technological innovations,
|
|
|
•
|
New product introductions by us or our competitors,
|
|
|
•
|
Competitive activities, and
|
|
|
•
|
Additions or departures of key personnel.
|
These broad market and industry factors may have a material adverse effect on the market price of our common stock, regardless of our actual operating performance. These factors could have a material adverse effect on our business, financial condition and results of operations.
FUTURE ISSUANCE OF STOCK OPTIONS, WARRANTS AND /OR RIGHTS MAY HAVE A DILUTING FACTOR ON EXISTING AND FUTURE SHAREHOLDERS.
The grant and exercise of stock options, warrants or rights to be issued in the future will likely result in a dilution of the value of the Company’s common shares for all shareholders. The Company has established a Combined Incentive and Non-Qualified Stock Option Plan and may in the future issue further stock options to officers, directors and consultants which will dilute the interest of the existing and future shareholders. Moreover, the Company may seek authorization to increase the number of its authorized shares and sell additional securities and/or rights to purchase such securities at any time in the future. Dilution of the value of the common shares will likely result from such sales, which in turn could adversely affect the market price of our common stock.
OUR MANAGEMENT HAS SUBSTANTIAL INFLUENCE OVER OUR COMPANY.
As of September 30, 2010, Mr. Erickson and his immediate family members, either directly or indirectly, own or control 6,406,473 shares as of the filing date or approximately 16.8% of our common stock. These Controlling Shareholders have stated in a Schedule 13D that they may be deemed to constitute a “group” for the purposes of Rule 13d-3 under the Exchange Act. Mr. Ronald P. Erickson, our Chief Executive officer, controls each of our Controlling Shareholders.
This group, could cause a change of control of our board of directors, if in combination with another large shareholder elects candidates of their choice to the board at a shareholder meeting, and approve or disapprove any matter requiring stockholder approval, regardless of how our other shareholders may vote. Further, under Nevada law, the group could have a significant influence over our affairs, if in combination with another large shareholder, including the power to cause, delay or prevent a change in control or sale of the Company, which in turn could adversely affect the market price of our common stock.
9
TRADING IN THE COMPANY’S STOCK MAY BE RESTRICTED BY BLUE SKY ELIGIBILITY AND THE SEC’S PENNY STOCK REGULATIONS.
The SEC has adopted regulations which generally define "penny stock" to be any equity security that has a market price (as defined) less than $5.00 per share or an exercise price of less than $5.00 per share, subject to certain exceptions. Under the penny stock rules, additional sales practice requirements are imposed on broker-dealers who sell to persons other than established customers and "accredited investors." The term "accredited investor" refers generally to institutions with assets in excess of $5,000,000 or individuals with a net worth in excess of $1,000,000 or annual income exceeding $200,000 or $300,000 jointly with their spouse. The penny stock rules require a broker-dealer, prior to a transaction in a penny stock not otherwise exempt from the rules, to deliver a standardized risk disclosure document in a form prepared by the SEC which provides information about penny stocks and the nature and level of risks in the penny stock market. The broker-dealer also must provide the customer with current bid and offer quotations for the penny stock, the compensation of the broker-dealer and its salesperson in the transaction, and monthly account statements showing the market value of each penny stock held in the customer's account. The bid and offer quotations, and the broker-dealer and salesperson compensation information, must be given to the customer orally or in writing prior to effecting the transaction and must be given to the customer in writing before or with the customer's confirmation. In addition, the penny stock rules require that prior to a transaction in a penny stock not otherwise exempt from these rules, the broker-dealer must make a special written determination that the penny stock is a suitable investment for the purchaser and receive the purchaser's written agreement to the transaction. These disclosure requirements may have the effect of reducing the level of trading activity in the secondary market for the stock that is subject to broker-dealers to trade in the Company’s securities.
The penny stock rules may discourage investor interest in and limit the marketability of, the Company’s common stock.
CONFLICT OF INTEREST.
Some of the directors of the Company are also directors and officers of other companies, and conflicts of interest may arise between their duties as directors of the Company and as directors and officers of other companies. These factors could have a material adverse effect on our business, financial condition and results of operations.
WE ARE DEPENDENT ON KEY PERSONNEL.
Our success depends to a significant degree upon the continued contributions of key management and other personnel, some of whom could be difficult to replace. We do not maintain key man life insurance covering certain of our officers. Our success will depend on the performance of our officers, our ability to retain and motivate our officers, our ability to integrate new officers into our operations and the ability of all personnel to work together effectively as a team. Our failure to retain and recruit officers and other key personnel could have a material adverse effect on our business, financial condition and results of operations.
WE HAVE LIMITED INSURANCE.
We have limited director and officer insurance and commercial insurance policies. Any significant claims would have a material adverse effect on our business, financial condition and results of operations.
ITEM 1B. UNRESOLVED STAFF COMMENTS
Not applicable.
ITEM 2. PROPERTIES
Corporate Offices
The Company's executive offices are located at 500 Union Street, Suite 406, Seattle, Washington, USA, 98101. The office is located in premises which are also used by the Chairman of the Board of the Company for other business interests. The Company accrues, but does not pay rent of $400 per month for the use of this office at this time.
TransTech Facilities
TransTech leases a total of approximately 9,750 square feet of office and warehouse space for its administrative offices, product inventory and shipping operations, at a monthly rental of $4,292. The lease was extended from March 2011 for an additional five year term at a monthly rental of $4,721. There are two additional five year renewals with a set accelerating increase of 10% per 5 year term. TransTech also leases additional 500 square feet of off-site space at $250 per month from a related party.
ITEM 3. LEGAL PROCEEDINGS
There are no legal proceedings to which the Company is a party or to which its property is subject, nor to the best of management's knowledge are any material legal proceedings contemplated.
ITEM 4. SUBMISSION OF MATTERS TO A VOTE OF SECURITY HOLDERS
The last annual shareholders' meeting was held on August 7, 2002. No matters have been submitted to a vote of securities holders in the most recent fiscal year.
10
PART II
ITEM 5. MARKET FOR REGISTRANT’S COMMON EQUITY, RELATED STOCKHOLDER MATTERS AND ISSUER PURCHASES OF EQUITY SECURITIES
Our common stock trades on OTCBB Exchange under the symbol "VSUL". The following table sets forth the range of the high and low sale prices of the common stock for the periods indicated:
|
QUARTER ENDED
|
HIGH
|
LOW
|
||||||
|
December 31, 2009
|
$ | 0.170 | $ | 0.040 | ||||
|
March 31, 2010
|
$ | 0.160 | $ | 0.050 | ||||
|
June 30, 2010
|
$ | 0.400 | $ | 0.050 | ||||
|
September 30, 2010
|
$ | 0.400 | $ | 0.140 | ||||
|
December 31, 2008
|
$ | 0.150 | $ | 0.010 | ||||
|
March 31, 2009
|
$ | 0.500 | $ | 0.030 | ||||
|
June 30, 2009
|
$ | 0.200 | $ | 0.050 | ||||
|
September 30, 2009
|
$ | 0.120 | $ | 0.050 | ||||
As of September 30, 2010, the closing price of the Company's common stock was $0.33 per share. As of December 30, 2010, there were 38,249,374 shares of common stock outstanding held by approximately 130 stockholders of record. The number of stockholders, including the beneficial owners' shares through nominee names is approximately 1,300.
DIVIDEND POLICY
We have never paid any cash dividends and intend, for the foreseeable future, to retain any future earnings for the development of our business. Our future dividend policy will be determined by the board of directors on the basis of various factors, including our results of operations, financial condition, capital requirements and investment opportunities.
RECENT SALES OF UNREGISTERED SECURITIES
During the three months ended September 30, 2010, there were no sales of unregistered sales of equity securities.
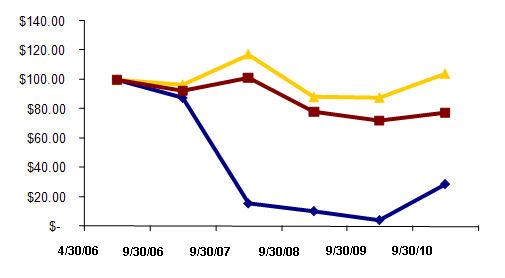
Performance Graph
Comparison of Cumulative Total Return
April 30, 2006-September 30, 2010
Among Visualant, Inc., Russell Microcap- Growth Index Without Dividend and the Russell Microcap Index Without Dividend

11
The above assumes that $100 was invested in the common stock and each index on April 30, 2006. Although the company has not declared a dividend on its common stock, the total return for each index assumes the reinvestment of dividends. Stockholder returns over the periods presented should not be considered indicative of future returns. The foregoing table shall not be deemed incorporated by reference by any general statement incorporating by reference the Form 10-K into any filing under the Securities Act or the Exchange Act, except to the extent the company specifically incorporates this information by reference, and shall not otherwise be deemed filed under the acts.
EQUITY COMPENSATION PLAN INFORMATION
The following table provides information as of September 30, 2010 related to the equity compensation plan in effect at that time.
|
(a)
|
(b)
|
(c)
|
||||||||||
|
Number of securities
|
||||||||||||
|
remaining available
|
||||||||||||
|
Number of securities
|
Weighted-average
|
for future issuance
|
||||||||||
|
to be issued upon
|
exercise price of
|
under equity compensation
|
||||||||||
|
exercise of outstanding
|
outstanding options,
|
plan (excluding securities
|
||||||||||
|
Plan Category
|
options, warrants and rights
|
warrants and rights
|
reflected in column (a))
|
|||||||||
|
Equity compensation plan
|
||||||||||||
|
approved by shareholders
|
- | - | - | |||||||||
|
Equity compensation plans
|
||||||||||||
|
not approved by shareholders
|
4,735,000 | 0.288 | - | |||||||||
|
Total
|
4,735,000 | 0.288 | - | |||||||||
ITEM 6. SELECTED FINANCIAL DATA
In the following table, we provide you with our selected consolidated historical financial and other data. We have prepared the consolidated selected financial information using our consolidated financial statements for the years ended September 30, 2010, 2009 and 2008. When you read this selected consolidated historical financial and other data, it is important that you read along with it the historical financial statements and related notes in our consolidated financial statements included in this report, as well as Item 7. Management's Discussion and Analysis of Financial Condition and Results of Operations.
|
Years Ended September 30,
|
||||||||||||||||||||
|
2010
|
2009
|
2008
|
2007
|
2006
|
||||||||||||||||
|
(dollars in thousands, except per share data)
|
||||||||||||||||||||
|
STATEMENT OF OPERATIONS DATA:
|
||||||||||||||||||||
|
Revenue
|
$ | 2,543 | $ | - | $ | - | $ | - | $ | - | ||||||||||
|
Net loss
|
(1,147 | ) | (951 | ) | (945 | ) | (1,635 | ) | (1,032 | ) | ||||||||||
|
Net (loss) profit applicable to Visualant, Inc. common shareholders
|
(1,149 | ) | (951 | ) | (945 | ) | (1,635 | ) | (1,032 | ) | ||||||||||
|
Net loss per share
|
(0.04 | ) | (0.03 | ) | (0.05 | ) | (0.10 | ) | (0.06 | ) | ||||||||||
|
BALANCE SHEET DATA:
|
||||||||||||||||||||
|
Total assets
|
4,144 | 12 | 2 | 89 | 7 | |||||||||||||||
|
Stockholder's deficiency
|
(1,900 | ) | (1,366 | ) | (2,135 | ) | (1,478 | ) | (473 | ) | ||||||||||
ITEM 7. MANAGEMENT'S DISCUSSION AND ANALYSIS OF FINANCIAL CONDITION AND RESULTS OF OPERATIONS
Overview
We are developing low-cost, high speed, light-based security and quality control solutions for use in homeland security, anti-counterfeiting, forgery/fraud prevention, brand protection and process control applications. Our patent-pending technology uses controlled illumination with specific bands of light, to establish a unique spectral signature for both individual and classes of items. When matched against existing databases, these spectral signatures allow precise identification and authentication of any item or substance. This breakthrough optical sensing and data capture technology is called Spectral Pattern Matching (SPM). SPM technology can be miniaturized and is easily integrated into a variety of hand-held or fixed mount configurations, and can be combined in the same package as a bar-code or biometric scanner. As of September 30, 2010, we have six utility patent applications with the U.S. Patent Office and one patent pending in Japan.
12
Through our wholly owned subsidiary TransTech Systems we provide security and authentication solutions to security and law enforcement markets throughout the United States. We closed the acquisition of TransTech on June 8, 2010 and recorded the results from June 8, 2010 to September 30, 2010. As of June 8, 2010, the Company is no longer in the development stage.
RESULTS OF OPERATIONS
The following table presents certain consolidated statement of operations information and presentation of that data as a percentage of change from year-to-year.
(dollars in thousands)
|
Year Ended September 30,
|
|||||||||||||||||
|
2010
|
2009
|
$ Variance
|
% Variance
|
||||||||||||||
|
Revenue
|
$ | 2,543 | $ | - | $ | 2,543 | 100.0 | % | |||||||||
|
Cost of sales
|
2,095 | - | 2,095 | -100.0 | % | ||||||||||||
|
Gross profit
|
448 | - | 448 | 100.0 | % | ||||||||||||
|
Research and development expenses
|
91 | 214 | (123 | ) | -57.5 | % | |||||||||||
|
Selling, general and administrative expenses
|
1,378 | 683 | 695 | -101.8 | % | ||||||||||||
|
Operating loss
|
(1,021 | ) | (897 | ) | (124 | ) | -13.8 | % | |||||||||
|
Other income (expense):
|
|||||||||||||||||
|
Interest expense
|
(144 | ) | (54 | ) | (90 | ) | -166.7 | % | |||||||||
|
Other income
|
10 | - | 10 | 100.0 | % | ||||||||||||
|
Total other expense
|
(134 | ) | (54 | ) | (80 | ) | -148.1 | % | |||||||||
|
Loss before income taxes
|
(1,155 | ) | (951 | ) | (204 | ) | -21.5 | % | |||||||||
|
Income taxes - current benefit
|
(8 | ) | - | (8 | ) | 100.0 | % | ||||||||||
|
Net loss
|
(1,147 | ) | (951 | ) | (196 | ) | -20.6 | % | |||||||||
|
Non-controlling interest
|
2 | - | 2 | -100.0 | % | ||||||||||||
|
Net loss attributable to Visualant, Inc. common shareholders
|
$ | (1,149 | ) | $ | (951 | ) | $ | (198 | ) | -20.8 | % | ||||||
YEAR ENDED SEPTEMBER 30, 2010 COMPARED TO THE YEAR ENDED SEPTEMBER 30, 2009
SALES
Net revenue for the year ended September 30, 2010 increased $2,543,000 to $2,543,000 as compared to $0 for the year ended September 30, 2009.
We closed the acquisition of TransTech of Aurora, OR on June 8, 2010 and recorded the results from June 8, 2010 to September 30, 2010.
COST OF SALES
Cost of sales for the year ended September 30, 2010 increased $2,095,000 to $2,095,000 as compared to $0 for the year ended September 30, 2009.
We closed the acquisition of TransTech of Aurora, OR on June 8, 2010 and recorded the results from June 8, 2010 to September 30, 2010.
EXPENSES
Selling, general and administrative expenses for the year ended September 30, 2010 increased $695,000 to $1,378,000 as compared $682,000 for the year ended September 30, 2009.
We closed the acquisition of TransTech of Aurora, OR on June 8, 2010 and recorded the results from June 8, 2010 to September 30, 2010.
The selling, general and administrative expenses consisted primarily of employee and independent contractor expenses, overhead, equipment and depreciation, amortization of identifiable intangible assets and intellectual property, professional and consulting fees, sales and marketing costs, legal, stock option and other general and administrative costs.
13
OTHER INCOME/EXPENSE
Other expense for the year ended September 30, 2010 was $134,000 as compared to other expense of $54,000 for the year ended September 30, 2009. The expenses for the year ended September 30, 2010 included $144,000 for interest expense.
The 2009 other expense was primarily related to interest expense of $54,000.
NET LOSS
Net loss for the year ended September 30, 2010 was $1,147,000 as compared to a net loss of $951,000 for the year ended September 30, 2009.
RESULTS OF OPERATIONS
The following table presents certain consolidated statement of operations information and presentation of that data as a percentage of change from year-to-year.
(dollars in thousands)
|
Year Ended September 30,
|
|||||||||||||||||
|
2009
|
2008
|
$ Variance
|
% Variance
|
||||||||||||||
|
Revenue
|
$ | - | $ | - | $ | - | 0.0 | % | |||||||||
|
Cost of sales
|
- | - | - | 0.0 | % | ||||||||||||
|
Gross profit
|
- | - | - | 0.0 | % | ||||||||||||
|
Research and development expenses
|
214 | - | 214 | -100.0 | % | ||||||||||||
|
Selling, general and administrative expenses
|
683 | 792 | (109 | ) | -13.8 | % | |||||||||||
|
Operating loss
|
(897 | ) | (792 | ) | (105 | ) | -13.3 | % | |||||||||
|
Other income (expense):
|
|||||||||||||||||
|
Interest expense
|
(54 | ) | (153 | ) | 99 | 64.7 | % | ||||||||||
|
Other income
|
- | - | - | 0.0 | % | ||||||||||||
|
Total other expense
|
(54 | ) | (153 | ) | 99 | 64.7 | % | ||||||||||
|
Loss before income taxes
|
(951 | ) | (945 | ) | (6 | ) | -0.6 | % | |||||||||
|
Income taxes - current benefit
|
- | - | - | 0.0 | % | ||||||||||||
|
Net loss
|
(951 | ) | (945 | ) | (6 | ) | -0.6 | % | |||||||||
|
Non-controlling interest
|
- | - | - | 0.0 | % | ||||||||||||
|
Net loss attributable to Visualant, Inc. common shareholders
|
$ | (951 | ) | $ | (945 | ) | $ | (6 | ) | -0.6 | % | ||||||
YEAR ENDED SEPTEMBER 30, 2009 COMPARED TO THE YEAR ENDED SEPTEMBER 30, 2008
EXPENSES
Selling, general and administrative expenses for the year ended September 30, 2009 decreased $109,000 to $683,000 as compared $792,000 for the year ended September 30, 2008. The decrease reflected lower expenditures.
The selling, general and administrative expenses consisted primarily of employee and independent contractor expenses, overhead, equipment and depreciation, professional and consulting fees, legal, stock option and other general and administrative costs.
OTHER INCOME/EXPENSE
Other expense for the year ended September 30, 2009 was $54,000 as compared to other expense of $153,000 for the year ended September 30, 2008. The expenses for the year ended September 30, 2009 included $54,000 for interest expense.
The 2008 other expense was primarily related to interest expense of $153,000.
NET LOSS
Net loss for the year ended September 30, 2009 was $951,000 as compared to a net loss of $945,000 for the year ended September 30, 2008.
14
LIQUIDITY AND CAPITAL RESOURCES
We had cash of $83,937, a net working capital deficit of approximately $2.7 million and total indebtedness of $ 6.0 million as of September 30, 2010.
We will need to obtain additional financing to implement the business plan, service our debt repayments and acquire new businesses. There can be no assurance that we will be able to secure funding, or that if such funding is available, whether the terms or conditions would be acceptable to us.
Volatility and disruption of financial markets could affect our access to credit. The current difficult economic market environment is causing contraction in the availability of credit in the marketplace. This could potentially reduce or eliminate the sources of liquidity for the Company.
If the Company is unable to obtain additional financing, we may need to restructure our operations, divest all or a portion of our business or file for bankruptcy.
OPERATING ACTIVITIES
Net cash used in operating activities for the year ended September 30, 2010 was $.4 million. This amount was primarily related to a net loss of $1.2 million and an increase in inventory of $.2 million, offset by depreciation and amortization and other non-cash expenses of $ .5 million and an increase in accounts payable and accrued liabilities of $.5 million.
FINANCING ACTIVITIES
Net cash provided by financing activities for the year ended September 30, 2010 was $.5 million. This amount was primarily related to proceeds from line of credit of $.2 million and proceeds from the issuance of convertible debt of $.3 million.
Our contractual cash obligations as of September 30, 2010 are summarized in the table below:
|
Less Than
|
Greater Than
|
|||||||||||||||||||
|
Contractual Cash Obligations
|
Total
|
1 Year
|
1-3 Years
|
3-5 Years
|
5 Years
|
|||||||||||||||
|
Operating leases
|
$ | 304,732 | $ | 54,508 | $ | 113,309 | $ | 113,309 | $ | 23,606 | ||||||||||
|
Capital lease obligations
|
0 | 0 | 0 | 0 | 0 | |||||||||||||||
|
Note payable
|
3,189,473 | 1,513,495 | 1,670,528 | 5,450 | 0 | |||||||||||||||
|
Capital expenditures
|
140,000 | 30,000 | 55,000 | 30,000 | 25,000 | |||||||||||||||
|
Acquisitions
|
315,000 | 165,000 | 150,000 | 0 | 0 | |||||||||||||||
| $ | 3,949,205 | $ | 1,763,003 | $ | 1,988,837 | $ | 148,759 | $ | 48,606 | |||||||||||
CRITICAL ACCOUNTING POLICIES AND ESTIMATES
The application of GAAP involves the exercise of varying degrees of judgment. On an ongoing basis, we evaluate our estimates and judgments based on historical experience and various other factors that are believed to be reasonable under the circumstances. Actual results may differ from these estimates under different assumptions or conditions. We believe that of our significant accounting policies (see summary of significant accounting policies more fully described in Note 2 to the financial statements set forth in this report), the following policies involve a higher degree of judgment and/or complexity:
INVENTORIES
Inventories consist primarily of printers and consumable supplies, including ribbons and cards, badge accessories, capture devices, and access control components held for resale and are stated at the lower of cost or market on the first-in, first-out (“FIFO”) method. Inventories are considered available for resale when drop shipped and invoiced directly to a customer from a vendor, or when physically received by TransTech at a warehouse location. The company records a provision for excess and obsolete inventory whenever an impairment has been identified. There is no provision for impaired inventory as of September 30, 2010.
REVENUE RECOGNITION
TransTech revenue is derived from products and services. Revenue is considered realized when the services have been provided to the customer, the work has been accepted by the customer and collectability is reasonably assured. Furthermore, if an actual measurement of revenue cannot be determined, we defer all revenue recognition until such time that an actual measurement can be determined. If during the course of a contract management determines that losses are expected to be incurred, such costs are charged to operations in the period such losses are determined. Revenues are deferred when cash has been received from the customer but the revenue has not been earned. The Company recorded deferred revenue of $0 as of September 30, 2010 and 2009, respectively.
15
There is no SPM revenue at this time.
STOCK BASED COMPENSATION
The Company has share-based compensation plans under which employees, consultants, suppliers and directors may be granted restricted stock, as well as options to purchase shares of Company common stock at the fair market value at the time of grant. Stock-based compensation cost is measured by the Company at the grant date, based on the fair value of the award, over the requisite service period. For options issued to employees, the Company recognizes stock compensation costs utilizing the fair value methodology over the related period of benefit. Grants of stock options and stock to non-employees and other parties are accounted for in accordance with the ASC 505.
ITEM 7A. QUANTITATIVE AND QUALITATIVE DISCLOSURES ABOUT MARKET RISK
The Registrant has no investments in any market risk sensitive instruments either held for trading purposes or entered into for other than trading purposes.
ITEM 8. FINANCIAL STATEMENTS AND SUPPLEMENTARY DATA
Reference is made to our consolidated financial statements beginning on page F-1 of this report.
ITEM 9. CHANGES IN AND DISAGREEMENTS WITH ACCOUNTANTS ON ACCOUNTING AND FINANCIAL DISCLOSURE
Not applicable.
ITEM 9A. CONTROLS AND PROCEDURES
CONCLUSION REGARDING THE EFFECTIVENESS OF DISCLOSURE CONTROLS AND PROCEDURES
Our management, with the participation of our Chief Executive Officer and Chief Financial Officer, evaluated the effectiveness of our disclosure controls and procedures as of September 30, 2010. The term "disclosure controls and procedures," as defined in Rules 13a-15(e) and 15d-15(e) under the Exchange Act, means controls and other procedures of a company that are designed to ensure that information required to be disclosed by a Company in the reports that it files or submits under the Exchange Act is recorded, processed, summarized and reported, within the time periods specified in the SEC's rules and forms. Disclosure controls and procedures include, without limitation, controls and procedures designed to ensure that information required to be disclosed by a company in the reports that it files or submits under the Exchange Act is accumulated and communicated to the company's management, including its principal executive and principal financial officers, as appropriate to allow timely decisions regarding required disclosure. Our management recognizes that any controls and procedures, no matter how well designed and operated, can provide only reasonable assurance of achieving their objectives and our management necessarily applies its judgment in evaluating the cost-benefit relationship of possible controls and procedures. Based on the evaluation of our disclosure controls and procedures as of September 30, 2010, our Chief Executive Officer and Chief Financial Officer concluded that, as of such date, our disclosure controls and procedures were effective at the reasonable assurance level.
MANAGEMENT'S REPORT ON INTERNAL CONTROL OVER FINANCIAL REPORTING
Our management is responsible for establishing and maintaining adequate internal control over financial reporting, as such term is defined in Exchange Act Rule 13a-15(f). Under the supervision and with the participation of our management, including our principal executive officer and principal financial officer, we conducted an evaluation of the effectiveness of our internal control over financial reporting based on the framework in Internal Control--Integrated Framework issued by the Committee of Sponsoring Organizations of the Treadway Commission. Based on our evaluation under the framework in Internal Control--Integrated Framework, our management concluded that our internal control over financial reporting was effective as of September 30, 2010.
The effectiveness of our internal control over financial reporting as of September 30, 2010 has not been audited by Madsen Associates, CPA’s Inc., an independent registered public accounting firm, as stated in their report which is included herein.
CHANGES IN INTERNAL CONTROL
There has been no change in our internal control over financial reporting during the quarter ended September 30, 2010 that has materially affected or is likely to materially affect our internal control over financial reporting.
16
ITEM 9B. OTHER INFORMATION
There were no disclosures of any information required to be filed on Form 8-K during the three months ended September 30, 2010 that were not filed.
PART III
Except as otherwise disclosed below, the following information required by the Instructions to Form 10-K is incorporated herein by reference from various sections of the Visualant, Inc. Proxy Statement for the annual meeting of shareholders to be held on March 18, 2011, as summarized below:
ITEM 10. DIRECTORS AND EXECUTIVE OFFICERS AND CORPORATE GOVERNANCE
"Election of Directors;" "Section 16(a) Beneficial Ownership Reporting Compliance;" "Corporate Governance;" and "Meetings and Committees of the Board of Directors." – see the Visualant, Inc. Proxy Statement for the annual meeting of shareholders to be held on March 18, 2011
The following table sets forth, as of September 30, 2010, the name, age, and position of each executive officer and director and the term of office of each director of the Company, as well as certain biographical information, is set forth below.
|
Name
|
Age
|
Positions and Offices Held
|
Since
|
|||
|
Ronald Erickson
|
67 |
Chairman of the Board, Chief Executive Officer and Director
|
April 24, 2003
|
|||
|
Mark Scott
|
57 |
Chief Financial Officer and Secretary
|
May 1, 2010
|
|||
|
Bradley Sparks
|
64 |
Director
|
November 10, 2006
|
|||
|
Jon Pepper
|
59 |
Independent Director
|
April 19, 2006
|
|||
|
Dr. Masahiro Kawahata
|
74 |
Independent Director
|
April 19, 2006
|
|||
|
Marco Hegyi
|
52 |
Independent Director
|
February 14, 2008
|
|||
|
Yoshitami Arai
|
79 |
Independent Director
|
October 8, 2008
|
|||
|
James Gingo
|
58 |
Independent Director
|
June 8, 2010
|
|||
|
Paul Bonderson
|
58 |
Independent Director
|
June 8, 2010
|
Business Experience Descriptions
Set forth below is certain biographical information regarding each of the Company's executive officers and directors.
RONALD P. ERICKSON has been a director and officer of the Company since April 24, 2003. He currently serves as the Company’s Chairman, Chief Executive Officer and President. He was appointed to the positions of CEO and President on November 10, 2009. Earlier, he was appointed President and Chief Executive Officer of the Company on September 29, 2003, and resigned from this position on August 31, 2004 at which time he was appointed Chairman of the Board. A seasoned executive with more than 30 years of experience in the high technology, telecommunications, micro-computer, and digital media industries, Mr. Erickson was the founder of Visualant. In addition to his Visualant responsibilities he also serves as Chairman of ivi, Inc. a streaming media company and eCharge Corporation an Internet based transaction processing company. He is formerly Chairman, CEO and Co-Founder of Blue Frog Media, a mobile media and entertainment company; Chairman, CEO and Co-founder of GlobalTel Resources, a provider of telecommunications services; Chairman, Interim President and CEO of Egghead Software, Inc. the large software reseller where he was an original investor; Chairman and CEO of NBI, Inc.; and Co-founder of MicroRim, Inc. the database software developer. Earlier, Mr. Erickson practiced law in Seattle and worked in public policy in Washington, DC and New York, NY. Additionally, Mr. Erickson has been an angel investor and board member of a number of public and private technology companies. Mr. Erickson has a BA from Central Washington University, a MA from the University of Wyoming and a JD from the University of California, Davis. He is licensed to practice law in the State of Washington and the District of Columbia.
17
MARK SCOTT has served as Chief Financial Officer, Secretary and Treasurer since May 2010. He has significant financial, capital market and relations experience in public microcap companies. Mr. Scott continues to serve as Chief Financial Officer of IA Global, Inc., a position he has held since October 2003. Previously, he held executive financial positions with Digital Lightwave; Network Access Solutions; and Teltronics, Inc. He has also held senior financial positions at Protel, Inc., Crystals International, Inc., Ranks Hovis McDougall, LLP and Brittania Sportswear, and worked at Arthur Andersen. As a member of the National Association of Corporate Directors, Mr. Scott is a certified corporate director. Mr. Scott is also a certified public accountant.
BRADLEY E. SPARKS currently serves as a director. On November 12, 2009, Mr. Sparks resigned as the Company’s Chief Executive Officer and President. He held these positions since November 2006. Mr. Sparks currently serves as the Chief Financial Officer for Laredo Oil, Inc. Before joining Visualant in 2006, he served as Chief Financial Officer of WatchGuard Technologies, Inc. from 2005-2006. Previous to WatchGuard, he was the founder and managing director of Sunburst Growth Ventures, LLC, a private investment firm specializing in emerging-growth companies. Earlier, he founded Pointer Communications and served as Chief Financial Officer for several publicly-held telecommunications companies, including eSpire Communications, Inc., Digex, Inc., Omnipoint Corporation, and WAM!NET. He also served as Vice President and Treasurer of MCI Communications from 1988-1993 and as Vice President and Controller from 1993-1995. Before his tenure at MCI, Mr. Sparks held various financial management positions at Ryder System, Inc. Mr. Sparks also serves on the Board of Directors for iCIMS, a privately--held software company and Comrise China, also a privately—held company. Mr. Sparks graduated from the United States Military Academy at West Point and is a former Army Captain in the Signal Corps. He has an MS in Management from the Sloan School of Management at MIT and is a licensed CPA in Florida.
JON PEPPER has served as an independent director since April 19, 2006. Mr. Pepper is the co-founder of Pepcom [www.pepcom.com], an industry leader at producing press-only technology showcase events around the country. Prior to that Pepper started the DigitalFocus newsletter, a ground-breaking newsletter on digital imaging that went to leading influencers worldwide. Pepper has been closely involved with the high technology revolution since the beginning of the personal computer era. He was formerly a well-regarded journalist and columnist; his work on technology subjects appeared in The New York Times, Fortune, PC Magazine, Men's Journal, Working Woman, PC Week, Popular Science and many other well known publications. Pepper was educated at Union College in Schenectady, New York and the Royal Academy of Fine Arts in Copenhagen.
DR. MASAHIRO KAWAHATA has served as an independent director since April 19, 2006. Dr. Kawahata is the former Director of the Fujitsu Research Institute. He is known in Japan as "the father of multimedia" for his work as National Program Director in developing the nationwide fiber optic network. Early in 2005, the U.S. Government officially acknowledged him as "Non-U.S. Scientist of Extraordinary Ability". Dr. Kawahata has taught at Tokai University, is a Consulting Professor at Stanford University, Provost's Distinguished Professor at the University of Southern California and Visiting Professor at the University of Washington. He has served as a Director of numerous technology companies, and has received several prestigious awards in the United States and Japan.
MARCO HEGYI has served as an independent director since February 14, 2008. Mr. Hegyi has been a principal with the Chasm Group since 2006, where he combines his expertise in, and passion for helping companies expand their businesses with innovative technologies and collaborative partnership strategies using mobile and wireless platforms, service business models and Internet marketing programs.
Prior to working as a strategic advisor, Mr. Hegyi served as Senior Director, Global Product Management, at Yahoo Search Marketing during 2006. Prior to Yahoo, Mr. Hegyi was at Microsoft leading program management for Microsoft Windows and Office beta releases aimed at software developers from 2001 to 2006. While at Microsoft, he formed new service concepts and created operating programs to extend the depth and breadth of the company’s unparalleled developer eco-system, including managing offshore, outsource teams in China and India, and being the named inventor of a filed Microsoft patent for a business process in service delivery.
Mr. Hegyi earned a Bachelor of Science degree in Information and Computer Sciences from the University of California, Irvine, and has completed advanced studies in innovation marketing, advanced management, and strategy at Harvard Business School, Stanford University, UCLA Anderson Graduate School of Management, and MIT Sloan School of Management.
YOSHITAMI ARAI has served as an independent director since October 8, 2008. Mr. Arai brings strategic experience, a broad global business network, and sophisticated business acumen to the board. He has performed in many professional and civic capacities throughout Japan and abroad, and has served as Director and Senior Executive of international organizations including 7-Eleven, Tokyu Hotels, Systems International, Catalina Marketing and Sony.
JAMES GINGO has served as an independent director since June 8, 2010. TransTech was founded in 1994 and has been led by James Gingo as its President and founder since then. TransTech is a distributor of access control and authentication systems serving the security and law enforcement markets. Mr. Gingo’s guidance, experience and great depth of knowledge combined to make TransTech a respected national reputation for outstanding product knowledge, sales and service excellence. James Gingo is a highly regarded industry veteran and one of the early members of the Document Security Alliance, an organization co-founded by the United States Secret Service and concerned industry representatives after the events of 9/11. He sits on the Board of the Security Industry Association.
18
PAUL BONDERSON has served as an independent director since June 8, 2010. Mr. Bonderson has more than 30 years of technical experience in the computer industry, spanning both hardware and software engineering, engineering management, and product development. Prior to co-founding Brocade, Bonderson held engineering management positions at industry leading companies including Intel Corporation and Sun Microsystems, Inc. Since retiring from Brocade, Bonderson has been an active philanthropist. He is a member of the Board of Trustees of the Wetlands America Trust, Inc., the organization responsible for managing the endowment and land holdings of Ducks Unlimited. He is also a Senior Advisory Vice President and Board Member of Ducks Unlimited. Additionally, Mr. Bonderson serves on the Advisory Committee of the School of Engineering and the Foundation Board of California Polytechnic State University, San Luis Obispo, California.
ITEM 11. EXECUTIVE COMPENSATION
"Executive Compensation;" "Director Compensation;" "Compensation Committee Interlocks and Insider Participation;" and "Compensation Committee Report." – see the Visualant, Inc. Proxy Statement for the annual meeting of shareholders to be held on March 18, 2011
ITEM 12. SECURITY OWNERSHIP OF CERTAIN BENEFICIAL OWNERS AND MANAGEMENT AND RELATED STOCKHOLDER MATTERS
"Security Ownership of Certain Beneficial Owners and Management." – see the Visualant, Inc. Proxy Statement for the annual meeting of shareholders to be held on March 18, 2011
ITEM 13. CERTAIN RELATIONSHIPS AND RELATED TRANSACTIONS, AND DIRECTOR INDEPENDENCE
"Review and Approval of Related Person Transactions" and "Director Independence." – see the Visualant, Inc. Proxy Statement for the annual meeting of shareholders to be held on March 18, 2011
ITEM 14. PRINCIPAL ACCOUNTING FEES AND SERVICES
Fees paid to the Company's independent registered public accounting firm are disclosed under the caption "The Ratification of Appointment of Madsen & Associates, CPA’s Inc. as the Company's Independent Registered Public Accounting Firm (Independent Auditors) for the fiscal year ended September 30, 2010."
PART IV
ITEM 15. EXHIBITS, FINANCIAL STATEMENT SCHEDULES
(a) FINANCIAL STATEMENTS:
Our financial statements, as indicated by the Index to Consolidated Financial Statements set forth below, begin on page F-1 of this Form 10-K, and are hereby incorporated by reference. Financial statement schedules have been omitted because they are not applicable or the required information is included in the financial statements or notes thereto.
INDEX TO CONSOLIDATED FINANCIAL STATEMENTS
|
Title of Document
|
Page
|
|
|
Report of Madsen & Associates, CPA’s Inc.
|
F-1 | |
|
Consolidated Balance Sheets as of September 30, 2010 and 2009
|
F-2 | |
|
Consolidated Statements of Operations for the years ended September 30, 2010, 2009 and 2008
|
F-3 | |
|
Consolidated Statements of Changes in Stockholders' Deficit for the years ended September 30, 2010, 2009 and 2008
|
F-4 |
|
Consolidated Statements of Cash Flows for the years ended September 30, 2010, 2009 and 2008
|
F-5 | |
|
Notes to the Financial Statements
|
F-6 |
19
|
(b)
|
Exhibits
|
| NO. | EXHIBIT DESCRIPTION |
|
3.1
|
Amended and Restated Articles of Incorporation, filed as an exhibit to the Company’s annual report on Form 10-KSB filed on February 9, 2006, and incorporated herein by reference.
|
|
3.2
|
Bylaws incorporated herein by reference to the Company's Registration Statement on Form 10-SB filed on March 11, 1999.
|
|
4.1
|
2005 Combined Incentive and Non-Qualified Stock Option Plan of the Company, filed as an exhibit to the Company’s Registration Statement on Form SB-2 filed on August 1, 2005, File No. 333-127100, and incorporated herein by reference.
|
|
10.1
|
Intellectual Property Agreement dated June 16, 2004 between the Company and Kenneth Turpin, filed as an exhibit to the Company’s Registration Statement on Form SB-2 filed on August 1, 2005, File No. 333-127100 as Ex. 10.1, and incorporated herein by reference.
|
|
10.2
|
Independent Contractor Agreement dated June 16, 2004 between the Company and eVision Technologies Inc. to provide research and development services with respect to the Company’s color technology, filed as Exhibit 10.2 to the Company’s Registration Statement on Form SB-2 filed on August 1, 2005, File No. 333-127100, and incorporated herein by reference.
|
|
10.3
|
Worldwide Licensing Agreement dated April 21, 2005 between the Company and eVision Technologies Inc. granting the Company exclusive rights to the CBN coding system, filed as Exhibit 10.3 to the Company’s Registration Statement on Form SB-2 filed on August 1, 2005, File No. 333-127100, and incorporated herein by reference.
|
|
10.4
|
Cross Licensing Agreement between Visualant, Inc. and RATLab, LLC dated October 23, 2008 granting certain exclusive and non-exclusive reciprocal and field of use rights to technology developed and owned by Visualant and the RATLab, LLC. Filed as Exhibit 10.4 to Form 10-K filed on January 13, 2010, and incorporated herein by reference.
|
| 10.5 |
Stock Purchase Agreement dated June 8, 2010 by and between Visualant, Inc. and TransTech Systems, Inc. Filed as Exhibit 10.5 to Form 10-Q filed on August 12, 2010, and incorporated herein by reference.
|
| 10.6 |
Promissory Note dated June 8, 2010 by and between Visualant, Inc. and James M. Gingo. Filed as Exhibit 10.6 to Form 10-Q filed on August 12, 2010, and incorporated herein by reference.
|
| 10.7 |
Stock Pledge Agreement dated June 8, 2010 by and between Visualant, Inc., James M. Gingo and Brownstein, Rask, Sweeney, Kerr, Grim, Grim, DeSylvia and Hay, LLP. Filed as Exhibit 10.7 to Form 10-Q filed on August 12, 2010, and incorporated by reference.
|
| 10.8 |
Security Agreement dated June 8, 2010 by TransTech Systems, Inc. Filed herewith. Filed as Exhibit 10.8 to Form 10-Q filed on August 12, 2010, and incorporated by reference.
|
| 10.9 |
Employment Agreement dated June 8, 2010 by and between Visualant, Inc. and James Gingo. Filed as Exhibit 10.9 to Form 10-Q filed on August 12, 2010, and incorporated by reference.
|
| 10.10 |
Term Sheet dated May 5, 2010 by and between Mark Scott and Visualant, Inc. Filed as Exhibit 10.10 to Form 10-Q filed on August 12, 2010, and incorporated by reference.
|
| 99.1 |
TransTech Systems, Inc. audited consolidated financial statements as of and for the years ended December 31, 2009 and 2008, together with the Report of Independent Registered Public Accounting Firm thereon (2)
|
| 99.2 |
The unaudited Pro Forma Combined Condensed Consolidated Balance Sheet of the Company as of September 30, 2009 and TransTech as of December 31, 2009 and the unaudited Pro Forma Condensed Consolidated Statement of Operations of the Company and TransTech for the twelve months ended September 30, 2009 and December 31, 2009, respectively,
|
| 99.3 |
The unaudited Pro Forma Condensed Consolidated Statement of Operations of the Company and TransTech for the nine months ended June 30, 2010. The unaudited Consolidated Balance Sheet of the Company as of June 30, 2010 is consolidated with TransTech and is included in the Form 10-Q filed with the SEC on August 12, 2010.
|
| 14.1 |
Code of Ethics for Employees and Directors, filed as Exhibit 14.1 to Form 10-KSB filed on January 16, 2007, and incorporated herein by reference.
|
| 21.1 | |
| 31.1 | Certification by Chief Executive Officer pursuant to Rule 13a-14(a). (1) |
| 31.2 | Certification by Chief Financial Officer pursuant to Rule 13a-14(a). (1) |
| 32.1 | Certification by Chief Executive Officer pursuant to 18 U.S.C. Section 1350, as adopted pursuant to Section 906 of the Sarbanes-Oxley Act of 2002. (1) |
| 32.2 | Certification by Chief Financial Officer pursuant to 18 U.S.C. Section 1350, as adopted pursuant to Section 906 of the Sarbanes-Oxley Act of 2002. (1) |
| (1) |
Filed herewith.
|
20
|
MADSEN & ASSOCIATES CPA’S, INC.
Certified Public Accountants and Business Consultants
|
684 East Vine St. #3
Murray, Utah 84107
Telephone 801-268-2632
|
Board of Directors
Visualant, Incorporated and Subsidiaries
Seattle, Washington
REPORT OF INDEPENDENT REGISTERED PUBLIC ACCOUNTING FIRM
We have audited the accompanying balance sheets of Visualant, Incorporated and subsidiaries. as of September 30, 2010 and 2009 and the related statements of operations, stockholders' equity, and cash flows for each of the years in the three-year period ended September 30, 2010. These financial statements are the responsibility of the Company's management. Our responsibility is to express an opinion on these financial statements based on our audit.
We conducted our audit in accordance with the standards of the Public Company Accounting Oversight Board (United States). Those standards require that we plan and perform the audit to obtain reasonable assurance about whether the financial statements are free of material misstatement. The Company is not required to have, nor were we engaged to perform, an audit of its internal control over financial reporting. Our audit included consideration of internal control over financial reporting as a basis for designing audit procedures that are appropriate in the circumstances, but not for the purpose of expressing an opinion on the effectiveness of the company’s internal control over financial reporting. Accordingly, we express no such opinion. An audit includes examining, on a test basis, evidence supporting the amounts and disclosures in the financial statements. An audit also includes assessing the accounting principles used and significant estimates made by management as well as evaluating the overall financial statement presentation. We believe that our audits provide a reasonable basis for our opinion.
In our opinion, the financial statements referred to above present fairly, in all material respects, the financial position of Visualant, Incorporated and subsidiaries as of September 30, 2010 and 2009 and the results of operations, and cash flows for each of the years in the three-year period ended September 30, 2010, in conformity with accounting principles generally accepted in the United States of America.
The accompanying financial statements have been prepared assuming that the Company will continue as a going concern. The Company will need additional working capital for its planned activity and to service its debt, which raises substantial doubt about its ability to continue as a going concern. Management's plans in regard to these matters are described in the notes to the financial statements. These financial statements do not include any adjustments that might result from the outcome of this uncertainty.
s/s Madsen & Associates CPA’s, Inc.
Madsen & Associates CPA’s, Inc., Salt Lake City, Utah,
December 28, 2010
F-1
|
VISUALANT, INCORPORATED AND SUBSIDIARIES
|
||||||||
|
CONSOLIDATED BALANCE SHEETS
|
||||||||
|
September 30, 2010
|
September 30, 2009
|
|||||||
|
ASSETS
|
||||||||
|
CURRENT ASSETS:
|
||||||||
|
Cash and cash equivalents
|
$ | 83,937 | $ | 5,325 | ||||
|
Accounts receivable, net of allowance of $16,750 and $0, respectively
|
883,567 | - | ||||||
|
Prepaid expenses
|
54,386 | 6,514 | ||||||
|
Inventories
|
622,770 | - | ||||||
|
Refundable tax assets
|
8,581 | - | ||||||
|
Total current assets
|
1,653,241 | 11,839 | ||||||
|
EQUIPMENT, NET
|
588,060 | - | ||||||
|
OTHER ASSETS
|
||||||||
|
Intangible assets, net
|
918,069 | - | ||||||
|
Goodwill
|
983,645 | - | ||||||
|
Investment in Novabeam, Inc.
|
50 | 50 | ||||||
|
Other assets
|
1,091 | - | ||||||
|
TOTAL ASSETS
|
$ | 4,144,156 | $ | 11,889 | ||||
|
LIABILITIES AND STOCKHOLDERS' DEFICIT
|
||||||||
|
CURRENT LIABILITIES:
|
||||||||
|
Accounts payable - trade
|
$ | 1,432,074 | $ | 209,159 | ||||
|
Accounts payable - related parties
|
149,932 | 156,367 | ||||||
|
Accrued expenses
|
169,364 | 133,407 | ||||||
|
Accrued expenses - related parties
|
766,284 | 722,346 | ||||||
|
Convertible notes payable, net of debt discount of $11,153
|
288,847 | - | ||||||
|
Note payable - current portion of long term debt
|
1,513,495 | 157,072 | ||||||
|
Total current liabilities
|
4,319,996 | 1,378,351 | ||||||
|
LONG TERM LIABILITIES:
|
||||||||
|
Long term debt
|
1,675,978 | - | ||||||
|
STOCKHOLDERS' DEFICIT:
|
||||||||
|
Preferred stock - $0.001 par value, 50,000,000 shares authorized, no shares
|
||||||||
|
issued and outstanding
|
- | - | ||||||
|
Common stock - $0.001 par value, 200,000,000 shares authorized, 38,229,374
|
||||||||
|
and 29,162,707 shares issued and outstanding at 9/30/10 and 9/30/09, respectively
|
38,229 | 29,162 | ||||||
|
Additional paid in capital
|
6,835,647 | 6,229,733 | ||||||
|
Accumulated deficit
|
(8,774,277 | ) | (7,625,357 | ) | ||||
|
Total stockholders' deficit
|
(1,900,401 | ) | (1,366,462 | ) | ||||
|
Noncontrolling interest
|
48,583 | - | ||||||
|
TOTAL LIABILITIES AND STOCKHOLDERS' DEFICIT
|
$ | 4,144,156 | $ | 11,889 | ||||
The accompanying notes are an integral part of these consolidated financial statements.
F-2
|
VISUALANT, INCORPORATED AND SUBSIDIARIES
|
||||||||||||
|
CONSOLIDATED STATEMENTS OF OPERATIONS
|
||||||||||||
|
Year Ended ,
|
||||||||||||
|
September 30, 2010
|
September 30, 2009
|
September 30, 2008
|
||||||||||
|
REVENUE
|
$ | 2,542,627 | $ | - | $ | - | ||||||
|
COST OF SALES
|
2,095,491 | - | - | |||||||||
|
GROSS PROFIT
|
447,136 | - | - | |||||||||
|
RESEARCH AND DEVELOPMENT EXPENSES
|
90,900 | 214,105 | - | |||||||||
|
SELLING, GENERAL AND ADMINISTRATIVE EXPENSES
|
1,377,116 | 682,943 | 791,962 | |||||||||
|
OPERATING LOSS
|
(1,020,880 | ) | (897,048 | ) | (791,962 | ) | ||||||
|
OTHER INCOME (EXPENSE):
|
||||||||||||
|
Interest expense
|
(143,668 | ) | (53,561 | ) | (153,104 | ) | ||||||
|
Other income
|
9,662 | - | - | |||||||||
|
Total other expense
|
(134,006 | ) | (53,561 | ) | (153,104 | ) | ||||||
|
LOSS BEFORE INCOME TAXES
|
(1,154,886 | ) | (950,609 | ) | (945,066 | ) | ||||||
|
Income taxes - current benefit
|
(8,090 | ) | - | - | ||||||||
|
NET LOSS
|
(1,146,796 | ) | (950,609 | ) | (945,066 | ) | ||||||
|
NONCONTROLLING INTEREST
|
2,124 | - | - | |||||||||
|
NET LOSS ATTRIBUTABLE TO VISUALANT, INC. AND SUBSIDIARIES COMMON SHAREHOLDERS
|
$ | (1,148,920 | ) | $ | (950,609 | ) | $ | (945,066 | ) | |||
|
Basic and diluted loss per common share attributable to Visualant, Inc. and subsidiaries common shareholders-
|
||||||||||||
|
Basic and diluted loss per share
|
$ | (0.04 | ) | $ | (0.03 | ) | $ | (0.05 | ) | |||
|
Weighted average shares of common stock outstanding- basic and diluted
|
30,728,036 | 28,003,021 | 18,029,095 | |||||||||
The accompanying notes are an integral part of these consolidated financial statements.
F-3
|
VISUALANT, INCORPORATED AND SUBSIDIARIES
|
||||||||||||||||||||
|
CONSOLIDATED STATEMENTS OF CHANGES IN STOCKHOLDERS' DEFICIT
|
||||||||||||||||||||
|
Additional
|
Total
|
|||||||||||||||||||
|
Common Stock
|
Paid in
|
Accumulated
|
Stockholders'
|
|||||||||||||||||
|
Shares
|
Amount
|
Capital
|
Deficit
|
Deficit
|
||||||||||||||||
|
Balance as of September 30, 2007
|
16,853,891 | $ | 16,854 | $ | 4,234,495 | $ | (5,729,682 | ) | $ | (1,478,333 | ) | |||||||||
|
Issuance of common stock for services
|
1,500,000 | 1,500 | 139,000 | - | 140,500 | |||||||||||||||
|
Stock compensation expense - employee options
|
- | - | 148,265 | - | 148,265 | |||||||||||||||
|
Net loss
|
- | - | - | (945,066 | ) | (945,066 | ) | |||||||||||||
|
Comprehensive loss
|
(945,066 | ) | ||||||||||||||||||
|
Balance as of September 30, 2008
|
18,353,891 | 18,354 | 4,521,760 | (6,674,748 | ) | (2,134,634 | ) | |||||||||||||
|
Stock compensation expense - employee options
|
- | - | 139,787 | - | 139,787 | |||||||||||||||
|
Stock compensations expense - non-employee options
|
7,922 | - | 7,922 | |||||||||||||||||
|
Issuance of common stock for services
|
6,175,043 | 6,175 | 929,432 | - | 935,607 | |||||||||||||||
|
Issuance of common stock for retirement of debt
|
4,233,773 | 4,233 | 630,832 | - | 635,065 | |||||||||||||||
|
Issuance of common stock for accrued liabilities
|
400,000 | 400 | - | - | 400 | |||||||||||||||
|
Net loss
|
- | - | - | (950,609 | ) | (950,609 | ) | |||||||||||||
|
Comprehensive loss
|
(950,609 | ) | ||||||||||||||||||
|
Balance as of September 30, 2009
|
29,162,707 | 29,162 | 6,229,733 | (7,625,357 | ) | (1,366,462 | ) | |||||||||||||
|
Stock compensation expense - employee options
|
- | - | 150,625 | - | 150,625 | |||||||||||||||
|
Stock compensations expense - non-employee options
|
- | - | 1,428 | - | 1,428 | |||||||||||||||
|
Issuance of common stock for services
|
4,400,000 | 4,400 | 118,600 | - | 123,000 | |||||||||||||||
|
Issuance of warrants in connection with convertible debt
|
- | - | 61,336 | - | 61,336 | |||||||||||||||
|
Issuance of common stock for accrued liabilities
|
866,667 | 867 | 143,133 | - | 144,000 | |||||||||||||||
|
Issuance of common stock connection with acquisition
|
3,800,000 | 3,800 | 130,792 | - | 134,592 | |||||||||||||||
|
of TransTech Systems, Inc.
|
- | |||||||||||||||||||
|
Net loss
|
- | - | - | (1,148,920 | ) | (1,148,920 | ) | |||||||||||||
|
Comprehensive loss
|
(1,148,920 | ) | ||||||||||||||||||
|
Balance as of September 30, 2010
|
38,229,374 | $ | 38,229 | $ | 6,835,647 | $ | (8,774,277 | ) | $ | (1,900,401 | ) | |||||||||
The accompanying notes are an integral part of these consolidated financial statements.
F-4
|
CONSOLIDATED STATEMENTS OF CASH FLOWS
|
||||||||||||
|
Year Ended September 30,
|
||||||||||||
|
2010
|
2009
|
2008
|
||||||||||
|
CASH FLOWS FROM OPERATING ACTIVITIES:
|
||||||||||||
|
Net loss
|
$ | (1,146,796 | ) | $ | (950,609 | ) | $ | (945,066 | ) | |||
|
Adjustments to reconcile net loss to net cash
|
||||||||||||
|
(used in) operating activities
|
||||||||||||
|
Depreciation and amortization
|
89,235 | - | - | |||||||||
|
Issuance of capital stock and warrants for services and expenses
|
181,592 | 382,855 | 140,500 | |||||||||
|
Stock based compensation
|
152,053 | 139,787 | 139,786 | |||||||||
|
Amortization of debt discount
|
50,183 | |||||||||||
|
Stock options issued in exchange for services
|
- | 7,922 | 8,479 | |||||||||
|
Provision for losses on accounts receivable
|
1,663 | |||||||||||
|
Gain on sale of assets
|
550 | |||||||||||
|
Minority interest
|
2,124 | |||||||||||
|
Amortization of deferred financing costs
|
- | - | 83,156 | |||||||||
|
Changes in operating assets and liabilities:
|
||||||||||||
|
Accounts receivable
|
(64,176 | ) | - | |||||||||
|
Prepaid expenses
|
(7,865 | ) | (4,748 | ) | 3,771 | |||||||
|
Inventory
|
(218,157 | ) | - | - | ||||||||
|
Other assets
|
(25,741 | ) | - | - | ||||||||
|
Accounts payable - trade and accrued expenses
|
544,367 | 429,913 | 569,538 | |||||||||
|
CASH (USED IN) OPERATING ACTIVITIES
|
(440,968 | ) | 5,120 | 164 | ||||||||
|
CASH FLOWS FROM INVESTING ACTIVITIES:
|
||||||||||||
|
Capital expenditures
|
(22,815 | ) | - | - | ||||||||
|
Cash from the acquisition of TransTech Systems, Inc.
|
76,216 | - | - | |||||||||
|
Purchase of Investment - deposit
|
- | (50 | ) | - | ||||||||
|
NET CASH (USED IN) INVESTING ACTIVITIES:
|
53,401 | (50 | ) | - | ||||||||
|
CASH FROM FINANCING ACTIVITIES:
|
||||||||||||
|
Proceeds from line of credit
|
188,283 | - | - | |||||||||
|
Repayments of capital leases
|
(2,104 | ) | - | - | ||||||||
|
Proceeds from the issuance of convertible debt
|
300,000 | - | - | |||||||||
|
Distributions
|
(20,000 | ) | - | - | ||||||||
|
NET CASH PROVIDED BY FINANCING ACTIVITIES
|
466,179 | - | - | |||||||||
|
NET INCREASE IN CASH AND CASH EQUIVALENTS
|
78,612 | 5,070 | 164 | |||||||||
|
CASH AND CASH EQUIVALENTS, beginning of period
|
5,325 | 255 | 91 | |||||||||
|
CASH AND CASH EQUIVALENTS, end of period
|
$ | 83,937 | $ | 5,325 | $ | 255 | ||||||
|
Supplemental disclosures of cash flow information:
|
||||||||||||
|
Interest paid
|
$ | 23,014 | $ | 35,139 | $ | - | ||||||
|
Taxes paid
|
$ | - | $ | - | $ | - | ||||||
|
Non-cash investing and financing activities:
|
||||||||||||
|
Issuance of common stock for conversion of liabilities
|
$ | 144,000 | $ | - | $ | - | ||||||
|
Issuance of warrants in connection with convertible debt
|
$ | 61,336 | $ | - | $ | - | ||||||
|
Issuance of common stock for acquisition
|
$ | 134,592 | $ | - | $ | - | ||||||
|
Issuance of note payable for acquisition
|
$ | 2,300,000 | $ | - | $ | - | ||||||
|
Issuance of common stock to retire debt
|
$ | - | $ | - | $ | 482,095 | ||||||
|
Conversion of accounts payable to promissory note
|
$ | - | $ | - | $ | 106,322 | ||||||
|
Issuance of common stock in repayment of accounts payable
|
$ | - | $ | - | $ | 706,122 | ||||||
The accompanying notes are an integral part of these consolidated financial statements.
F-5
VISUALANT, INCORPORATED AND SUBSIDIARIES
NOTES TO CONSOLIDATED FINANCIAL STATEMENTS
|
1.
|
ORGANIZATION
|
Visualant, Inc. (the “Company”) was incorporated under the laws of the State of Nevada on October 8, 1998 with authorized common stock of 200,000,000 shares at $0.001 par value. On September 13, 2002 50,000,000 shares of preferred stock with a par value of $0.001 were authorized by the shareholders. There are no preferred shares issued and the terms have not been determined.
The Company closed the acquisition of TransTech of Aurora, OR on June 8, 2010 and recorded the results from June 8, 2010 to September 30, 2010. As of June 8, 2010, the Company is no longer in the development stage.
This acquisition is expected to accelerate market entry and penetration through the acquisition of well-operated and positioned distributors of security and authentication systems like TransTech, thus creating a natural distribution channel for products featuring our proprietary Spectrum Pattern Matching (“SPM”) technology.
|
2.
|
GOING CONCERN
|
The accompanying financial statements have been prepared on a going concern basis, which contemplates the realization of assets and the satisfaction of liabilities in the normal course of business. We have incurred net losses of $1,148,920 and $950,609 for the years ended September 30, 2010 and 2009, respectively. Our current liabilities exceeded our current assets by approximately $2.7 million as of September 30, 2010. Our net cash used in operating activities approximated $440,968 for the year ended September 30, 2010.
As of September 30, 2010, the Company had $83,937 in cash. The Company needs to raise additional funding to continue its operations. However, there can be no assurance that financing or additional funding will be available to the Company on favorable terms or at all. If the Company raises additional capital through the sale of equity or convertible debt securities, the issuance of such securities may result in dilution to existing stockholders.
We anticipate that we will record losses from operations for the foreseeable future. As of September 30, 2010, our accumulated deficit was $8.8 million. We have limited capital resources, and operations to date have been funded with the proceeds from private equity and debt financings. These conditions raise substantial doubt about our ability to continue as a going concern. The audit report prepared by our independent registered public accounting firm relating to our financial statements for the year ended September 30, 2010 includes an explanatory paragraph expressing the substantial doubt about our ability to continue as a going concern.
Continuation of the Company as a going concern is dependent upon obtaining additional working capital. The financial statements do not include any adjustments that might be necessary if we are unable to continue as a going concern.
|
3.
|
SIGNIFICANT ACCOUNTING POLICIES: ADOPTION OF ACCOUNTING STANDARDS
|
PRINCIPLES OF CONSOLIDATION - The consolidated financial statements include the accounts of the Company and its wholly owned and majority-owned subsidiaries. Inter-Company items and transactions have been eliminated in consolidation.
CASH AND CASH EQUIVALENTS - The Company classifies highly liquid temporary investments with an original maturity of three months or less when purchased as cash equivalents. The Company maintains cash balances at various financial institutions. Balances at US banks are insured by the Federal Deposit Insurance Corporation up to US$250,000. The Company has not experienced any losses in such accounts and believes it is not exposed to any significant risk for cash on deposit.
ACCOUNTS RECEIVABLE AND ALLOWANCE FOR DOUBTFUL ACCOUNTS - Accounts receivable consists primarily of amounts due to the Company from normal business activities. The Company maintains an allowance for doubtful accounts to reflect the expected non-collection of accounts receivable based on past collection history and specific risks identified within the portfolio. If the financial condition of the customers were to deteriorate resulting in an impairment of their ability to make payments, or if payments from customers are significantly delayed, additional allowances might be required.
INVENTORIES - Inventories consist primarily of printers and consumable supplies, including ribbons and cards, badge accessories, capture devices, and access control components held for resale and are stated at the lower of cost or market on the first-in, first-out (“FIFO”) method. Inventories are considered available for resale when drop shipped and invoiced directly to a customer from a vendor, or when physically received by TransTech at a warehouse location. The company records a provision for excess and obsolete inventory whenever an impairment has been identified. There is no provision for impaired inventory as of September 30, 2010.
EQUIPMENT - Equipment consists of machinery, leasehold improvements, furniture and fixtures and software, which are stated at cost less accumulated depreciation and amortization. Depreciation is computed by the straight-line method over the estimated useful lives or lease period of the relevant asset, generally 3-10 years, except for leasehold improvements which are depreciated over 20 years.
F-6
INTANGIBLE ASSETS / INTELLECTUAL PROPERTY - The Company amortizes the intangible assets and intellectual property acquired in connection with the acquisition of TransTech, over thirty six months on a straight - line basis, which was the time frame that the management of the Company was able to project forward for future revenue, either under agreement or through expected continued business activities.
GOODWILL – Goodwill is the excess of cost of an acquired entity over the fair value of amounts assigned to assets acquired and liabilities assumed in a business combination. With the adoption of ASC 350, goodwill is not amortized, rather it is tested for impairment annually, and will be tested for impairment between annual tests if an event occurs or circumstances change that would indicate the carrying amount may be impaired. Impairment testing for goodwill is done at a reporting unit level. Reporting units are one level below the business segment level, but are combined when reporting units within the same segment have similar economic characteristics. Under the criteria set forth by ASC 350, the Company has one reporting unit based on the current structure. An impairment loss generally would be recognized when the carrying amount of the reporting unit’s net assets exceeds the estimated fair value of the reporting unit. The Company performs annual assessments and has determined that no impairment is necessary.
LONG-LIVED ASSETS - The Company reviews its long-lived assets for impairment when changes in circumstances indicate that the carrying amount of an asset may not be recoverable. Long-lived assets under certain circumstances are reported at the lower of carrying amount or fair value. Assets to be disposed of and assets not expected to provide any future service potential to the Company are recorded at the lower of carrying amount or fair value (less the projected cost associated with selling the asset). To the extent carrying values exceed fair values, an impairment loss is recognized in operating results.
FAIR VALUE OF FINANCIAL INSTRUMENTS - The Company has adopted FASB Accounting Standards Codification (“ASC”) Topic 820, “Fair Value Measurements”, for assets and liabilities measured at fair value on a recurring basis. Topic 820 establishes a common definition for fair value to be applied to existing generally accepted accounting principles that require the use of fair value measurements, establishes a framework for measuring fair value and expands disclosure about such fair value measurements. Topic 820 defines fair value as the price that would be received to sell an asset or paid to transfer a liability in an orderly transaction between market participants at the measurement date. Additionally, Topic 820 requires the use of valuation techniques that maximize the use of observable inputs and minimize the use of unobservable inputs. These inputs are prioritized below:
|
Level 1:
|
Observable inputs such as quoted market prices in active markets for identical assets or liabilities
|
|
|
Level 2:
|
Observable market-based inputs or unobservable inputs that are corroborated by market data
|
|
|
Level 3:
|
Unobservable inputs for which there is little or no market data, which require the use of the reporting entity’s own assumptions.
|
All cash and cash equivalents include money market securities and commercial paper that are considered to be highly liquid and easily tradable as of September 30, 2010. These securities are valued using inputs observable in active markets for identical securities and are therefore classified as Level 1 within our fair value hierarchy.
The carrying amounts of the Company’s financial assets and liabilities, such as cash, accounts receivable, inventory, accounts payable, taxes payable, accrued expenses and other current liabilities, approximate their fair values because of the short maturity of these instruments. The Company’s notes payable approximates the fair value of such instruments based upon management’s best estimate of interest rates that would be available to the Company for a similar financial arrangement at September 30, 2010.
In addition, Topic 820 expands opportunities to use fair value measurements in financial reporting and permits entities to choose to measure many financial instruments and certain other items at fair value. The Company did not elect the fair value option for any of its qualifying financial instruments.
REVENUE RECOGNITION – TransTech revenue is derived from other products and services. Revenue is considered realized when the services have been provided to the customer, the work has been accepted by the customer and collectability is reasonably assured. Furthermore, if an actual measurement of revenue cannot be determined, we defer all revenue recognition until such time that an actual measurement can be determined. If during the course of a contract management determines that losses are expected to be incurred, such costs are charged to operations in the period such losses are determined. Revenues are deferred when cash has been received from the customer but the revenue has not been earned. The Company recorded deferred revenue of $0 as of September 30, 2010 and September 30, 2009, respectively.
ADVERTISING COSTS - Advertising costs are expensed as incurred. Such costs generally consist of major industry trade shows cooperatively with vendors and some advertising in industry publications. Advertising costs were insignificant during the years ended September 30, 2010, 2009 and 2008.
F-7
STOCK BASED COMPENSATION - The Company has share-based compensation plans under which employees, consultants, suppliers and directors may be granted restricted stock, as well as options to purchase shares of Company common stock at the fair market value at the time of grant. Stock-based compensation cost is measured by the Company at the grant date, based on the fair value of the award, over the requisite service period. For options issued to employees, the Company recognizes stock compensation costs utilizing the fair value methodology over the related period of benefit. Grants of stock options and stock to non-employees and other parties are accounted for in accordance with the ASC 505.
When stock options are granted, the fair value of each option grant is estimated on the date of grant using the Black-Scholes valuation model and the weighted assumptions noted in the following table:
|
For the Years Ended
September 30,
|
|||
|
2010
|
2009
|
||
|
Risk-free interest rate
|
3.34%
|
1.14%
|
|
|
Expected life
|
9.29 years
|
3.00 years
|
|
|
Dividend rate
|
0.00%
|
0.00%
|
|
|
Expected volatility
|
259%
|
251%
|
|
INCOME TAXES - Income tax benefit is based on reported loss before income taxes. Deferred income taxes reflect the effect of temporary differences between asset and liability amounts that are recognized for financial reporting purposes and the amounts that are recognized for income tax purposes. These deferred taxes are measured by applying currently enacted tax laws where that company operates out of. The Company recognizes refundable and deferred assets to the extent that management has determined their realization. As of September 30, 2010 and September 30, 2009, the Company had refundable tax assets related to TransTech of $8,581 and $0, respectively.
NET LOSS PER SHARE – Under the provisions of ASC 260, “Earnings Per Share,” basic loss per common share is computed by dividing net loss available to common shareholders by the weighted average number of shares of common stock outstanding for the periods presented. Diluted net loss per share reflects the potential dilution that could occur if securities or other contracts to issue common stock were exercised or converted into common stock or resulted in the issuance of common stock that would then share in the income of the Company, subject to anti-dilution limitations. The common stock equivalents have not been included as they are anti-dilutive. As of September 30, 2010, there were options outstanding for the purchase of 4,735,000 common shares, warrants for the purchase of 1,133,333 common shares, 1,666,667 shares of common stock related to convertible debt, which could potentially dilute future earnings per share. As of September 30, 2009, there were options outstanding for the purchase of 1,310,000 common shares which could potentially dilute future earnings per share.
DIVIDEND POLICY - The Company has never paid any cash dividends and intends, for the foreseeable future, to retain any future earnings for the development of our business. Our future dividend policy will be determined by the board of directors on the basis of various factors, including our results of operations, financial condition, capital requirements and investment opportunities.
USE OF ESTIMATES - The preparation of financial statements in conformity with accounting principles generally accepted in the United States requires management to make estimates and assumptions that affect the reported amounts of assets and liabilities and disclosure of contingent assets and liabilities at the date of the financial statements and the reported amounts of revenues and expenses during the reporting period. Actual results could differ from those estimates.
RECLASSIFICATION - Certain reclassifications have been made to the Company’s financial statements for prior periods to conform to the current presentation. These reclassifications had no effect on previously reported results of operations or retained earnings.
RECENT ACCOUNTING PRONOUNCEMENTS
Recent accounting pronouncements applicable to the Company are summarized below.
|
•
|
In June 2009, the FASB approved the “FASB Accounting Standards Codification” (the “Codification”) as the single source of authoritative nongovernmental U.S. GAAP to be launched on July 1, 2009. The Codification does not change current U.S. GAAP, but is intended to simplify user access to all authoritative U.S. GAAP by providing all the authoritative literature related to a particular topic in one place. All existing accounting standard documents will be superseded and all other accounting literature not included in the Codification will be considered non-authoritative. The Codification is effective for interim and annual periods ending after September 15, 2009.
|
|
|
•
|
In August 2009, the FASB issued the FASB Accounting Standards Update No. 2009-04 “Accounting for Redeemable Equity Instruments - Amendment to Section 480-10-S99” which represents an update to section 480-10-S99, distinguishing liabilities from equity, per EITF Topic D-98, Classification and Measurement of Redeemable Securities. The Company does not expect the adoption of this update to have a material impact on its consolidated financial position, results of operations or cash flows.
|
F-8
|
•
|
In August 2009, the FASB issued the FASB Accounting Standards Update No. 2009-05 “Fair Value Measurement and Disclosures Topic 820 – Measuring Liabilities at Fair Value”, which provides amendments to subtopic 820-10, Fair Value Measurements and Disclosures – Overall, for the fair value measurement of liabilities. This update provides clarification that in circumstances in which a quoted price in an active market for the identical liability is not available, a reporting entity is required to measure fair value using one or more of the following techniques: 1. A valuation technique that uses: a. The quoted price of the identical liability when traded as an asset b. Quoted prices for similar liabilities or similar liabilities when traded as assets. 2. Another valuation technique that is consistent with the principles of topic 820; two examples would be an income approach, such as a present value technique, or a market approach, such as a technique that is based on the amount at the measurement date that the reporting entity would pay to transfer the identical liability or would receive to enter into the identical liability. The amendments in this update also clarify that when estimating the fair value of a liability, a reporting entity is not required to include a separate input or adjustment to other inputs relating to the existence of a restriction that prevents the transfer of the liability. The amendments in this update also clarify that both a quoted price in an active market for the identical liability when traded as an asset in an active market when no adjustments to the quoted price of the asset are required are Level 1 fair value measurements. The Company does not expect the adoption of this update to have a material impact on its consolidated financial position, results of operations or cash flows.
|
|
|
•
|
In September 2009, the FASB issued the FASB Accounting Standards Update No. 2009-08 “Earnings Per Share – Amendments to Section 260-10-S99”,which represents technical corrections to topic 260-10-S99, Earnings per share, based on EITF Topic D-53, Computation of Earnings Per Share for a Period that includes a Redemption or an Induced Conversion of a Portion of a Class of Preferred Stock and EITF Topic D-42, The Effect of the Calculation of Earnings per Share for the Redemption or Induced Conversion of Preferred Stock. The Company does not expect the adoption of this update to have a material impact on its consolidated financial position, results of operations or cash flows.
|
|
|
•
|
In September 2009, the FASB issued the FASB Accounting Standards Update No. 2009-09 “Accounting for Investments-Equity Method and Joint Ventures and Accounting for Equity-Based Payments to Non-Employees”. This update represents a correction to Section 323-10-S99-4, Accounting by an Investor for Stock-Based Compensation Granted to Employees of an Equity Method Investee. Additionally, it adds observer comment Accounting Recognition for Certain Transactions Involving Equity Instruments Granted to Other Than Employees to the Codification. The Company does not expect the adoption to have a material impact on its consolidated financial position, results of operations or cash flows.
|
|
|
•
|
In September 2009, the FASB issued the FASB Accounting Standards Update No. 2009-12 “Fair Value Measurements and Disclosures Topic 820 – Investment in Certain Entities That Calculate Net Assets Value Per Share (or Its Equivalent)”, which provides amendments to Subtopic 820-10, Fair Value Measurements and Disclosures-Overall, for the fair value measurement of investments in certain entities that calculate net asset value per share (or its equivalent). The amendments in this update permit, as a practical expedient, a reporting entity to measure the fair value of an investment that is within the scope of the amendments in this update on the basis of the net asset value per share of the investment (or its equivalent) if the net asset value of the investment (or its equivalent) is calculated in a manner consistent with the measurement principles of Topic 946 as of the reporting entity’s measurement date, including measurement of all or substantially all of the underlying investments of the investee in accordance with Topic 820. The amendments in this update also require disclosures by major category of investment about the attributes of investments within the scope of the amendments in this update, such as the nature of any restrictions on the investor’s ability to redeem its investments at the measurement date, any unfunded commitments (for example, a contractual commitment by the investor to invest a specified amount of additional capital at a future date to fund investments that will be made by the investee), and the investment strategies of the investees. The major category of investment is required to be determined on the basis of the nature and risks of the investment in a manner consistent with the guidance for major security types in U.S. GAAP on investments in debt and equity securities in paragraph 320-10-50-1B. The disclosures are required for all investments within the scope of the amendments in this update regardless of whether the fair value of the investment is measured using the practical expedient. The Company does not expect the adoption to have a material impact on its consolidated financial position, results of operations or cash flows.
|
|
|
•
|
In October 2009, the FASB issued guidance for amendments to FASB Emerging Issues Task Force on EITF Issue No. 09-1 “Accounting for Own-Share Lending Arrangements in Contemplation of a Convertible Debt Issuance or Other Financing” (Subtopic 470-20) “Subtopic”. This accounting standards update establishes the accounting and reporting guidance for arrangements under which own-share lending arrangements issued in contemplation of convertible debt issuance. This Statement is effective for fiscal years, and interim periods within those fiscal years, beginning on or after December 15, 2009. Earlier adoption is not permitted. The Company does not expect the adoption to have a material impact on its consolidated financial position, results of operations or cash flows.
|
A variety of proposed or otherwise potential accounting standards are currently under study by standard setting organizations and various regulatory agencies. Due to the tentative and preliminary nature of those proposed standards, management has not determined whether implementation of such proposed standards would be material to our consolidated financial statements.
F-9
|
4.
|
DEVELOPMENT OF SPECTRUM PATTERN MATCHING TECHNOLOGY
|
The Company develops low-cost, high speed, light-based security and quality control solutions for use in homeland security, anti-counterfeiting, forgery/fraud prevention, brand protection and process control applications. Its patent-pending technology uses controlled illumination with specific bands of light, to establish a unique spectral signature for both individual and classes of items. When matched against existing databases, these spectral signatures allow precise identification and authentication of any item or substance. This breakthrough optical sensing and data capture technology is called Spectral Pattern Matching (SPM). SPM technology can be miniaturized and is easily integrated into a variety of hand-held or fixed mount configurations, and can be combined in the same package as a bar-code or biometric scanner.
On October 23, 2008, the Company and RATLab entered into definitive agreements which provide for a non-commercial non-exclusive license of the Company’s technology to RATLab for the purpose of continuing research and development with a license back to the Company for enhancements that are developed. Further, an exclusive license was entered into between the Company and RATLab for four fields of use: medical, agricultural, environmental and jewelry. This exclusive license provides for certain performance milestones, a market-rate royalty to the Company and an equity participation in an entity to be formed by RATLab to commercialize the Company’s technology in the enumerated fields of use. In accordance with the definitive agreements, RATLab formed Novabeam, Inc.(“Novabeam”), an affiliate for purposes of commercializing the intellectual property, of which 10% was sold and transferred to the Company for $50. Finally, in satisfaction of outstanding matters, a total of 1,850,000 shares of the Company’s common stock was issued, subject to certain restrictions, to current and former RATLab employees and consultants.
The Company has six patents pending in the United States and one patent pending in Japan. The Company has received notification from the U.S. Patent and Trademark Office that the original patent filed was denied. It was determined by the Company that it was not economically feasible to contest the finding. As of the report date, the Company has not received any notification from the U.S. Patent and Trademark Office as to whether any of the patents filed in 2007 will be granted.
PROPOSED ACQUISITION OF RATLAB
On October 1, 2010, the Company signed a Letter of Intent to acquire all Visualant related assets of the RATLab.
The RATLab is a Seattle based research and development laboratory created by Dr. Tom Furness, founder and Director of the HITLab International, with labs at Seattle, University of Canterbury in New Zealand, and the University of Tasmania in Australia. Guided by Dr. Tom Furness and Dr. Brian Schowengerdt, a research scientist in the field of optics and vision science, who developed the Spectral Pattern Matching (“SPM”) technology under contract for Visualant.
With this acquisition, the Company will consolidate all intellectual property relating to the SPM technology. In addition to its current authentication and security applications of SPM, the Company will now own all other applications including the important fields of medicine, agriculture, and the environment and begin the creation of the Visualant Laboratory.
Upon the closing of this asset acquisition transaction, Dr. Tom Furness and Dr. Brian Schowengerdt will continue to provide technology leadership to us, under terms that are still subject to negotiation.
The Company is proposing to acquire the Visualant related assets of the RATLab as follows:
a. One million shares (1,000,000) of our common stock at closing valued at twenty cents ($0.20) per share, the price during the negotiation of this agreement.
b. Two hundred and fifty thousand dollars ($250,000), with one hundred thousand dollars ($100,000) payable at closing and one hundred and fifty thousand dollars ($150,000) to be paid no later than the first anniversary of closing.
c. The outstanding promissory note owing to Tom Furness in the amount of $65,000 with accrued interest is to be paid at closing. The interest is to be calculated on a 7% annualized basis beginning September 1, 2006.
The acquisition of the Visualant related assets of the RATLab is expected to close during the first calendar quarter of 2011.
|
5.
|
ACQUISITION OF TRANSTECH
|
The Company closed the acquisition of TransTech of Aurora, OR on June 8, 2010. On this date, the Company entered into a Stock Purchase, Security and Stock Pledge Agreements which are included as Exhibits to the Form 10-Q filed with the SEC on August 12, 2010.
TransTech, founded in 1994, is a distributor of access control and authentication systems serving the security and law enforcement markets. With recorded revenues of $10 million in 2009, TransTech has a respected national reputation for outstanding product knowledge, sales and service excellence.
This acquisition is expected to accelerate market entry and penetration through the acquisition of well-operated and positioned distributors of security and authentication systems like TransTech, thus creating a natural distribution channel for products featuring the company’s proprietary SPM technology.
F-10
The Company acquired its 100% interest in TransTech by issuing a Promissory Note (“Note”) to James Gingo, the President of TransTech, in the amount of $2,300,000, plus interest at the rate of three and one-half percent (3.5%) per annum from the date of the Note. The Note is secured by a security interest in the stock and assets of TransTech, and is payable over a period of three (3) years as follows:
(i) The sum of $650,000, the amount of any accrued interest due on the Bonderson debt of $600,000 owed by James Gingo to the Bonderson Family Living Trust (“Bonderson Debt”) and interest on the unpaid balance, shall be paid to Seller on the earlier of: (A) the one (1) year anniversary of the closing date; or (B) on the closing of $2,500,000 or more in aggregate financing (whether debt, equity or some combination thereof) after the closing date;
(ii) The sum of $650,000, the amount of any accrued interest due on the Bonderson debt owed by James Gingo and interest on the unpaid balance shall be paid to Seller on the earlier of: (A) the two (2) year anniversary of the closing date; or (B) on the closing of $5,000,000 or more in aggregate financing (whether debt, equity or some combination thereof) after the closing date; and
(iii) The remaining balance of the Note and interest thereon shall be paid to Seller on the earlier of: (A) the three year anniversary of the closing date; or (B) on the closing of $7,500,000 or more in aggregate financing (whether debt, equity or some combination thereof) after the closing date.
On June 8, 2010, the Company issued a total of 3,800,000 shares of restricted common stock of the Company to James Gingo, Jeff Kruse and Steve Waddle, executives of TransTech, and Paul Bonderson, a TransTech investor. The parties valued the shares in this transaction at $76,000 or $0.02 per share, the closing bid price during negotiations.
The cost to acquire these assets has been preliminarily allocated to the assets acquired according to estimated fair values and is subject to adjustment when additional information concerning asset valuations is finalized, but no later than June 8, 2011. The preliminary allocation is as follows:
|
Common stock
|
$
|
76,000
|
||
|
Notes payable
|
2,300,000
|
|||
|
Accounts receivable, net
|
(755,836
|
)
|
||
|
Inventories
|
(444,105
|
)
|
||
|
Equipment, net
|
(590,955
|
)
|
||
|
Other assets
|
(141,870
|
)
|
||
|
Accounts payable - trade
|
921,183
|
|||
|
Notes payable - current portion of long term debt
|
499,680
|
|||
|
Other liabilities
|
103,193
|
|||
|
Total purchase price
|
$
|
1,967,290
|
||
|
Portion allocated to identifiable intangible assets
|
$
|
983,645
|
||
|
Portion allocated to goodwill
|
983,645
|
|||
|
Total
|
$
|
1,967,290
|
The results of operations of TransTech were included in the Consolidated Statements of Operations for the period June 9, 2010 to September 30, 2010.
The pro-forma financial data for the acquisition for the year ended September 30, 2010, were as follows:
|
As Reported Year Ended September 30, 2010
|
Pre-Acquisition Operations of TransTech Systems, Inc. October 1, 2009 - June 8, 2010
|
Pro Forma Year Ended September 30, 2010
|
||||||||||
|
Revenue
|
$ | 2,542,627 | $ | 5,601,164 | $ | 8,143,791 | ||||||
|
Net loss per common share
|
(1,148,920 | ) | (65,071 | ) | (1,213,991 | ) | ||||||
|
Net loss per common share
|
(0.04 | ) | (0.04 | ) | ||||||||
F-11
There were no material, nonrecurring items included in the reported the pro-forma results.
|
6.
|
ACCOUNTS RECEIVABLE/CUSTOMER CONCENTRATION
|
Accounts receivable were $883,567 and $0, net of allowance, as of September 30, 2010 and 2009, respectively. The Company had no customers in excess of 10% of our consolidated revenues for the period June 9, 2010- September 30, 2010. The Company had one customer with accounts receivable in excess of 10% as of September 30, 2010. The Company does expect to have customers with revenues or a receivable balance of 10% of total accounts receivable in the foreseeable future.
|
7.
|
INVENTORIES
|
Inventories were $622,770 and $0 as of September 30, 2010 and 2009, respectively. Inventories consist primarily of printers and consumable supplies, including ribbons and cards, badge accessories, capture devices, and access control components held for resale. There is no provision for impaired inventory as of September 30, 2010 and 2009.
|
8.
|
FIXED ASSETS
|
Fixed assets, net of accumulated depreciation, was $588,060 and $0 as of September 30, 2010 and 2009, respectively. Accumulated depreciation was $599,784 and $0 as of September 30, 2010 and 2009, respectively. Total depreciation expense, was $24,025 and $0 for the year ended September 30, 2010 and 2009, respectively. The results of operations of TransTech were included in the Consolidated Statements of Operations for the period June 9, 2010 to September 30, 2010. All equipment is used for selling, general and administrative purposes and accordingly all depreciation is classified in selling, general and administrative expenses.
Property and equipment as of September 30, 2010 was comprised of the following:
|
Estimated
|
September 30, 2010
|
||||||||||||
|
Useful Lives
|
Purchased
|
Capital Leases
|
Total
|
||||||||||
|
Machinery and equipment
|
3-10 years
|
$ | 211,131 | $ | 87,038 | $ | 298,169 | ||||||
|
Leasehold improvements
|
20 years
|
600,000 | - | 600,000 | |||||||||
|
Furniture and fixtures
|
3-10 years
|
71,758 | 101,260 | 173,018 | |||||||||
|
Software and websites
|
3- 7 years
|
69,403 | 47,254 | 116,657 | |||||||||
|
Less: accumulated depreciation
|
(442,977 | ) | (156,807 | ) | (599,784 | ) | |||||||
| $ | 509,315 | $ | 78,745 | $ | 588,060 | ||||||||
|
9.
|
INTANGIBLE ASSETS
|
Intangible assets as of September 30, 2010 and 2009 consisted of the following:
|
Estimated
|
September 30,
|
||||||||
|
Useful Lives
|
2010
|
2009
|
|||||||
|
Customer contracts
|
5 years
|
$ | 983,645 | $ | - | ||||
|
Less: accumulated amortization
|
(65,576 | ) | - | ||||||
|
Intangible assets, net
|
$ | 918,069 | $ | - | |||||
Total amortization expense was $65,576 and $0 for the year ended September 30, 2010 and 2009, respectively.
The fair value of the TransTech intellectual property acquired was $983,645, estimated by using a discounted cash flow approach based on future economic benefits associated with agreements with customers, or through expected continued business activities with its customers. In summary, the estimate was based on a projected income approach and related discounted cash flows over five years, with applicable risk factors assigned to assumptions in the forecasted results.
|
10.
|
ACCOUNTS PAYABLE
|
Accounts payable were $1,432,074 and $209,159 as of September 30, 2010 and 2009, respectively. Such liabilities consisted of amounts due to vendors for inventory purchases and technology development, external audit, legal and other expenses incurred by the Company.
F-12
|
11.
|
CONVERTIBLE NOTES PAYABLE
|
On December 7, 2009, the Company obtained $250,000 of financing from Coach Capital pursuant to a Convertible Promissory Note. Interest accrues at 8% and the $250,000 may be converted into restricted common stock on November 27, 2010 at $0.15 per share. This financing places certain restrictions on the Company In addition, Coach Capital received warrants to purchase 833,333 shares of the Company’s common stock at $0.15 per share. The warrant expires 3 years from the date of issuance.
Upon issuing the Note to Coach Capital, the Company recognized the note and warrants based on their relative fair values of $250,000 and $81,000, respectively. The fair value of the note was determined using the Black-Scholes option pricing model. The relative fair value of the warrants was classified as a component of additional paid-in capital with the corresponding amount reflected as a contra-liability to the debt. The fair value of the warrants was determined using the Black Scholes model, assuming a term of three years, volatility of 267%, no dividends, and a risk-free interest rate of 1.34%.
The convertible note payable balance as of September 30, 2010, net of $11,153 in warrant debt discount, was $238,847. The Company expensed $16,438 in interest during the year ended September 30, 2010.
On July 14, 2010, the Company obtained $50,000 of financing from Asher Enterprises, Inc. (“Asher”) pursuant to a Securities Purchase Agreement and Convertible Promissory Note. Interest is accrued at 8% and the $50,000 is convertible into restricted common stock on or before April 19, 2011 at Asher’s request at a 39% discount to the three lowest close bid prices during the ten days prior to conversion. This financing places certain restrictions on the Company. The Company expensed $537 during the year ended September 30, 2010.
|
12.
|
NOTES PAYABLE, CAPITALIZED LEASES AND LONG TERM DEBT
|
Notes payable, capitalized leases and long term debt as of September 30, 2010 and 2009 consisted of the following:
|
September 30,
|
September 30,
|
|||||||
|
2010
|
2009
|
|||||||
|
BFI Finance Corp Secured Credit Facility
|
$ | 643,334 | $ | - | ||||
|
TransTech capitalized leases, net of capitalized interest
|
54,437 | 0 | ||||||
|
Related party notes payable-
|
||||||||
|
James Gingo Promissory Note
|
2,300,000 | 0 | ||||||
|
Bradley Sparks
|
50,750 | 50,750 | ||||||
|
Lynn Felsinger
|
82,000 | 82,000 | ||||||
|
Ron Erickson and affiliated parties
|
58,952 | 24,322 | ||||||
|
Total debt
|
3,189,473 | 157,072 | ||||||
|
Less current portion of long term debt
|
(1,513,495 | ) | - | |||||
|
Long term debt
|
$ | 1,675,978 | $ | 157,072 | ||||
BFI Finance Corp Secured Credit Facility
On December 9, 2008 TransTech entered into a $1,000,000 secured credit facility with BFI Finance Corp to fund its operations. The rate is prime interest + 2.5%, with a floor for prime interest of 5.5%. On June 12, 2010, the secured credit facility was renewed for 6 months, with a floor for Prime of 4.5%. The eligible borrowing is based on 80% of eligible trade accounts receivable, not to exceed $700,000, and 35% of Inventory value, not to exceed $300,000, for a total cap of $1,000,000. As of September 30, 2010, the outstanding balance under this facility was $643,334. The secured credit facility is guaranteed by James Gingo, the President of TransTech.
Capitalized Leases
TransTech has capitalized leases for equipment. The leases have a remaining lease term of 5-60 months. The aggregate future minimum lease payments under capital leases, to the extent the leases have early cancellation options and excluding escalation charges, are as follows:
F-13
|
Years Ended Septermber 30,
|
Total
|
VSUL
|
TTS
|
|||||||||
|
2011
|
$ | 28,459 | $ | - | $ | 28,459 | ||||||
|
2012
|
16,634 | 0 | 16,634 | |||||||||
|
2013
|
13,928 | 0 | 13,928 | |||||||||
|
2014
|
3,806 | 0 | 3,806 | |||||||||
|
2015
|
2,760 | 0 | 2,760 | |||||||||
|
Total
|
65,587 | 0 | 65,587 | |||||||||
|
Less current portion of capitalized leases
|
(11,150 | ) | 0 | (11,150 | ) | |||||||
|
Long term capital leases
|
$ | 54,437 | $ | - | $ | 54,437 | ||||||
The imputed interest rate in the capitalized leases is approximately 10.5%.
Related Party Notes Payable
The Company acquired its 100% interest in TransTech by issuing a Promissory Note (“Note”) to James Gingo, the President of TransTech, in the amount of $2,300,000, plus interest at the rate of three and one-half percent (3.5%) per annum from the date of the Note. The Note is secured by a security interest in the stock and assets of TransTech, and is payable over a period of three (3) years as follows:
(i) The sum of $650,000, the amount of any accrued interest due on the Bonderson debt of $600,000 owed by James Gingo to the Bonderson Family Living Trust (“Bonderson Debt”) and interest on the unpaid balance, shall be paid to Seller on the earlier of: (A) the one (1) year anniversary of the closing date; or (B) on the closing of $2,500,000 or more in aggregate financing (whether debt, equity or some combination thereof) after the closing date.
(ii) The sum of $650,000, the amount of any accrued interest due on the Bonderson debt owed by James Gingo and interest on the unpaid balance shall be paid to Seller on the earlier of: (A) the two (2) year anniversary of the closing date; or (B) on the closing of $5,000,000 or more in aggregate financing (whether debt, equity or some combination thereof) after the closing date; and
(iii) The remaining balance of the Note and interest thereon shall be paid to Seller on the earlier of: (A) the three year anniversary of the closing date; or (B) on the closing of $7,500,000 or more in aggregate financing (whether debt, equity or some combination thereof) after the closing date.
In February 2007, the Company entered into a demand note with former CEO and President, Bradley E. Sparks totaling $50,000 plus loan fees of $750. As of September 30, 2010, the outstanding note payable totaled $50,750 consisting of the note payable to Sparks. Interest expense accrues on the note at a rate of 18% per annum. Accrued interest on the notes payable is recorded in the balance sheet in accrued expenses and other liabilities.
Any delays in repayment of the principal and accrued interest on the note payable upon demand result in a penalty interest rate of 30% per annum. The interest due to Mr. Sparks became in arrears on February 16, 2008 and has not been paid as of the date of this filing. Mr. Sparks has not demanded repayment of the note as of the date of this filing.
On April 30, 2009, accounts payable owed to Lynn Felsinger, a consultant, totaling $82,000 was converted into a demand note. Ms. Felsinger has not demanded repayment of the note as of the date of this filing.
Mr. Ronald Erickson, our Chief Executive Officer, converted outstanding debt with accrued interest in the amount of $152,971 into 1,019,806 shares of common stock of the Company valued at $0.15 per share on March 27, 2009. In addition, an affiliate of Mr. Erickson’s, Juliz I Limited Partnership, loaned the Company operating funds during fiscal 2009. The balance outstanding at September 30, 2010 is $34,630 plus interest of $4,858. Additionally, Mr. Erickson incurred expenses on behalf of the Company for a total of $24,322 during the 2009 fiscal year. This balance was converted into a loan as of September 30, 2009 which bears interest at 8%. Accrued interest was $1,945 as of September 30, 2010.
Aggregate maturities for notes payable, capitalized leases and long term debt by year are as follows:
F-14
|
Years Ended September 30,
|
Total
|
|||
|
2011
|
$ | 1,513,495 | ||
|
2012
|
658,968 | |||
|
2013
|
1,011,560 | |||
|
2014
|
3,159 | |||
|
2015
|
2,291 | |||
|
Total
|
$ | 3,189,473 | ||
|
13.
|
EQUITY
|
During the quarter ended December 31, 2009, the company issued 300,000 shares of common stock as grants to directors, 100,000 shares of common stock as grants to a consultant, and 300,000 shares to RATLab.
On May 10, 2010, the Board of Directors issued to Mark Scott, our Chief Financial Officer, 1,000,000 shares of restricted common stock to be granted upon signing at the closing bid price of $.02 per share on May 7, 2010.
On May 10, 2010, the Board of Directors issued to Ron Erickson or his designee the issuance of two Million (2,000,000) shares of restricted common stock of the Company and the grant of options to purchase three million (3,000,000) shares at $0.15 per share. The restricted common stock was issued at the closing bid price of $.02 per share on May 7, 2010. The grant of options vests quarterly over two years and expires on May 6, 2020. This common stock issuance and the grant of options replace the 5,000,000 unissued shares previously approved by the Board of Directors on December 21, 2009.
On May 18, 2010, the Board of Directors issued 600,000 shares of restricted common stock of the Company to four (4) consultants and suppliers for the conversion of liabilities or for services. The parties valued the shares in this transaction at $0.02 per share, the closing bid price of the Company’s common stock during negotiations.
On June 1, 2010, the Board of Directors issued 666,667 shares of restricted common stock of the Company to a service provider for the conversion of $100,000 in liabilities at $.15 per share.
On June 8, 2010, the Board of Directors issued 3,000,000, 100,000 and 100,000 of restricted common stock of the Company to James Gingo, Jeff Kruse and Steve Waddle, executives of TransTech, respectively. The parties valued the shares in this transaction at $0.02 per share, the closing bid price of the Company’s common stock during negotiations.
On June 8, 2010, the Board of Directors issued 600,000 shares of restricted common stock of the Company to Paul Bonderson, a TransTech investor. The parties valued the shares in this transaction at $0.02 per share, the closing bid price of the Company’s common stock during negotiations.
On June 8, 2010, the Board of Directors issued 300,000 shares of restricted common stock of the Company to David Markowski for consulting services. The parties valued the shares in this transaction at $0.02 per share, the closing bid price of the Company’s common stock during negotiations.
On June 11, 2010, the Company issued a warrant for the purchase of 300,000 shares of common stock of the Company to the Sterling Fund for advisory services. The warrant was valued at $.02 per share using the Black-Scholes-Merton option valuation model. The warrant expires June 10, 2013 and is callable if registered and with five closing trading prices of the Company’s common stock over $.50 per share.
|
14.
|
STOCK OPTIONS
|
Description of Stock Option Plan
In 2005, our Board of Directors adopted a combined incentive and nonqualified stock option plan for employees, consultants, suppliers and directors (“2005 Stock Option Plan”). On October 9, 2006 the Board of Directors authorized an increase in shares available for grant from 2 million to 4 million, subject to stockholder approval. The 2005 Stock Option Plan has never been approved by the shareholders and stock option grants are considered non-statutory.
Determining Fair Value Under ASC 505
The Company records compensation expense associated with stock options and other equity-based compensation using the Black-Scholes-Merton option valuation model for estimating fair value of stock options granted under our plan. The Company amortizes the fair value of stock options on a ratable basis over the requisite service periods, which are generally the vesting periods. The expected life of awards granted represents the period of time that they are expected to be outstanding. The Company estimates the volatility of our common stock based on the historical volatility of its own common stock over the most recent period corresponding with the estimated expected life of the award. The Company bases the risk-free interest rate used in the Black-Scholes-Merton option valuation model on the implied yield currently available on U.S. Treasury zero-coupon issues with an equivalent remaining term equal to the expected life of the award. The Company has not paid any cash dividends on our common stock and do not anticipate paying any cash dividends in the foreseeable future. Consequently, the Company uses an expected dividend yield of zero in the Black-Scholes-Merton option valuation model and adjust share-based compensation for changes to the estimate of expected equity award forfeitures based on actual forfeiture experience. The effect of adjusting the forfeiture rate is recognized in the period the forfeiture estimate is changed.
F-15
Stock Option Activity
On May 10, 2010, the Board of Directors authorized to Ron Erickson or his designee the grant of non-qualified options to purchase 3,000,000 shares of the Company’s common stock at $0.15 per share. The non- qualified stock option grant vests quarterly over two (2) years and expires in ten (10) years.
On June 8, 2010, the Board of Directors granted Mr. Kruse and Mr. Waddle, executives at TransTech, options to purchase 300,000 and 200,000 shares, respectively, of the Company’s common stock. The awards were granted at the price of $0.09 per share, the bid price on the date the TransTech acquisition documents were approved. In accordance with the 2005 Stock Option Plan, the stock option grants vest quarterly over three (3) years and expire in ten (10) years.
On September 21, 2010, Peter Ettinger forfeited a stock option grant for 75,000 shares of the Company’s common stock.
There are currently 4,735,000 options to purchase common stock at $.288 per share outstanding at September 30, 2010 under the 2005 Stock Option Plan. The Company recorded $152,053 and $139,787 of compensation expense, net of related tax effects, relative to stock options for the year ended September 30, 2010 and 2009 in accordance with ASC 505. Net loss per share (basic and diluted) associated with this expense was approximately ($0.00). As of September, 2010, there is approximately $287,472 of total unrecognized costs related to employee granted stock options that are not vested. These costs are expected to be recognized over a period of approximately three years.
Stock option activity, for options granted under the 2005 Stock Option Plan, for the years ended September 30, 2010, 2009 and 2008 are summarized as follows:
|
Weighted Average
|
||||||||||||
|
Options
|
Exercise Price
|
$ | ||||||||||
|
Outstanding as of September 30, 2007
|
1,897,500 | $ | 0.634 | 1,203,625 | ||||||||
|
Granted
|
- | - | - | |||||||||
|
Exercised
|
- | - | - | |||||||||
|
Forfeitures
|
(412,500 | ) | 0.750 | (309,375 | ) | |||||||
|
Outstanding as of September 30, 2008
|
1,485,000 | 0.602 | 894,250 | |||||||||
|
Granted
|
75,000 | 0.150 | 11,250 | |||||||||
|
Exercised
|
- | - | - | |||||||||
|
Forfeitures
|
(250,000 | ) | 0.100 | (25,000 | ) | |||||||
|
Outstanding as of September 30, 2009
|
1,310,000 | 0.672 | 880,500 | |||||||||
|
Granted
|
3,500,000 | 0.141 | 495,000 | |||||||||
|
Exercised
|
- | - | - | |||||||||
|
Forfeitures
|
(75,000 | ) | (0.150 | ) | (11,250 | ) | ||||||
|
Outstanding as of September 30, 2010
|
4,735,000 | $ | 0.288 | 1,364,250 | ||||||||
The following table summarizes information about stock options outstanding and exercisable at September 30, 2010:
|
Range of
Exercise
Prices
|
Number
Outstanding
|
Weighted Average
Remaining Life
in Years
|
Weighted Average Exercise Price
|
Number Exercisable
|
Weighted Average Exercise Price Exercisable
|
||||||
|
$0.09
|
500,000
|
4.69
|
years
|
$0.09
|
0
|
$0.09
|
|||||
|
$0.15
|
3,000,000
|
9.61
|
years
|
$0.15
|
375,000
|
$0.15
|
|||||
|
$0.18
|
100,000
|
1.97
|
years
|
$0.18
|
80,000
|
$0.18
|
|||||
|
$0.75
|
1,135,000
|
1.06
|
years
|
$0.75
|
1,135,000
|
$0.75
|
|||||
|
4,735,000
|
6.88
|
years
|
$0.29
|
1,590,000
|
$0.58
|
||||||
F-16
There is no aggregate intrinsic value of the exercisable options as of September 30, 2010.
|
15.
|
OTHER SIGNIFICANT TRANSACTIONS WITH RELATED PARTIES
|
See Note 12 for discussion of notes payable issued to the Company’s former CEO and President during the quarter ended March 31, 2007. Other than the note payable, related interest and payroll related accrued liabilities, all amounts are recorded in the related party accounts payable balance.
Mr. Sparks is owed $721,333 of accrued salary plus $63,134 which has been accrued to pay applicable payroll taxes, FUTA, etc. Additionally, interest of $33,011 is owed Mr. Sparks for the note payable described in Note 11 to these Notes to Financial Statements. Mr. Sparks is also owed $28,793 for cash amounts advanced by him to Visualant to fund operating expenses since his employment.
Mr. Erickson is owed $2,270 for expenses on behalf of the Company totaling an additional $14,310. Such expenses are recorded in accounts payable from related parties. Mr. Erickson became CEO and President on November 12, 2009.
Dr. Kawahata, one of the Company’s directors, is owed $90,681 by the Visualant for services rendered to the Company.
|
16.
|
COMMITMENTS, CONTINGENCIES AND LEGAL PROCEEDINGS
|
LEGAL PROCEEDINGS
There are no pending legal proceedings against the Company that are expected to have a material adverse effect on its cash flows, financial condition or results of operations.
EMPLOYMENT AGREEMENTS
Agreement with Mark Scott
On May 10, 2010, the Board of Directors approved the appointment of Mr. Scott as Chief Financial Officer based on the (i) cash compensation of $2,000 per month until cash is available at which time cash compensation shall be increased to $8,000 per month; (ii) bonus cash compensation; shall be at the discretion of the senior executive and the board of directors; (iii) benefits after the closing of funding at discretion of Mr. Scott and equivalent to other employees in the company; and (iv) 1,000,000 shares of restricted common stock to be granted upon signing at the closing bid price of $.02 per share on May 7, 2010.
Agreement with James Gingo
On June 8, 2010, the Company entered into an Employment Agreement (“Gingo Agreement”) with Mr. James Gingo, Founder and President of TransTech. The Gingo Agreement has a three year term beginning on June 8, 2010 at the annual base salary of $200,000 per year. The Gingo Agreement provides for participation in the Company’s benefit programs available to other employees (including group insurance arrangements). Also under the Gingo Agreement, Mr. Gingo is eligible for discretionary performance bonuses based upon performance criteria to be determined by the Company’s Compensation Committee based on criteria under development up to 50% of his annual salary. If Mr. Gingo’s employment is terminated without Cause (as defined in the Gingo Agreement), Mr. Gingo will be entitled to a payment equal to one year’s annual base salary paid over the next year.
LEASES
The Company is obligated under various non-cancelable operating leases for their various facilities and certain equipment.
TransTech leases a total of approximately 9,750 square feet of office and warehouse space for its administrative offices, product inventory and shipping operations, at a monthly rental of $4,292. The lease was extended from March 2011 for an additional five year term at a monthly rental of $4,721. There are two additional five year renewals with a set accelerating increase of 10% per 5 year term. TransTech also leases additional 500 square feet of off-site space at $250 per month from a related party.
The aggregate future minimum lease payments under operating leases, to the extent the leases have early cancellation options and excluding escalation charges, are as follows:
F-17
|
Years Ended September 30,
|
Total
|
VSUL
|
TTS
|
|||||||||
|
2011
|
$ | 54,508 | $ | - | $ | 54,508 | ||||||
|
2012
|
56,654 | 0 | 56,654 | |||||||||
|
2013
|
56,654 | 0 | 56,654 | |||||||||
|
2014
|
56,654 | 0 | 56,654 | |||||||||
|
2015
|
56,654 | 0 | 56,654 | |||||||||
|
Beyond
|
23,606 | 0 | 23,606 | |||||||||
|
Total
|
$ | 304,730 | $ | - | $ | 304,730 | ||||||
|
17.
|
SUBSEQUENT EVENTS
|
The Company evaluated subsequent events, for the purpose of adjustment or disclosure, up through December 28, 2010, the date the financial statements were issued.
On December 23, 2010, the Company entered into a Securities Purchase Agreement (“Agreement”) with Seaside pursuant to which Seaside agreed to purchase restricted shares of the Company’s common stock from time to time over a 12-month period, provided that certain conditions are met.
Under the terms of the Agreement, the Company has the right to sell and issue to Seaside restricted shares of the Company’s common stock over a 12-month period commencing on the closing date. Visualant will be entitled to sell shares each month during the following 12 months, subject to certain conditions and limitations. With respect to each subsequent closing, Visualant will not be obligated to sell any of its common stock to Seaside at a price lower than $0.25 per share, and Seaside’s beneficial ownership of the Company’s common stock will not exceed 4.99%. Seaside is not permitted to short sale the Company’s common stock.
Visualant has agreed to pay Seaside’s legal fees and expenses in the amount of $25,000 for the initial closing, and $2,500 for each subsequent closing. Visualant also has agreed to pay 7.0% in finder’s fees (to be paid in connection with each draw down) and issue 10,113 common stock warrants exercisable at $0.21395 per share.
The Agreement may be terminated by Seaside (i) upon written notice to the Company if the initial closing has not been consummated on or before December 31, 2010; or (ii) upon written notice to the Company, if at any time prior to the final subsequent closing the Company consummates a financing to which Seaside is not a party.
The Agreement also contains certain representations and warranties of Visualant and Seaside, including customary investment-related representations provided by Seaside, as well as acknowledgements by Seaside that it has reviewed certain disclosures of the Company (including the periodic reports that the Company has filed with the SEC) and that the Company’s issuance of the shares has not been registered with the SEC or qualified under any state securities laws. Visualant provided customary representations regarding, among other things, its organization, capital structure, subsidiaries, disclosure reports, absence of certain legal or governmental proceedings, financial statements, tax matters, insurance matters, real property and other assets, and compliance with applicable laws and regulations. Seaside’s representations and warranties are qualified in their entirety (to the extent applicable) by the Company’s disclosures in the reports it files with the SEC. Visualant also delivered confidential disclosure schedules qualifying certain of its representations and warranties in connection with executing and delivering the Agreement.
The above description of the Securities Purchase Agreement is intended only as a summary of such agreement. The full agreement will be filed as an exhibit to Visualant’s Form 10-Q for the quarter ended on December 31, 2010.
F-18
REPORT ON MANAGEMENT'S ASSESSMENT OF INTERNAL CONTROL OVER FINANCIAL REPORTING
Management assessed the corporation's system of internal control over financial reporting as of September 30, 2010, in relation to criteria for effective internal control over financial reporting as described in "Internal Control--Integrated Framework," issued by the Committee of Sponsoring Organizations of the Treadway Commission. Based on this assessment, management concludes that, as of September 30, 2010, its system of internal control over financial reporting is effective based on the criteria of the "Internal Control--Integrated Framework".
|
/s/ Ronald Erickson
|
/s/ Mark Scott
|
|
Ronald P. Erickson
|
Mark Scott
|
|
Chief Executive Officer
|
Chief Financial Officer
|
Seattle, WA
December 30, 2010
21
SIGNATURES
Pursuant to the requirements of Section 13 or 15(d) of the Securities Exchange Act of 1934, Visualant, Inc. (the "Registrant") has duly caused this report to be signed on its behalf by the undersigned, thereunto duly authorized.
|
VISUALANT, INC.
|
||
|
Date: December 30, 2010
|
By:
|
/s/ Ronald Erickson
|
|
Ronald P. Erickson
|
||
|
Chief Executive Officer and Director
(Principal Executive Officer)
|
||
|
By:
|
/s/ Mark Scott
|
|
|
Mark Scott
|
||
|
Chief Financial Officer and Secretary
( Principal Financial and Accounting Officer)
|
||
Pursuant to the requirements of the Securities Exchange Act of 1934, this report has been signed below by the following persons on behalf of the Registrant and in the capacities and on the dates indicated:
|
SIGNATURES
|
TITLE
|
DATE
|
|
/s/ Ronald Erickson
|
Chief Executive Officer and Director
|
December 30, 2010
|
|
Ronald P. Erickson
|
(Principal Executive Officer)
|
|
|
/s/ Mark Scott
|
Chief Financial Officer and Secretary
|
December 30, 2010
|
|
Mark Scott
|
(Principal Financial/Accounting Officer)
|
|
|
/s/ Yoshitami Arai
|
Independent Director
|
December 30, 2010
|
|
Yoshitami Arai
|
||
|
/s/ Paul Bonderson
|
Independent Director
|
December 30, 2010
|
|
Paul Bonderson
|
||
|
/s/ James Gingo
|
Independent Director
|
December 30, 2010
|
|
James Gingo
|
||
|
/s/ Marco Hegyi
|
Independent Director
|
December 30, 2010
|
|
Marco Hegyi
|
|
|
|
/s/ Dr. Masahiro Kawahata
|
Independent Director
|
December 30, 2010
|
|
Dr. Masahiro Kawahata
|
||
|
/s/ Jon Pepper
|
Independent Director
|
December 30, 2010
|
|
Jon Pepper
|
||
|
/s/ Brad Sparks
|
Director
|
December 30, 2010
|
|
Brad Sparks
|
||
22