Attached files
| file | filename |
|---|---|
| EX-32.1 - EXHIBIT 32.1 - Cardinal Ethanol LLC | c10196exv32w1.htm |
| EX-31.2 - EXHIBIT 31.2 - Cardinal Ethanol LLC | c10196exv31w2.htm |
| EX-31.1 - EXHIBIT 31.1 - Cardinal Ethanol LLC | c10196exv31w1.htm |
| EX-10.31 - EXHIBIT 10.31 - Cardinal Ethanol LLC | c10196exv10w31.htm |
| EX-10.30 - EXHIBIT 10.30 - Cardinal Ethanol LLC | c10196exv10w30.htm |
| EX-32.2 - EXHIBIT 32.2 - Cardinal Ethanol LLC | c10196exv32w2.htm |
Table of Contents
UNITED STATES
SECURITIES AND EXCHANGE COMMISSION
SECURITIES AND EXCHANGE COMMISSION
Washington, D.C. 20549
FORM 10-K
| þ | Annual report under Section 13 or 15(d) of the Securities Exchange Act of 1934. |
For the fiscal year ended September 30, 2010
| o | Transition report under Section 13 or 15(d) of the Exchange Act. |
For the transition period from to
Commission file number 000-53036
CARDINAL ETHANOL, LLC
(Name of small business issuer in its charter)
| Indiana | 20-2327916 | |
| (State or other jurisdiction of | (I.R.S. Employer Identification No.) | |
| incorporation or organization) | ||
| 1554 N. County Road 600 E., Union City, IN | 47390 | |
| (Address of principal executive offices) | (Zip Code) |
(765) 964-3137
(Issuer’s telephone number)
(Issuer’s telephone number)
Securities registered under Section 12(b) of the Exchange Act:
None
None
Securities registered under Section 12(g) of the Exchange Act:
None
None
Indicate by check mark if the registrant is a well-known seasoned issuer, as defined in Rule 405 of
the Securities Act. o Yes þ No
Indicate by check mark if the registrant is not required to file reports pursuant to Section 13 or
Section 15(d) of the Act. o Yes þ No
Indicate by check mark whether the registrant (1) has filed all reports required to be filed by
Section 13 or 15(d) of the Exchange Act of 1934 during the preceding 12 months (or for such shorter
period that the registrant was required to file such reports), and (2) has been subject to such
filing requirements for the past 90 days. þ Yes o No
Indicate by check mark whether the registrant has submitted electronically and posted on its
corporate Web site, if any, every Interactive Data File required to be submitted and posted
pursuant to Rule 405 of Regulation S-T (§ 232.405 of this chapter) during the preceding 12 months
(or for such shorter period that the registrant was required to submit and post such files).
o Yes o No
Indicate by check mark if disclosure of delinquent filers pursuant to Item 405 of Regulation S-K is
not contained herein, and will not be contained, to the best of registrant’s knowledge, in
definitive proxy or information statements incorporated by reference in Part III of this Form 10-K
or any amendment to this Form 10-K. þ
Indicate by check mark whether the registrant is a large accelerated filer, an accelerated filer, a
non-accelerated filer, or a smaller reporting company. See the definitions of “large accelerated
filer,” “accelerated filer” and “smaller reporting company” in rule 12b-2 of the Exchange Act.
(Check one):
| Large accelerated filer o | Accelerated filer o | Non-accelerated filer þ (Do not check if a smaller reporting company) |
Smaller Reporting Company o |
Indicate by check mark whether the registrant is a shell company (as defined in Rule 12b-2 of the
Exchange Act). o Yes þ No
As of March 31, 2010, the aggregate market value of the membership units held by non-affiliates
(computed by reference to the most recent offering price of such membership units) was $55,335,000.
As of December 15, 2010, there were 14,606 membership units outstanding.
DOCUMENTS INCORPORATED BY REFERENCE
The information required in Part III of this Annual Report is incorporated herein by reference to
the Company’s definitive proxy statement to be filed with the Securities and Exchange Commission
within 120 days of the close of the fiscal year ended September 30, 2010.
Table of Contents
| 4 | ||||||||
| 4 | ||||||||
| 14 | ||||||||
| 20 | ||||||||
| 20 | ||||||||
| 20 | ||||||||
| 20 | ||||||||
| 20 | ||||||||
| 23 | ||||||||
| 24 | ||||||||
| 34 | ||||||||
| F-1 | ||||||||
| 36 | ||||||||
| 36 | ||||||||
| 37 | ||||||||
| 37 | ||||||||
| 37 | ||||||||
| 37 | ||||||||
| 37 | ||||||||
| 37 | ||||||||
| 38 | ||||||||
| 38 | ||||||||
| 41 | ||||||||
| Exhibit 10.30 | ||||||||
| Exhibit 10.31 | ||||||||
| Exhibit 31.1 | ||||||||
| Exhibit 31.2 | ||||||||
| Exhibit 32.1 | ||||||||
| Exhibit 32.2 | ||||||||
2
Table of Contents
CAUTIONARY STATEMENTS REGARDING FORWARD-LOOKING STATEMENTS
This annual report contains historical information, as well as forward-looking statements that
involve known and unknown risks and relate to future events, our future financial performance, or
our expected future operations and actions. In some cases, you can identify forward-looking
statements by terminology such as “may,” “will,” “should,” “expect,” “plan,” “anticipate,”
“believe,” “estimate,” “future,” “intend,” “could,” “hope,” “predict,” “target,” “potential,” or
“continue” or the negative of these terms or other similar expressions. These forward-looking
statements are only our predictions based upon current information and involve numerous
assumptions, risks and uncertainties. Our actual results or actions may differ materially from
these forward-looking statements for many reasons, including the reasons described in this report.
While it is impossible to identify all such factors, factors that could cause actual results to
differ materially from those estimated by us include:
| • | Changes in the availability and price of corn and natural gas; |
|
| • | Our inability to secure credit we may require to continue our operations; |
|
| • | Negative impacts that our hedging activities may have on our operations; |
|
| • | Decreases in the market prices of ethanol and distiller’s grains; |
|
| • | Ethanol supply exceeding demand; and corresponding ethanol price reductions; |
|
| • | Changes in the environmental regulations that apply to our plant operations; |
|
| • | Changes in our business strategy, capital improvements or development plans; |
|
| • | Changes in plant production capacity or technical difficulties in operating the plant; |
|
| • | Changes in general economic conditions or the occurrence of certain events causing an economic impact
in the agriculture, oil or automobile industries; |
|
| • | Lack of transport, storage and blending infrastructure preventing ethanol from reaching high demand
markets; |
|
| • | Changes in federal and/or state laws (including the elimination of any federal and/or state ethanol
tax incentives); |
|
| • | Changes and advances in ethanol production technology; |
|
| • | Additional ethanol plants built in close proximity to our ethanol facility; |
|
| • | Competition from alternative fuel additives; |
|
| • | Changes in interest rates and lending conditions; |
|
| • | Our ability to generate free cash flow to invest in our business and service our debt; |
|
| • | Our ability to retain key employees and maintain labor relations; |
|
| • | Volatile commodity and financial markets; |
|
| • | Changes in legislation including the Renewable Fuels Standard and VEETC; |
|
| • | Our ability to satisfy the financial covenants contained in our credit agreements with our lender; and |
|
| • | The reduction or expiration of VEETC and reduction or elimination of the tariff on foreign ethanol. |
3
Table of Contents
The cautionary statements referred to in this section also should be considered in connection
with any subsequent written or oral forward-looking statements that may be issued by us or persons
acting on our behalf. We undertake no duty to update these forward-looking statements, even though our situation may
change in the future. Furthermore, we cannot guarantee future results, events, levels of activity,
performance, or achievements. We caution you not to put undue reliance on any forward-looking
statements, which speak only as of the date of this report. You should read this report and the
documents that we reference in this report and have filed as exhibits, completely and with the
understanding that our actual future results may be materially different from what we currently
expect. We qualify all of our forward-looking statements by these cautionary statements.
AVAILABLE INFORMATION
Information about us is also available at our website at www.cardinalethanol.com, under “SEC
Filings” which includes links to the reports we have filed with the Securities and Exchange
Commission. The contents of our website are not incorporated by reference in this Annual Report on
Form 10-K.
PART I
| ITEM 1. | BUSINESS. |
Business Development
Cardinal Ethanol, LLC is an Indiana limited liability company organized on February 7, 2005,
for the purpose of raising capital to develop, construct, own and operate a 100 million gallon per
year ethanol plant in east central Indiana near Union City, Indiana. References to “we,” “us,”
“our,” “Cardinal” and the “Company” refer to Cardinal Ethanol, LLC. Since November 1, 2008, we
have been engaged in the production of ethanol, distiller’s grains and corn oil at the plant.
In August 2010, we obtained a new Title V air permit allowing us to increase our ethanol
production to 140 million gallons compared to 110 million gallons under our previous permit. Since
obtaining the new permit, we have been steadily increasing production to a level between 112
million gallons and 118 million gallons. We expect we will continue to produce at this level
through the end of the calendar year.
Financial Information
Please refer to “Item 7 — Management’s Discussion and Analysis of Financial Condition and
Results of Operations” for information about our revenue, profit and loss measurements and total
assets and liabilities and “Item 8 — Financial Statements and Supplementary Data” for our financial
statements and supplementary data.
Principal Products and Markets
The principal products we are producing at the plant are fuel-grade ethanol and distillers
grains. In addition, we are extracting corn oil for sale. Raw carbon dioxide gas is another
co-product of the ethanol production process. We have entered into an agreement with EPCO Carbon
Dioxide Products to capture the raw carbon dioxide we produce at the plant.
Ethanol
Our primary product is ethanol. Ethanol is ethyl alcohol, a fuel component made primarily
from corn and various other grains. According to the Renewable Fuels Association, approximately 85
percent of ethanol in the United States today is produced from corn, and approximately 90 percent
of ethanol is produced from a corn and other input mix. The ethanol we produce is manufactured from
corn. Although the ethanol industry continues to explore production technologies employing various
feedstocks, such as biomass, corn-based production technologies remain the most practical and
provide the lowest operating risks. Corn produces large quantities of carbohydrates, which convert
into glucose more easily than most other kinds of biomass. The Renewable Fuels Association
estimates current domestic ethanol production at approximately 13.2 billion gallons as of November
11, 2010.
An ethanol plant is essentially a fermentation plant. Ground corn and water are mixed with
enzymes and yeast to produce a substance called “beer,” which contains about 10% alcohol and 90%
water. The “beer” is boiled
to separate the water, resulting in ethyl alcohol, which is then dehydrated to increase the
alcohol content. This product is then mixed with a certified denaturant to make the product unfit
for human consumption and commercially saleable.
4
Table of Contents
Ethanol can be used as: (i) an octane enhancer in fuels; (ii) an oxygenated fuel additive for
the purpose of reducing ozone and carbon monoxide emissions; and (iii) a non-petroleum-based
gasoline substitute. Approximately 95% of all ethanol is used in its primary form for blending
with unleaded gasoline and other fuel products. Used as a fuel oxygenate, ethanol provides a means
to control carbon monoxide emissions in large metropolitan areas. The principal purchasers of
ethanol are generally the wholesale gasoline marketer or blender. The principal markets for our
ethanol are petroleum terminals in the northeastern United States.
Approximately 85% of our revenue was derived from the sale of ethanol during our fiscal year
ended September 30, 2010.
Distillers Grains
The principal co-product of the ethanol production process is distillers grains, a high
protein, high-energy animal feed supplement primarily marketed to the dairy, beef, poultry and
swine industries. Distillers grains contain by-pass protein that is superior to other protein
supplements such as cottonseed meal and soybean meal. By-pass proteins are more digestible to the
animal, thus generating greater lactation in milk cows and greater weight gain in beef cattle. Dry
mill ethanol processing creates three forms of distiller grains: Distillers Wet Grains with
Solubles (“DWS”), Distillers Modified Wet Grains with Solubles (“DMWS”) and Distillers Dried Grains
with Solubles (“DDGS”). DWS is processed corn mash that contains approximately 70% moisture. DWS
has a shelf life of approximately three days and can be sold only to farms within the immediate
vicinity of an ethanol plant. DMWS is DWS that has been dried to approximately 50% moisture. DMWS
have a slightly longer shelf life of approximately ten days and are often sold to nearby markets.
DDGS is DWS that has been dried to 10% to 12% moisture. DDGS has an almost indefinite shelf life
and may be sold and shipped to any market regardless of its vicinity to an ethanol plant.
Approximately 14% of our revenue was derived from the sale of distiller’s grains during our
fiscal year ended September 30, 2010.
Corn Oil
In November 2008, we began separating some of the corn oil contained in our distiller’s grains
for sale. Corn oil sales represented less than 1% of our revenues for our 2010 fiscal year. We
anticipate continuing to fine tune the operation of our corn oil extraction equipment and we expect
that it will operate more efficiently in the future. The corn oil that we produce is not food
grade corn oil and therefore cannot be used for human consumption without further refining.
However, corn oil can be used as the feedstock to produce biodiesel and has other industrial uses.
Carbon Dioxide
We entered into an Agreement with EPCO Carbon Dioxide Products, Inc. (“EPCO”) under
which EPCO purchases the carbon dioxide gas produced at our plant. In addition, we entered into a
Site Lease Agreement with EPCO under which EPCO leases a portion of our property, on which it is
operating a carbon dioxide liquefaction plant. We supply to EPCO, at the liquefaction plant,
carbon dioxide gas meeting certain specifications and at a rate sufficient for EPCO to produce 6.25
tons of liquid carbon dioxide per hour. EPCO pays Cardinal a contractual price per ton of liquid
carbon dioxide shipped out of the liquefaction plant by EPCO. The contract rate varies based on
volume thresholds.
Ethanol and Distillers Grains Markets
As described below in “Distribution of Principal Products,” we market and distribute our
ethanol and distillers grains through third parties. Our ethanol and distillers grains marketers
make all decisions, in consultation with management, with regard to where our products are
marketed. Our ethanol and distillers grains are predominately sold in the domestic market.
Specifically, we ship a substantial portion of the ethanol we produce to
the New York harbor. However, as domestic production of ethanol, distillers grains and corn
oil continue to expand, we anticipate increased international sales of our products. Currently,
the United States ethanol industry exports a significant amount of distillers grains to Mexico,
Canada and China. Management anticipates that demand for distillers grains in the Asian market may
continue to increase in the future as distillers grains are used in animal feeding operations in
China. During our fourth quarter of 2010, the ethanol industry experienced increased ethanol
exports to Europe. These ethanol exports benefited ethanol prices in the United States. We
anticipate that ethanol exports will remain steady.
5
Table of Contents
We expect our ethanol and distillers grains marketers to explore all markets for our products,
including export markets. However, due to high transportation costs, and the fact that we are not
located near a major international shipping port, we expect a majority of our products to continue
to be marketed and sold domestically.
Distribution of Principal Products
Our ethanol plant is located near Union City, Indiana in Randolph County. We selected the
site because of its location to existing ethanol consumption and accessibility to road and rail
transportation. Our site is in close proximity to rail and major highways that connect to major
population centers such as Indianapolis, Cincinnati, Columbus, Cleveland, Toledo, Detroit, New York
and Chicago.
Ethanol Distribution
We entered into an Ethanol Purchase and Sale Agreement with Murex, N.A., Ltd. (“Murex”) for
the purpose of marketing and distributing all of the ethanol we produce at the plant. The initial
term of the agreement is five years commencing on the date of first delivery of ethanol with
automatic renewal for one year terms thereafter unless otherwise terminated by either party.
During fiscal year 2009, we extended our Agreement with Murex to include an additional three years
and the commission was increased from 0.90% to 1.10% of the purchase price, net of all resale
costs, in exchange for reducing the payment terms from 20 days to 7 days after shipment. The
amended agreement allowed us to revert back to the original payment terms and commission amount.
We elected to revert back to the original terms during fiscal year 2010. The agreement may be
terminated due to the insolvency or intentional misconduct of either party or upon the default of
one of the parties as set forth in the agreement. Under the terms of the agreement, Murex markets
all of our ethanol unless we choose to sell a portion at a retail fueling station owned by us or
one of our affiliates. Murex pays to us the purchase price invoiced to the third-party purchaser
less all resale costs, taxes paid by Murex and Murex’s commission. Murex has agreed to purchase on
its own account and at market price any ethanol which it is unable to sell to a third party
purchaser. Murex has promised to use its best efforts to obtain the best purchase price available
for our ethanol. In addition, Murex has agreed to promptly notify us of any and all price
arbitrage opportunities. Under the agreement, Murex is responsible for all transportation
arrangements for the distribution of our ethanol.
Distillers Grains Distribution
We have entered into an agreement with CHS, Inc. to market all our distillers grains we
produce at the plant. CHS, Inc. is a diversified energy, grains and foods company owned by
farmers, ranchers and cooperatives. CHS, Inc. provides products and services ranging from grain
marketing to food processing to meet the needs of its customers around the world. We receive a
percentage of the selling price actually received by CHS, Inc. in marketing our distillers grains
to its customers. The initial term of our agreement with CHS, Inc. was for one year commencing as
of November 1, 2008. Thereafter, the agreement will remain in effect unless otherwise terminated
by either party with 120 days notice. Under the agreement, CHS, Inc. will be responsible for all
transportation arrangements for the distribution of our distillers grains.
New Products and Services
As discussed above, we have entered into an Agreement with EPCO Carbon Dioxide
Products, Inc. (“EPCO”) under which EPCO purchases the carbon dioxide gas produced at our plant.
We supply to EPCO, carbon dioxide gas meeting certain specifications and at a rate sufficient for
EPCO to produce 6.25 tons of liquid carbon dioxide per hour. EPCO pays us per ton of liquid carbon
dioxide shipped out of the liquefaction plant by EPCO.
6
Table of Contents
Federal Ethanol Supports and Governmental Regulation
Federal Ethanol Supports
The ethanol industry is dependent on several economic incentives to produce ethanol, including
federal tax incentives and ethanol use mandates. One significant federal ethanol support is the
Federal Renewable Fuels Standard (the “RFS”). The RFS requires that in each year, a certain amount
of renewable fuels must be used in the United States. The RFS is a national program that does not
require that any renewable fuels be used in any particular area or state, allowing refiners to use
renewable fuel blends in those areas where it is most cost-effective. The RFS requirement
increases incrementally each year until the United States is required to use 36 billion gallons of
renewable fuels by 2022. Starting in 2009, the RFS required that a portion of the RFS must be met
by certain “advanced” renewable fuels. These advanced renewable fuels include ethanol that is not
made from corn, such as cellulosic ethanol and biomass based biodiesel. The use of these advanced
renewable fuels increases each year as a percentage of the total renewable fuels required to be
used in the United States.
The RFS for 2010 was approximately 13 billion gallons, of which corn based ethanol could be
used to satisfy approximately 12 billion gallons. The RFS for 2011 is approximately 14 billion
gallons, of which corn based ethanol can be used to satisfy approximately 12.6 billion gallons.
Current ethanol production capacity exceeds the 2011 RFS requirement which can be satisfied by corn
based ethanol.
In February 2010, the EPA issued new regulations governing the RFS. These new regulations
have been called RFS2. The most controversial part of RFS2 involves what is commonly referred to
as the lifecycle analysis of green house gas emissions. Specifically, the EPA adopted rules to
determine which renewable fuels provided sufficient reductions in green house gases, compared to
conventional gasoline, to qualify under the RFS program. RFS2 establishes a tiered approach, where
regular renewable fuels are required to accomplish a 20% green house gas reduction compared to
gasoline, advanced biofuels and biomass-based biodiesel must accomplish a 50% reduction in green
house gases, and cellulosic biofuels must accomplish a 60% reduction in green house gases. Any
fuels that fail to meet this standard cannot be used by fuel blenders to satisfy their obligations
under the RFS program. The scientific method of calculating these green house gas reductions has
been a contentious issue. Many in the ethanol industry were concerned that corn based ethanol
would not meet the 20% green house gas reduction requirement based on certain parts of the
environmental impact model that many in the ethanol industry believed was scientifically suspect.
However, RFS2 as adopted by the EPA provides that corn-based ethanol from modern ethanol production
processes does meet the definition of a renewable fuel under the RFS program. Our ethanol plant
was grandfathered into the RFS due to the fact that it was constructed prior to the effective date
of the lifecycle green house gas requirement and is not required to prove compliance with the
lifecycle green house gas reductions. Many in the ethanol industry are concerned that certain
provisions of RFS2 as adopted may disproportionately benefit ethanol produced from sugarcane. This
could make sugarcane based ethanol, which is primarily produced in Brazil, more competitive in the
United States ethanol market. If this were to occur, it could reduce demand for the ethanol that
we produce.
Most ethanol that is used in the United States is sold in a blend called E10. E10 is a blend
of 10% ethanol and 90% gasoline. E10 is approved for use in all standard vehicles. Estimates
indicate that gasoline demand in the United States is approximately 135 billion gallons per year.
Assuming that all gasoline in the United States is blended at a rate of 10% ethanol and 90%
gasoline, the maximum demand for ethanol is 13.5 billion gallons per year. This is commonly
referred to as the “blending wall,” which represents a theoretical limit where more ethanol cannot
be blended into the national gasoline pool. This is a theoretical limit because it is believed
that it would not be possible to blend ethanol into every gallon of gasoline that is being used in
the United States and it discounts the possibility of additional ethanol used in higher percentage
blends such as E85 used in flex fuel vehicles. Many in the ethanol industry believe that we will
reach this blending wall in 2011, since the RFS requirement for 2011 is 14 billion gallons, much of
which will come from ethanol. The RFS requires that 36 billion gallons of renewable fuels must be
used each year by 2022, which equates to approximately 27% renewable fuels used per gallon of
gasoline sold. In order to meet the RFS mandate and expand demand for ethanol, management believes
higher percentage blends of ethanol must be utilized in standard vehicles.
7
Table of Contents
Recently, the United States Environmental Protection Agency allowed the use of E15, gasoline
which is blended at a rate of 15% ethanol and 85% gasoline, in vehicles manufactured in the model
year 2007 and later. The
EPA is expected to make a ruling on allowing E15 for use in vehicles produced in model year
2001 and later by the end of 2010. However, management believes that many gasoline retailers will
refuse to provide E15 due to the fact that not all standard vehicles will be allowed to use E15 and
due to the labeling requirements the EPA may impose. The EPA is considering instituting labeling
requirements associated with E15 which may unfairly discourage consumers from purchasing E15. As a
result, the approval of E15 may not significantly increase demand for ethanol. Two lawsuits were
filed on November 9, 2010 by representatives of the food industry and the petroleum industry
challenging the EPA’s approval of E15. It is unclear what effect these lawsuits will have on the
implementation of E15 in the United States retail gasoline market.
In addition to the RFS, the ethanol industry depends on the Volumetric Ethanol Excise Tax
Credit (“VEETC”). VEETC provides a volumetric ethanol excise tax credit of 4.5 cents per gallon of
gasoline that contains at least 10% ethanol (total credit of 45 cents per gallon of ethanol blended
which is 4.5 divided by the 10% blend). VEETC was scheduled to expire on December 31, 2010.
However, on December 20, 2010, VEETC was extended through the end of 2011. If this tax credit is
not renewed past the 2011 calendar year, it likely would have a negative impact on the price of
ethanol and demand for ethanol in the market. Further, elimination of VEETC may lead to less
discretionary blending of ethanol where gasoline blenders use ethanol to reduce the cost of blended
gasoline. However, due to the RFS, we anticipate that demand for ethanol will continue to mirror
the RFS requirement, even without the VEETC. If the RFS is reduced or eliminated, the decrease in
demand for ethanol related to the elimination of VEETC may be more substantial.
The USDA announced that it will provide financial assistance to help implement more “blender
pumps” in the United States in order to increase demand for ethanol and to help offset the cost of
introducing mid-level ethanol blends into the United States retail gasoline market. A blender pump
is a gasoline pump that can dispense a variety of different ethanol/gasoline blends. Blender pumps
typically can dispense E10, E20, E30, E40, E50 and E85. These blender pump accomplish these
different ethanol/gasoline blends by internally mixing ethanol and gasoline which are held in
separate tanks at the retail gas stations. Many in the ethanol industry believe that increased use
of blender pumps will increase demand for ethanol by allowing gasoline retailers to provide various
mid-level ethanol blends in a cost effective manner and allowing consumers with flex-fuel vehicles
to purchase more ethanol through these mid-level blends. However, blender pumps cost approximately
$25,000 each, so it may take time before they become widely available in the retail gasoline
market.
United States ethanol production is currently benefited by a 54 cent per gallon tariff imposed
on ethanol imported into the United States. However, the 54 cent per gallon tariff is set to
expire at the end of the 2011 calendar year. Elimination of the tariff could lead to the
importation of ethanol produced in other countries, especially in areas of the United States that
are easily accessible by international shipping ports. Ethanol imported from other countries may
be a less expensive alternative to domestically produced ethanol and may affect our ability to sell
our ethanol profitably.
Effect of Governmental Regulation
The government’s regulation of the environment changes constantly. We are subject to
extensive air, water and other environmental regulations and we have been required to obtain a
number of environmental permits to construct, expand and operate the plant. It is possible that
more stringent federal or state environmental rules or regulations could be adopted, which could
increase our operating costs and expenses. It also is possible that federal or state environmental
rules or regulations could be adopted that could have an adverse effect on the use of ethanol. For
example, changes in the environmental regulations regarding the required oxygen content of
automobile emissions could have an adverse effect on the ethanol industry. Plant operations are
governed by the Occupational Safety and Health Administration (“OSHA”). OSHA regulations may
change such that the costs of operating the plant may increase. Any of these regulatory factors
may result in higher costs or other adverse conditions effecting our operations, cash flows and
financial performance.
We have obtained all of the necessary permits to operate the plant. In the fiscal year ended
September 30, 2010, we incurred costs and expenses of approximately $91,000 complying with
environmental laws, including the cost of obtaining permits. Although we have been successful in
obtaining all of the permits currently required, any retroactive change in environmental
regulations, either at the federal or state level, could require us to obtain additional or new
permits or spend considerable resources in complying with such regulations.
8
Table of Contents
In late 2009, California passed a Low Carbon Fuels Standard (LCFS). The California
LCFS requires that renewable fuels used in California must accomplish certain reductions in green
house gases which is measured using a lifecycle analysis, similar to RFS2. Management believes
that this lifecycle analysis is based on unsound scientific principles that unfairly harms corn
based ethanol. Management believes that these new regulations will preclude corn based ethanol
from being used in California. California represents a significant ethanol demand market. If we
are unable to supply ethanol to California, it could significantly reduce demand for the ethanol we
produce. Currently, several lawsuits have been filed challenging the California LCFS.
Competition
We are in direct competition with numerous ethanol producers, many of whom have greater
resources than we do. Following the significant growth during 2005 and 2006, the ethanol industry
has grown at a much slower pace. As of November 11, 2010, the Renewable Fuels Association
estimates that there are 204 ethanol production facilities in the U.S. with capacity to produce
approximately 13.8 billion gallons of ethanol and another 9 plants under expansion or construction
with capacity to produce an additional 840 million gallons. However, the Renewable Fuels
Association estimates that approximately 4.7% of the ethanol production capacity in the United
States is currently idled. This is down from 2009 when the idled capacity may have been as high as
20%. Since ethanol is a commodity product, competition in the industry is predominantly based on
price. Larger ethanol producers may be able to realize economies of scale that we are unable to
realize. This could put us at a competitive disadvantage to other ethanol producers. The ethanol
industry is continuing to consolidate where a few larger ethanol producers are increasing their
production capacities and are controlling a larger portion of the United States ethanol production.
The largest ethanol producers include Archer Daniels Midland, Green Plains Renewable Energy, POET
and Valero Renewable Fuels each of which are capable of producing significantly more ethanol than
we produce.
The following table identifies the majority of the largest ethanol producers in the United
States along with their production capacities.
U.S. FUEL ETHANOL PRODUCTION CAPACITY
BY TOP PRODUCERS
Producers of Approximately 400
million gallons per year (mmgy) or more
BY TOP PRODUCERS
Producers of Approximately 400
million gallons per year (mmgy) or more
| Under Construction/ | ||||||||
| Current Capacity | Expansions | |||||||
| Company | (mmgy) | (mmgy) | ||||||
POET Biorefining |
1,629.0 | 5.0 | ||||||
Archer Daniels Midland |
1,450.0 | 275 | ||||||
Valero Renewable Fuels |
1,130.0 | |||||||
Green Plains Renewable Energy |
657.0 | |||||||
Updated: November 11, 2010
We also anticipate increased competition from renewable fuels that do not use corn as the
feedstock. Many of the current ethanol production incentives are designed to encourage the
production of renewable fuels using raw materials other than corn. One type of ethanol production
feedstock that is being explored is cellulose. Cellulose is the main component of plant cell walls
and is the most common organic compound on earth. Cellulose is found in wood chips, corn stalks,
rice, straw, amongst other common plants. Cellulosic ethanol is ethanol produced from cellulose.
Currently, cellulosic ethanol production technology is not sufficiently advanced to produce
cellulosic ethanol on a commercial scale, however, due to these new government incentives, we
anticipate that commercially viable cellulosic ethanol technology will be developed in the near
future. Several companies and researchers have commenced pilot projects to study the feasibility
of commercially producing cellulosic ethanol. If this technology can be profitably employed on a
commercial scale, it could potentially lead to ethanol that is less expensive to produce than corn
based ethanol, especially if corn prices remain high. Cellulosic ethanol may also capture more
government subsidies and assistance than corn based ethanol. This could decrease demand for
our product or result in competitive disadvantages for our ethanol production process.
9
Table of Contents
At the end of 2008, VeraSun Energy filed for Chapter 11 Bankruptcy following significant
losses it experienced on raw material derivative positions it had in place. VeraSun’s ethanol
plants were auctioned during the Chapter 11 Bankruptcy process and a significant number of these
plants were purchased by Valero Energy Corporation which is a major gasoline refining company. The
purchase by Valero Energy represents the first major oil company that has taken a stake in ethanol
production infrastructure. Further, now Valero Energy controls its own supply of ethanol that can
be used to blend at its gasoline refineries. Should other oil companies become involved in the
ethanol industry, it may be increasingly difficult for us to compete. While we believe that we are
a low cost producer of ethanol, increased competition in the ethanol industry may make it more
difficult to operate the ethanol plant profitably.
Ethanol production is also expanding internationally. Ethanol produced or processed in
certain countries in Central America and the Caribbean region is eligible for tariff reduction or
elimination on importation to the United States under a program known as the Caribbean Basin
Initiative. Some ethanol producers, including Cargill, have started taking advantage of this
situation by building dehydration plants in participating Caribbean Basin countries, which convert
ethanol into fuel-grade ethanol for shipment to the United States. Ethanol imported from Caribbean
Basin countries may be a less expensive alternative to domestically produced ethanol and may affect
our ability to sell our ethanol profitably. Further, despite the fact that there is a significant
amount of ethanol produced in the United States, ethanol produced abroad and shipped by sea may be
a more favorable alternative to supply coastal cities that are located on international shipping
ports.
Our ethanol plant also competes with producers of other gasoline additives having similar
octane and oxygenate values as ethanol. Alternative fuels, gasoline oxygenates and alternative
ethanol production methods are also continually under development. The major oil companies have
significantly greater resources than we have to market other additives, to develop alternative
products, and to influence legislation and public perception of ethanol. These companies also have
sufficient resources to begin production of ethanol should they choose to do so.
A number of automotive, industrial and power generation manufacturers are developing
alternative clean power systems using fuel cells, plug-in hybrids or clean burning gaseous fuels.
Like ethanol, the emerging fuel cell industry offers a technological option to address worldwide
energy costs, the long-term availability of petroleum reserves and environmental concerns. Fuel
cells have emerged as a potential alternative to certain existing power sources because of their
higher efficiency, reduced noise and lower emissions. Fuel cell industry participants are currently
targeting the transportation, stationary power and portable power markets in order to decrease fuel
costs, lessen dependence on crude oil and reduce harmful emissions. If the fuel cell industry
continues to expand and gain broad acceptance and becomes readily available to consumers for motor
vehicle use, we may not be able to compete effectively. This additional competition could reduce
the demand for ethanol, which would negatively impact our profitability.
Distillers Grains Competition
Ethanol plants in the Midwest produce the majority of distillers grains and primarily compete
with other ethanol producers in the production and sales of distillers grains. According to the
Renewable Fuels Association’s Ethanol Industry Outlook 2010, ethanol plants produced more than 25
million metric tons of distillers grains in 2008/2009 and will produce an estimated 29 million
metric tons in 2009/2010. The amount of distillers grains produced is expected to increase as
ethanol production increases.
10
Table of Contents
The primary consumers of distillers grains are dairy and beef cattle, according to the
Renewable Fuels Association’s Ethanol Industry Outlook 2010. In recent years, an increasing amount
of distillers grains have been used in the swine and poultry markets. Numerous feeding trials show
advantages in milk production, growth, rumen health, and palatability over other dairy cattle
feeds. With the advancement of research into the feeding rations of poultry and swine, we expect
these markets to expand and create additional demand for distillers grains; however, no assurance
can be given that these markets will in fact expand, or if they do, that we will benefit from it.
The market for distillers grains is generally confined to locations where freight costs allow it to
be competitively priced against other feed ingredients. Distillers grains compete with three other
feed formulations: corn gluten feed, dry
brewers grain and mill feeds. The primary value of these products as animal feed is their
protein content. Dry brewers grain and distillers grains have about the same protein content, and
corn gluten feed and mill feeds have slightly lower protein contents.
Sources and Availability of Raw Materials
Corn Feedstock Supply
The major raw material required for our ethanol plant to produce ethanol and distillers grain
is corn. To produce 100 million gallons of ethanol per year, our ethanol plant needs approximately
36 million bushels of corn per year, or approximately 100,000 bushels per day, as the feedstock for
its dry milling process. We primarily purchase the corn supply for our plant from local markets,
but may be required to purchase some of the corn we need from other markets and transport it to our
plant via truck or rail in the future. Traditionally, corn grown in the area of the plant site
has been fed locally to livestock or exported for feeding or processing and/or overseas export
sales.
We have entered into a Corn Feedstock Supply Agency Agreement with Bunge North America, Inc.
(Bunge). The purpose of the agreement is to set out the terms upon which Bunge has agreed to serve
as our exclusive third-party agent to procure corn to be used as feedstock at our ethanol
production facility. Pursuant to the agreement, Bunge provides two grain originators to work at
the facility to negotiate and execute contracts on our behalf and arrange the shipping and delivery
of the corn required for ethanol production. In return for providing these services, Bunge
receives an agency fee which is equal to a set monthly amount for the first two years. In the
following years, the agency fee shall be equal to an amount per bushel of corn delivered subject to
an annual minimum amount. We may also directly procure corn to be used for our feedstock. The
initial term of the agreement is for five years to automatically renew for successive three-year
periods unless properly terminated by one of the parties. The parties also each have the right to
terminate the agreement in certain circumstances, including, but not limited to, material breach
by, bankruptcy and insolvency of, or change in control of, the other party.
We are significantly dependent on the availability and price of corn. The price at which we
purchase corn will depend on prevailing market prices. There is no assurance that a shortage will
not develop, particularly if there are other ethanol plants competing for corn or an extended
drought or other production problem. We anticipate that corn prices will continue to be extremely
volatile.
We may need to truck or rail in some of our corn feedstock, which additional transporation
costs may reduce our profit margins.
On December 10, 2010, the United States Department of Agriculture (“USDA”) released its Crop
Production report, which estimated the 2010 grain corn crop at 12.54 billion bushels. The December
10, 2010 estimate of the 2010 corn crop is approximately 5% lower than the record set in 2009 of
13.2 billion bushels. Corn prices rose dramatically in July through September. The current
outlook for corn prices shows rising corn prices over the next few months. We expect continued
volatility in the price of corn, which could significantly impact our costs of goods sold.
The price and availability of corn are subject to significant fluctuations depending upon a
number of factors affecting grain commodity prices in general, including crop conditions, weather,
governmental programs and foreign purchases. Because the market price of ethanol is not directly
related to grain prices, ethanol producers are generally not able to compensate for increases in
the cost of grain feedstock through adjustments in prices charged for their ethanol. We therefore
anticipate that our plant’s profitability will be negatively impacted during periods of high grain
prices.
11
Table of Contents
In an attempt to minimize the effects of the volatility of corn costs on operating profits, we
take hedging positions in corn futures markets. Hedging means protecting the price at which we buy
corn and the price at which we will sell our products in the future. It is a way to attempt to
reduce the risk caused by price fluctuation. The effectiveness of hedging activities is dependent
upon, among other things, the cost of corn and our ability to sell sufficient amounts of ethanol
and distillers grains to utilize all of the corn subject to the futures contracts. Hedging
activities can result in costs to us because price movements in grain contracts are highly volatile
and are influenced by many factors beyond our control. These costs may be significant.
Risk Management Services
We entered into a Risk Management Agreement with John Stewart & Associates (“JS&A”) under
which JS&A provides risk management and related services pertaining to grain hedging, grain pricing
information, aid in purchase of grain, and assistance in risk management as it pertains to ethanol
and our co-products. In exchange for JS&A’s risk management services, we pay JS&A a fee of $1,500
per month. The term of the agreement is for one year and will continue on a month to month basis
thereafter. The agreement may be terminated by either party at any time upon written notice.
We have also entered into an agreement with Advance Trading to assist us with hedging corn,
ethanol and natural gas. We pay them a fee of $1,000 per month for these services. The term of
the agreement is a month to month agreement, and may be terminated by either party at any time
upon proper notice.
Utilities
We engaged U.S. Energy Services, Inc. to assist us in negotiating our utilities
contracts and provide us with on-going energy management services. U.S. Energy manages the
procurement and delivery of energy to their clients’ locations. U.S. Energy Services is an
independent, employee-owned company, with their main office in Minneapolis, Minnesota and branch
offices in Kansas City, Kansas and Omaha, Nebraska. U.S. Energy Services manages energy costs
through obtaining, organizing and tracking cost information. Their major services include supply
management, price risk management and plant site development. Their goal is to develop, implement,
and maintain a dynamic strategic plan to manage and reduce their clients’ energy costs. A large
percentage of U.S. Energy Services’ clients are ethanol plants and other renewable energy plants.
We pay U.S. Energy Services, Inc. a monthly fee of $3,500 plus pre-approved travel expenses. The
monthly fee will increase 4% per year on the anniversary date of the agreement. The agreement
continued twelve (12) months after the plant’s completion date of November 2008. The agreement is
year to year thereafter.
Natural Gas. Natural gas is also an important input commodity to our manufacturing
process. Our natural gas usage for our fiscal year ended September 30, 2010 was approximately
3,127,000 MMBTU, constituting approximately 7.9% of our total costs of goods sold. We are using
natural gas to produce process steam and to dry our distillers grain products to a moisture content
at which they can be stored for long periods of time, and can be transported greater distances, so
that we can market the product to broader livestock markets, including poultry and swine markets in
the continental United States.
On March 20, 2007, we entered into a Long-Term Transportation Service Contract for Redelivery
of Natural Gas with Ohio Valley. Under the contract, Ohio Valley receives, transports and
redelivers natural gas to us for all of our natural gas requirements up to a maximum of 100,000
therms per purchase gas day and our estimated annual natural gas requirements of 34,000,000 therms.
For all gas received for and redelivered to us by Ohio Valley, we pay a throughput rate in the
amount of $0.0138 per therm for the first five years of the contract term, and $0.0138 increased by
the compounded inflation rate as established and determined by the U.S. Consumer Price Index — All
Urban Consumers for Transportation for the following five years. In addition, we pay a service
charge for all gas received for and redelivered to us by Ohio Valley in the amount of $750 per
delivery meter per billing cycle per month for the first five years of the contract term and $750
increased by the compounded inflation rate over the initial rate as established and determined by
the U.S. Consumer Price Index — All Urban Consumers for Transportation for the following five
years. The initial term of the contract is ten years. Provided neither party terminates the
contract, the contract will automatically renew for a series of not more than three consecutive one
year periods.
12
Table of Contents
Electricity. We require a significant amount of electrical power to operate the
plant. On May 2, 2007, we entered into an agreement with Indiana Michigan Power Company to furnish
our electric energy. The initial term of the contract is 30 months from the time service is
commenced and continues thereafter unless terminated by either party with 12 months written notice.
We pay Indiana Michigan Power Company monthly pursuant to their standard rates.
Water. We require a significant supply of water. Engineering specifications show our
plant’s water requirements to be approximately 774 gallons per minute, 1.1 million gallons per day,
depending on the quality of water. We have assessed our water needs and available supply. Union
City Water Works is supplying the water necessary to operate our plant.
Much of the water used in our ethanol plant is recycled back into the process. There are,
however, certain areas of production where fresh water is needed. Those areas include boiler makeup
water and cooling tower water. Boiler makeup water is treated on-site to minimize all elements that
will harm the boiler and recycled water cannot be used for this process. Cooling tower water is
deemed non-contact water because it does not come in contact with the mash, and, therefore, can be
regenerated back into the cooling tower process. The makeup water requirements for the cooling
tower are primarily a result of evaporation. Much of the water can be recycled back into the
process, which minimizes the discharge water. This will have the long-term effect of lowering
wastewater treatment costs. Many new plants today are zero or near zero effluent discharge
facilities. Our plant design incorporates the ICM/Phoenix Bio-Methanator wastewater treatment
process resulting in a zero discharge of plant process water.
Employees
We currently have 48 full-time employees.
Research and Development
We do not conduct any research and development activities associated with the development of
new technologies for use in producing ethanol and distillers grains.
Patents, Trademarks, Licenses, Franchises and Concessions
We do not currently hold any patents, trademarks, franchises or concessions. We were granted
a license by ICM to use certain ethanol production technology necessary to operate our ethanol
plant. The cost of the license granted by ICM was included in the amount we paid to Fagen to
design and built our ethanol plant and expansion.
Seasonality of Ethanol Sales
We experience some seasonality of demand for ethanol. Since ethanol is predominantly blended
with conventional gasoline for use in automobiles, ethanol demand tends to shift in relation to
gasoline demand. As a result, we experience some seasonality of demand for ethanol in the summer
months related to increased driving. In addition, we experience some increased ethanol demand
during holiday seasons related to increased gasoline demand.
Working Capital
We primarily use our working capital for purchases of raw materials necessary to operate the
ethanol plant. Our primary source of working capital is our operations along with our short-term
revolving line of credit with our primary lender First National Bank of Omaha. At November 30,
2010, we have approximately $10,000,000 available to draw on the short-term revolving line of
credit. We currently have no outstanding borrowings under our short-term revolving line of credit.
13
Table of Contents
Dependence on One or a Few Major Customers
As discussed above, we have entered into a marketing agreement with Murex for the purpose of
marketing and distributing our ethanol and have engaged CHS, Inc. for the purpose of marketing and
distributing our distillers grains. We rely on Murex for the sale and distribution of our ethanol
and CHS, Inc. for the sale and distribution of our distillers grains. Therefore, although there
are other marketers in the industry, we are highly dependent on Murex and CHS, Inc. for the
successful marketing of our products. Any loss of Murex or CHS, Inc. as our marketing agent for
our ethanol and distillers grains respectively could have a significant negative impact on our
revenues.
Financial Information about Geographic Areas
All of our operations are domiciled in the United States. All of the products sold to our
customers for fiscal years 2010, 2009 and 2008 were produced in the United States and all of our
long-lived assets are domiciled in the United States. We have engaged third-party professional
marketers who decide where our products are marketed and we have no control over the marketing
decisions made by our third-party professional marketers. These third-party marketers may decide
to sell our products in countries other than the United States. Currently, a significant amount of
distillers grains are exported to Mexico, Canada and China and the United States ethanol industry
has recently experienced increased exports of ethanol to Europe. However, we anticipate that our
products will still primarily be marketed and sold in the United States.
| ITEM 1A. | RISK FACTORS. |
You should carefully read and consider the risks and uncertainties below and the other
information contained in this report. The risks and uncertainties described below are not the only
ones we may face. The following risks, together with additional risks and uncertainties not
currently known to us or that we currently deem immaterial could impair our financial condition and
results of operation.
Risks Relating to Our Business
If the Federal Volumetric Ethanol Excise Tax Credit (“VEETC”) expires on December 31, 2011, it
could negatively impact our profitability. The ethanol industry is benefited by VEETC which is a
federal excise tax credit of 4.5 cents per gallon of ethanol blended with gasoline at a rate of at
least 10%. This excise tax credit is now set to expire on December 31, 2011. We believe that
VEETC positively impacts the price of ethanol. On December 31, 2009, the biodiesel blenders’
credit that benefits the biodiesel industry was allowed to expire. This resulted in the biodiesel
industry significantly decreasing biodiesel production because the price of biodiesel without the
tax credit was uncompetitive with the cost of petroleum based diesel. If VEETC is allowed to
expire, it could negatively impact the price we receive for our ethanol and could negatively impact
our profitability.
We have a significant amount of debt, and our existing debt financing agreements contain, and
our future debt financing agreements may contain, restrictive covenants that limit distributions
and impose restrictions on the operation of our business. The use of debt financing makes it more
difficult for us to operate because we must make principal and interest payments on the
indebtedness and abide by covenants contained in our debt financing agreements. The level of our
debt may have important implications on our operations, including, among other things: (a) limiting
our ability to obtain additional debt or equity financing; (b) placing us at a competitive
disadvantage because we may be more leveraged than some of our competitors; (c) subjecting all or
substantially all of our assets to liens, which means that there may be no assets left for unit
holders in the event of a liquidation; and (d) limiting our ability to make business and
operational decisions regarding our business, including, among other things, limiting our ability
to pay dividends to our unit holders, make capital improvements, sell or purchase assets or engage
in transactions we deem to be appropriate and in our best interest.
Increases in the price of corn or natural gas would reduce our profitability. Our primary
source of revenue is from the sale of ethanol, distiller’s grains and corn oil. Our results of
operations and financial condition are significantly affected by the cost and supply of corn and
natural gas. Changes in the price and supply of corn and natural gas are subject to and determined
by market forces over which we have no control including weather and general economic factors.
Ethanol production requires substantial amounts of corn. Generally, higher corn prices will
produce lower profit margins and, therefore, negatively affect our financial performance. If a
period of high corn prices were to be
sustained for some time, such pricing may reduce our ability to operate profitably because of
the higher cost of operating our plant. We may not be able to offset any increase in the price of
corn by increasing the price of our products. If we cannot offset increases in the price of corn,
our financial performance may be negatively affected.
14
Table of Contents
The prices for and availability of natural gas are subject to volatile market conditions.
These market conditions often are affected by factors beyond our control such as higher prices as a
result of colder than average weather conditions or natural disasters, overall economic conditions
and foreign and domestic governmental regulations and relations. Significant disruptions in the
supply of natural gas could impair our ability to manufacture ethanol and more significantly,
distiller’s grains for our customers. Furthermore, increases in natural gas prices or changes in
our natural gas costs relative to natural gas costs paid by competitors may adversely affect our
results of operations and financial condition. We seek to minimize the risks from fluctuations in
the prices of corn and natural gas through the use of hedging instruments. However, these hedging
transactions also involve risks to our business. See “Risks Relating to Our Business — We engage
in hedging transactions which involve risks that could harm our business.” If we were to
experience relatively higher corn and natural gas costs compared to the selling prices of our
products for an extended period of time, the value of our units may be reduced.
Declines in the price of ethanol or distiller’s grain would significantly reduce our revenues.
The sales prices of ethanol and distiller’s grains can be volatile as a result of a number of
factors such as overall supply and demand, the price of gasoline and corn, levels of government
support, and the availability and price of competing products. We are dependent on a favorable
spread between the price we receive for our ethanol and distiller’s grains and the price we pay for
corn and natural gas. Any lowering of ethanol and distiller’s grains prices, especially if it is
associated with increases in corn and natural gas prices, may affect our ability to operate
profitably. We anticipate the price of ethanol and distiller’s grains to continue to be volatile
in our 2011 fiscal year as a result of the net effect of changes in the price of gasoline and corn
and increased ethanol supply offset by increased ethanol demand. Declines in the prices we receive
for our ethanol and distiller’s grains will lead to decreased revenues and may result in our
inability to operate the ethanol plant profitably for an extended period of time which could
decrease the value of our units.
We may violate the terms of our credit agreements and financial covenants which could result
in our lender demanding immediate repayment of our loans. We are currently in compliance with all
our financial covenants. Current management projections indicate that we will be in compliance
with our loan covenants. However, unforeseen circumstances may develop which could result in us
violating our loan covenants. If we violate the terms of our credit agreement, our primary lender
could deem us in default of our loans and require us to immediately repay the entire outstanding
balance of our loans. If we do not have the funds available to repay the loans or we cannot find
another source of financing, we may fail which could decrease or eliminate the value of our units.
Our inability to secure credit facilities we may require in the future may negatively impact
our liquidity. Due to current conditions in the credit markets, it has been difficult for
businesses to secure financing. While we do not currently require more financing than we have, in
the future we may need additional financing. If we require financing in the future and we are
unable to secure such financing, or we are unable to secure the financing we require on reasonable
terms, it may have a negative impact on our liquidity. This could negatively impact the value of
our units.
The ethanol industry is an industry that is changing rapidly which can result in unexpected
developments that could negatively impact our operations and the value of our units. The ethanol
industry has grown significantly in the last decade. According to the Renewable Fuels Association,
the ethanol industry has grown from approximately 1.5 billion gallons of production per year in
1999 to approximately 13 billion gallons in 2010. This rapid growth has resulted in significant
shifts in supply and demand of ethanol over a very short period of time. As a result, past
performance by the ethanol plant or the ethanol industry generally might not be indicative f future
performance. We may experience a rapid shift in the economic conditions in the ethanol industry
which may make it difficult to operate the ethanol plant profitably. If changes occur in the
ethanol industry that make it difficult for us to operate the ethanol plant profitably, it could
result in the reduction in the value of our units.
15
Table of Contents
We engage in hedging transactions which involve risks that could harm our business. We are
exposed to market risk from changes in commodity prices. Exposure to commodity price risk results
from our dependence on corn and natural gas in the ethanol production process. We seek to minimize
the risks from fluctuations in the prices of corn, natural gas and ethanol through the use of
hedging instruments. The effectiveness of our hedging strategies is dependent on the price of
corn, natural gas and ethanol and our ability to sell sufficient products to use all of the corn
and natural gas for which we have futures contracts. Our hedging activities may not successfully
reduce the risk caused by price fluctuation which may leave us vulnerable to high corn and natural
gas prices. Alternatively, we may choose not to engage in hedging transactions in the future and
our operations and financial conditions may be adversely affected during periods in which corn
and/or natural gas prices increase. Utilizing cash for margin calls has an impact on the cash we
have available for our operations which could result in liquidity problems during times when corn
prices rise or fall significantly.
Price movements in corn, natural gas and ethanol contracts are highly volatile and are
influenced by many factors that are beyond our control. There are several variables that could
affect the extent to which our derivative instruments are impacted by price fluctuations in the
cost of corn or natural gas. However, it is likely that commodity cash prices will have the
greatest impact on the derivatives instruments with delivery dates nearest the current cash price.
We may incur such costs and they may be significant which could impact our ability to profitably
operate the plant and may reduce the value of our units.
Our business is not diversified. Our success depends largely on our ability to profitably
operate our ethanol plant. We do not have any other lines of business or other sources of revenue
if we are unable to operate our ethanol plant and manufacture ethanol, distiller’s grains and corn
oil. If economic or political factors adversely affect the market for ethanol, distiller’s grains
or corn oil, we have no other line of business to fall back on. Our business would also be
significantly harmed if the ethanol plant could not operate at full capacity for any extended
period of time.
We depend on our management and key employees, and the loss of these relationships could
negatively impact our ability to operate profitably. We are highly dependent on our management
team to operate our ethanol plant. We may not be able to replace these individuals should they
decide to cease their employment with us, or if they become unavailable for any other reason.
While we seek to compensate our management and key employees in a manner that will encourage them
to continue their employment with us, they may choose to seek other employment. Any loss of these
officers and key employees may prevent us from operating the ethanol plant profitably and could
decrease the value of our units.
Changes and advances in ethanol production technology could require us to incur costs to
update our plant or could otherwise hinder our ability to compete in the ethanol industry or
operate profitably. Advances and changes in the technology of ethanol production are expected to
occur. Such advances and changes may make the ethanol production technology installed in our plant
less desirable or obsolete. These advances could also allow our competitors to produce ethanol at
a lower cost than we are able. If we are unable to adopt or incorporate technological advances,
our ethanol production methods and processes could be less efficient than our competitors, which
could cause our plant to become uncompetitive or completely obsolete. If our competitors develop,
obtain or license technology that is superior to ours or that makes our technology obsolete, we may
be required to incur significant costs to enhance or acquire new technology so that our ethanol
production remains competitive. Alternatively, we may be required to seek third-party licenses,
which could also result in significant expenditures. These third-party licenses may not be
available or, once obtained, they may not continue to be available on commercially reasonable
terms. These costs could negatively impact our financial performance by increasing our operating
costs and reducing our net income.
We are subject to litigation involving our corn oil extraction technology. We have been sued
by GS CleanTech Corporation for asserting its intellectual property rights to certain corn oil
extraction processes we obtained from ICM, Inc. in August 2008. GS CleanTech is seeking to enforce
its patent rights against ICM and the Company. According to information available through the U.S.
Patent and Trademark Office, certain patents have been issued and other patents will be issued to
GS CleanTech. If GS CleanTech is successful in its infringement action against the Company, we may
be force to pay damages to GS CleanTech as a result of our use of such technology.
16
Table of Contents
Risks Related to Ethanol Industry
Demand for ethanol may not continue to grow unless ethanol can be blended into gasoline in
higher percentage blends for conventional automobiles. Currently, ethanol is blended with
conventional gasoline for use in standard (non-flex fuel) vehicles to create a blend which is 10%
ethanol and 90% conventional gasoline. Estimates indicate that approximately 135 billion gallons
of gasoline are sold in the United States each year. Assuming that all gasoline in the United
States is blended at a rate of 10% ethanol and 90% gasoline, the maximum demand for ethanol is 13.5
billion gallons. This is commonly referred to as the “blending wall,” which represents a
theoretical limit where more ethanol cannot be blended into the national gasoline pool. Many in
the ethanol industry believe that the ethanol industry will reach this blending wall in 2010. In
order to expand demand for ethanol, higher percentage blends of ethanol must be utilized in
conventional automobiles. Such higher percentage blends of ethanol have recently become a
contentious issue. Automobile manufacturers and environmental groups have fought against higher
percentage ethanol blends. Recently the EPA approved the use of E15 for standard vehicles produced
in the model year 2007 and later. The EPA is expected to make a decisions soon regarding the use
of E15 in vehicles produced in model year 2001 and later. However, the EPA is also expected to
introduce E15 labeling requirements which cause consumers to avoid using E15. The fact that E15
has not been approved for use in all vehicles and the anticipated labeling requirements may lead to
gasoline retailers refusing to carry E15. Without an increase in the allowable percentage blends
of ethanol that can be used in all vehicles, demand for ethanol may not continue to increase which
could decrease the selling price of ethanol and could result in our inability to operate the
ethanol plant profitably. This could reduce or eliminate the value of our units.
The California Low Carbon Fuel Standard may decrease demand for corn based ethanol which could
negatively impact our profitability. Recently, California passed a Low Carbon Fuels Standard
(LCFS). The California LCFS requires that renewable fuels used in California must accomplish
certain reductions in greenhouse gases which are measured using a lifecycle analysis. Management
believes that these new regulations could preclude corn based ethanol produced in the Midwest from
being used in California. California represents a significant ethanol demand market. If we are
unable to supply ethanol to California, it could significantly reduce demand for the ethanol we
produce. Any decrease in ethanol demand could negatively impact ethanol prices which could reduce
our revenues and negatively impact our ability to profitably operate the ethanol plant.
Technology advances in the commercialization of cellulosic ethanol may decrease demand for
corn based ethanol which may negatively affect our profitability. The current trend in ethanol
production research is to develop an efficient method of producing ethanol from cellulose-based
biomass, such as agricultural waste, forest residue, municipal solid waste, and energy crops. This
trend is driven by the fact that cellulose-based biomass is generally cheaper than corn, and
producing ethanol from cellulose-based biomass would create opportunities to produce ethanol in
areas which are unable to grow corn. The Energy Independence and Security Act of 2007 and the 2008
Farm Bill offer a very strong incentive to develop commercial scale cellulosic ethanol. The RFS
requires that 16 billion gallons per year of advanced bio-fuels be consumed in the United States by
2022. Additionally, state and federal grants have been awarded to several companies who are
seeking to develop commercial-scale cellulosic ethanol plants. We expect this will encourage
innovation that may lead to commercially viable cellulosic ethanol plants in the near future. If
an efficient method of producing ethanol from cellulose-based biomass is developed, we may not be
able to compete effectively. If we are unable to produce ethanol as cost-effectively as
cellulose-based producers, our ability to generate revenue and our financial condition will be
negatively impacted.
New plants under construction or decreases in the demand for ethanol may result in excess
production capacity in our industry. The supply of domestically produced ethanol is at an all-time
high. According to the Renewable Fuels Association, as of November 11, 2010, there are 204 ethanol
plants in the United States with capacity to produce more than 13.7 billion gallons of ethanol per
year. In addition, there are 7 new ethanol plants under construction and 4 plant expansions
underway which together are estimated to increase total ethanol production capacity to more than
14.6 billion gallons per year. Excess ethanol production capacity may have an adverse impact on
our results of operations, cash flows and general financial condition. According to the Renewable
Fuels Association, approximately 4.7% of the ethanol production capacity in the United States was
idled as of November 11, 2010, the most recent available data. During the early part of 2009 when
the ethanol industry was
experiencing unfavorable operating conditions, as much as 20% of the ethanol production in the
United States may have been idled. Further, demand for ethanol may not increase past approximately
13 billion gallons of ethanol due to the blending wall unless higher percentage blends of ethanol
are approved by the EPA. If the demand for ethanol does not grow at the same pace as increases in
supply, we expect the selling price of ethanol to decline. If excess capacity in the ethanol
industry continues to occur, the market price of ethanol may decline to a level that is inadequate
to generate sufficient cash flow to cover our costs. This could negatively affect our
profitability.
17
Table of Contents
Decreasing gasoline prices may negatively impact the selling price of ethanol which could
reduce our ability to operate profitably. The price of ethanol tends to change in relation to the
price of gasoline. Recently, as a result of a number of factors including the current world
economy, the price of gasoline has decreased. In correlation to the decrease in the price of
gasoline, the price of ethanol has also decreased. Decreases in the price of ethanol reduce our
revenue. Our profitability depends on a favorable spread between our corn and natural gas costs
and the price we receive for our ethanol. If ethanol prices fall during times when corn and/or
natural gas prices are high, we may not be able to operate our ethanol plant profitably.
Growth in the ethanol industry is dependent on growth in the fuel blending infrastructure to
accommodate ethanol, which may be slow and could result in decreased demand for ethanol. The
ethanol industry depends on the fuel blending industry to blend the ethanol that is produced with
gasoline so it may be sold to the end consumer. In many parts of the country, the blending
infrastructure cannot accommodate ethanol so no ethanol is used in those markets. Substantial
investments are required to expand this blending infrastructure and the fuel blending industry may
choose not to expand the blending infrastructure to accommodate ethanol. Should the ability to
blend ethanol not expand at the same rate as increases in ethanol supply, it may decrease the
demand for ethanol which may lead to a decrease in the selling price of ethanol which could impact
our ability to operate profitably.
We operate in an intensely competitive industry and compete with larger, better financed
entities which could impact our ability to operate profitably. There is significant competition
among ethanol producers. There are numerous producer-owned and privately-owned ethanol plants
planned and operating throughout the Midwest and elsewhere in the United States. We also face
competition from outside of the United States. The passage of the Energy Policy Act of 2005
included a renewable fuels mandate. The RFS was increased in December 2007 to 36 billion gallons
by 2022. Further, some states have passed renewable fuel mandates. All of these increases in
ethanol demand have encouraged companies to enter the ethanol industry. The largest ethanol
producers include Archer Daniels Midland, Green Plains Renewable Energy, Hawkeye Renewable, POET,
and Valero Renewable Fuels, all of which are each capable of producing significantly more ethanol
than we produce. Further, many believe that there will be consolidation occurring in the ethanol
industry in the near future which will likely lead to a few companies who control a significant
portion of the ethanol production market. We may not be able to compete with these larger
entities. These larger ethanol producers may be able to affect the ethanol market in ways that are
not beneficial to us which could affect our financial performance.
Competition from the advancement of alternative fuels may lessen the demand for ethanol.
Alternative fuels, gasoline oxygenates and ethanol production methods are continually under
development. A number of automotive, industrial and power generation manufacturers are developing
alternative clean power systems using fuel cells, plug-in hybrids or clean burning gaseous fuels.
Like ethanol, these emerging technologies offer an option to address worldwide energy costs, the
long-term availability of petroleum reserves and environmental concerns. Fuel cells have emerged as
a potential alternative to certain existing power sources because of their higher efficiency,
reduced noise and lower emissions. Fuel cell industry participants are currently targeting the
transportation, stationary power and portable power markets in order to decrease fuel costs, lessen
dependence on crude oil and reduce harmful emissions. If these alternative technologies continue to
expand and gain broad acceptance and become readily available to consumers for motor vehicle use,
we may not be able to compete effectively. This additional competition could reduce the demand for
ethanol, resulting in lower ethanol prices that might adversely affect our results of operations
and financial condition.
Consumer resistance to the use of ethanol based on the belief that ethanol is expensive, adds
to air pollution, harms engines and/or takes more energy to produce than it contributes may affect
the demand for ethanol. Certain individuals believe that use of ethanol will have a negative
impact on gasoline prices at the pump.
Many also believe that ethanol adds to air pollution and harms car and truck engines. Still
other consumers believe that the process of producing ethanol actually uses more fossil energy,
such as oil and natural gas, than the amount of energy that is produced. These consumer beliefs
could potentially be wide-spread and may be increasing as a result of recent efforts to increase
the allowable percentage of ethanol that may be blended for use in conventional automobiles. If
consumers choose not to buy ethanol based on these beliefs, it would affect the demand for the
ethanol we produce which could negatively affect our profitability and financial condition.
18
Table of Contents
Risks Related to Regulation and Governmental Action
Government incentives for ethanol production, including federal tax incentives, may be
eliminated in the future, which could hinder our ability to operate at a profit. The ethanol
industry is assisted by various federal ethanol production and tax incentives, including the RFS
set forth in the Energy Policy Act of 2005. The RFS helps support a market for ethanol that might
disappear without this incentive; as such, waiver of RFS minimum levels of renewable fuels required
in gasoline could negatively impact our results of operations.
In addition, the elimination or reduction of tax incentives to the ethanol industry, such as
the VEETC available to gasoline refiners and blenders, could also reduce the market demand for
ethanol, which could reduce prices and our revenues by making it more costly or difficult for us to
produce and sell ethanol. If the federal tax incentives are eliminated or sharply curtailed, we
believe that decreased demand for ethanol will result, which could negatively impact our ability to
operate profitably.
Also, elimination of the tariffs that protect the United States ethanol industry could lead to
the importation of ethanol produced in other countries, especially in areas of the United States
that are easily accessible by international shipping ports. The tariff that protects the United
States ethanol industry expires at the end of 2011 which could lead to increase of ethanol supplies
and decreased ethanol prices.
Changes in environmental regulations or violations of these regulations could be expensive and
reduce our profitability. We are subject to extensive air, water and other environmental laws and
regulations. In addition, some of these laws require our plant to operate under a number of
environmental permits. These laws, regulations and permits can often require expensive pollution
control equipment or operational changes to limit actual or potential impacts to the environment.
A violation of these laws and regulations or permit conditions can result in substantial fines,
damages, criminal sanctions, permit revocations and/or plant shutdowns. In the future, we may be
subject to legal actions brought by environmental advocacy groups and other parties for actual or
alleged violations of environmental laws or our permits. Additionally, any changes in
environmental laws and regulations, both at the federal and state level, could require us to spend
considerable resources in order to comply with future environmental regulations. The expense of
compliance could be significant enough to reduce our profitability and negatively affect our
financial condition.
Carbon dioxide may be regulated in the future by the EPA as an air pollutant requiring us to
obtain additional permits and install additional environmental mitigation equipment, which could
adversely affect our financial performance. In 2007, the Supreme Court decided a case in
which it ruled that carbon dioxide is an air pollutant under the Clean Air Act for the purposes of
motor vehicle emissions. The Supreme Court directed the EPA to regulate carbon dioxide from
vehicle emissions as a pollutant under the Clean Air Act. Similar lawsuits have been filed seeking
to require the EPA to regulate carbon dioxide emissions from stationary sources such as our ethanol
plant under the Clean Air Act. Our plant produces a significant amount of carbon dioxide. While
there are currently no regulations applicable to us concerning carbon dioxide, if the EPA or the
State of Indiana were to regulate carbon dioxide emissions by plants such as ours, we may have to
apply for additional permits or we may be required to install carbon dioxide mitigation equipment
or take other as yet unknown steps to comply with these potential regulations. Compliance with any
future regulation of carbon dioxide, if it occurs, could be costly and may prevent us from
operating the ethanol plant profitably which could decrease or eliminate the value of our
units.
19
Table of Contents
| ITEM 2. | PROPERTIES. |
Our plant site is made up of two adjacent parcels which together total approximately 295 acres
in east central Indiana near Union City, Indiana. The address of our plant is 1554 N. County Road
600 E., Union City, Indiana 47390. In November 2008, the plant was substantially completed and plant operations
commenced. The plant consists of the following buildings:
| • | A grains area, fermentation area, distillation — evaporation area; |
||
| • | A dryer/energy center area; |
||
| • | A tank farm; |
||
| • | An auxiliary area; and |
||
| • | An administration building. |
Our plant is in excellent condition and is capable of functioning at over 100% of its
production capacity.
All of our tangible and intangible property, real and personal, serves as the collateral for
the debt financing with First National Bank of Omaha, which is described below under “Item 7 —
Management’s Discussion and Analysis of Financial Condition and Results of Operations.”
| ITEM 3. | LEGAL PROCEEDINGS. |
On June 27, 2008, we entered into a Tricanter Purchase and Installation Agreement with ICM,
Inc. for the construction and installation of a Tricanter Oil Separation System. On February 12,
2010, GS CleanTech Corporation filed a lawsuit in the United States District Court for the Southern
District of Indiana, claiming that the Company’s operation of the oil recovery system manufactured
and installed by ICM, Inc. infringes a patent claimed by GS CleanTech Corporation. GS CleanTech
Corporation seeks a preliminary injunction, royalties, damages associated with the alleged
infringement, as well as attorney’s fees from the Company. On February 16, 2010, ICM, Inc. agreed
to indemnify, at ICM’s expense, the Company from and against all claims, demands, liabilities,
actions, litigations, losses, damages, costs and expenses, including reasonable attorney’s fees
arising out of any claim of infringement of patents, copyrights or other intellectual property
rights by reason of the Company’s purchase and use of the oil recovery system.
GS CleanTech Corporation subsequently filed actions against at least fourteen other ethanol
producing companies for infringement of its patent rights. Several of the other defendants also
use equipment and processes provided by ICM, Inc. GS CleanTech Corporation then petitioned for the
cases to be joined in a multi-district litigation (“MDL”). This petition was granted and the MDL
was assigned to the United States District Court for the Southern District of Indiana (Case No.
1:10-ml-02181). The Company has since answered and counterclaimed that the patent claims at issue
are invalid. The Company anticipates that once the issues common to all of the defendants have
been determined in the MDL, the cases will proceed in the respective districts in which they were
originally filed.
The Company is not currently able to predict the outcome of this litigation with any degree of
certainty. ICM, Inc. has, and the Company expects it will continue, to vigorously defend itself
and the Company in these lawsuits. The Company estimates that damages sought in this litigation
would be based on a reasonable royalty to, or lost profits of, GS CleanTech Corporation. If the
court deems the case exceptional, attorney’s fees may be awarded and are likely to be $1,000,0000
or more. ICM, Inc. has also agreed to indemnify the Company. However, in the event that damages
are awarded, if ICM, Inc. is unable to fully indemnify the Company for any reason, the Company
could be liable. In addition, the Company may need to cease use of its current oil separation
process and seek out a replacement or cease oil production altogether.
| ITEM 4. | REMOVED AND RESERVED. |
PART II
| ITEM 5. | MARKET FOR REGISTRANT’S COMMON EQUITY, RELATED MEMBER MATTERS AND ISSUER PURCHASES OF EQUITY SECURITIES. |
As of September 30, 2010 we had approximately 14,606 membership units outstanding and
approximately 1,197 unit holders of record. There is no public trading market for our units.
20
Table of Contents
However, we have established through Alerus Securities a Unit Trading Bulletin Board, a
private online matching service, in order to facilitate trading among our members. The Unit
Trading Bulletin Board has been designed to comply with federal tax laws and IRS regulations
establishing an “alternative trading service,” as well as state and federal securities laws. Our
Unit Trading Bulletin Board consists of an electronic bulletin board that provides a list of
interested buyers with a list of interested sellers, along with their non-firm price quotes. The
Unit Trading Bulletin Board does not automatically affect matches between potential sellers and
buyers and it is the sole responsibility of sellers and buyers to contact each other to make a
determination as to whether an agreement to transfer units may be reached. We do not become
involved in any purchase or sale negotiations arising from our Unit Trading Bulletin Board and have
no role in effecting the transactions beyond approval, as required under our operating agreement,
and the issuance of new certificates. We do not give advice regarding the merits or shortcomings
of any particular transaction. We do not receive, transfer or hold funds or securities as an
incident of operating the Unit Trading Bulletin Board. We do not receive any compensation for
creating or maintaining the Unit Trading Bulletin Board. In advertising our alternative trading
service, we do not characterize Cardinal Ethanol as being a broker or dealer or an exchange. We do
not use the Unit Trading Bulletin Board to offer to buy or sell securities other than in compliance
with the securities laws, including any applicable registration requirements.
There are detailed timelines that must be followed under the Unit Trading Bulletin Board Rules
and Procedures with respect to offers and sales of membership units. All transactions must comply
with the Unit Trading Bulletin Board Rules, our operating agreement, and are subject to approval by
our board of directors.
As a limited liability company, we are required to restrict the transfers of our membership
units in order to preserve our partnership tax status. Our membership units may not be traded on
any established securities market or readily traded on a secondary market (or the substantial
equivalent thereof). All transfers are subject to a determination that the transfer will not cause
the Company to be deemed a publicly traded partnership.
The following table contains historical information by fiscal quarter for the past two fiscal
years regarding the actual unit transactions that were completed by our unit-holders during the
periods specified. We believe this most accurately represents the current trading value of the
Company’s units. The information was compiled by reviewing the completed unit transfers that
occurred on our qualified matching service bulletin board during the quarters indicated.
| # of | ||||||||||||||||
| Quarter | Low Price | High Price | Average Price | Units Traded | ||||||||||||
2009 1st |
$ | 4,000 | $ | 4,000 | $ | 4,000.00 | 5 | |||||||||
2009 2nd |
$ | 3,000 | $ | 3,275 | $ | 3,052.50 | 10 | |||||||||
2009 3rd |
$ | 2,950 | $ | 3,000 | $ | 2,985.00 | 20 | |||||||||
2009 4th |
$ | 2,850 | $ | 2,850 | $ | 2,850.00 | 5 | |||||||||
2010 1st |
$ | 2,250 | $ | 2,700 | $ | 2,557.29 | 24 | |||||||||
2010 2nd |
$ | 2,650 | $ | 3,400 | $ | 2,817.50 | 80 | |||||||||
2010 3rd |
$ | 3,100 | $ | 3,400 | $ | 3,217.25 | 20 | |||||||||
2010 4th |
$ | 3,400 | $ | 3,500 | $ | 3,416.13 | 62 | |||||||||
The following table contains the bid and asked prices that were posted on the Company’s
alternative trading service bulletin board and includes some transactions that were not completed.
The Company believes the table above more accurately describes the trading value of its units as the bid and asked
prices below include some offers that never resulted in completed transactions. The information
was compiled by reviewing postings that were made on the Company’s alternative trading service
bulletin board.
| # of | ||||||||||||||||
| Sellers Quarter | Low Price | High Price | Average Price | Units Listed | ||||||||||||
2009 1st |
$ | 5,000 | $ | 5,000 | $ | 5,000.00 | 16 | |||||||||
2009 2nd |
$ | 3,500 | $ | 4,000 | $ | 4,107.14 | 28 | |||||||||
2009 3rd |
$ | 3,000 | $ | 3,000 | $ | 3,000.00 | 3 | |||||||||
2009 4th |
$ | 2,800 | $ | 2,800 | $ | 2,800.00 | 1 | |||||||||
2010 1st |
$ | 2,250 | $ | 2,700 | $ | 2,557.29 | 24 | |||||||||
2010 2nd |
$ | 2,650 | $ | 3,800 | $ | 2,841.46 | 82 | |||||||||
2010 3rd |
$ | 3,100 | $ | 3,400 | $ | 3,217.25 | 20 | |||||||||
2010 4th |
$ | 3,400 | $ | 3,500 | $ | 3,558.54 | 82 | |||||||||
21
Table of Contents
Our board of directors approved an estimated tax distribution of $60 per unit net of
non-resident withholding taxes for out of state members, for a total distribution of $842,000,
which was made in March 2010.
Except for restrictions imposed in our loan agreement our board of directors has complete
discretion over the timing and amount of distributions to our unit holders. Provided that we are
not in default on loan covenants, and with the prior approval of our lender, which may not be
unreasonably withheld, our loan agreement allows us to make cash distributions at such times and in
such amounts as will permit our unit holders to satisfy their income tax liability in a timely
fashion. Our expectations with respect to our ability to make future distributions are discussed
in greater detail in “Item 7 — MANAGEMENT’S DISCUSSION AND ANALYSIS OF FINANCIAL CONDITION AND
RESULTS OF OPERATIONS.”
Performance Graph
The following graph shows a comparison of cumulative total member return since October 31,
2006, calculated on a dividend reinvested basis, for the Company, the NASDAQ Composite Index (the
“NASDAQ”) and an index of other companies that have the same SIC code as the Company (the “Industry
Index”). The graph assumes $100 was invested in each of our units, the NASDAQ, and the Industry
Index on October 31, 2006. Data points on the graph are annual. Note that historic stock price
performance is not necessarily indicative of future unit price performance.
COMPARISON OF 5 YEAR CUMULATIVE TOTAL RETURN*
Among Cardinal Ethanol, LLC, the NASDAQ Composite Index
and the NASDAQ Clean Edge Green Energy Index
Among Cardinal Ethanol, LLC, the NASDAQ Composite Index
and the NASDAQ Clean Edge Green Energy Index
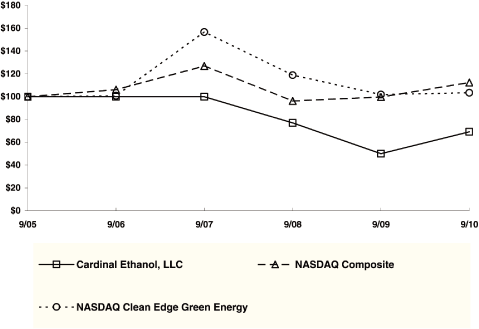
| * | $100 invested on 9/30/05 in
stock or index, including reinvestment of dividends. |
|
Fiscal year ending September
30. |
22
Table of Contents
Pursuant to the rules and regulations of the Securities and Exchange Commission, the
performance graph and the information set forth therein shall not be deemed to be filed for
purposes of Section 18 of the Securities Exchange Act of 1934, and shall not be deemed to be
incorporated by reference in any filing under the Securities Act of 1933, as amended, or the
Exchange Act, except as shall be expressly set forth by specific reference in such a filing.
| ITEM 6. | SELECTED FINANCIAL DATA |
The following table presents selected consolidated financial and operating data as of the
dates and for the periods indicated. The selected consolidated balance sheet financial data as of
September 30, 2008, 2007 and 2006 and the selected consolidated income statement data and other
financial data for the years ended September 30, 2007 and 2006 have been derived from our audited
consolidated financial statements that are not included in this Form 10-K. The selected
consolidated balance sheet financial data as of September 30, 2010 and 2009 and the selected
consolidated income statement data and other financial data for each of the years in the three year
period ended September 30, 2010 have been derived from the audited Consolidated Financial
Statements included elsewhere in this Form 10-K. You should read the following table in
conjunction with “Item 7- Management Discussion and Analysis of Financial Condition and Results of
Operations” and the consolidated financial statements and the accompanying notes included
elsewhere in this Form 10-K. Among other things, those financial statements include more detailed
information regarding the basis of presentation for the following consolidated financial data.
| Statement of Operations Data: | 2010 | 2009 | 2008 | 2007 | 2006 | |||||||||||||||
Revenues |
$ | 224,807,338 | $ | 167,738,057 | $ | — | $ | — | $ | — | ||||||||||
Cost Goods Sold |
195,880,762 | 160,674,617 | — | — | — | |||||||||||||||
Gross Profit |
28,926,576 | 7,063,440 | — | — | — | |||||||||||||||
Operating Expenses |
3,735,530 | 3,726,051 | 1,266,368 | 875,080 | 589,722 | |||||||||||||||
Impairment Loss |
— | — | — | — | — | |||||||||||||||
Operating Income (Loss) |
25,191,046 | 3,337,389 | (1,266,368 | ) | (875,080 | ) | (589,722 | ) | ||||||||||||
Other Income (Expense) |
(4,740,467 | ) | (4,288,574 | ) | 258,114 | 3,130,461 | 151,999 | |||||||||||||
Net Income |
$ | 20,450,579 | $ | (951,185 | ) | $ | (1,008,254 | ) | $ | 2,255,381 | $ | (437,723 | ) | |||||||
Weighted Average Units Outstanding |
14,606 | 14,606 | 14,606 | 12,026 | 477 | |||||||||||||||
Net Income (Loss) Per Unit |
$ | 1,400.15 | $ | (65.12 | ) | $ | (69.03 | ) | $ | 187.54 | $ | (917.66 | ) | |||||||
Cash Distributions Per Unit |
$ | 60.00 | $ | — | $ | — | $ | — | $ | — | ||||||||||
| Balance Sheet Data: | 2010 | 2009 | 2008 | 2007 | 2006 | |||||||||||||||
Current Assets |
$ | 29,289,713 | $ | 22,049,914 | $ | 741,508 | $ | 21,285,458 | $ | 357,321 | ||||||||||
Net Property and Equipment |
132,780,346 | 137,209,571 | 140,285,656 | 63,371,362 | 15,078 | |||||||||||||||
Other Assets |
851,732 | 1,068,767 | 2,397,795 | 1,427,895 | 626,977 | |||||||||||||||
Total Assets |
162,921,791 | 160,328,252 | 143,424,959 | 86,084,715 | 999,376 | |||||||||||||||
Current Liabilities |
17,952,961 | 13,036,275 | 11,682,082 | 13,621,236 | 145,637 | |||||||||||||||
Long-Term Debt |
56,188,380 | 77,427,000 | 61,818,344 | — | — | |||||||||||||||
Members’ Equity |
85,650,048 | 66,594,997 | 69,924,533 | 72,463,479 | 853,739 | |||||||||||||||
| * | See Item 7. Management’s Discussion and Analysis of Financial Condition and Results of Operations for further discussion of our financial results. |
23
Table of Contents
| ITEM 7. | MANAGEMENT’S DISCUSSION AND ANALYSIS OF FINANCIAL CONDITION AND RESULTS OF OPERATIONS. |
This report contains forward-looking statements that involve future events, our future
performance and our expected future operations and actions. In some cases you can identify
forward-looking statements by the use of words such as “may,” “will,” “should,” “anticipate,”
“believe,” “expect,” “plan,” “future,” “intend,” “could,” “estimate,” “predict,” “hope,”
“potential,” “continue,” or the negative of these terms or other similar expressions. These
forward-looking statements are only our predictions and involve numerous assumptions, risks and
uncertainties. Our actual results or actions may differ materially from these forward-looking
statements for many reasons, including the reasons described in this report. We are not under any
duty to update the forward-looking statements contained in this report. We cannot guarantee future
results, levels of activity, performance or achievements. We caution you not to put undue reliance
on any forward-looking statements, which speak only as of the date of this report. You should read
this report and the documents that we reference in this report and have filed as exhibits,
completely and with the understanding that our actual future results may be materially different
from what we currently expect. We qualify all of our forward-looking statements by these
cautionary statements.
Overview
Cardinal Ethanol, LLC was formed on February 7, 2005 with the name of Indiana Ethanol, LLC.
On September 27, 2005, we changed our name to Cardinal Ethanol, LLC. We were formed for the purpose
of raising capital to develop, construct, own and operate a 100 million gallon per year ethanol
plant in east central Indiana near Union City, Indiana. We began producing ethanol and distillers
grains at the plant in November 2008.
Results of Operations
Comparison of Fiscal Year Ended September 30, 2010 and September 30, 2009
The following table shows the results of our operations and the percentage of revenues, cost
of goods sold, operating expenses and other items to total revenues in our statement of operations
for the fiscal years ended September 30, 2010 and 2009.
| Fiscal Year Ended | Fiscal Year Ended | |||||||||||||||
| September 30, 2010 | September 30, 2009 | |||||||||||||||
| (Audited) | (Audited) | |||||||||||||||
| Income Statement Data | Amount | Percent | Amount | Percent | ||||||||||||
Revenues |
$ | 224,807,338 | 100.00 | % | $ | 167,738,057 | 100.00 | % | ||||||||
Cost of Goods Sold |
195,880,762 | 87.13 | % | 160,674,617 | 95.79 | % | ||||||||||
Gross Profit |
28,926,576 | 12.87 | % | 7,063,440 | 4.21 | % | ||||||||||
Operating Expenses |
3,735,530 | 1.65 | % | 3,726,051 | 2.22 | % | ||||||||||
Operating Income |
25,191,046 | 11.22 | % | 3,337,389 | 1.99 | % | ||||||||||
Other (Expense) |
(4,740,467 | ) | (2.11 | )% | (4,288,574 | ) | (2.56 | )% | ||||||||
Net Income (Loss) |
$ | 20,450,579 | 9.11 | % | $ | (951,185 | ) | (0.57 | )% | |||||||
24
Table of Contents
The following table shows additional data regarding production and price levels for our primary
inputs and our primary products for the fiscal years ended September 30, 2010 and 2009.
| Fiscal Year ended | Fiscal Year ended | |||||||
| September 30, 2010 | September 30, 2009 | |||||||
Production: |
||||||||
Ethanol sold (gallons) |
109,986,252 | 87,645,515 | ||||||
Distillers grains sold (tons) |
321,087 | 267,699 | ||||||
Revenues: |
||||||||
Ethanol average price per gallon |
$ | 1.739 | $ | 1.58 | ||||
Distillers grains average price per ton |
$ | 97.390 | $ | 103.53 | ||||
Primary Inputs: |
||||||||
Corn ground (bushels) |
39,408,254 | 32,293,302 | ||||||
Natural gas purchased (MMBTU) |
3,126,888 | 2,760,264 | ||||||
Costs of Primary Inputs: |
||||||||
Corn average price per bushel ground |
$ | 3.851 | $ | 4.04 | ||||
Natural gas average price per MMBTU |
$ | 5.009 | $ | 4.907 | ||||
Other Costs: |
||||||||
Chemical and additive costs per gallon of ethanol sold |
$ | 0.062 | $ | 0.066 | ||||
Denaturant cost per gallon of ethanol sold |
$ | 0.042 | $ | 0.036 | ||||
Electricity cost per gallon of ethanol sold |
$ | 0.031 | $ | 0.033 | ||||
Direct Labor cost per gallon of ethanol sold |
$ | 0.018 | $ | 0.022 | ||||
Revenues
Our revenues are derived from the sale of our ethanol, distillers grains and corn oil. For
the fiscal year ended September 30, 2010, we received approximately 85% of our revenue from the
sale of fuel ethanol and approximately 14% of our revenue from the sale of distillers grains.
Sales of corn oil represented less than 1% of our total sales. Comparatively, for the fiscal year
ended September 30, 2009, we received approximately 83% of our revenue from the sale of fuel
ethanol and approximately 17% of our revenue from the sale of distillers grains, and less than 1%
of total sales from corn oil.
Ethanol
Our revenues from ethanol increased for our fiscal year ended September 30, 2010 as compared
to our fiscal year ended September 30, 2009. Our increase in revenues for our 2010 fiscal year as
compared to our 2009 fiscal year was the result of an increase in our ethanol production in 2010
and higher ethanol prices in 2010 on average per gallon as compared to 2009. We are currently
operating at 118% of our name plate capacity.
During the fiscal year ended September 30, 2010, the market price of ethanol varied between
approximately $1.57 per gallon and approximately $2.43 per gallon. Our average price per gallon of
ethanol sold was approximately $1.74 for our 2010 fiscal year. During the fiscal year ended
September 30, 2009, the market price of ethanol varied between approximately $1.36 per gallon and
approximately $1.72 per gallon. Our average price per gallon of ethanol sold was approximately
$1.58. During the fiscal year ended September 30, 2010, we sold approximately 109,986,000 gallons
of ethanol as compared to our sale of 87,646,000 gallons of ethanol in 2009.
25
Table of Contents
Management anticipates that ethanol prices will continue to change in relation to changes in
corn and energy prices. Management anticipates that ethanol prices will remain steady during our
2011 fiscal year given the VEETC blenders’ credit has been renewed. The ethanol industry relies on
the VEETC to reduce the cost of ethanol to fuel blenders. This results in increased demand for
ethanol related to what is called discretionary blending. Discretionary blending is where fuel
blenders use ethanol to increase octane in the fuels that are produced as well as reduce the price
of gasoline. However, when the price of ethanol increases relative the price of gasoline, after
taking into account the VEETC, the amount of discretionary blending by fuel blenders decreases
thereby decreasing ethanol demand. Management anticipates ethanol production will be comparable
during our 2011 fiscal year provided the ethanol industry can maintain current ethanol prices.
However, in the event ethanol prices decrease significantly, we may be forced to reduce ethanol
production during times when our operating margins are unfavorable. Further, our operating margins
also depend on corn prices which can affect the spread between the price we receive for our ethanol
and our raw material costs. In times when this spread decreases or becomes negative, we may reduce
or terminate ethanol production until these spreads become more favorable.
A debate continues with respect to changes in the allowable percentage of ethanol blended with
gasoline for use in standard (non-flex fuel) vehicles. Currently, ethanol is blended with
conventional gasoline for use in standard vehicles to create a blend which is 10% ethanol and 90%
gasoline. Estimates indicate that approximately 135 billion gallons of gasoline are sold in the
United States each year. However, gasoline demand may be shrinking in the United States as a
result of the global economic slowdown. Assuming that all gasoline in the United States is blended
at a rate of 10% ethanol and 90% gasoline, the maximum demand for ethanol is 13.5 billion gallons
per year. This is commonly referred to as the “blending wall,” which represents a theoretical
limit where more ethanol cannot be blended into the national gasoline pool. This is a theoretical
limit because it is believed that it would not be possible to blend ethanol into every gallon of
gasoline that is used in the United States and it discounts the possibility of additional ethanol
used in higher percentage blends such as E85 used in flex fuel vehicles. Many in the ethanol
industry believe that we will reach this blending wall in 2009 or 2010. The RFS mandate requires
that 36 billion gallons of renewable fuels be used each year by 2022 which equates to approximately
27% renewable fuels used per gallon of gasoline sold. In order to meet the RFS mandate and expand
demand for ethanol, management believes higher percentage blends of ethanol must be utilized in
conventional automobiles. Such higher percentage blends of ethanol have continued to be a contentious issue. Automobile
manufacturers and environmental groups are lobbying against higher percentage ethanol blends.
State and federal regulations prohibit the use of higher percentage ethanol blends in conventional
automobiles and vehicle manufacturers have indicated that using higher percentage blends of ethanol
in conventional automobiles would void the manufacturer’s warranty. Without increases in the
allowable percentage blends of ethanol, demand for ethanol may not continue to increase. Our
financial condition may be negatively affected by decreases in the selling price of ethanol
resulting from ethanol supply exceeding demand.
Distillers Grains
Our revenues from distillers grains increased in fiscal year ended September 30, 2010 as
compared to the same period in 2009. This increase was primarily the result of increased
distillers grains sales in 2010 as compared to 2009 partially offset by a decrease in the average
price per ton we received from our distillers grains in the fiscal year ended September 30, 2010 as
compared to the fiscal year ended September 30, 2009.
During the fiscal year ended September 30, 2010, the market price of distillers grains varied
between approximately $93 per ton and approximately $140 per ton. Our average price per ton of
distillers grains sold was approximately $97.39. During the fiscal year ended September 30, 2009,
the market price of distillers grains varied between approximately $76.64 per ton and approximately
$148.15 per ton. Our average price per ton of distillers grains sold was approximately $103.53.
We sold approximately 53,000 more tons of distiller grains during our 2010 fiscal year as compared
to our 2009 fiscal year. During our fiscal year ended September 30, 2010, we sold approximately
321,000 tons of distillers grains compared to approximately 268,000 tons during our fiscal year
ended September 30, 2009. Management attributes this increase in distillers grains sales with
increased production of ethanol during the 2010 fiscal year. As we produce more ethanol, the total
tons of distillers grains that we produce also increases. Offsetting the increase in distillers
grains sales was a decrease in the average price we received per ton of distillers grains sold
during our 2010 fiscal year compared to our 2009 fiscal year. During our 2009 fiscal year,
uncertainty existed regarding the supply of distillers grains in the market due to the fact that
many ethanol producers were reducing production during late 2008 and early 2009. Management
believes this resulted in higher distillers grains prices due to increasing demand and lower
supplies. Therefore, we experienced higher distillers grains prices during our 2009 fiscal year.
Further management believes that distillers grains prices lag behind corn prices. As a result,
distillers grains prices during our 2010 fiscal year may not have fully benefited from the recent
increases in corn prices that we experienced in the second half of our 2010 fiscal year.
26
Table of Contents
Management believes that the market prices for distiller’s grains change in relation to the
prices of other animal feeds, such as corn and soybean meal. We primarily sell dried distillers
grains nationally through our marketer. Given the recent increase in corn prices, we have
experienced higher than normal distiller grains prices.
Corn Oil
Management anticipates continuing to increase our corn oil production during our 2011 fiscal
year as we continue to refine the operation of our corn oil extraction equipment.
Cost of Goods Sold
Our cost of goods sold as a percentage of revenues was 87.13% for the fiscal year ended
September 30, 2010 and 95.79% for the fiscal year ended September 30, 2009. Our two primary costs
of producing ethanol and distillers grains are corn costs and natural gas costs.
Corn Costs
Our largest cost associated with the production of ethanol, distillers grains and corn oil is
corn costs. During the fiscal year ended September 30, 2010 our corn costs increased as compared
to our fiscal year ended September 30, 2009. This increase was the result of an increase in the
amount of corn used by our plant in 2010 as compared to 2009 partially offset by a lower average
price per bushel of ground corn in 2010 as compared to 2009.
During our fiscal year ended September 30, 2010, we used approximately 39,408,000 bushels of
corn to produce our ethanol, distillers grain and corn oil as compared to approximately 32, 293,000
during our fiscal year ended September 30, 2009. Management attributes this increase in bushels of corn for our 2010
fiscal year to an increase in production of ethanol and distillers grains. During the fiscal year
ended September 30, 2010, the market price of corn varied between approximately $3.40 per bushel
and approximately $4.81 per bushel. Our average price per bushel of corn ground was approximately
$3.85, without considering the effects of our risk management/hedging. During the fiscal year
ended September 30, 2009, the market price of corn varied between approximately $3.41 per bushel
and approximately $4.63 per bushel. Our average price per bushel of corn ground was approximately
$4.04, without considering the effects of our risk management/hedging. Our corn costs associated
with the beginning of our 2010 fiscal year were lower than normal. However, beginning in July corn
prices increased as a result of uncertainty regarding weather factors that resulted in decreased
corn yields in some parts of the United States. This led to fears regarding an imbalance between
corn supply and demand which had a negative impact on corn prices. Management expects that corn
prices will remain high through the first part of our 2011 fiscal year.
In the ordinary course of business, we entered into forward purchase contracts for our
commodity purchases for various delivery periods through July 2012 for a total commitment of
approximately $7,761,000. Approximately $1,638,000 of the forward corn purchases were with a
related party. As of September 30, 2010 we also have open short positions for 5,425,000 bushels of
corn on the Chicago Board of Trade and 3,570,000 gallons of ethanol on the New York Mercantile
Exchange to hedge our forward corn contracts and corn inventory. Our corn and ethanol positions
are forecasted to settle for various delivery periods through March 2012 and November 2010,
respectively. For the fiscal year ended September 30, 2010, we recorded net losses on our corn and
ethanol contracts of approximately $2,424,000. These losses were recorded against our cost of
goods sold in the statement of operations. We expect continued volatility in the price of corn,
which could significantly impact our cost of goods sold.
Natural Gas Costs
Our natural gas costs were higher during our fiscal year ended September 30l, 2010 as compared
to our fiscal year ended September 30, 2009. This increase in cost of natural gas for our 2010
fiscal year as compared to our 2009 fiscal year was primarily the result of an increase in the
amount of natural gas that we used at our plant and an increase in the average price per MMBTU of
our natural gas.
27
Table of Contents
During our fiscal year ended September 30, 2010 we purchased approximately 367,000 more
MMBTU’s of natural gas than we purchased in our fiscal year ended September 30, 2009. During our
fiscal year ended September 30, 2010 we purchased approximately 3,127,000 MMBTU’s of natural gas as
compared to approximately 2,760,000 MMBTU’s during our fiscal year ended September 30, 2009.
Management attributes this increase in natural gas to an increase in production. During the fiscal
year ended September 30, 2010, the market price of natural gas varied between approximately $3.70
per MMBTU and approximately $6.10 per MMBTU. Our average price per MMBTU of natural gas was
approximately $5.01. During the fiscal year ended September 30, 2009, the market price of natural
gas varied between approximately $3.31 per MMBTU and approximately $8.028 per MMBTU. Our average
price per MMBTU of natural gas was approximately $4.91.
Natural gas prices hit near historic lows during July through September 2010 based on high
inventories nationwide. Management anticipates that natural gas prices will remain steady during
our 2011 fiscal year unless demand significantly increases due to improved global economic
conditions. Management anticipates that natural gas prices may rise slightly during the winter
heating months.
Operating Expense
Our operating expenses as a percentage of revenues were 1.66% for the fiscal year ended
September 30, 2010 and 2.22% for the same period in 2009. Our operating expenses have remained
relatively steady for the fiscal year ended September 30, 2010 compared to the same periods of
2009. We had a decrease in professional fees expense offset by an increase in general and
administrative costs. Operating expenses include salaries and benefits of administrative
employees, insurance, taxes, professional fees and other general administrative costs. Our efforts
to optimize efficiencies and maximize production may result in a decrease in our operating expenses
on a per gallon basis. However, because these expenses generally do not vary with the level of
production at the plant, we expect our operating expenses to remain steady.
Operating Income
Our income from operations for the fiscal year ended September 30, 2010 was approximately
11.21% compared to 1.99% of our revenues for the same period ended 2009. Our operating income for
the fiscal year ended September 30, 2010 has increased due to increased revenues as a result of
better operating margins. For the fiscal year ended September 30, 2010 operating income was
primarily the net result of our revenues exceeding our costs of goods sold and our operating
expenses.
Other Expense
Our other expense for the fiscal year ended September 30, 2010 was approximately
2.11% of our revenues, compared to 2.56% for the fiscal year ended September 30, 2009. Our other
expense for the fiscal year ended September 30, 2010 and 2009 consisted primarily of interest
expense.
Changes in Financial Condition for the Fiscal Year Ended September 30, 2010 and 2009
We experienced an increase in our current assets of approximately $7,240,000 at September 30,
2010 compared to September 30, 2009. We experienced an increase of approximately $7,317,000 in
trade accounts receivable and an increase of $2,542,000 in inventory at September 30, 2010 compared
to September 30, 2009. We also had cash of approximately $3,318,000 at September 30, 2010,
compared to cash of approximately $7,265,000 at September 30, 2009 and prepaid and other current
assets of approximately $965,000 at September 30, 2010, compared to approximately $847,000 at
September 30, 2009.
We experienced an increase in our total current liabilities on September 30, 2010 compared to
September 30, 2009. We experienced a decrease of approximately $1,992,000 in the current portion
of our long term debt and capital lease obligations at September 30, 2010 compared to September 30,
2009. We experienced a decrease of approximately $269,000 for accrued expenses at September 30,
2010 compared to September 30, 2009; and an increase of approximately $1,710,000 in our accounts
payable for corn purchases at September 30, 2010 compared to September 30, 2009. Such increase in
our liabilities related to the current portion of our derivative instruments of approximately
$1,520,000 at September 30, 2010 compared to $862,000 at September 30, 2009; and an increase in our
non-corn accounts payable of approximately $2,154,000 at September 30, 2010 compared to $1,330,000
at September 30, 2009.
28
Table of Contents
We experienced a decrease in our long-term liabilities as of September 30, 2010 compared to
September 30, 2009. At September 30, 2010, we had approximately $56,188,000 outstanding in the
form of long-term loans, compared to approximately $77,427,000 at September 30, 2009. This
decrease is due to paying down our long term debt.
Comparison of Fiscal Years Ended September 30, 2009 and 2008
Because our plant was not operational until November 2008, subsequent to our 2008 fiscal year
end, we do not include comparative information for the fiscal year ending September 30, 2008.
Critical Accounting Estimates
Management uses various estimates and assumptions in preparing our financial statements in
accordance with generally accepted accounting principles. These estimates and assumptions affect
the reported amounts of assets and liabilities, the disclosure of contingent assets and
liabilities, and the reported revenues and expenses. Accounting estimates that are the most
important to the presentation of our results of operations and financial condition, and which
require the greatest use of judgment by management, are designated as our critical accounting
estimates. We have the following critical accounting estimates:
We enter into derivative instruments to hedge the variability of expected future cash flows
related to interest rates. We do not typically enter into derivative instruments other than for
hedging purposes. All derivative instruments are recognized on the September 30, 2010 balance
sheet at their fair market value. Changes in the fair value of a derivative instrument that is designated as and meets all of the required criteria
for a cash flow hedge are recorded in accumulated other comprehensive income and reclassified into
earnings as the underlying hedged items affect earnings.
At September 30, 2010, we had an interest rate swap with a fair value of $4,650,717 recorded
as derivative instruments in the current and long-term liabilities section of the balance sheet and
as a deferred loss in accumulated other comprehensive loss. We have an interest rate swap with a
fair value of $4,131,549 for the same period ended in 2009. The interest rate swap is designated
as a cash flow hedge.
As of September 30, 2010, we have open short positions for 5,425,000 bushels of corn and no
long positions for corn on the Chicago Board of Trade and 3,570,000 gallons of ethanol on the New
York Mercantile Exchange to hedge our forward corn contracts and corn inventory. These
derivatives have not been designated as an effective hedge for accounting purposes. Corn and
ethanol positions are forecasted to settle through March 2012 and November 2010, respectively.
There may be offsetting positions that are not shown on a net basis that could lower the notional
amount of positions outstanding as disclosed above.
We review long-lived assets for impairment whenever events or changes in circumstances
indicate that the related carrying amounts may not be recoverable. Impairment testing for assets
requires various estimates and assumptions, including an allocation of cash flows to those assets
and, if required, an estimate of the fair value of those assets. Given the significant assumptions
required and the possibility that actual conditions will differ, we consider the assessment of the
useful lives of property and equipment to be a critical accounting estimate.
We value our inventory at the lower of cost or market. Our estimates are based upon
assumptions believed to be reasonable, but which are inherently uncertain and unpredictable. These
valuations require the use of management’s assumptions which do not reflect unanticipated events
and circumstances that may occur. In our analysis, we consider future corn costs and ethanol
prices, break-even points for our plant and our risk management strategies in place through our
derivative instruments and forward contracts. Given the significant assumptions required and the
possibility that actual conditions will differ, we consider the valuation of the lower of cost or
market on inventory to be a critical accounting estimate.
29
Table of Contents
We enter forward contracts for corn purchases to supply the plant. These contracts represent
firm purchase commitments which must be evaluated for potential losses. We have estimated a loss
on these firm purchase commitments related to corn contracts in place at September 30, 2010 where
the price of corn exceeds the market price and upon being used in the manufacturing process and
eventual sale of products we anticipate losses. Our estimates include various assumptions
including the future prices of ethanol, distillers grains and corn.
Liquidity and Capital Resources
Based on financial forecasts performed by our management, we anticipate that we will have
sufficient cash from our current credit facilities and cash from our operations to continue to
operate the ethanol plant for the next 12 months. We do not anticipate seeking additional equity
or debt financing during our 2011 fiscal year. However, should we experience unfavorable operating
conditions in the future, we may have to secure additional debt or equity sources for working
capital or other purposes.
As a result of current conditions in the ethanol market that have presented favorable
operating conditions, we were able to reduce our reliance on our revolving line of credit. This
has allowed us greater liquidity and has increased the amount of funds that are available to us on
our revolving line of credit. However, should we once again experience unfavorable operating
conditions in the ethanol industry that prevent us from profitably operating the ethanol plant, we
could have difficulty maintaining our liquidity.
The following table shows cash flows for the fiscal years ended September 30, 2010 and 2009:
| Year ended September 30, | ||||||||
| 2010 | 2009 | |||||||
Net cash provided by (used in) operating activities |
$ | 19,940,794 | $ | (2,244,876 | ) | |||
Net cash used in investing activities |
(3,765,300 | ) | (13,931,689 | ) | ||||
Net cash provided by (used in) financing activities |
(20,122,799 | ) | 22,980,155 | |||||
Cash Flow From Operating Activities
We experienced an increase in net cash from operating activities for the fiscal year ended
September 30, 2010 as compared to the same period in 2009. Overall net cash from operating
activities increased due to the Company having net income of approximately $20,451,000 for the
fiscal year ended September 30, 2010 as compared to a net loss of $951,000 for the same period in
2009.
Cash Flow Used in Investing Activities
We experienced a significant decrease in cash used in investing activities for our fiscal year
ended September 30, 2010 as compared to 2009. This decrease was primarily a result of the cash
used for construction activities which occurred during our fiscal year ended September 30, 2009.
Cash Flow Used For Financing Activities
We experienced a significant increase in cash used for financing activities in our fiscal year
ended September 30, 2010 as compared to the same period in 2009. This is primarily a result of
paying down our debt. We received no proceeds from our long term debt and made payments of
approximately $19,239,000 for the fiscal year ended September 30, 2010. For the fiscal year ended
September 30, 2009 we received proceeds from our long-term debt of approximately $24,807,000 and
made payments of approximately $1,795,000.
30
Table of Contents
The following table shows cash flows for the fiscal years ended September 30, 2009 and 2008:
| Year ended September 30, | ||||||||
| 2009 | 2008 | |||||||
Net cash used in operating activities |
$ | (2,244,876 | ) | $ | (1,894,355 | ) | ||
Net cash used in investing activities |
(13,931,689 | ) | (59,289,152 | ) | ||||
Net cash provided by financing activities |
22,980,155 | 61,005,541 | ||||||
Cash Flow Used in Operating Activities
We experienced an increase in net cash used in operating activities for the fiscal year ended
September 30, 2009 as compared to the same period in 2008. Overall net cash used in operating
activities increased due to the Company having accounts receivable and inventory as the plant
became operational, miscellaneous receivables related to railroad refunds, and increased in prepaid
expenses primarily related to insurance and natural gas purchases. The impact of these changes
increased cash used for operations by approximately $11.9 million. This increase in cash used for
operating activities, was offset by cash provided by operating activities of approximately $4.3
million from changes in accounts payable, accounts payable — corn, deposits on corn and accrued
expenses. In addition, the Company began depreciating assets when they were placed in service
during the first quarter of fiscal 2009, which resulted in an add back of approximately $8.1
million of cash provided by operating activities. During our 2009 fiscal year, our capital needs
were being adequately met through cash from our operating activities and our credit facilities.
Cash Flow Used in Investing Activities
We experienced a significant decrease in cash used in investing activities for our fiscal year
ended September 30, 2009 as compared to 2008. This decrease was primarily a result of the
completion of our ethanol plant during the first quarter of our 2009 fiscal year. Our plant was
nearly complete by the end of our fiscal year ending September 30, 2008, accordingly most of the
cash used for construction activities occurred during our fiscal year ended September 30, 2008.
Cash Flow Provided by Financing Activities
We experienced a significant reduction in cash provided by financing activities in our fiscal
year ended September 30, 2009 as compared to the same period in 2008 primarily as a result of the
completion of plant construction in 2008.
Short Term and Long Term Debt Source
On December 19, 2006, we entered into a loan agreement with First National Bank of Omaha
establishing a senior credit facility for the construction of our plant. The credit facility was
in the amount of $96,000,000, consisting of an $83,000,000 construction note, a $10,000,000
revolving line of credit and a $3,000,000 letter of credit. We also entered into an interest rate
swap agreement for $41,500,000 of the construction term loan in order to achieve a fixed rate on a
portion of this loan.
In April 2009, the construction loan was converted into multiple term loans one of which was a
$41,500,000 Fixed Rate Note, which will be applicable to the interest rate swap agreement, a
$31,500,000 Variable Rate Note, and a $10,000,000 Long Term Revolving Note. The term loans have a
maturity of five years with a ten-year amortization.
Line of Credit
In February 2010, we extended and amended the $10,000,000 revolving line of credit to expire
in February 2011 and changed the interest rate charged on the short-term revolving line of credit
to the greater of the three month LIBOR rate plus 400 basis points or 5%. The spread on the three
month LIBOR rate will adjust down based on the Company meeting certain debt to net worth ratios,
measured quarterly. Prior to this amendment, interest on the revolving line of credit was charged
at the greater of the 1-month LIBOR rate plus 300 basis points or 5%. At September 30, 2010 and
September 30, 2009, there were no outstanding borrowings on the revolving line of credit.
31
Table of Contents
Fixed Rate Note
As indicated above, we have an interest rate swap agreement in connection with the Fixed Rate
Note payable to our senior lender. This interest rate swap helps protect our exposure to increases
in interest rates and the swap effectively fixes the rate on the loan at 8.11% until April 2014.
As of September 30, 2010 and September 30, 2009 we had an interest rate swap with a fair value of
approximately $4,651,000 and $4,132,000, respectively, recorded in current and long term
liabilities.
The Fixed Rate Note will accrue interest at a rate equal to the three month LIBOR rate plus
300 basis points. We began repaying principal on the Fixed Rate Note beginning in July 2009. The
outstanding balance on this note was approximately $37,996,000 and $40,817,000 at September 30,
2010 and September 30, 2009, respectively, and is included in current liabilities and long-term
debt.
Variable Rate Note and Long Term Revolving Note
We are required to make quarterly payments of approximately $1,546,000 to be applied first to
accrued interest on the long term revolving note, then to accrued interest on the variable rate
note and finally to principal on the variable rate note. These payments began in July 2009 and
continue through April 2014. In regards to the amendment in February 2010, the Company made
mandatory excess cash flow payments of $1,000,000 in February 2010 and June 2010 that were applied
to the principal of the variable rate note. The maximum availability on the
long term revolving note is reduced by $250,000 each quarter. Interest on the variable rate note
accrues at the greater of the three month LIBOR rate plus 300 basis points or 5%. At June 30,
2010, the interest rate was 5%. The spread over the three month LIBOR rate shall adjust down based
on the Company meeting certain debt to net worth ratios, measured quarterly. Interest on the long
term revolving note accrues at the greater of the three month LIBOR rate plus 300 basis points or
5%. At June 30, 2010, the interest rate was 5%. The spread over the three month LIBOR rate shall
adjust down based on our compliance with certain debt to net worth ratios, measured quarterly. At
September 30, 2010 and September 30, 2009, the balance on the variable rate note was approximately
$24,420,000 and $30,728,000, respectively. At September 30, 2009 the balance on the long term
revolving loan was $9,750,000. At September 30, 2010 there were no outstanding borrowings on the
long term revolving note, as we repaid the long term revolving note in full. The maximum
availability on the long term revolving note at September 30, 2010 was $8,750,000.
Corn Oil Extraction Note
Effective July 31, 2008, we amended our construction loan agreement to include a new loan up
to the maximum amount of $3,600,000 for the purchase and installation of a corn oil extraction
system and related equipment. On April 8, 2009, the corn oil extraction note converted into a Corn
Oil Extraction Term Note, which accrues interest at a rate equal to 3-month LIBOR plus 300 basis
points, or 5%, whichever is greater. The principal amount of the Corn Oil Extraction Term Note is
payable in equal quarterly installments of $90,000, plus accrued interest, which we began paying in
July 2009. As of September 30, 2010, we had $3,150,000 outstanding on our corn oil extraction
loan. At September 30, 2009, we had $3,510,000 outstanding on the corn oil extraction loan.
Letter of Credit
We had one letter of credit outstanding as of June 30, 2010 and September 30, 2009 for
$450,000, which was issued in August 2009 to replace our electrical services security deposit.
32
Table of Contents
Covenants
The loans are secured by our assets and material contracts. In addition, during the term of
the loans, we will be subject to certain financial covenants consisting of a minimum fixed charge
coverage ratio, minimum net worth, and minimum working capital. We are required to maintain a
fixed charge coverage ratio of no less than 1.25:1.0 for all periods after April 8, 2009. For the
first fiscal quarter after April 8, 2009 our fixed charge coverage ratio is measured on a rolling
one quarter basis, for the second fiscal quarter after April 8, 2009 our fixed charge coverage
ratio is measured on a rolling two quarter basis, and for the third fiscal quarter after April 8,
2009 our fixed charge coverage ratio is measured on a rolling three quarter basis. Thereafter, our
fixed charge coverage ratio will be measured on a rolling four quarter basis. Our fixed charge
coverage ratio is calculated by comparing our “adjusted” EBITDA, meaning EBITDA less taxes, capital
expenditures and allowable distributions, to our scheduled payments of the principal and interest
on our obligations to our lender, other than principal repaid on our revolving loan and long term
revolving note.
We are also required to maintain a minimum net worth of $65,000,000, measured annually at the
end of each fiscal year. In subsequent years, our minimum net worth requirement will increase by
the greater of $500,000 or the amount of undistributed earnings accumulated during the prior fiscal
year.
We are also required to maintain a minimum amount of working capital, which is calculated as
our current assets plus the amount available for drawing under our long term revolving note, less
current liabilities. Beginning August 1, 2009 through November 30, 2009, our minimum working
capital had to be $4,000,000. Beginning December 1, 2009 through April 30, 2010, our minimum
working capital had to be $7,000,000. After May 1, 2010, our minimum working capital must be
$10,000,000.
Our loan agreement requires us to obtain prior approval from our lender before making, or
committing to make, capital expenditures in an aggregate amount exceeding $1,000,000 in any single
fiscal year. In connection with the amendment done in February 2010, the bank increased the fiscal
2010 capital expenditure limit to $4,523,800. For fiscal year 2011, the capital expenditure amount
will go back to $1,000,000. We may make distributions to our members to cover their respective tax
liabilities. In addition, we may also distribute up to 70%
of net income provided we maintain certain leverage ratios and are in compliance with all
financial ratio requirements and loan covenants before and after any such distributions are made to
our members.
We were in compliance with all covenants at September 30, 2010 and we anticipate that we will
continue to meet these covenants through October 1, 2011.
We have working capital of approximately $11,337,000, excluding additional amounts available
under our long term revolving note at September 30, 2010. Working Capital as defined by our loan
agreement was approximately $21,607,000 at September 30, 2010. This includes the additional
amounts available under our long term revolving note and the current portion of the interest rate
swap. We anticipate that our current margins will be sufficient to generate enough cash flow to
maintain operations, service our debt and comply with our financial covenants in our loan
agreements. However, significant uncertainties in the market continue to exist. Due to current
commodity markets, we may produce at negative margins and therefore, we will continue to evaluate
our liquidity needs for the upcoming months.
We will continue to work with our lenders to try to ensure that the agreements and terms of
the loan agreements are met going forward. However, we cannot provide any assurance that our
actions will result in sustained profitable operations or that we will not be in violation of our
loan covenants or in default on our principal payments. Presently, we are meeting our liquidity
needs and complying with our financial covenants and the other terms of our loan agreements.
Should market conditions change radically, and we violate the terms or covenants of our loan or
fail to obtain a waiver of any such term or covenant, our primary lender could deem us in default
of our loans and require us to immediately repay a significant portion or possibly the entire
outstanding balance of our loans. Our lender could also elect to proceed with a foreclosure action
on our plant.
Tax Abatement
In October 2006, the real estate that our plant was constructed on was determined to be an
economic revitalization area, which qualified us for tax abatement. The abatement period is for a
ten year term, with an effective date beginning calendar year end 2009 for the property taxes
payable in calendar year 2010. The program allows for 100% abatement of property taxes beginning
in year 1, and then decreases on a ratable scale so that in year 11 the full amount of property
taxes are due and payable. We must apply annually and meet specified criteria to qualify for the
abatement program.
33
Table of Contents
Contractual Cash Obligations
In addition to our long-term debt obligations, we have certain other contractual cash
obligations and commitments. The following tables provide information regarding our consolidated
contractual obligations and approximate commitments as of September 30, 2010:
| Payment Due By Period | ||||||||||||||||||||
| One to | Three to | |||||||||||||||||||
| Less than | Three | Five | After Five | |||||||||||||||||
| Contractual Cash Obligations | Total | One Year | Years | Years | Years | |||||||||||||||
Long-Term Debt Obligations |
$ | 65,583,421 | $ | 9,395,041 | $ | 56,188,380 | $ | — | $ | — | ||||||||||
Operating Lease Obligations |
3,328,194 | 1,084,800 | 2,243,394 | — | — | |||||||||||||||
Purchase Obligations |
36,111,691 | 33,365,354 | 2,746,337 | — | — | |||||||||||||||
Total Contractual Cash Obligations |
$ | 105,023,306 | $ | 43,845,195 | $ | 61,178,111 | $ | — | $ | — | ||||||||||
The long-term debt obligations in the table above include both principal and
interest payments, excluding interest payments on the line of credit, at the interest rates
applicable to the obligations as of September 30, 2010.
Off-Balance Sheet Arrangements
We do not have any off-balance sheet arrangements.
| ITEM 7A. | QUANTITATIVE AND QUALITATIVE DISCLOSURES ABOUT MARKET RISK. |
We are exposed to the impact of market fluctuations associated with interest rates and
commodity prices as discussed below. We have no exposure to foreign currency risk as all of our
business is conducted in U.S. Dollars. We use derivative financial instruments as part of an
overall strategy to manage market risk. We use cash, futures and option contracts to hedge changes
to the commodity prices of corn and natural gas. We do not enter into these derivative financial
instruments for trading or speculative purposes, nor do we designate these contracts as hedges for
accounting purposes. We used derivative financial instruments to alter our exposure to interest
rate risk. We entered into an interest rate swap agreement that we designated as a cash flow
hedge.
Interest Rate Risk
We are exposed to market risk from changes in interest rates. Exposure to interest rate risk
results primarily from holding a revolving line of credit and a term loan which bear variable
interest rates. Specifically, we have approximately $28,000,000 outstanding in variable rate,
long-term debt as of September 30, 2010. Our interest rate on our variable rate, long-term debt
has a minimum interest rate of 5%. Currently, our interest rate on our variable rate, long-term
debt is at 5%.
Below is a sensitivity analysis we prepared regarding our income exposure to changes in
interest rates. The sensitivity analysis below shows the anticipated effect on our income from a
10% adverse change in interest rates for a one year period.
| Outstanding Approximate | ||||||||||||||
| Variable Rate Debt at | Interest Rate at | Adverse 10% change in | Annual Adverse change to | |||||||||||
| September 30, 2010 | September 30, 2010 | Interest Rates | Income | |||||||||||
| $ | 28,000,000 | 5.0 | % | 0.5 | % | $ | 140,000 | |||||||
In addition, we hold a revolving line of credit which bears a variable interest rate. At
September 30, 2010, we have no outstanding borrowings on our revolving line of credit. However, we
may borrow on this line of credit at any time which would expose us to interest rate market risk.
The specifics of each note are discussed in greater detail in “Item 7 — Management’s Discussion and Analysis of Financial Condition and Results of
Operations —Liquidity and Capital Resources.”
34
Table of Contents
We manage our floating rate debt using an interest rate swap. We entered into a fixed rate
swap to alter our exposure to the impact of changing interest rates on our results of operations
and future cash outflows for interest. We use interest rate swap contracts to separate interest
rate risk management from the debt funding decision. The interest rate swaps held by us as of
September 30, 2010 qualified as a cash flow hedge. For this qualifying hedge, the effective
portion of the change in fair value is recognized through earnings when the underlying transaction
being hedged affects earnings, allowing a derivative’s gains and losses to offset related results
from the hedged item on the income statement. As of September 30, 2010 our interest rate swap had
a fair value of approximately $4,651,000.
Commodity Price Risk
We seek to minimize the risks from fluctuations in the prices of raw material inputs, such as
corn and natural gas, and finished products, such as ethanol and distiller’s grains, through the
use of hedging instruments. In practice, as markets move, we actively manage our risk and adjust
hedging strategies as appropriate. Although we believe our hedge positions accomplish an economic
hedge against our future purchases and sales, management has chosen not to use hedge accounting,
which would match the gain or loss on our hedge positions to the specific commodity purchase being
hedged. We are using fair value accounting for our hedge positions, which means as the current
market price of our hedge positions changes, the realized or unrealized gains and losses are
immediately recognized in our cost of goods sold or as an offset to revenues. The immediate
recognition of hedging gains and losses under fair value accounting can cause net income to be volatile from quarter to quarter
due to the timing of the change in value of the derivative instruments relative to the cost and use
of the commodity being hedged.
As corn prices move in reaction to market trends and information, our income statement will be
affected depending on the impact such market movements have on the value of our derivative
instruments. Depending on market movements, crop prospects and weather, these price protection
positions may cause immediate adverse effects, but are expected to produce long-term positive
growth for us. As of September 30, 2010, we had price protection in place for approximately 18.5%
of our anticipated corn needs for the next 12 months. In addition, we had price protection in
place for approximately 4% of our natural gas needs for the next 12 months.
A sensitivity analysis has been prepared to estimate our exposure to ethanol, corn and natural
gas price risk. Market risk related to these factors is estimated as the potential change in income
resulting from a hypothetical 10% adverse change in the average cost of our corn and natural gas
prices and average ethanol price as of September 30, 2010, net of the forward and future contracts
used to hedge our market risk for corn and natural gas usage requirements. The volumes are based
on our expected use and sale of these commodities for a one year period from September 30, 2010.
The results of this analysis, which may differ from actual results, are approximately as follows:
| Hypothetical | ||||||||||||||||
| Estimated Volume | Adverse Change in | |||||||||||||||
| Requirements for the next 12 | Price as of | Approximate | ||||||||||||||
| months (net of forward and | September 30, | Adverse Change to | ||||||||||||||
| futures contracts) | Unit of Measure | 2010 | Income | |||||||||||||
Natural Gas |
3,162,500 | MMBTU | 10 | % | $ | 1,160,000 | ||||||||||
Ethanol |
115,000,000 | Gallons | 10 | % | $ | 24,380,000 | ||||||||||
Corn |
42,000,000 | Bushels | 10 | % | $ | 19,572,000 | ||||||||||
Liability Risk
We participate in a captive reinsurance company (the “Captive”). The Captive reinsures losses
related to worker’s compensation, commercial property and general liability. Premiums are accrued
by a charge to income for the period to which the premium relates and is remitted by our insurer to
the captive reinsurer. The Captive reinsures catastrophic losses in excess of a predetermined
amount. Our premiums are structured such that we have made a prepaid collateral deposit estimated
for losses related to the above coverage. The Captive insurer has estimated and collected an
amount in excess of the estimated losses but less than the catastrophic loss limit insured by the
Captive. We cannot be assessed in excess of the amount in the collateral fund.
35
Table of Contents
| ITEM 8. | FINANCIAL STATEMENTS AND SUPPLEMENTARY DATA. |

REPORT OF INDEPENDENT REGISTERED PUBLIC ACCOUNTING FIRM
To the Board of Directors and
Members of Cardinal Ethanol, LLC
Members of Cardinal Ethanol, LLC
We have audited the accompanying balance sheets of Cardinal Ethanol, LLC as of September 30, 2010
and 2009, and the related statements of operations, members’ equity, and cash flows for each of the
fiscal years in the three year period ended September 30, 2010. Cardinal Ethanol, LLC’s management
is responsible for these financial statements. Our responsibility is to express an opinion on
these financial statements based on our audits.
We conducted our audits in accordance with the standards of the Public Company Accounting Oversight
Board (PCAOB). Those standards require that we plan and perform the audit to obtain reasonable
assurance about whether the financial statements are free of material misstatement. The Company is
not required to have, nor were we engaged to perform, an audit of its internal control over
financial reporting. Our audit included consideration of internal control over financial reporting
as a basis for designing audit procedures that are appropriate in the circumstances, but not for
the purpose of expressing an opinion on the effectiveness of the company’s internal control over
financial reporting. Accordingly, we express no such opinion. An audit also includes examining, on
a test basis, evidence supporting the amounts and disclosures in the financial statements,
assessing the accounting principles used and significant estimates made by management, as well as
evaluating the overall financial statement presentation. We believe that our audits provide a
reasonable basis for our opinion.
In our opinion, the financial statements referred to above present fairly, in all material
respects, the financial position of Cardinal Ethanol, LLC as of September 30, 2010 and 2009, and
the results of its operations and its cash flows for each of the fiscal years in the three year
period ended September 30, 2010, in conformity with accounting principles generally accepted in the
United States of America.
| /s/ Boulay, Heutmaker, Zibell & Co. P.L.L.P | ||||
Minneapolis, Minnesota
December 23, 2010
December 23, 2010
F-1
Table of Contents
CARDINAL ETHANOL, LLC
Balance Sheet
| September 30, 2010 | September 30, 2009 | |||||||
ASSETS |
||||||||
Current Assets |
||||||||
Cash |
$ | 3,317,820 | $ | 7,265,125 | ||||
Trade accounts receivable |
13,262,640 | 5,945,146 | ||||||
Miscellaneous receivables |
1,030,197 | 1,021,479 | ||||||
Inventories |
8,333,140 | 5,791,302 | ||||||
Deposits |
409,940 | 1,045,079 | ||||||
Prepaid and other current assets |
965,099 | 846,771 | ||||||
Derivative instruments |
1,970,877 | 135,012 | ||||||
Total current assets |
29,289,713 | 22,049,914 | ||||||
Property and Equipment |
||||||||
Land and land improvements |
21,082,869 | 20,978,132 | ||||||
Plant and equipment |
117,122,818 | 116,888,805 | ||||||
Building |
6,991,721 | 6,991,721 | ||||||
Office equipment |
316,219 | 307,494 | ||||||
Vehicles |
31,928 | 31,928 | ||||||
Construction in process |
3,480,322 | — | ||||||
| 149,025,877 | 145,198,080 | |||||||
Less accumulated depreciation |
(16,245,531 | ) | (7,988,509 | ) | ||||
Net property and equipment |
132,780,346 | 137,209,571 | ||||||
Other Assets |
||||||||
Deposits |
80,000 | 368,808 | ||||||
Investment |
266,583 | — | ||||||
Financing costs, net of amortization |
505,149 | 699,959 | ||||||
Total other assets |
851,732 | 1,068,767 | ||||||
Total Assets |
$ | 162,921,791 | $ | 160,328,252 | ||||
LIABILITIES AND EQUITY |
||||||||
Current Liabilities |
||||||||
Accounts payable |
$ | 2,154,370 | $ | 1,329,785 | ||||
Accounts payable- corn |
3,266,780 | 1,556,398 | ||||||
Construction retainage payable |
351,700 | 351,700 | ||||||
Accrued expenses |
1,264,755 | 1,533,963 | ||||||
Derivative instruments |
1,520,315 | 861,569 | ||||||
Current maturities of long-term debt and capital lease obligations |
9,395,041 | 7,402,860 | ||||||
Total current liabilities |
17,952,961 | 13,036,275 | ||||||
Long-Term Debt and Capital Lease Obligations |
56,188,380 | 77,427,000 | ||||||
Derivative Instruments |
3,130,402 | 3,269,980 | ||||||
Commitments and Contingencies |
||||||||
Members’ Equity |
||||||||
Members’ contributions, net of cost of raising capital,14,606
units issued and outstanding |
70,912,213 | 70,912,213 | ||||||
Accumulated other comprehensive loss |
(4,650,717 | ) | (4,131,549 | ) | ||||
Retained earnings (deficit) |
19,388,552 | (185,667 | ) | |||||
Total members’ equity |
85,650,049 | 66,594,997 | ||||||
Total Liabilities and Members’ Equity |
$ | 162,921,791 | $ | 160,328,252 | ||||
Notes to Financial Statements are an integral part of this Statement.
F-2
Table of Contents
CARDINAL ETHANOL, LLC
Condensed Statements of Operations
| Fiscal Year Ended | Fiscal Year Ended | Fiscal Year Ended | ||||||||||
| September 30, 2010 | September 30, 2009 | September 30, 2008 | ||||||||||
Revenues |
$ | 224,807,338 | $ | 167,738,057 | $ | — | ||||||
Cost of Goods Sold |
||||||||||||
Cost of goods sold |
$ | 195,880,762 | $ | 159,079,141 | $ | — | ||||||
Lower of cost or market adjustment |
— | 1,595,476 | — | |||||||||
Total |
195,880,762 | 160,674,617 | — | |||||||||
Gross Profit (Loss) |
28,926,576 | 7,063,440 | — | |||||||||
Operating Expenses |
||||||||||||
Professional fees |
612,115 | 757,950 | 363,758 | |||||||||
General and administrative |
3,123,415 | 2,968,101 | 902,600 | |||||||||
Total |
3,735,530 | 3,726,051 | 1,266,368 | |||||||||
Operating Income (Loss) |
25,191,046 | 3,337,389 | (1,266,368 | ) | ||||||||
Other Income (Expense) |
||||||||||||
Grant income |
— | 24,702 | 143,862 | |||||||||
Interest and dividend income |
2,792 | 2,654 | 108,440 | |||||||||
Interest expense |
(4,797,649 | ) | (4,345,390 | ) | — | |||||||
Miscellaneous income |
54,390 | 29,460 | 5,812 | |||||||||
Total |
(4,740,467 | ) | (4,288,574 | ) | 258,114 | |||||||
Net Income (Loss) |
$ | 20,450,579 | $ | (951,185 | ) | $ | (1,008,254 | ) | ||||
Weighted Average Units Outstanding — basic and diluted |
14,606 | 14,606 | 14,606 | |||||||||
Net Income (Loss) Per Unit — basic and diluted |
$ | 1,400.15 | $ | (65.12 | ) | $ | (69.03 | ) | ||||
Distributions Per Unit |
$ | 60.00 | $ | — | $ | — | ||||||
Notes to Financial Statements are an integral part of this Statement.
F-3
Table of Contents
CARDINAL ETHANOL, LLC
Statements of Cash Flows
| Fiscal Year Ended | Fiscal Year Ended | Fiscal Year Ended | ||||||||||
| September 30, 2010 | September 30, 2009 | September 30, 2008 | ||||||||||
Cash Flows from Operating Activities |
||||||||||||
Net income (loss) |
$ | 20,450,579 | $ | (951,185 | ) | $ | (1,008,254 | ) | ||||
Adjustments to reconcile net income (loss) to net cash from operations: |
||||||||||||
Depreciation and amortization |
8,451,832 | 8,099,316 | 33,077 | |||||||||
Change in fair value of derivative instruments |
2,424,135 | (3,072,937 | ) | — | ||||||||
Loss on sale of fixed asset |
— | — | 1,472 | |||||||||
Dividend income |
(266,583 | ) | — | — | ||||||||
Lower of cost or market adjustments to inventory |
— | 1,595,476 | — | |||||||||
Change in assets and liabilities: |
||||||||||||
Trade accounts receivables |
(7,317,494 | ) | (5,945,146 | ) | — | |||||||
Miscellaneous receivable |
(8,718 | ) | (994,479 | ) | (22,460 | ) | ||||||
Interest receivable |
— | — | 21,618 | |||||||||
Inventories |
(2,541,838 | ) | (7,386,778 | ) | — | |||||||
Prepaid and other current assets |
(118,328 | ) | (789,048 | ) | (37,924 | ) | ||||||
Deposits |
923,947 | 322,563 | (1,097,450 | ) | ||||||||
Derivative instruments |
(4,260,000 | ) | 2,937,925 | — | ||||||||
Accounts payable |
824,585 | 1,153,663 | 141,822 | |||||||||
Accounts payable-corn |
1,709,592 | 1,556,398 | — | |||||||||
Accrued expenses |
(330,915 | ) | 1,229,356 | 73,744 | ||||||||
Net cash provided by (used for) operating activities |
19,940,794 | (2,244,876 | ) | (1,894,355 | ) | |||||||
Cash Flows from Investing Activities |
||||||||||||
Capital expenditures |
(284,978 | ) | (912,507 | ) | (846,152 | ) | ||||||
Payments for construction in process |
(3,480,322 | ) | (13,019,182 | ) | (79,043,000 | ) | ||||||
Proceeds from investments, net |
— | — | 20,600,000 | |||||||||
Net cash used for investing activities |
(3,765,300 | ) | (13,931,689 | ) | (59,289,152 | ) | ||||||
Cash Flows from Financing Activities |
||||||||||||
Dividends paid |
(876,360 | ) | — | — | ||||||||
Payments for financing costs |
— | (24,744 | ) | 112,399 | ||||||||
Payments for capital lease obligations |
(7,770 | ) | (7,245 | ) | — | |||||||
Proceeds from long-term debt |
— | 24,806,928 | 61,117,940 | |||||||||
Payments on long-term debt |
(19,238,669 | ) | (1,794,784 | ) | — | |||||||
Net cash provided by (used for) financing activities |
(20,122,799 | ) | 22,980,155 | 61,005,451 | ||||||||
Net Increase (Decrease) in Cash |
(3,947,305 | ) | 6,803,590 | (177,966 | ) | |||||||
Cash — Beginning of Period |
7,265,125 | 461,535 | 639,501 | |||||||||
Cash — End of Period |
$ | 3,317,820 | $ | 7,265,125 | $ | 461,535 | ||||||
Notes to Financial Statements are an integral part of this Statement.
F-4
Table of Contents
CARDINAL ETHANOL, LLC
Statements of Cash Flows
| Fiscal Year Ended | Fiscal Year Ended | Fiscal Year Ended | ||||||||||
| September 30, 2010 | September 30, 2009 | September 30, 2008 | ||||||||||
Supplemental Cash Flow Information |
||||||||||||
Interest paid, net of $0 and $387,167 and $1,533,995 capitalized, respectively |
$ | 5,067,484 | $ | 2,874,893 | $ | — | ||||||
Supplemental Disclosure of Noncash Investing and Financing Activities |
||||||||||||
Construction costs in construction retainage and accounts payable |
$ | — | $ | 351,700 | $ | 9,429,538 | ||||||
Interest paid by debt financing |
— | — | $ | 675,132 | ||||||||
Financing costs in accounts payable |
— | — | 12,000 | |||||||||
Change in derivative instruments included in accumulated other comprehensive loss |
(519,168 | ) | (2,378,351 | ) | (1,530,692 | ) | ||||||
Accrued interest capitalized in construction process |
— | — | 214,785 | |||||||||
Amortization of financing costs capitalized |
— | 17,243 | 56,699 | |||||||||
Capital expenditures included in accrued expenses |
62,497 | — | — | |||||||||
Notes to Financial Statements are an integral part of this Statement.
F-5
Table of Contents
CARDINAL ETHANOL, LLC
Statement of Changes in Members’ Equity
| Accumulated | ||||||||||||
| Retained | Other | |||||||||||
| Member | Earnings | Comprehensive | ||||||||||
| Contributions | (Deficit) | Loss | ||||||||||
Balance — October 1, 2007 |
70,912,213 | 1,773,772 | (222,506 | ) | ||||||||
Net loss for year ended September 30, 2008 |
— | (1,008,254 | ) | — | ||||||||
Other comprehensive loss |
||||||||||||
Unrealized loss on derivative contracts, net |
— | — | (1,530,692 | ) | ||||||||
Balance — September 30, 2008 |
70,912,213 | 765,518 | (1,753,198 | ) | ||||||||
Net loss for year ended September 30, 2009 |
— | (951,185 | ) | — | ||||||||
Other comprehensive income |
||||||||||||
Unrealized loss on derivative contracts, net |
— | — | (2,378,351 | ) | ||||||||
Balance — September 30, 2009 |
$ | 70,912,213 | $ | (185,667 | ) | $ | (4,131,549 | ) | ||||
Net income for year ended September 30, 2010 |
— | 20,450,579 | — | |||||||||
Members Distributions |
(876,360 | ) | ||||||||||
Other comprehensive income |
||||||||||||
Unrealized loss on derivative contracts, net |
— | — | (519,168 | ) | ||||||||
Balance — September 30, 2010 |
$ | 70,912,213 | $ | 19,388,552 | $ | (4,650,717 | ) | |||||
Notes to Financial Statements are an integral part of this Statement.
F-6
Table of Contents
CARDINAL ETHANOL, LLC
Notes to Financial Statements
Notes to Financial Statements
September 30, 2010 and 2009
1. SUMMARY OF SIGNIFICANT ACCOUNTING POLICIES
Nature of Business
Cardinal Ethanol, LLC, (an Indiana Limited Liability Company) was organized in February 2005 to
pool investors to build a 100 million gallon annual production ethanol plant near Union City,
Indiana. The Company was formed on February 7, 2005 to have a perpetual life. The Company was
originally named Indiana Ethanol, LLC and changed its name to Cardinal Ethanol, LLC effective
September 27, 2005. The construction of the ethanol plant was substantially completed in November
2008 and began operations at that time. Prior to November 2008, the Company was in the development
stage with its efforts being principally devoted to organizational activities and construction of
the plant.
Fiscal Reporting Period
The Company has adopted a fiscal year ending September 30 for reporting financial operations.
Accounting Estimates
Management uses estimates and assumptions in preparing these financial statements in accordance
with generally accepted accounting principles. Those estimates and assumptions affect the reported
amounts of assets and liabilities, the disclosure of contingent assets and liabilities, and the
reported revenues and expenses. The Company uses estimates and assumptions in accounting for the
following significant matters, among others, the useful lives of fixed assets, allowance for
doubtful accounts, the valuation of basis and delay price contracts on corn purchases, the
valuation of derivatives, inventory, fixed assets, and inventory purchase commitments. Actual
results may differ from previously estimated amounts, and such differences may be material to the
financial statements. The Company periodically reviews estimates and assumptions, and the effects
of revisions are reflected in the period in which the revision is made.
Cash
The Company maintains its accounts primarily at two financial institutions. At times throughout
the year the Company’s cash balances may exceed amounts insured by the Federal Deposit Insurance
Corporation.
Accounts Receivable
Credit terms are extended to customers in the normal course of business. The Company performs
ongoing credit evaluations of its customers’ financial condition and, generally, requires no
collateral.
Accounts receivable are recorded at their estimated net realizable value. Accounts are considered
past due if payment is not made on a timely basis in accordance with the Company’s credit terms.
Amounts considered uncollectible are written off. The Company’s estimate of the allowance for
doubtful accounts is based on historical experience, its evaluation of the current status of
receivables, and unusual circumstances, if any. At September 30, 2010 and September 30,2009, the
Company was of the belief that such amounts would be collectible and thus an allowance was not
considered necessary. It is at least possible this estimate will change in the future.
Inventories
Inventories are stated at the lower of cost or market. Inventories consist of raw materials, work
in process, finished goods and parts. Corn is the primary raw material. Finished goods consist of
ethanol, dried distiller grains and corn oil. Cost for substantially all inventory is determined
using the lower of (average) cost or market.
F-7
Table of Contents
Property and Equipment
Property and equipment are stated at cost. Depreciation is provided over estimated useful lives by
use of the straight line depreciation method. Maintenance and repairs are expensed as incurred;
major improvements and betterments are capitalized. Depreciation is computed using the
straight-line method over the following useful lives:
Land improvements |
15-20 years | |||
Office building |
10-40 years | |||
Office equipment |
5 years | |||
Plant and process equipment |
10-40 years | |||
As a result of management’s review of depreciable lives and analysis of information available in
the industry, on April 1, 2009, the Company increased its estimate of the useful lives of certain
processing equipment from 15 years to 20 years. As a result of this change the Company recorded
approximately $520,000 less in depreciation expense for the fiscal year ended September 30, 2009.
Long-Lived Assets
The Company reviews its long-lived assets, such as property, plant, and equipment and financing
costs, subject to depreciation and amortization, for impairment whenever events or changes in
circumstances indicate that the carrying amount of an asset may not be recoverable. If
circumstances require a long-lived asset be tested for possible impairment, the Company first
compares undiscounted cash flows expected to be generated by an asset to the carrying value of the
asset. If the carrying value of the long-lived asset is not recoverable on an undiscounted cash
flow basis, impairment is recognized to the extent that the carrying value exceeds its fair value.
Fair value is determined through various valuation techniques including discounted cash flow
models, quoted market values and third-party independent appraisals, as considered necessary.
In November 2008, the Company completed construction of its ethanol production facilities, with
installed capacity of 100 million gallons per year. The carrying value of these facilities at
September 30, 2010 was approximately $133 million and approximately $137 million at September 30,
2009. In accordance with the Company’s policy for evaluating impairment of long-lived assets
described above, management has evaluated the recoverability of the facility based on projected
future cash flows from operations over the facility’s estimated useful life. Management has
determined that the projected future undiscounted cash flows from operations of this facility
exceeds its carrying value at September 30, 2010 and September 30, 2009 therefore, no impairment
loss was indicated or recognized. In determining the projected future undiscounted cash flows, the
Company has made significant assumptions concerning the future viability of the ethanol industry,
the future price of corn in relation to the future price of ethanol and the overall demand in
relation to production and supply capacity. Given the recent completion of the facilities,
replacement cost would likely approximate the carrying value of the facilities. However, there
have been recent transactions between independent parties to purchase plants at prices
substantially below the carrying value of the facilities, some of the facilities have been in
bankruptcy and may not be representative of transactions outside of bankruptcy. Given these
circumstances, should management be required to adjust the carrying value of the facilities to fair
value at some future point in time, the adjustment could be significant and could significantly
impact the Company’s financial position and results of operations. No adjustment has been made in
these financial statements for this uncertainty.
Financing Costs
Costs associated with the issuance of loans are classified as financing costs. Financing costs are
amortized over the term of the related debt by use of the effective interest method, beginning when
the Company draws on the loans. Amortization for the years ended September 30, 2010 and 2009 was
approximately $195,000 and $226,000, respectively.
Grants
The Company recognizes grant proceeds as other income upon complying with the conditions of the
grant. For reimbursements of incremental expenses (expenses the Company otherwise would not have
incurred had it not been
for the grant), the grant proceeds are recognized as a reduction of the related expense. For
reimbursement of capital expenditures, the grants are recognized as a reduction of the basis of the
asset upon complying with the conditions of the grant.
F-8
Table of Contents
Revenue Recognition
The Company generally sells ethanol and related products pursuant to marketing agreements.
Revenues from the production of ethanol and the related products are recorded when the customer has
taken title and assumed the risks and rewards of ownership, prices are fixed or determinable and
collectability is reasonably assured. The Company believes that there are no ethanol sales, during
any given month, which should be considered contingent and recorded as deferred revenue. The
Company’s products are sold FOB shipping point.
In accordance with the Company’s agreements for the marketing and sale of ethanol and related
products, marketing fees, commissions and freight due to the marketers are deducted from the gross
sales price at the time incurred. Commissions were approximately $2,500,000 and $1,950,000 for the
years ended September 30, 2010 and 2009, respectively. Freight was approximately $10,280,000 and
$12,170,000 for the years ended September 30, 2010 and 2009, respectively. Revenue is recorded net
of these commissions and freight as they do not provide an identifiable benefit that is
sufficiently separable from the sale of ethanol and related products.
Derivative Instruments
From time to time the Company enters into derivative transactions to hedge its exposures to
commodity price fluctuations. The Company is required to record these derivatives in the balance
sheet at fair value.
In order for a derivative to qualify as a hedge, specific criteria must be met and appropriate
documentation maintained. Gains and losses from derivatives that do not qualify as hedges, or are
undesignated, must be recognized immediately in earnings. If the derivative does qualify as a
hedge, depending on the nature of the hedge, changes in the fair value of the derivative will be
either offset against the change in fair value of the hedged assets, liabilities, or firm
commitments through earnings or recognized in other comprehensive income until the hedged item is
recognized in earnings. Changes in the fair value of undesignated derivatives are recorded in
earnings.
Additionally, the Company is required to evaluate its contracts to determine whether the contracts
are derivatives. Certain contracts that literally meet the definition of a derivative may be
exempted as “normal purchases or normal sales”. Normal purchases and normal sales are contracts
that provide for the purchase or sale of something other than a financial instrument or derivative
instrument that will be delivered in quantities expected to be used or sold over a reasonable
period in the normal course of business. Contracts that meet the requirements of normal purchases
or sales are documented as normal and exempted from accounting and reporting requirements, and
therefore, are not marked to market in our financial statements.
Fair Value of Financial Instruments
The Company follows guidance for accounting for fair value measurements of financial assets and
financial liabilities and for fair value measurements of nonfinancial items that are recognized or
disclosed at fair value in the consolidated financial statements on a recurring basis. On January
1, 2009, the Company adopted guidance for fair value measurement related to nonfinancial items that
are recognized and disclosed at fair value in the consolidated financial statements on a
nonrecurring basis. The guidance establishes a fair value hierarchy that prioritizes the inputs to
valuation techniques used to measure fair value. The hierarchy gives the highest priority to
unadjusted quoted prices in active markets for identical assets or liabilities (Level 1
measurements) and the lowest priority to measurements involving significant unobservable inputs
(Level 3 measurements). The three levels of the fair value hierarchy are as follows:
| • | Level 1 inputs are quoted prices (unadjusted) in active markets for identical assets
or liabilities that the Company has the ability to access at the measurement date. |
| • | Level 2 inputs are inputs other than quoted prices included within Level 1 that are
observable for the asset or liability, either directly or indirectly. |
||
| • | Level 3 inputs are unobservable inputs for the asset or liability. |
F-9
Table of Contents
The level in the fair value hierarchy within which a fair measurement in its entirety falls is
based on the lowest level input that is significant to the fair value measurement in its entirety.
The carrying value of cash, accounts receivable, accounts payable and accrued liabilities
approximates fair value at September 30, 2010 and 2009 due to the short maturity nature of these
instruments. The fair value of the Company’s debt approximates its carrying value due to its
variable interest rate. The fair value of derivative instruments is disclosed in Note 7.
Capitalization of interest
The Company capitalizes interest cost on construction in progress and capitalized development costs
as required for the portion of interest that is attributable to the historical cost of developing
or constructing the asset. The Company capitalized approximately $1,921,000 of interest through
completion of construction in 2009. These costs have been included in fixed assets as of September
30, 2010 and 2009.
Environmental Liabilities
The Company’s operations are subject to environmental laws and regulations adopted by various
governmental entities in the jurisdiction in which it operates. These laws require the Company to
investigate and remediate the effects of the release or disposal of materials at its location.
Accordingly, the Company has adopted policies, practices and procedures in the areas of pollution
control, occupational health, and the production, handling, storage and use of hazardous materials
to prevent material environmental or other damage, and to limit the financial liability, which
could result from such events. Environmental liabilities are recorded when the liability is
probable and the costs can be reasonably estimated. No liabilities were recorded at September 30,
2010 or 2009.
Net Income (Loss) per Unit
Basic net income (loss) per unit is computed by dividing net income (loss) by the weighted average
number of members’ units outstanding during the period. Diluted net income (loss) per unit is
computed by dividing net income (loss) by the weighted average number of members’ units and
members’ unit equivalents outstanding during the period. There were no member unit equivalents
outstanding during the periods presented; accordingly, the Company’s basic and diluted net income
(loss) per unit are the same.
Income Taxes
Cardinal Ethanol LLC is treated as a partnership for federal and state income tax purposes and
generally does not incur income taxes. Instead, their income or losses are included in the income
tax returns of the members and partners. Accordingly, no provision or liability for federal or
state income taxes has been included in these financial statements. Differences between the
financial statement basis of assets and tax basis of assets is related to capitalization and
amortization of organization and start-up costs for tax purposes, whereas these costs are expensed
for financial statement purposes. In addition, the Company uses the modified accelerated cost
recovery system method (MACRS) for tax depreciation instead of the straight-line method that is
used for book depreciation, which also causes temporary differences.
2. CONCENTRATIONS
One major customer accounted for approximately 93% of the outstanding accounts receivable balance
at September 30, 2010 and 84% of the balance at September 30. 2009. This same customer also
accounted for approximately 85% and 84% of revenue for the year ended September 30, 2010 and 2009,
respectively.
F-10
Table of Contents
3. INCOME TAXES
The differences between financial statement basis and tax basis of assets and liabilities at
September 30, 2010 and 2009 are as follows:
| 2010 | 2009 | |||||||
Financial statement basis of assets |
$ | 162,921,791 | $ | 160,328,252 | ||||
Organization and start-up costs |
1,976,610 | 1,976,610 | ||||||
Book to tax depreciation and amortization |
(47,327,329 | ) | (25,874,665 | ) | ||||
Book to tax derivative instruments |
(1,970,877 | ) | (135,012 | ) | ||||
Income tax basis of assets |
$ | 115,600,195 | $ | 136,295,185 | ||||
Financial statement basis of liabilities |
$ | 77,271,743 | $ | 93,733,255 | ||||
Interest rate swap |
(4,650,717 | ) | (4,131,549 | ) | ||||
Income tax basis of liabilities |
$ | 72,621,026 | $ | 89,601,706 | ||||
4. MEMBERS’ EQUITY
The Company has one class of membership units, which include certain transfer restrictions as
specified in the operating agreement and pursuant to applicable tax and securities laws. Income
and losses are allocated to all members based upon their respective percentage of units held.
In March of 2010, the Company made a distribution of $60.00 per unit for a total of $876,360.
5. INVENTORIES
Inventories consist of the following as of September 30, 2010 and 2009:
| 2010 | 2009 | |||||||
Raw materials |
$ | 2,481,521 | $ | 1,806,167 | ||||
Work in progress |
1,646,842 | 1,348,451 | ||||||
Finished goods |
3,214,725 | 2,021,267 | ||||||
Spare parts |
990,052 | 615,417 | ||||||
Total |
$ | 8,333,140 | $ | 5,791,302 | ||||
For the fiscal year ended September 30 2009, the Company recorded a loss of approximately
$1,595,000 related to inventory where the market value was less than the cost basis, attributable
primarily to decreases in market prices of corn and ethanol for the inventory on hand. The loss
was recorded in cost of goods sold in the statement of operations. No market value adjustments
were required during the fiscal year ended September 30, 2010.
In the ordinary course of business, the Company enters into forward purchase contracts for its
commodity purchases and sales. At September 30, 2010, the Company has forward corn purchase
contracts for various delivery periods through July 2012 for a total commitment of approximately
$34,084,000. Approximately $7,027,000 of the forward corn purchases were with a related party. At
September 30, 2009, the Company had forward corn purchase contracts for various delivery periods
through July 2010 of approximately $5,417,000 with approximately $810,000 due to a related party.
During 2010, the Company began obtaining part of its natural gas needs by using forward purchase
contracts. At September 30, 2010, the Company had forward natural gas purchase contracts with
various delivery periods through December 2010 for a total commitment of approximately $2,027,000.
Given the uncertainty of future ethanol and corn prices, the Company could incur a loss on the
outstanding corn contracts in future periods. Management has evaluated these forward contracts
using a methodology similar to that used in the impairment evaluation with respect to inventory and
has determined that no loss has been incurred on these forward contracts at September 30, 2010 and
2009.
F-11
Table of Contents
6. DERIVATIVE INSTRUMENTS
As of September 30, 2010 and 2009, the Company has entered into corn derivative instruments and
interest rate swap agreements, which are required to be recorded as either assets or liabilities at
fair value in the statement of financial position. Derivatives qualify for treatment as hedges
when there is a high correlation between the change in fair value of the derivative instrument and
the related change in value of the underlying hedged item. The Company must designate the hedging
instruments based upon the exposure being hedged as a fair value hedge, a cash flow hedge or a
hedge against foreign currency exposure. The Company formally documents, designates, and assesses
the effectiveness of transactions that receive hedge accounting initially and on an on-going basis.
The Company does not assess the effectiveness of hedges on an ongoing basis when those hedges were
originally designated under the shortcut method.
Commodity Contracts
The Company enters into commodity-based derivatives, for corn and ethanol, in order to protect cash
flows from fluctuations caused by volatility in commodity prices to protect gross profit margins
from potentially adverse effects of market and price volatility on commodity based purchase
commitments where the prices are set at a future date. These derivatives are not designated as
effective hedges for accounting purposes. For derivative instruments that are not accounted for as
hedges, or for the ineffective portions of qualifying hedges, the change in fair value is recorded
through earnings in the period of change. Commodity derivative changes in fair market value are
included in costs of goods sold.
The table below shows the underlying quantities of corn and ethanol resulting from the short
(selling) positions and long (buying) positions that the Company had to hedge its forward corn
contracts and corn inventory. Corn positions are traded on the Chicago Board of Trade and ethanol
positions are traded on the New York Mercantile Exchange. These derivatives have not been
designated as an effective hedge for accounting purposes. Corn and ethanol derivatives are
forecasted to settle for various delivery periods through March 2012 and November 2010,
respectively as of September 30, 2010.
The following table indicates the bushels of corn under contract as of September 30, 2010 and 2009:
| 2010 | 2009 | |||||||
Short |
5,425,000 | 620,000 | ||||||
Long |
— | 190,000 | ||||||
The following table indicates the gallons of ethanol under contract as of September 30, 2010 and
2009:
| 2010 | 2009 | |||||||
Short |
3,570,000 | — | ||||||
Long |
— | — | ||||||
Interest Rate Swap
The Company manages its floating rate debt using an interest rate swap. The Company entered into a
fixed rate swap to alter its exposure to the impact of changing interest rates on its results of
operations and future cash outflows for interest. Fixed rate swaps are used to reduce the Company’s
risk of the possibility of increased interest costs. Interest rate swap contracts are therefore
used by the Company to separate interest rate risk management from the debt funding decision.
At September 30, 2010 and 2009, the Company had approximately $38,000,000 and $41,000,000
respectively of notional amount outstanding in the swap agreement that exchange variable interest
rates (LIBOR) for fixed interest rates over the terms of the agreements and are designated as cash
flow hedges of the interest rate risk attributable to forecasted variable interest payments. The
effective portion of the fair value gains or losses on this swap is included as a component of
accumulated other comprehensive income loss.
F-12
Table of Contents
The interest rate swaps held by the Company as of September 30, 2010 and 2009 qualified as a cash
flow hedge. For this qualifying hedge, the effective portion of the change in fair value is
recognized through earnings when the underlying transaction being hedged affects earnings, allowing
a derivative’s gains and losses to offset related results from the hedged item on the income
statement.
The following tables provide details regarding the Company’s derivative financial instruments at
September 30, 2010 and 2009:
2010:
| Instrument | Balance Sheet Location | Assets | Liabilities | |||||||
Interest rate swap |
Derivative Instruments — Current | $ | — | $ | 1,520,315 | |||||
Interest rate swap |
Derivative Instruments — Long Term | — | 3,130,402 | |||||||
Corn contracts |
Derivative Instruments — Current | 1,937,660 | — | |||||||
Ethanol contracts |
Derivative Instruments — Current | 33,217 | — | |||||||
2009:
| Instrument | Balance Sheet Location | Assets | Liabilities | |||||||
Interest rate swap |
Derivative Instruments — Current | $ | — | $ | 861,569 | |||||
Interest rate swap |
Derivative Instruments — Long Term | — | 3,269,980 | |||||||
Corn contracts |
Derivative Instruments — Current | 135,012 | — | |||||||
The following tables provide details regarding the gains and (losses) from the Company’s derivative
instruments in other comprehensive income and statement of operations at September 30, 2010:
| Amount of | ||||||||||||||||||||
| (Loss) | Amount of | |||||||||||||||||||
| Reclassified | Gain or (Loss) | |||||||||||||||||||
| Amount of | From | Recognized in | ||||||||||||||||||
| (Loss) | Location of | Accumulated | Income on | |||||||||||||||||
| Recognized In | (Loss) | OCI into | Derivative | |||||||||||||||||
| OCI on | Reclassified | Income on | (ineffective | |||||||||||||||||
| Derivatives in | Derivative - for | From | Derivative - | Location of | portion)Year | |||||||||||||||
| Cash Flow | Year ended | Accumulated | Year ended | (Loss) | ended | |||||||||||||||
| Hedging | September 30, | OCI into | September 30, | Recognized in | September 30, | |||||||||||||||
| Relationship | 2010 | Income | 2010 | Income | 2010 | |||||||||||||||
Interest rate swaps |
$ | (2,440,450 | ) | Interest expense | $ | (1,921,282 | ) | Interest expense | $ | — | ||||||||||
| Derivatives Not Designated as | State of Operations | Year ended | ||||
| Hedging Instruments | Location | September 30, 2010 | ||||
Corn contracts |
Cost of Goods Sold | $ | (2,457,352 | ) | ||
Ethanol contracts |
Cost of Goods Sold | $ | 33,217 | |||
F-13
Table of Contents
| Amount of | ||||||||||||||||||||
| (Loss) | Amount of | |||||||||||||||||||
| Reclassified | Gain or (Loss) | |||||||||||||||||||
| Amount of | From | Recognized in | ||||||||||||||||||
| (Loss) | Location of | Accumulated | Income on | |||||||||||||||||
| Recognized In | (Loss) | OCI into | Derivative | |||||||||||||||||
| OCI on | Reclassified | Income on | (ineffective | |||||||||||||||||
| Derivatives in | Derivative - for | From | Derivative - | Location of | portion)Year | |||||||||||||||
| Cash Flow | Year ended | Accumulated | Year ended | (Loss) | ended | |||||||||||||||
| Hedging | September 30, | OCI into | September 30, | Recognized in | September 30, | |||||||||||||||
| Relationship | 2009 | Income | 2009 | Income | 2009 | |||||||||||||||
Interest rate swaps |
$ | (2,793,043 | ) | Interest expense | $ | (414,692 | ) | Interest expense | $ | — | ||||||||||
| Derivatives Not Designated as | State of Operations | Year ended | ||||
| Hedging Instruments | Location | September 30, 2009 | ||||
Corn contracts |
Cost of Goods Sold | $ | 3,072,937 | |||
7. FAIR VALUE MEASUREMENTS
The following table provides information on those assets measured at fair value on a recurring
basis as of September 30, 2010 and 2009:
| 2010 | ||||||||||||||||||||
| Fair Value Measurement Using | ||||||||||||||||||||
| Carrying Amount | Fair Value | Level 1 | Level 2 | Level 3 | ||||||||||||||||
Interest rate swap liability |
$ | (4,650,717 | ) | $ | (4,650,717 | ) | $ | — | $ | (4,650,717 | ) | $ | — | |||||||
Commodity derivative instruments |
1,970,877 | 1,970,877 | 1,970,877 | — | — | |||||||||||||||
| 2009 | ||||||||||||||||||||
| Fair Value Measurement Using | ||||||||||||||||||||
| Carrying Amount | Fair Value | Level 1 | Level 2 | Level 3 | ||||||||||||||||
Interest rate swap liability |
$ | (4,131,549 | ) | $ | (4,131,549 | ) | $ | — | $ | (4,131,549 | ) | $ | — | |||||||
Commodity derivative instruments |
135,012 | 135,012 | 135,012 | — | — | |||||||||||||||
We determine the fair value of the interest rate swap shown in the table above by using widely
accepted valuation techniques including discounted cash flow analysis on the expected cash flows of
each instrument. The analysis reflects the contractual terms of the swap agreement, including the
period to maturity and uses observable market-based inputs and uses the market standard methodology
of netting the discounted future fixed cash receipts and the discounted expected variable cash
payments. We determine the fair value of commodity derivative instruments by obtaining fair value
measurements from an independent pricing service. The fair value measurements consider observable
data that may include dealer quotes and live trading levels from the Chicago Board of Trade and New
York Mercantile Exchange markets.
F-14
Table of Contents
8. BANK FINANCING
On December 19, 2006, the Company entered into a definitive loan agreement with a financial
institution for a construction loan of up to $83,000,000, a short-term revolving line of credit of
$10,000,000 and letters of credit facility of $3,000,000. In connection with this agreement, the
Company also entered into an interest rate swap agreement fixing the interest rate on $41,500,000
of debt. In April 2009, the construction loan was converted into three separate term loans: a
fixed rate note, a variable rate note, and a long term revolving note. The fixed rate note is
applicable to the interest rate swap agreement. The term loans have a maturity of five years with
a ten-year amortization.
Line of Credit
In December 2009, the Company extended the short-term $10,000,000 revolving line of credit to
February 2010, at
which time the line was further extended to February 2011 which is subject to certain borrowing
base limitations. As of September 30, 2010, interest on the short-term revolving line of credit
will be charged at the greater of the 3-month LIBOR rate plus 400 basis points or 5%. As of
September 30, 2009, interest on the short-term revolving line of credit will be charged at the
greater of the 1-month LIBOR rate plus 300 basis points or 5%. There were no outstanding
borrowings on the line of credit at September 30, 2010 or 2009.
Fixed Rate Note
The Company has an interest rate swap contract in connection with the note payable to its bank that
contains a variable rate. The agreement requires the Company to hedge this note principal balance,
up to $41,500,000, and matures on April 8, 2014. The variable interest rate is determined
quarterly based on the 3-month LIBOR rate plus 300 basis points. The fixed interest rate set by
the swap is 8.11%.
The fair value of the interest rate swap at September 30, 2010 and 2009 was approximately
$4,651,000 and $4,132,000 respectively and is included in current and long term liabilities on the
balance sheet (Note 6). The Company is required to make quarterly principal and accrued interest
payments commencing July 2009 through April 2014. Although the Company may prepay this note, it
would be subject to prepayment penalties to make the bank whole if it did so. The outstanding
balance of this note was approximately $37,996,000 and $40,817,000 at September 30, 2010 and 2009,
respectively, and is included in current liabilities and long-term debt.
Variable Rate Note and Long Term Revolving Note
The Company is required to make quarterly payments of approximately $1,546,000 to be applied first
to accrued interest on the long term revolving note, then to accrued interest on the variable rate
note, then $250,000 on the principle of the long term revolving note and finally to principal on
the variable rate note which commenced July 2009 and continuing through April 2014. Once the
variable rate note is paid in full, the payment shall be applied first to accrued interest on the
long term revolving note and then to the principal outstanding on the long term revolving note
until the balance is paid in full. Interest on the variable rate note accrues at the greater of
the 3-month LIBOR rate plus 300 basis points or 5%. At September 30, 2010 and 2009, the interest
rate was 5%. Interest on the long term revolving note accrues at the greater of the 3-month LIBOR
rate plus 300 basis points or 5%. At September 30, 2010 and 2009, the interest rate was 5%. The
spread over the 3-month LIBOR rate shall adjust down based on the Company meeting certain debt to
net worth ratios, measured quarterly. At September 30, 2010, the balance on the variable rate note
and the long term revolving note was approximately $24,420,000 and $0 respectively. At September
30, 2009, the balance on the variable rate note and the long term revolving note was approximately
$30,728,000 and $9,750,000, respectively.
Corn Oil Extraction Note
In July 2008, the Company and the financial institution extended the construction loan for an
additional $3,600,000 to be used for the installation of a corn oil extraction system and related
equipment. In April 2009, the Corn Oil Extraction note was converted into a term note with
interest at the greater of the 3-month LIBOR rate plus 300 basis points, or 5%, provided no event
of default exists. Principal will be due in quarterly installments of $90,000, plus accrued
interest, commencing in July 2009 through April 2014. The interest shall adjust based on the
Company meeting certain targets, measured quarterly. At September 30, 2010 and 2009, the balance
on the corn oil extraction note was $3,150,000 and $3,510,000, respectively.
F-15
Table of Contents
Letters of Credit
At September 30, 2009, the Company had one letter of credit outstanding for $450,000. The
financial institution issued the letter of credit in August 2009 to replace an electrical services
security deposit (Note 10).
These loans are subject to protective covenants, which restrict distributions and require the
Company to maintain various financial ratios, are secured by all business assets, and require
additional loan payments based on excess cash flow. The covenants went into effect in April 2009.
The Company was in compliance with all covenants at September 30, 2010 and 2009. The Company
anticipates they will meet these covenants through October 1, 2010. A portion of the note will be
subject to an annual, mandatory prepayment, based on excess cash flow, capped at
$4,000,000 annually and $12,000,000 over the life of the loan. For the year ended September 30,
2010, the calculated prepayment of excess cash flow under the terms of the loan is approximately
$2,900,000. The Company paid installments of $1,000,000 in March and June 2010. The remaining
balance is due by January 28, 2011.
Long-term debt, as discussed above, consists of the following at September 30, 2010 and 2009:
| 2010 | 2009 | |||||||
Fixed rate loan |
$ | 37.996,164 | $ | 40,816,864 | ||||
Variable rate loan |
24,420,383 | 30,728,352 | ||||||
Revolving loan |
— | 9,750,000 | ||||||
Corn oil extraction note |
3,150,000 | 3,510,000 | ||||||
Capital lease obligation (note 9) |
16,874 | 24,644 | ||||||
Totals |
65,583,421 | 84,829,860 | ||||||
Less amounts due within one year |
(9,395,041 | ) | (7,402,860 | ) | ||||
Net long-term debt |
$ | 56,188,380 | $ | 77,427,000 | ||||
The estimated maturities of long-term debt at September 30, 2010 are as follows:
2011 |
$ | 9,395,041 | ||
2012 |
9,057,857 | |||
2013 |
9,619,462 | |||
2014 |
37,511,061 | |||
Total long-term debt |
$ | 65,583,421 | ||
9. LEASES
In July 2008, the Company entered into a five-year lease agreement with an unrelated party for 180
covered hopper cars. The Company is paying approximately $480 per car per month beginning in
November 2008 through October 2013. In addition, a surcharge of $0.03 per mile will be assessed
for each mile in excess of 36,000 miles per year a car travels.
The company leases equipment from an unrelated party under a capital lease at an implicit rate of
5.49%. Lease payments began in November 2008 and are payable in monthly installments of $744
through October 2012. As of September 30, 2010 and 2009, costs of leased capital assets were
recorded in machinery and equipment for $31,889.
The Company leases equipment under non-cancelable long-term operating leases. These leases have
initial terms ranging from 4 to 6 years, with minimum monthly payments of $4,000 at September 30,
2010 and 2009.
F-16
Table of Contents
At September 30, 2010, the Company had the following commitments for payments of rentals under
leases which at inception had a non-cancelable term of more than one year:
| Capital | Operating | Total | ||||||||||
2011 |
$ | 8,928 | $ | 1,084,800 | $ | 1,093,728 | ||||||
2012 |
8,928 | 1,084,800 | 1,093,728 | |||||||||
2013 |
744 | 1,068,500 | 1,069,244 | |||||||||
2014 |
— | 90,094 | 90,094 | |||||||||
Total minimum lease commitments |
18,600 | 3,328,194 | 3,346,794 | |||||||||
Less interest |
(1,726 | ) | — | (1,726 | ) | |||||||
Present value of minimum lease payments |
$ | 16,874 | $ | 3,328,194 | $ | 3,346,794 | ||||||
10. COMMITMENTS AND CONTINGENCIES
Corn Procurement
In July 2008, the Company entered into an agreement with an unrelated party to procure 100% of the
corn to be used as feedstock at the Company’s ethanol production facility. The Company pays a
monthly agency fee of $41,667 for the first two years. In following years, the agency fee shall be
equal to an amount per bushel of corn delivered subject to an annual minimum amount. The initial
term of the agreement is for five years to automatically renew for successive three-year periods
unless properly terminated by one of the parties. In October 2008, the ethanol plant began taking
delivery of corn for operations.
Marketing Agreement
The Company entered into an agreement with an unrelated company for the purpose of marketing and
selling all the distillers grains the Company is expected to produce. The buyer agrees to remit a
fixed percentage rate of the actual selling price to the Company for distiller’s dried grain
solubles and wet distiller grains. The agreement may be terminated by either party at its
unqualified option, by providing written notice of not less than 120 days to the other party.
The Company entered into an agreement with an unrelated company to sell all of the ethanol the
Company produces at the plant. The Company agrees to pay a commission of a fixed percent of the
net purchase price for marketing and distribution. In July 2009, the initial term of the agreement
was extended to eight years and the commission increased in exchange for reducing the payment terms
from 20 days to 7 days after shipment.
Utility Agreement
The Company entered into a natural gas services contract with an initial term of ten years and
automatic renewals for up to three consecutive one year periods. Under the contract, the Company
agrees to pay a fixed transportation charge per therm delivered for the first five years. For the
remaining five years, the fixed transportation charge will be increased by the compounded inflation
rate as determined by the Consumer Price Index. The contract commenced in November 2008 when plant
operations began.
Software License Agreement
In October 2009, the Company entered into a license agreement effective September 30, 2009 for
operational software to improve production and reduce costs. The total charge for the license to
use the software is $1,825,000 payable over time as certain milestones are achieved. The Company
will incur approximately $100,000 in additional costs in connection with this agreement as well as
costs related to an annual maintenance fee. As of September 30, 2010, approximately $1,559,000 in
costs have been incurred and included in construction in process on the balance sheet. No costs
were incurred in the period ended September 30, 2009.
F-17
Table of Contents
Development Agreement
In September 2007, the Company entered into a development agreement with Randolph County
Redevelopment Commission (“the Commission”) to promote economic development in the area. Under the
terms of this agreement, beginning in January 2008 through December 2028, the money the Company
pays toward property tax expense is allocated to an expense and an acquisition account. The funds
in the acquisition account can be used by the Commission to purchase equipment, at the Company’s
direction, for the plant. At September 30, 2010 and 2009, there is approximately $109,000 in this
account. However, as the Company does not have title to or control over the funds in the
acquisition account, no amounts have been recorded in the balance sheet relating to this account.
Tax abatement
In October 2006, the real estate that the plant was developed on was determined to be an economic
revitalization area, which qualified the Company for tax abatement. The abatement period is for a
10 year term, with an effective date beginning calendar year end 2009 for the property taxes
payable in calendar year 2010. The program allows for 100% abatement of property taxes beginning
in year 1, and then decreases on a ratable scale so that in year 11 the
full amount of property taxes are due and payable. The Company must apply annually and meet
specified criteria to qualify for the abatement program.
Legal Proceedings
The Company is subject to legal proceedings and claims which arise in the ordinary course of its
business. While the ultimate outcome of these matters is not presently determinable, it is in the
opinion of management that the resolution of outstanding claims will not have a material adverse
effect on the financial position or results of operations of the Company. Due to the uncertainties
in the settlement process, it is at least reasonably possible that management’s view of outcomes
will change in the near term.
11. EMPLOYEE BENEFIT PLAN
The Company has a defined contribution plan available to all of its qualified employees. The
Company contributes up to 100% of the contributions of the employee up to 3% of the eligible salary
of each employee. In order to receive a contribution, the employee must have worked 1,000 hours in
the plan year and be employed as of the last day of the calendar year. The Company contributed
approximately $29,503 and $8,500 to the defined contribution plan during the years ended September
30, 2010 and 2009, respectively.
12. ACCUMULATED OTHER COMPREHENSIVE LOSS AND COMPREHENSIVE LOSS
Accumulated other comprehensive loss consists of changes in the fair value of derivative
instruments that are designated as and meet all of the required criteria for a cash flow hedge.
Changes in accumulated other comprehensive loss all related to the interest rate swap for the years
ended September 30, 2010 and 2009 were as follows:
| 2010 | 2009 | |||||||
Balance at beginning of year |
$ | (4,131,549 | ) | $ | (1,753,198 | ) | ||
Unrealized loss on derivative instruments |
(519,168 | ) | (2,378,351 | ) | ||||
Balance at end of year |
$ | (4,650,717 | ) | $ | (4,131,549 | ) | ||
The statement of comprehensive income (loss) for the years ending September 30, 2010 and 2009 were
as follows:
| 2010 | 2009 | |||||||
Net Income (loss) |
$ | 20,450,579 | $ | (951,185 | ) | |||
Interest rate swap fair value change |
(519,168 | ) | (2,378,351 | ) | ||||
Comprehensive Income (loss) |
$ | 19,931,411 | $ | (3,329,536 | ) | |||
F-18
Table of Contents
13. UNCERTAINTIES IMPACTING THE ETHANOL INDUSTRY AND OUR FUTURE OPERATIONS
The Company has certain risks and uncertainties that it experiences during volatile market
conditions, which can have a severe impact on operations. The Company began operations in November
2008. The Company’s revenues are derived from the sale and distribution of ethanol, distillers
grains and corn oil to customers primarily located in the U.S. Corn for the production process is
supplied to the plant primarily from local agricultural producers and from purchases on the open
market. Ethanol sales average approximately 85% of total revenues and corn costs average 78% of
total cost of goods sold.
The Company’s operating and financial performance is largely driven by prices at which the Company
sells ethanol and distillers grains and the cost of corn. The price of ethanol is influenced by
factors such as prices of supply and demand, weather, government policies and programs, and
unleaded gasoline and the petroleum markets, although since 2005 the prices of ethanol and gasoline
began a divergence with ethanol selling for less than gasoline at the wholesale level. Excess
ethanol supply in the market, in particular, puts downward pressure on the price of ethanol. The
Company’s largest cost of production is corn. The cost of corn is generally impacted by factors
such as supply and demand, weather, government policies and programs. The Company’s risk management
program is used to protect against the price volatility of these commodities.
Management has considered expense reductions that can be made in the upcoming months related to
reduced labor hours, analysis of vendor costs, efficiency of chemical usage, inventory monitoring
for corn, and the possibility of sharing spare part inventories with other ethanol plants. In
addition, management is continually evaluating improved technologies to either earn additional
revenues or reduce operating costs. Management has entered into a software license agreement to
improve production and reduce costs for the upcoming years (Note 10).
14. QUARTERLY FINANCIAL DATA (UNAUDITED)
Summary quarterly results are as follows:
| First | Second | Third | Fourth | |||||||||||||
| Quarter | Quarter | Quarter | Quarter | |||||||||||||
Fiscal year ended September 30, 2010 |
||||||||||||||||
Revenues |
$ | 63,549,871 | $ | 54,805,570 | $ | 47,654,811 | $ | 58,797,086 | ||||||||
Gross profit |
12,951,536 | 8,610,842 | 3,462,355 | 3,901,843 | ||||||||||||
Operating income |
12,047,683 | 7,652,759 | 2,499,980 | 2,990,624 | ||||||||||||
Net income |
10,786,825 | 6,456,611 | 1,330,075 | 1,877,068 | ||||||||||||
Basic and diluted earnings per unit |
$ | 738.52 | $ | 442.05 | $ | 91.06 | $ | 128.51 | ||||||||
| First | Second | Third | Fourth | |||||||||||||
| Quarter | Quarter | Quarter | Quarter | |||||||||||||
Fiscal year ended September 30, 2009 |
||||||||||||||||
Revenues |
$ | 26,272,445 | $ | 47,664,537 | $ | 45,338,895 | $ | 50,712,760 | ||||||||
Gross profit (loss) |
(2,405,958 | ) | (644,990 | ) | 3,977,120 | 6,137,267 | ||||||||||
Operating income (loss) |
(3,002,334 | ) | (1,660,596 | ) | 2,888,022 | 5,112,293 | ||||||||||
Net income (loss) |
(3,690,810 | ) | (2,435,132 | ) | 1,445,144 | 3,729,613 | ||||||||||
Basic and diluted earnings (loss) per unit |
$ | (252.69 | ) | $ | (166.72 | ) | $ | 98.94 | $ | 255.35 | ||||||
F-19
Table of Contents
| First | Second | Third | Fourth | |||||||||||||
| Quarter | Quarter | Quarter | Quarter | |||||||||||||
Fiscal year ended September 30, 2008 |
||||||||||||||||
Revenues |
$ | — | $ | — | $ | — | $ | — | ||||||||
Gross profit |
— | — | — | — | ||||||||||||
Operating income (loss) |
(184,805 | ) | (181,665 | ) | (212,870 | ) | (687,028 | ) | ||||||||
Net income (loss) |
(41,894 | ) | (119,990 | ) | (180,188 | ) | (666,182 | ) | ||||||||
Basic and diluted earnings (loss) per unit |
$ | (2.87 | ) | $ | (8.22 | ) | $ | (12.34 | ) | $ | (45.61 | ) | ||||
The above quarterly financial data is unaudited, but in the opinion of management, all adjustments
necessary for a fair presentation of the selected data for these periods presented have been
included.
F-20
Table of Contents
| ITEM 9. | CHANGES IN AND DISAGREEMENTS WITH ACCOUNTANTS ON ACCOUNTING AND FINANCIAL DISCLOSURE. |
Boulay, Heutmaker, Zibell & Co., P.L.L.P. has been our independent auditor since the Company’s
inception and is the Company’s independent auditor at the present time. The Company has had no
disagreements with its auditors.
| ITEM 9A. | CONTROLS AND PROCEDURES. |
Disclosure Controls and Procedures
Management of Cardinal Ethanol is responsible for maintaining disclosure controls and
procedures that are designed to ensure that information required to be disclosed in the reports
that the Company files or submits under the Securities Exchange Act of 1934 (the “Exchange Act”) is
recorded, processed, summarized and reported within the time periods specified in the Securities
and Exchange Commission’s rules and forms. In addition, the disclosure controls and procedures
must ensure that such information is accumulated and communicated to the Company’s management,
including its Chief Executive Officer and Chief Financial Officer, as appropriate, to allow timely
decisions regarding required financial and other required disclosures.
Our management, including our Chief Executive Officer (the principal executive officer), Jeff
Painter, along with our Chief Financial Officer (the principal financial officer), William Dartt,
have reviewed and evaluated the effectiveness of our disclosure controls and procedures (as defined
in Rule 13a-15(e) and Rule 15d-15(e) under the Securities Exchange Act of 1934, as amended) as of
September 30, 2010. Based on this review and evaluation, these officers have concluded that our
disclosure controls and procedures are effective to ensure that information required to be
disclosed in the reports that we file or submit under the Exchange Act is recorded, processed,
summarized and reported within the time periods required by the forms and rules of the Securities
and Exchange Commission; and to ensure that the information required to be disclosed by an issuer
in the reports that it files or submits under the Exchange Act is accumulated and communicated to
our management including our principal executive and principal financial officers, or persons
performing similar functions, as appropriate to allow timely decisions regarding required
disclosure.
Internal Control Over Financial Reporting
Inherent Limitations Over Internal Controls
Our internal control over financial reporting is designed to provide reasonable assurance
regarding the reliability of financial reporting and the preparation of financial statements for
external purposes in accordance with generally accepted accounting principles. Our internal control
over financial reporting includes those policies and procedures that:
(i) pertain to the maintenance of records that, in reasonable detail, accurately and fairly
reflect the transactions and dispositions of our assets;
(ii) provide reasonable assurance that transactions are recorded as necessary to permit
preparation of financial statements in accordance with generally accepted accounting principles,
and that our receipts and expenditures are being made only in accordance with authorizations of our
management and directors; and
(iii) provide reasonable assurance regarding prevention or timely detection of unauthorized
acquisition, use, or disposition of our assets that could have a material effect on the financial
statements.
Management, including our Chief Executive Officer and Chief Financial Officer, does not expect
that our internal controls will prevent or detect all errors and all fraud. A control system, no
matter how well designed and operated, can provide only reasonable, not absolute, assurance that
the objectives of the control system are met. Further, the design of a control system must reflect
the fact that there are resource constraints, and the benefits of
controls must be considered relative to their costs. Because of the inherent limitations in all
control systems, no evaluation of internal controls can provide absolute assurance that all control
issues and instances of fraud, if any, have been detected. Also, any evaluation of the
effectiveness of controls in future periods are subject to the risk that those internal controls
may become inadequate because of changes in business conditions, or that the degree of compliance
with the policies or procedures may deteriorate.
36
Table of Contents
Management’s Annual Report on Internal Control Over Financial Reporting.
Our management is responsible for establishing and maintaining adequate internal
control over financial reporting (as defined in Rule 13a-15(f) under the Securities Exchange Act of
1934, as amended). Management conducted an evaluation of the effectiveness of our internal control
over financial reporting based on the criteria set forth in Internal Control—Integrated Framework
issued by the Committee of Sponsoring Organizations of the Treadway Commission (“COSO”). Based on
this evaluation, management has concluded that our internal control over financial reporting was
effective as of September 30, 2010.
This annual report does not include an attestation report of our registered public accounting
firm regarding internal control over financial reporting. As we are a non-accelerated filer,
management’s report is not subject to attestation by our registered public accounting firm pursuant
to Section 404(b) of the Sarbanes-Oxley Act of 2002 that permit us to provide only management’s
report in this annual report.
Changes in Internal Control over Financial Reporting
There were numerous and substantial improvements in our internal control over financial
reporting during the fourth quarter of our 2010 fiscal year, which were identified in connection
with management’s evaluation required by paragraph (d) of rules 13a-15 and 15d-15 under the
Exchange Act, that have materially affected, or are reasonably likely to materially affect, our
internal control over financial reporting. In February 2010, William
Dartt was appointed as the Company’s Chief Financial Officer and
Principal Financial and Accounting Officer. We believe this
management change has significantly and progressively improved our
controls during each reporting period during our 2010 fiscal year in
the areas of reconciliation of significant accounts, review of top
sided journal entries and segregation of duties in financial
reporting.
| ITEM 9B. | OTHER INFORMATION. |
None.
PART III.
Pursuant to General Instruction E(3), we omit Part III, Items 10, 11, 12, 13 and 14 and
incorporate such items by reference to an amendment to this Annual Report on Form 10-K or to a
definitive proxy statement to be filed with the Securities and exchange Commission within 120 days
after the close of the fiscal year covered by this Annual Report (September 30, 2010).
| ITEM 10. | DIRECTORS, EXECUTIVE OFFICERS AND CORPORATE GOVERNANCE. |
The information required by this Item is incorporated by reference from the definitive proxy
statement for our 2011 Annual Meeting of Members to be filed with the Securities and Exchange
Commission within 120 days after the end of our 2010 fiscal year. This proxy statement is referred
to in this report as the 2011 Proxy Statement.
| ITEM 11. | EXECUTIVE COMPENSATION. |
The information required by this Item is incorporated by reference from the 2011 Proxy
Statement.
| ITEM 12. | SECURITY OWNERSHIP OF CERTAIN BENEFICIAL OWNERS AND MANAGEMENT AND RELATED MEMBER MATTERS. |
The information required by this Item is incorporated by reference from the 2011 Proxy
Statement.
| ITEM 13. | CERTAIN RELATIONSHIPS AND RELATED TRANSACTIONS AND DIRECTOR INDEPENDENCE. |
The information required by this Item is incorporated by reference from the 2011 Proxy
Statement.
37
Table of Contents
| ITEM 14. | PRINCIPAL ACCOUNTANT FEES AND SERVICES. |
The information required by this Item is incorporated by reference from the 2011 Proxy
Statement.
| ITEM 15. | EXHIBITS AND FINANCIAL STATEMENT SCHEDULES. |
The following exhibits and financial statements are filed as part of, or are incorporated by
reference into, this report:
(1) Financial Statements
The financial statements appear beginning at page F-3 of this report.
(2) Financial Statement Schedules
All supplemental schedules are omitted as the required information is inapplicable or the
information is presented in the financial statements or related notes.
(3) Exhibits
| Exhibit | Filed | |||||||
| No. | Exhibit | Herewith | Incorporated by Reference | |||||
| 3.1 | Articles of Organization of the registrant.
|
Exhibit 3.1 to the registrant’s registration statement on Form SB-2 (Commission File 333-131749) filed on February 10, 2006. | ||||||
| 3.1A | Name Change Amendment
|
Exhibit 3.1A to the registrant’s registration statement on Form SB-2 (Commission File 333-131749) filed on February 10, 2006. | ||||||
| 3.2 | Second Amended and Restated Operating
Agreement of the registrant
|
Exhibit 3.2 to the registrant’s registration statement on Form SB-2 (Commission File 333-131749) filed on February 10, 2006. | ||||||
| 4.1 | Form of Membership Unit Certificate.
|
Exhibit 4.2 to the registrant’s registration statement on Form SB-2 (Commission File 333-131749) filed on February 10, 2006. | ||||||
| 10.1 | Energy Management Agreement dated January 23,
2006 between Cardinal Ethanol, LLC and U.S.
Energy Services, Inc.
|
Exhibit 10.9 to the registrant’s registration statement on Form SB-2 (Commission File 333-131749) filed on February 10, 2006. | ||||||
| 10.2 | Distiller’s Grain Marketing Agreement dated
December 13, 2006 between Cardinal Ethanol,
LLC and Commodity Specialist Company.
|
Exhibit 10.19 to the registrant’s Form 10-KSB filed with the Commission on December 22, 2006. | ||||||
| 10.3 | Ethanol Purchase and Sale Agreement dated
December 18, 2006 between Cardinal Ethanol,
LLC and Murex N.A., Ltd.
|
Exhibit 10.21 to the registrant’s Form 10-KSB filed with the Commission on December 22, 2006. | ||||||
| 10.4 | Construction Loan Agreement dated December
19, 2006 between Cardinal Ethanol, LLC and
First National Bank of Omaha.
|
Exhibit 10.22 to the registrant’s Form 10-KSB filed with the Commission on December 22, 2006. | ||||||
38
Table of Contents
| Exhibit | Filed | |||||||
| No. | Exhibit | Herewith | Incorporated by Reference | |||||
| 10.5 | Construction Note dated December 19, 2006
between Cardinal Ethanol, LLC and First
National Bank of Omaha.
|
Exhibit 10.23 to the registrant’s Form 10-KSB filed with the Commission on December 22, 2006. | ||||||
| 10.6 | Revolving Note dated December 19, 2006
between Cardinal Ethanol, LLC and First
National Bank of Omaha.
|
Exhibit 10.24 to the registrant’s Form 10-KSB filed with the Commission on December 22, 2006. | ||||||
| 10.7 | Letter of Credit Promissory Note and
Continuing Letter of Credit Agreement dated
December 19, 2006 between Cardinal Ethanol,
LLC and First National Bank of Omaha.
|
Exhibit 10.25 to the registrant’s Form 10-KSB filed with the Commission on December 22, 2006. | ||||||
| 10.8 | Construction Loan Mortgage, Security
Agreement, Assignment of Leases and Rents and
Fixture Financing Statement dated December
19, 2006 between Cardinal Ethanol, LLC and
First National Bank of Omaha.
|
Exhibit 10.26 to the registrant’s Form 10-KSB filed with the Commission on December 22, 2006. | ||||||
| 10.9 | Security Agreement dated December 19, 2006
between Cardinal Ethanol, LLC and First
National Bank of Omaha.
|
Exhibit 10.27 to the registrant’s Form 10-KSB filed with the Commission on December 22, 2006. | ||||||
| 10.10 | Master Agreement dated December 19, 2006
between Cardinal Ethanol, LLC and First
National Bank of Omaha.
|
Exhibit 10.28 to the registrant’s Form 10-KSB filed with the Commission on December 22, 2006. | ||||||
| 10.11 | Employment Agreement dated January 22, 2007
between Cardinal Ethanol, LLC and Jeff
Painter.
|
Exhibit 10.29 to the registrant’s Form 10-QSB filed with the Commission on February 14, 2007. | ||||||
| 10.12 | Long Term Transportation Service Contract for
Redelivery of Natural Gas between Ohio Valley
Gas Corporation and Cardinal Ethanol, LLC
dated March 20, 2007.
|
Exhibit 10.32 to the registrant’s Form 10-QSB filed with the Commission on May 15, 2007. | ||||||
| 10.13 | Agreement between Indiana Michigan Power
Company and Cardinal Ethanol, LLC dated April
18, 2007.
|
Exhibit 10.33 to the registrant’s Form 10-QSB filed with the Commission on May 15, 2007. | ||||||
| 10.14 | Risk Management Agreement entered into
between Cardinal Ethanol, LLC and John
Stewart & Associates, Inc. dated July 16,
2007.
|
Exhibit 10.34 to the registrant’s Form 10-QSB filed with the Commission on August 3, 2007. | ||||||
| 10.15 | Consent to Assignment and Assumption of
Marketing Agreement between Commodity
Specialists Company and Cardinal Ethanol, LLC
dated August 28, 2007.
|
Exhibit 10.37 to the registrant’s Form 10-KSB filed with the Commission on December 17, 2007. | ||||||
| 10.16 | Tricanter Installation and Purchase Agreement
between ICM, Inc. and Cardinal Ethanol, LLC
dated June 27, 2008.
|
Exhibit 10.1 to the registrant’s Form 10-QSB filed with the Commission on August 14, 2008 | ||||||
39
Table of Contents
| Exhibit | Filed | |||||||
| No. | Exhibit | Herewith | Incorporated by Reference | |||||
| 10.17 | Corn Oil Extraction Note between First
National Bank of Omaha and Cardinal Ethanol,
LLC dated July 31, 2008.
|
Exhibit 10.2 to the registrant’s Form 10-QSB filed with the Commission on August 14, 2008 | ||||||
| 10.18 | First Amendment of Construction Loan Mortgage
between First National Bank of Omaha and
Cardinal Ethanol, LLC dated July 31, 2008.
|
Exhibit 10.3 to the registrant’s Form 10-QSB filed with the Commission on August 14, 2008 | ||||||
| 10.19 | Third Amendment of Construction Loan
Agreement between First National Bank of
Omaha and Cardinal Ethanol, LLC dated July
31, 2008.
|
Exhibit 10.4 to the registrant’s Form 10-QSB filed with the Commission on August 14, 2008. | ||||||
| 10.20 | Fixed Rate Note between First National Bank
of Omaha and Cardinal Ethanol, LLC dated
April 8, 2009.
|
Exhibit 10.1 to the registrant’s Form 10-Q filed with the Commission on May 20, 2009. | ||||||
| 10.21 | Long Term Revolving Note between First
National Bank of Omaha and Cardinal Ethanol,
LLC dated April 8, 2009.
|
Exhibit 10.2 to the registrant’s Form 10-Q filed with the Commission on May 20, 2009. | ||||||
| 10.22 | Variable Rate Note between First National
Bank of Omaha and Cardinal Ethanol, LLC dated
April 8, 2009.
|
Exhibit 10.3 to the registrant’s Form 10-Q filed with the Commission on May 20, 2009. | ||||||
| 10.23 | Corn Oil Extraction Term Note between First
National Bank of Omaha and Cardinal Ethanol,
LLC dated April 8, 2009.
|
Exhibit 10.4 to the registrant’s Form 10-Q filed with the Commission on May 20, 2009. | ||||||
| 10.24 | Amendment No 1 to Ethanol Purchase and Sale
Agreement between Murex N.A., LTD and
Cardinal Ethanol, LLC dated July 2, 2009.
|
Exhibit 99.1 to the registrant’s Form 8-K filed with the Commission on July 7, 2009. | ||||||
| 10.25 | Results Guarantee Agreement between Pavilion
Technologies and Cardinal Ethanol, LLC dated
September 30, 2009.
|
Exhibit 10.6 to the registrant’s Form 10-K filed with the Commission on December 28, 2009. | ||||||
| 10.26 | Amendment to Tricanter Purchase and
Installation Agreement between ICM, Inc. and
Cardinal Ethanol, LLC dated February 16,
2010.
|
Exhibit 10.1 to the registrant’s Form 10-Q filed with the Commission on May 14, 2010. | ||||||
| 10.27 | Carbon Dioxide Purchase and Sale Agreement
between EPCO Carbon Dioxide Products, Inc.
and Cardinal Ethanol, LLC dated March 8,
2010.
|
Exhibit 10.2 to the registrant’s Form 10-Q filed with the Commission on May 14, 2010. | ||||||
| 10.28 | Construction Agreement between LAH
Development, LLC and Cardinal Ethanol, LLC
dated May 11, 2010.
|
Exhibit 10.3 to the registrant’s Form 10-Q filed with the Commission on May 14, 2010. | ||||||
| 10.29 | Non-Exclusive Co2 Facility Site Lease
Agreement between EPCO Carbon Dioxide
Products, Inc and Cardinal Ethanol, LLC dated
August 11, 2010.
|
Exhibit 10.1 to the registrant’s Form 10-Q filed with the Commission on August 12, 2010. | ||||||
40
Table of Contents
| Exhibit | Filed | |||||||
| No. | Exhibit | Herewith | Incorporated by Reference | |||||
| 10.30 | Employee Bonus Memo dated October 14, 2010.
|
X | ||||||
| 10.31 | Employee Bonus Plan for 2010/2011.
|
X | ||||||
| 14.1 | Code of Ethics of Cardinal Ethanol, LLC.
|
Exhibit 14.1 to the registrant’s Form 10-KSB filed with the Commission on December 22, 2006. | ||||||
| 31.1 | Certificate Pursuant to 17 CFR 240.13a-14(a)
|
X | ||||||
| 31.2 | Certificate Pursuant to 17 CFR 240.13a-14(a)
|
X | ||||||
| 32.1 | Certificate Pursuant to 18 U.S.C. Section 1350
|
X | ||||||
| 32.2 | Certificate Pursuant to 18 U.S.C. Section 1350
|
X | ||||||
| (+) | Confidential Treatment Requested. |
|
| (X) | Filed herewith |
SIGNATURES
In accordance with Section 13 or 15(d) of the Exchange Act, the registrant caused this report
to be signed on its behalf by the undersigned, thereunto duly authorized.
| CARDINAL ETHANOL, LLC |
||||
| Date: December 21, 2010 | /s/ Jeff Painter | |||
| Jeff Painter | ||||
| Chief Executive Officer (Principal Executive Officer) |
||||
| Date: December 21, 2010 | /s/ William Dartt | |||
| William Dartt | ||||
| Chief Financial Officer (Principal Financial Officer) |
||||
41
Table of Contents
In accordance with the Exchange Act, this report has been signed below by the following
persons on behalf of the registrant and in the capacities and on the dates indicated.
Date: December 21, 2010
|
/s/ Robert Davis | |||
| Chairman and Director | ||||
Date: December 21, 2010
|
/s/ Dale Schwieterman | |||
| Treasurer and Director | ||||
Date: December 21, 2010
|
/s/ Tom Chalfant | |||
| Secretary and Director | ||||
Date: December 21, 2010
|
/s/ Troy Prescott | |||
| Vice Chairman and Director | ||||
Date: December 21, 2010
|
/s/ Ralph Brumbaugh | |||
Date: December 21, 2010
|
/s/ Thomas C. Chronister | |||
Date: December 21, 2010 |
||||
Date: December 21, 2010
|
/s/ Everett Leon Hart | |||
Date: December 21, 2010
|
/s/ Cyril G. LeFevre | |||
Date: December 21, 2010
|
/s/ C. Allan Rosar | |||
Date: December 21, 2010 |
||||
Date: December 21, 2010
|
/s/ Robert Baker | |||
Date: December 21, 2010 |
||||
42