Attached files
UNITED STATES
SECURITIES AND EXCHANGE COMMISSION
Washington, D.C. 20549
Form 10-K
| [X] |
Annual report pursuant to section 13 or 15(d) of the Securities Exchange Act of 1934
For the fiscal year ended October 2, 2010 or
|
| [ ] |
Transition report pursuant to section 13 or 15(d) of the Securities Exchange Act of 1934
For the transition period from _______ to _______.
|
Commission file number 0-11392
| SPAN-AMERICA MEDICAL SYSTEMS, INC. |
| (Exact name of registrant as specified in its charter) |
| South Carolina |
57-0525804
|
|
(State or other jurisdiction of incorporation or organization)
|
(I.R.S. Employer Identification No.) |
|
70 Commerce Center, Greenville, South Carolina
|
29615
|
|
(Address of principal executive offices)
|
(Zip Code)
|
| Registrant’s telephone number, including area code | (864) 288-8877 |
Securities registered pursuant to section 12(b) of the Act:
|
Title of each class
|
Name of each exchange on which registered
|
|
None
|
None
|
Securities registered pursuant to section 12(g) of the Act:
| Common stock, no par value |
| (Title of class) |
Indicate by check mark if the registrant is a well-known seasoned issuer, as defined in Rule 405 of the Securities Act. Yes No X
Indicate by check mark if the registrant is not required to file reports pursuant to Section 13 or Section 15(d) of the Act. Yes No X
Indicate by check mark whether the registrant (1) has filed all reports required to be filed by Section 13 or 15(d) of the Securities Exchange Act of 1934 during the preceding 12 months (or for such shorter period that the registrant was required to file such reports), and (2) has been subject to such filing requirements for the past 90 days. Yes X No
Indicate by check mark whether the registrant has submitted electronically and posted on its corporate Website, if any, every Interactive Data file required to be submitted and posted pursuant to Rule 405 of Regulation S-T (§232.405 of this chapter) during the preceding 12 months (or for such shorter period that the registrant was required to submit and post such files). Yes X No ___
Indicate by check mark if disclosure of delinquent filers pursuant to Item 405 of Regulation S-K (§229.405 of this chapter) is not contained herein, and will not be contained, to the best of the registrant’s knowledge, in definitive proxy or information statements incorporated by reference in Part III of this Form 10-K or any amendment to this Form 10-K. [ ]
Indicate by check mark whether the registrant is a large accelerated filer, an accelerated filer, a non-accelerated filer or a smaller reporting company. See the definitions of “large accelerated filer,” “accelerated filer” and “smaller reporting company” in Rule 12b-2 of the Exchange Act. (Check one):
| Large Accelerated Filer ___ | Accelerated Filer ___ | |
| Non-Accelerated Filer X |
|
Smaller Reporting Company ___ |
Indicate by check mark whether the registrant is a shell company (as defined in Rule 12b-2 of the Act). Yes ___ No X
The aggregate market value of the voting and non-voting common equity held by non-affiliates computed by reference to the price at which the common equity was last sold as of the last business day of the registrant’s most recently completed second fiscal quarter was $43,606,013.
The number of shares of the registrant’s common stock, no par value, outstanding as of December 22, 2010 was 2,757,364.
Documents Incorporated By Reference
Portions of the Company’s Definitive Proxy Statement for the annual shareholders’ meeting to be held February 18, 2011 are incorporated by reference into Part III.
PART I
Item 1. Business
Forward-Looking Statements
This annual report on Form 10-K includes forward-looking statements that describe anticipated results for Span-America Medical Systems, Inc. (the “Company” or “Span-America”). These statements are estimates or forecasts about Span-America and its markets based on our beliefs, assumptions and expectations. These forward-looking statements therefore involve numerous risks and uncertainties. We wish to caution the reader that these forward-looking statements, such as, but not limited to, our expectations for future sales or future expenses, are only predictions. Actual events or results may differ materially as a result of risks and uncertainties in our business. Such risks include, but are not limited to, the “Risk Factors” described in Item 1A below and other risks referenced from time to time in our other Securities and Exchange Commission (“SEC”) filings. We disclaim any obligation to update any forward-looking statement, whether as a result of new information, future events or otherwise.
Background
Span-America Medical Systems, Inc. was incorporated under the laws of the state of South Carolina on September 21, 1970. We manufacture and distribute a variety of therapeutic support surfaces and related products utilizing polyurethane and other foam products for the medical, consumer and industrial markets.
We began operations in 1975 as a manufacturer of polyurethane foam patient positioners and later expanded our product lines to include foam mattress overlays for the wound care market primarily in acute care hospitals. Wound care products aid in the treatment or prevention of pressure ulcers and diabetic ulcers commonly known as bedsores. In the late 1970s, we also began producing foam products for industrial applications. In 1985, we introduced the patented Geo-Mattâ therapeutic mattress overlay in the health care market, which became one of our leading products. During the same time period, we began selling convoluted foam mattress overlay products to consumer bedding retailers throughout the United States.
We entered the replacement mattress segment of the medical market in 1992 by acquiring certain assets of Healthflex, Inc., including its PressureGuard® II therapeutic support surface. We have since significantly expanded the PressureGuard product line and have added the Geo-Mattress® product line to provide a broad line of therapeutic support surfaces that we sell directly and through distributors to hospitals, long-term care facilities, and home health care dealers throughout the Unites States and Canada.
Our primary long-term strategy is to become a leading health care manufacturer and marketer specializing in wound management products used in the prevention and treatment of pressure ulcers. We are actively seeking to develop or acquire new products in this market segment. We also seek to further develop consumer and industrial applications of our medical products.
1
Our products are distributed in the United States and, to a lesser degree, in several foreign countries. Total export sales during fiscal 2010 were approximately $1.6 million or 3.1% of total net sales. The majority of our export sales occurred in Canada. See Note 18 – Operations and Industry Segments in the Notes to Financial Statements included in Item 8 of this report.
We maintain a website at http://www.spanamerica.com. Our reports and other filings made with the SEC are available free of charge on our website, which includes a link to the Company’s filings in the SEC’s Electronic Data Gathering Analysis and Retrieval, EDGAR, filing database.
Industry Segment Data
Please see Note 18 – Operations and Industry Segments in the Notes to Financial Statements included in Item 8 of this report for additional information on industry segment data and revenues from foreign sales. The table below sets forth sales of each of our product lines and segments as a percentage of our total sales for fiscal years 2010, 2009 and 2008.
|
Percentage of Total Sales
|
||||||||||||
|
2010
|
2009
|
2008
|
||||||||||
|
Medical Segment
|
|
|||||||||||
|
Mattress overlays
|
7 | 7 | 6 | |||||||||
|
Therapeutic support surfaces
|
43 | 46 | 54 | |||||||||
|
Patient positioners (Span-Aids)
|
8 | 7 | 6 | |||||||||
|
Seating products
|
4 | 4 | 4 | |||||||||
|
Skin care products
|
2 | 2 | 2 | |||||||||
|
Fall protection products
|
3 | 1 | - | |||||||||
|
Other medical products
|
1 | 1 | - | |||||||||
|
Medical total
|
68 | 68 | 72 | |||||||||
|
Custom Products Segment
|
||||||||||||
|
Consumer bedding
|
26 | 27 | 22 | |||||||||
|
Industrial products
|
6 | 5 | 6 | |||||||||
|
Custom Products total
|
32 | 32 | 28 | |||||||||
Medical
Span-America’s principal medical products consist of polyurethane foam mattress overlays, therapeutic support surfaces (which consist of non-powered and powered therapeutic support surfaces) and patient positioners as well as Selan® skin care, seating and fall protection products. We sell these products primarily in North America to customers in the major segments of the health care market, including acute care hospitals, long-term care facilities and home health care providers.
2
Mattress Overlays. Span-America produces a variety of foam mattress overlays, including convoluted foam pads and its patented Geo-Matt® overlay. Span-America’s overlay products are mattress pads rather than complete mattresses and are marketed as less expensive alternatives to more complex therapeutic support surfaces. Our mattress overlays disperse body heat, increase air circulation beneath the patient and reduce moisture accumulation to aid in the prevention and treatment of pressure ulcers. Their convoluted or geometrically contoured construction also reduces shear forces and more evenly distributes the patient’s body weight, thereby reducing the localized pressure that can cause ulcers. The Geo-Matt design includes numerous individual foam cells that are cut to exacting tolerances on computer-controlled equipment to create a clinically effective mattress surface. These products are designed to provide patients with greater comfort and to assist in treating patients who have developed or are susceptible to developing pressure ulcers. The mattress overlays are designed for single patient use.
Therapeutic Support Surfaces. For classification purposes, we divide our lines of therapeutic support surfaces into two groups, non-powered and powered, and we have various sub-categories within those two groups. We generally use the terms “support surfaces” and “mattresses” interchangeably. Our non-powered therapeutic support surfaces fall into two main sub-categories: the Geo-Mattress® all-foam products and the non-powered portion of the PressureGuard® product line. Geo-Mattress® products are single-density or multi-layered foam mattresses topped with the same patented Geo-Matt surface used in our overlays. These mattresses are sold as alternatives to standard innerspring and all-foam mattresses often found in acute and long-term care settings.
In 1997, we introduced the Geo-Mattress Max, Plus, and Pro models of foam therapeutic support surfaces. In early 1999, we extended the product line with the release of the Geo-Mattress with Wings®, which has been a significant contributor to overall Geo-Mattress sales. The Wings support surfaces feature raised perimeter bolsters designed to reduce the chances of patients rolling out of bed or becoming entrapped. We added a second line extension, the Geo-Mattress Atlas®, in December 2000 to address the needs of heavier patients.
Span-America’s more complex non-powered support surfaces consist of products from the PressureGuard® series. We acquired the PressureGuard design through the acquisition of Healthflex, Inc. in February 1992. The original design combined a polyurethane foam shell and static air cylinders to form a support surface that incorporated the comfort and pressure relieving features of both mattress overlays and more sophisticated therapeutic support surfaces. This original design, which we later used as the basis for powered versions was further refined through a complete technical upgrade of all PressureGuard components in November 1997.
In addition to the non-powered, static PressureGuard Renew®, we offer the PressureGuard CFT®. This model incorporates patented design principles of constant force technology. The PressureGuard CFT is unusual in that it is a dynamic, self-adjusting support surface that rivals more expensive powered surfaces in effectiveness, yet it requires no power source.
3
Span-America’s powered therapeutic support surfaces constitute the remaining models in the PressureGuard Series. In November 1993, we received Food and Drug Administration (“FDA”) 510(k) marketing approval for the PressureGuard IV therapeutic support surface. Building on the comfort and support of the original PressureGuard design, PressureGuard IV was designed as a sophisticated, powered system for providing pressure reduction and patient comfort, with the added ability to turn the patient. The system was designed to automatically sense the patient’s weight and position, and to continually adjust the pressures appropriately while slowly and quietly repositioning the patient at angles up to 30 degrees in cycles of up to two hours. The upgraded version, renamed the PressureGuard Turn Select®, incorporates all of these capabilities, as well as several additional features. Of particular note is a pendant-operated, microprocessor-controlled motion system, which is built into the support surface rather than being suspended from the bed frame as a separate unit.
Another powered system in the PressureGuard line is the PressureGuard APM®, a simpler but effective alternating pressure mattress. The APM is targeted primarily at the long-term care and home care markets. In 2000, we added a more feature-rich version of this mattress called the PressureGuard APM2. In 2003, we further upgraded the APM2 products with new features such as the addition of the Deluxe control unit. The APM2 gives caregivers the flexibility to offer either alternating pressure or a basic lateral rotation modality by activating a toggle switch on the control panel. In fiscal 2010, the APM2 was our highest selling medical product line.
In late 2001, Span-America introduced the PressureGuard Easy Air®, our first offering in the category of low-air-loss mattresses. The Easy Air incorporates several patented design innovations, which we believe allow it to overcome common performance compromises inherent in competitive low-air-loss products. Additionally, the Easy Air was independently documented to outperform all leading competitors at that time in controlling excess skin moisture, a key performance advantage in the competitive support surfaces marketplace (see Ostomy/Wound Management, January 2003, Volume 49, Issue 1, pp. 32-42).
In late 2010, we introduced the PressureGuard Custom Care® series, which consists of three distinct product offerings aimed in large part at the acute care marketplace. Two of the models—Custom Care, and Custom Care Convertible— incorporate the company’s proprietary new Shear Transfer Zone™ cover design. This patent pending design helps eliminate the damaging effects of micro shearing, macro shearing, and rotational shearing on vulnerable skin and tissue caused when bony prominences “dig” into a support surface. Like the PressureGuard CFT, the Custom Care model provides air therapy without the need for a powered control unit. It is designed to provide extreme comfort and skin protection while requiring no maintenance for five years.
4
The PressureGuard Custom Care Convertible and Custom Care Convertible LAL models represent our first product offerings in the “convertible” category, a class of support surfaces that has become a popular option in today’s hospital market. In their non-powered mode, Custom Care Convertible models operate as premium tissue load management surfaces for both prevention and treatment of pressure ulcers. Both allow the addition of a powered control unit where more aggressive, dynamic therapy is desired. When the add-on, ruggedized Custom Care Convertible control unit is clicked into position on the mattress, the caregiver is provided the option of either alternating pressure or lateral rotation.
On the LAL model, the caregiver can select either of these options while also providing a third treatment modality: microclimate management. This proprietary, patented air delivery design—proven by its longstanding clinical success on the company’s PressureGuard Easy Air low air loss surface—controls excess moisture and heat at the interface between the user and the surface. Both models also incorporate another Span-America exclusive, the Star Chamber™ air cylinder design. The Star Chamber cylinders maximize the amount of air available within the mattress for pressure management, patient support, and dynamic therapy.
We sell all of the powered products in the PressureGuard Series to long-term care facilities, usually through our distributors, and to home health care equipment dealers for daily rental in the home care market. We also sell the PressureGuard products in the acute care market, but in smaller quantities than in the long-term care and home care markets.
Patient Positioners. We sell our specialty line of patient positioners primarily under the trademark Span-Aids. This is our original product line and consists of over 300 different foam items that aid in relieving the basic patient positioning problems of elevation, immobilization, muscle contracture, foot drop, and foot or leg rotation. Span-Aids patient positioners hold a patient's body in prescribed positions, provide greater patient comfort, and generally are used to aid long-term comatose patients or those in a weakened or immobilized condition. The positioners also help in the prevention of pressure ulcers by promoting more effective dispersion of pressure, heat and moisture. Span-Aids are intended for single-patient use throughout a patient's entire treatment program. Among the Span-Aids products that we presently market are abduction pillows, body aligners, head supports, limb elevators and various foot and wrist positioners. We sell patient positioners primarily to hospitals and long-term care facilities through several national medical products distributors.
Seating Products. Another product category in our medical segment consists of seat cushions and related seating products for wheelchairs, geri-chairs (typically used in long-term care facilities) and other health care seating needs. Our offerings in this category can be subdivided into three main groups:
|
·
|
wound healing aids,
|
|
·
|
patient positioning and general pressure management products, and
|
|
·
|
pressure management products without patient positioning features.
|
5
Seating products made specifically as an aid to wound healing include the Isch-Dish® and Sacral Dish® pressure relief cushions. Seating products made for patient positioning and general pressure management include the Isch-Dish Thin, the Geo-Matt® Contour® cushion, the Equalizer®, and the EZ-Dish®. The Equalizer contoured positioning cushion has a multi-component design that includes a viscoelastic foam top, proprietary soft polymer inserts, and a contoured base. Like the Isch-Dish, the Equalizer is covered for reimbursement by the Medicare system. This makes it an attractive option for durable medical equipment suppliers and rehab seating specialists. The EZ-Dish pressure relief cushion, which uses some of the features of the original Isch-Dish design, offers a simpler, more affordable solution to the seating problems of nursing home patients. The Geo-Wave® Cushion assists with positioning and pressure reduction for patients using specialty recliners and geri-chairs. The Short-Wave® seat and back cushion reduces shear and assists with patient positioning in standard wheelchairs.
Seating products designed to address pressure management without additional positioning benefits include the Gel-T® cushion and the Geo-Matt and Geo-Matt PRT® wheelchair cushions. The Gel-T is a gel/foam combination cushion that is especially popular with elderly patients. The Geo-Matt and Geo-Matt PRT cushions incorporate our proprietary Geo-Matt anti-shearing surface.
Skin Care Products. We also market the Selan® line of skin care creams and lotions under a license agreement with P.J. Noyes Company. The products, which are manufactured by P.J. Noyes, are used for cleaning, moisturizing and protecting patients’ skin and are sold primarily in long-term care and acute care settings. The license agreement with PJ Noyes will expire on December 31, 2015 but is renewable pursuant to the terms of the agreement.
Fall Protection Products. In December 2008, we began marketing the Risk Manager® bedside safety mat, which was a new product category for Span-America. The Risk Manager is manufactured outside the United States, using an elastomeric gel compound and is designed to cushion the force of impact and reduce the chance of injury to a patient who falls at the bedside.
Distributor and Private-Label Manufacturing Relationships. We sell our medical products to many customers of varying sizes. We also sell our branded medical products to several medical products distributors which resell our products to acute care hospitals and long-term care facilities throughout North America. Sales to our four largest medical distributors made up approximately 45% of net sales in the medical segment during fiscal 2010. We believe our relationships with these distributors are good. However, the loss of any one of these customers could have a material adverse effect on our business. See Item 1A. “Risk Factors” below for more information regarding our relationships with large customers.
Custom Products
Span-America’s custom products segment includes two major product lines: consumer bedding products and various engineered industrial products. Our consumer product line consists primarily of convoluted and contour-cut mattress overlays and specially designed pillows for the consumer bedding market. The consumer products are marketed to retailers through Louisville Bedding Company, a leading manufacturer and distributor of bedding products in North America. Louisville Bedding is the exclusive distributor of our consumer foam products pursuant to a distribution agreement between us, which expires in December 2012. The agreement automatically renews for successive three-year terms unless either party provides notice of its intent not to renew at least 60 days prior to the expiration date.
6
Our industrial product line consists of specially engineered foam products used in a variety of markets, including the automotive, packaging, durable goods, electronics and water sports equipment industries. Our largest industrial customers manufacture automobiles, kayaks and specialty packaging products. Most of our industrial products are made to order according to customer specifications and are sold primarily in the southeastern United States.
In fiscal 2010, approximately 82% of our total custom products sales were distributed through Louisville Bedding Company. The loss of this relationship would have a material adverse effect on our business.
Safety Catheters
In July 2002, we acquired assets related to the Secure I.V.® protected short peripheral intravenous catheter from Vadus, Inc., a privately owned designer and manufacturer of catheters. However, we were unable to generate sufficient sales volume in the safety catheter segment to make it a viable business. Consequently, in October 2007, we decided to exit the safety catheter business and try to sell the related assets. As of September 29, 2007, we recorded an impairment charge to eliminate the book value of our safety catheter assets. We have attempted to sell the assets related to the safety catheter business, but our efforts so far have not been successful. We have ceased the use of the safety catheter assets and are committed to a plan of sale or abandonment. However, we have no offers pending and can give no assurance that the assets will eventually be sold. If the assets are not eventually sold, they will be abandoned and disposed of.
Research and Development
Span-America’s expenditures for research and development for the last three fiscal years are set forth in the following table:
We expect research and development costs in fiscal 2011 to be similar to those of fiscal 2010.
|
Research and Development Expense
|
||||||||||||
|
2010
|
2009
|
2008
|
||||||||||
|
Medical
|
$ | 879,000 | $ | 822,000 | $ | 657,000 | ||||||
|
Custom products
|
59,000 | 44,000 | - | |||||||||
|
Total R& D expense
|
$ | 938,000 | $ | 866,000 | $ | 657,000 | ||||||
Competition
Medical. In the medical market segment, we face significant competition for sales of our foam mattress overlays. Competition within the overlay market is primarily based on price and delivery for convoluted foam overlays. For therapeutic overlays, including Geo-Matt, competition is based on price, product performance, quality and delivery. However, the largest single source of competition for our mattress overlay products is from full-function therapeutic support surfaces. Sales of overlays have generally declined since the 1990s as customers began to replace single-patient-use overlays with full function mattresses that incorporated the pressure relieving features of overlays. Competition with respect to our Span-Aids patient positioners is primarily based on price. However, a secondary source of competition for patient positioners results from alternative methods, such as the use of pillows and other devices to position patients.
7
We believe that Span-America is one of the largest nationwide suppliers of therapeutic mattress overlays and patient positioners to the U.S. health care market. Our primary competitors in the overlay and positioner markets are Sunrise Medical, Inc. and Covidien (formerly Tyco Healthcare).
Competition in the therapeutic support surface market is based on product performance, price and durability. Customers typically select a product based on these criteria after conducting a formal clinical evaluation of sample mattresses for periods of one to six months. A secondary source of competition results from alternative products such as mattress overlays, which are significantly less expensive than support surfaces.
The market for therapeutic support surfaces developed principally during the 1990s. Competitors include Hill-Rom Holdings, Inc. (Hill-Rom), Kinetic Concepts, Inc., Invacare Corporation, Direct Supply, Inc. and Medline Industries, Inc. These competitors use combinations of their own sales representatives and manufacturer’s representatives to sell nationwide directly to hospitals, distributors, long-term care facilities and original equipment manufacturers.
Many of our competitors in the health care segment are larger and have greater resources than Span-America. We believe our competitive advantages in the medical segment include innovative and patented product designs, product quality, manufacturing capabilities, distribution relationships and responsiveness to customer requirements.
Custom Products. In the custom products segment, we have encountered significant competition for our mattress pad and pillow products. The competition is principally based on price, which is largely determined by foam density and thickness. However, competition also exists due to variations in product design and packaging. There are presently a number of companies with the manufacturing capability to produce similar bedding products. Our primary competitors in this market are Sleep Innovations, Inc., E.R. Carpenter Company and Sinomax, Inc., most of which are larger and have greater resources than Span-America. We also have a number of competitors in the market for our industrial products, including Hibco Plastics, CelloFoam North America, Inc., UFP Technologies, Inc. and Foam-Tech. These competitors are larger and have greater resources than Span-America. The competition for industrial foam products is largely based on price. In many instances, however, design, product quality and delivery capabilities are also important. We believe that our competitive advantages in the custom products segment include our distribution relationship with Louisville Bedding Company, innovative product designs, manufacturing and foam fabrication capabilities, low cost manufacturing processes and responsiveness to customer requirements.
8
Within the last few years, we have encountered increasing competition in the consumer bedding market from visco foam products manufactured both in the United States and China. Visco foam, also known as visco-elastic foam or memory foam, has greater density and different properties than traditional polyurethane foam products. It responds to body temperature, conforms to the shape of the body, and generally has slower recovery time compared with traditional polyurethane foam. Memory foam is also significantly more expensive than traditional foam and is more difficult to handle and fabricate. Because memory foam is more difficult to cut and shape than traditional foam, it is more difficult for us to differentiate our products from those of our competitors. Consequently, the memory foam mattress pads currently on the market tend to be somewhat undifferentiated without unique surface designs. In addition, since memory foam is significantly more expensive and more dense than traditional foam, it is more cost effective for overseas competitors (from China for example) to ship the products into the U.S. market. This is generally because retail prices of memory foam products are significantly higher than comparable traditional foam products, which generates much higher revenue per square foot of retail shelf space and lowers shipping costs as a percent of sales value.
Major Customers
We have an agreement with Louisville Bedding Company to distribute our consumer foam products. Sales to Louisville Bedding during fiscal 2010 made up approximately 26% of our total net sales and approximately 82% of sales in the custom products segment.
See “Industry Segment Data – Medical – Distributor and Private-Label Manufacturing Relationships” above and Note 17 – Major Customers and Note 18 – Operations and Industry Segments in the Notes to Financial Statements below for more information on major customers. The loss of any of these major customers would have a material adverse effect on our business.
Seasonal Trends
Some seasonality can be identified in certain of our medical and consumer foam products. However, the fluctuations have minimal effect on our operations because of offsetting trends among these product lines. We have not experienced significant seasonal fluctuations in our industrial product line.
Patents and Trademarks
We hold 28 United States patents and 8 foreign patents relating to various components of our patient positioners, mattress overlays, and therapeutic support surfaces for the medical segment. We have also filed additional patent applications. We believe that these patents are important to our business. However, while we have a number of products covered by patents, there are competitive alternatives available, sales of which are not restricted by our patents. Therefore, we do not rely solely on our patents to maintain our competitive position in our various markets.
9
Our principal patents include the patents on Geo-Matt, Geo-Mattress, PressureGuard, and Span-Aids products. The Geo-Matt and Geo-Mattress patents have remaining lives ranging from 1 to 3 years with additional patents pending. The PressureGuard patents have remaining lives ranging from 4 to 11 years with additional patents pending. The Span-Aids patents have remaining lives ranging from less than a year to 5 years.
As previously noted, in July 2002, we acquired assets related to the Secure I.V.® catheter product line of Vadus, Inc., a privately owned designer and manufacturer of peripheral intravenous catheters. The Secure I.V. has FDA 510(k) approval and is protected by 11 U. S. patents and 9 foreign patents, all of which are owned by Span-America. The Secure I.V. patents have remaining terms ranging from 2 to 11 years. The mark “Secure I.V.” is also Span-America’s registered trademark. We have also filed additional patent applications. If we are successful in our efforts to sell the Secure I.V. business, we expect that the purchaser will acquire the related patents and trademarks.
We hold 37 federally registered trademarks and 18 foreign trademark registrations, including Span-America, Span-Aids, Geo-Matt, Geo-Mattress, PressureGuard, and Isch Dish, in the medical and consumer segments. Other federal registration applications are presently pending. We believe that these trademarks are readily identifiable in their respective markets and add value to our product lines.
Raw Materials and Backlog
Polyurethane foam and nylon/vinyl mattress covers and tubes account for approximately 80% of our raw materials. In addition, we use corrugated shipping containers, polyethylene plastic packaging material and hook-and-loop fasteners. We believe that our basic raw materials are in adequate supply and are available from many suppliers at competitive prices.
See Item 1A. “Risk Factors” and Item 7. “Management’s Discussion and Analysis of Financial Condition and Results of Operations” for more information on price increases for polyurethane foam.
As of October 2, 2010, we had unshipped (or open) orders of approximately $1.0 million, which represents two and one-half times our open orders of $400,000 at fiscal year-end 2009. We believe the exceptionally low level of open orders at October 3, 2009 was an aberration caused by an unusual fluctuation in the timing of orders received. We expect to fill all orders open as of October 2, 2010 in the 2011 fiscal year.
Employees
We had 218 full-time employees as of October 2, 2010. Of these employees, 7 were officers, 15 were management personnel, 24 were administrative and clerical personnel, 25 were sales personnel, and 147 were manufacturing personnel. We are not a party to any collective bargaining agreement and have never experienced an interruption or curtailment of operations due to labor controversy. We believe that our relations with our employees are good.
10
Supervision and Regulation
The Federal Food, Drug and Cosmetic Act, and regulations issued or proposed thereunder, provide for regulation by the FDA of the marketing, manufacture, labeling, packaging and distribution of medical devices, including our products. These regulations require, among other things, that medical device manufacturers register with the FDA, list devices manufactured by them, and file various reports. In addition, our manufacturing facilities are subject to periodic inspections by regulatory authorities and must comply with “good manufacturing practices” as required by the FDA and state regulatory authorities. We believe that we are in substantial compliance with applicable regulations and do not anticipate having to make any material expenditures as a result of FDA or other regulatory requirements.
We are certified as an ISO 9001 and ISO 13485 supplier for our PressureGuard mattress products from our Greenville, South Carolina plant. These standards are prepared by the American Society for Quality Control Standards Committee to correspond to the International Standard ISO 9001:2000. ISO (the International Organization for Standardization) is a worldwide federation of national standards bodies dealing with quality-system requirements that can be used by a supplier to demonstrate its capability and for the assessment of the capability of a supplier by external parties. Compliance with ISO standard 13485 is required by Health Canada for all Class II medical devices sold there. All of our powered therapeutic support surfaces for the health care market are considered Class II medical devices. The certification is subject to reassessment at six-month intervals. We have maintained our certification based on the results of ISO audits conducted during fiscal year 2010.
Environmental Matters
Our manufacturing operations are subject to various government regulations pertaining to the discharge of materials into the environment. We believe that we are in substantial compliance with applicable regulations. We do not anticipate that continued compliance will have a material effect on our capital expenditures, earnings or competitive position.
Item 1A. Risk Factors
The loss of a key distributor or customer in the Company’s medical or custom products segments could cause a rapid and significant sales decline, which would likely result in a material decline in earnings. Many of our medical products are sold through large national distributors in the United States and Canada. We do not maintain long-term distribution agreements with most of these distributors. Instead, we supply them based on purchase orders that are issued by the customers on a daily or weekly basis. These supplier-customer relationships can generally be ended by either party with minimal notice. Consequently, if a large customer or distributor decided to discontinue purchasing our products, our sales and earnings could quickly decline. Our largest customers in the medical segment are Cardinal Health and McKesson Medical-Surgical, which each accounted for 14% of sales in the medical segment in fiscal 2010. In addition, all of our consumer foam products are sold through our exclusive distributor, Louisville Bedding Company, under a marketing and distribution agreement that expires in December 2012. The agreement automatically renews for successive three-year terms unless either party provides notice of its intent not to renew at least 60 days prior to the expiration date.
11
For more information on major customers and information on our business segments, see the discussions under Item 1. “Business – Major Customers,” Item 1. “Business – Industry Segment Data – Medical – Distributor and Private-Label Manufacturing Relationships” and Item 1. “Business – Industry Segment Data – Custom Products,” Note 17 – Major Customers and Note 18 – Operations and Industry Segments in the Notes to Financial Statements.
The current weakness in the U.S. economy and associated problems in the credit markets could cause our sales to decline, which in turn could have a material negative effect on our earnings. Our fastest growing products during the last five years have been our lines of therapeutic support surfaces, which consist of our PressureGuard and Geo-Mattress products as well as our private-label support surfaces. Sales of these support surfaces represented 42% of our total net sales in fiscal 2010. These products are generally considered by us and our customers to be capital purchase items instead of consumable supplies. We believe that purchases of these capital goods are more easily postponed during business downturns than purchases of consumables. Consequently, sales of our support surfaces are likely to be more sensitive to general economic weakness than other medical product lines in our business. Also, tight conditions in credit markets could make it more difficult for our customers to obtain financing for capital expenditures, which could slow sales particularly within our support surface product lines. Therapeutic support surface sales decreased 13% during fiscal 2010 compared with fiscal 2009. Sales of our therapeutic support surfaces may continue to decline if the economy remains weak.
In addition, our industrial products are sold primarily to the automotive, packaging and water sports industries, as well as various other manufacturers. Our industrial business has historically been more affected by general economic trends than other Span-America product lines. Therefore an economic downturn is likely to have a greater effect on sales of industrial products than on other product lines in our business. Sales of industrial products in fiscal year 2010 exceeded those of fiscal 2009, however, sales of industrial products could decline if the economy remains weak.
Since many of our operating costs are fixed within a reasonable range of sales and production activity, sales declines could result in proportionally greater declines in earnings performance. We would attempt to reduce expenses in response to lower sales levels, but we cannot give assurance that we would be able to fully offset the effect of a decline in sales volume, so our business could be materially adversely affected by an economic downturn or continuing weakness of the national economy.
Our medical business could lose sales volume or could have a lower sales growth rate as a result of government reimbursement changes in the medical market. A number of our medical products are eligible for reimbursement by Medicare. We receive no direct reimbursements from Medicare, but our customers often submit reimbursement requests to Medicare. For example, we sell therapeutic support surfaces to home health care dealers who in turn rent these products to patients. Medicare reimburses the dealers for some or all of the patient’s rental cost. If Medicare reimbursement rates are reduced, the demand for our medical products that are covered by Medicare could decrease, depending on the size of the rate reduction and could have a material adverse impact on our earnings.
12
Our earnings could be negatively affected by raw material cost increases that we are unable to recover through sales price increases. The cost of polyurethane foam represented approximately 42% of our total cost of goods sold in fiscal 2010. An increase in foam raw material costs that we are not able to pass through to our customers by increasing prices could have a significant negative effect on our profitability. Besides polyurethane foam, our other major raw material categories include mattress covers made of various water proof fabrics, vinyl bags, vinyl air cylinders, electronic components for mattresses and corrugated boxes. Raw materials are our single largest cost category, representing approximately 73% of our total cost of goods sold in fiscal 2010. Cost increases in these raw materials could have a significant adverse effect on earnings if we are unable to recover the higher costs through sales price increases or operating expense reductions.
Changes in applicable laws or increased government regulations to limit carbon dioxide and other greenhouse gas emissions as a result of concern over climate change, may result in increased raw material or other costs, which would negatively affect our profitability.
Our sales volume could decline as a result of competition from low-cost foreign imports. During the last two years, we have experienced increased competition in our medical and custom products segments from low-cost foreign imports. In the medical segment, the number of low-cost, imported mattress products has increased in the last two years, but it has not yet had a significant impact on our medical business. We believe that we have potentially greater exposure to low-cost imports in our consumer bedding product lines because those products have more commodity-like characteristics than our medical products. Also, our customers, which are generally national retailers, are more likely to change suppliers to buy lower-cost products. Therefore, we could lose significant sales volume in our consumer bedding business and some portion of our medical sales volume if we are unable to compete effectively with low-cost imports.
Certain of our medical products are classified as medical devices and are regulated by the FDA. These regulations require, among other things, that medical device manufacturers register with the FDA, list devices manufactured by them, and file various reports. In addition, our manufacturing facilities are subject to periodic inspections by regulatory authorities and must comply with “good manufacturing practices” as required by the FDA and state regulatory authorities. Although we believe that we are in substantial compliance with applicable regulations, the existence of the regulations creates the risk of a product recall and related expenses as well as the risk of additional expenses required to meet the regulatory requirements.
Item 1B. Unresolved Staff Comments
None
13
Item 2. Properties
We own our principal office and manufacturing facility, which is located in Greenville, South Carolina. This facility contains approximately 188,000 square feet used by the medical and custom products segments and is located on a 13-acre site. We believe that our current manufacturing and storage space is adequate to support our operations during the next several years, depending on sales growth rates.
We also lease 15,000 square feet of warehouse space in Salt Lake City, Utah for use as a distribution center for our medical products. We lease this facility on a month-by-month basis at a rate of $6,750 per month.
We consider the South Carolina and Utah facilities to be suitable and adequate for their intended purposes.
Item 3. Legal Proceedings
From time to time we are a party to various legal actions arising in the normal course of business. We believe that as a result of legal defenses and insurance arrangements with parties believed to be financially capable, there are no proceedings threatened or pending against us that, if determined adversely, would have a material adverse effect on our financial position or results of operations.
Item 4. Reserved
14
PART II
Item 5. Market for the Registrant's Common Equity, Related Stockholder Matters and Issuer Purchases of Equity Securities
The common stock of Span-America Medical Systems, Inc. trades on The NASDAQ Global Market® under the symbol SPAN. As of December 17, 2010, there were 2,757,364 common shares outstanding, 175 shareholders of record and approximately 1,275 beneficial shareholders. The closing price of Span-America's stock on December 17, 2010 was $15.10 per share.
The high and low sales prices for the Company’s Common Stock in each of the last eight fiscal quarters is shown on the following table.
|
Quarterly Stock Price Data
|
||||||||||||||||||||
|
First
|
Second
|
Third
|
Fourth
|
Year
|
||||||||||||||||
|
For Fiscal 2010
|
||||||||||||||||||||
|
High
|
$ | 17.18 | $ | 18.69 | $ | 19.99 | $ | 18.17 | $ | 19.99 | ||||||||||
|
Low
|
13.35 | 15.76 | 15.91 | 13.31 | 13.31 | |||||||||||||||
|
For Fiscal 2009
|
||||||||||||||||||||
|
High
|
$ | 12.94 | $ | 10.75 | $ | 11.94 | $ | 13.53 | $ | 13.53 | ||||||||||
|
Low
|
8.03 | 7.76 | 8.05 | 10.54 | 7.76 | |||||||||||||||
The Company has paid a regular quarterly cash dividend since January 1990. In April 2008, the Board increased the quarterly dividend to $0.09 per share from $0.08 per share. In November 2009, the Board increased the quarterly dividend to $0.10 per share from $0.09 per share. In May 2010, the Board declared a special cash dividend of $1.00 per share paid on June 4, 2010. We expect the Company to continue to pay quarterly dividends for the foreseeable future, though the Board may discontinue paying dividends at any time. Future dividend payments will depend upon the Company’s earnings and liquidity position. See the discussion of our revolving bank credit facility in Note 9 – Borrowings in the Notes to Financial Statements for a description of restrictions on our ability to pay dividends and repurchase our stock, which description is incorporated herein by reference.
The information regarding equity compensation plans set forth under Item 12 below is incorporated herein by reference.
15
ISSUER PURCHASES OF EQUITY SECURITIES
|
Period
|
(a) Total Number
of Shares
Purchased
|
(b) Average
Price Paid
per Share
|
(c) Total Number
of Shares
Purchased as Part
of Publicly
Announced Plans
or Programs
|
(d) Maximum
Number of
Shares that
May Yet Be
Purchased Under
the Plans
|
|
July 4, 2010 –
July 31, 2010
|
0
|
N/A
|
0
|
104,096
|
|
Aug. 1, 2010 –
Aug. 28, 2010
|
3,456
|
15.27
|
3,456
|
100,640
|
|
Aug. 29, 2010 –
Oct. 2, 2010
|
4,137
|
14.60
|
4,137
|
96,503
|
|
Total
|
7,593
|
14.90
|
7,593
|
96,503
|
The Company announced on November 28, 2007 that the Board of Directors authorized the Company to repurchase up to 138,772 shares of its common stock. On February 11, 2009, the Board expanded the repurchase program by 100,000 shares, bringing the total number of authorized shares to 238,772. The program may be suspended or discontinued at any time.
16
PERFORMANCE GRAPH
Notwithstanding any statement in any of the Company’s previous or future filings under the Securities Act of 1933, as amended, or the Securities Exchange Act of 1934, as amended, incorporating future or past filings, including this Annual Report on Form 10-K, in whole or in part, the following Performance Graph shall not be incorporated by reference into any such filing unless the incorporation specifically lists the following Performance Graph.
The following graph sets forth the performance of the Company’s Common Stock for the five-year period from October 1, 2005 through October 2, 2010, compared to the Russell MicroCap Index and a peer group index. The peer group index was prepared by an unaffiliated third party and is comprised of all exchange-listed companies that had the standard industry classification code 3842 (which relates to medical products and supplies) as of October 2, 2010. The companies included in the peer group index are shown below. All stock prices reflect the reinvestment of cash dividends.
COMPARISON OF CUMULATIVE TOTAL RETURN AMONG
SPAN-AMERICA MEDICAL SYSTEMS, INC.,
THE RUSSELL MICROCAP INDEX
AND A PEER GROUP
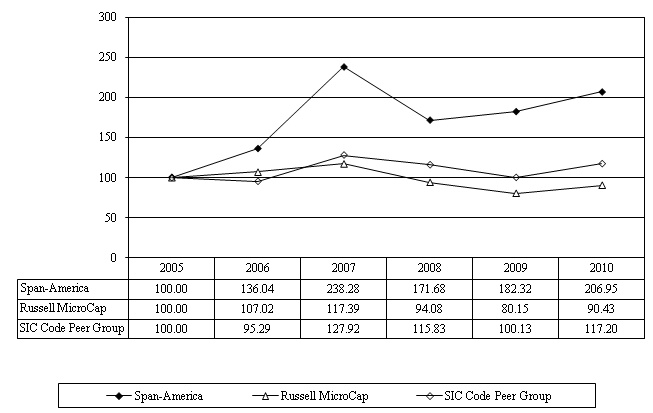
Assumes $100 invested on October 1, 2005.
Assumes dividends reinvested. Fiscal year ended October 2, 2010.
17
COMPANIES INCLUDED IN PEER GROUP INDEX
Standard Industry Classification Code 3842
at October 2, 2010
|
Align Technology, Inc.
|
Allied Healthcare Products, Inc.
|
American Medical Systems Holdings, Inc.
|
|
Andover Medical, Inc.
|
Cardima, Inc.
|
Cardiogenesis Corp.
|
|
Cardo Medical, Inc.
|
Chad Therapeutics, Inc.
|
Crearive Learning Corp.
|
|
Edwards Lifesciences Corp.
|
Exactech, Inc.
|
Hansen Medical, Inc.
|
|
Intuitive Surgical, Inc.
|
Invacare Corp.
|
Kinetic Concepts, Inc.
|
|
Lakeland Industries, Inc.
|
Mako Surgical Corp.
|
Mammatech Corp.
|
|
MB Software Corp.
|
Medical Action Industries Inc.
|
Medical Solutions Management, Inc.
|
|
Milestone Scientific Inc.
|
Mine Safety Appliances Co.
|
Nano Mask Inc.
|
|
Otix Global, Inc.
|
Patient Safety Technologies, Inc.
|
PC Group Incorporated
|
|
Point Blank Solutions, Inc.
|
Quantum MRI, Inc.
|
RTI Biologics, Inc.
|
|
Sharps Compliance Corp.
|
Steris Corp.
|
Symmetry Medical, Inc.
|
|
Synovis Life Technologies, Inc.
|
SyntheMed, Inc.
|
Winner Medical Group Inc.
|
|
Wright Medical Group, Inc.
|
Zimmer Holdings, Inc.
|
18
Item 6. Selected Financial Data
Selected Financial Data for the Company’s last five fiscal years is shown in the table below.
| Five-Year Financial Summary | ||||||||||||||||||||
|
(Amounts in thousands, except per share and employee data)
|
||||||||||||||||||||
|
2010
|
2009
|
2008
|
2007 (1)
|
2006 (1)
|
||||||||||||||||
|
For the year:
|
||||||||||||||||||||
|
Net sales
|
$ | 52,356 | $ | 55,867 | $ | 59,265 | $ | 60,544 | $ | 51,436 | ||||||||||
|
Gross profit
|
19,421 | 20,208 | 20,395 | 20,951 | 16,438 | |||||||||||||||
|
Operating income
|
6,734 | 6,868 | 7,518 | 8,128 | 5,093 | |||||||||||||||
|
Income from continuing operations
|
4,506 | 4,705 | 4,919 | 5,505 | 3,779 | |||||||||||||||
|
Net income
|
4,506 | 4,684 | 4,869 | 2,874 | 3,055 | |||||||||||||||
|
Cash flow from operations
|
3,758 | 6,806 | 5,250 | 6,294 | 2,497 | |||||||||||||||
|
Capital expenditures for continuing
|
||||||||||||||||||||
|
operations
|
271 | 355 | 692 | 1,009 | 1,071 | |||||||||||||||
|
Per share:
|
||||||||||||||||||||
|
Income from continuing operations:
|
||||||||||||||||||||
|
Basic
|
$ | 1.65 | $ | 1.72 | $ | 1.77 | $ | 2.02 | $ | 1.43 | ||||||||||
|
Diluted
|
1.59 | 1.68 | 1.71 | 1.92 | 1.36 | |||||||||||||||
|
Net income:
|
||||||||||||||||||||
|
Basic
|
$ | 1.65 | $ | 1.72 | $ | 1.76 | $ | 1.06 | $ | 1.15 | ||||||||||
|
Diluted
|
1.59 | 1.67 | 1.70 | 1.00 | 1.10 | |||||||||||||||
|
Cash dividends declared (2)
|
1.40 | 0.36 | 0.34 | 5.30 | 0.195 | |||||||||||||||
|
(1)
|
As restated to show the safety catheter segment as a discontinued operation. See Note 12 in Notes to Financial Statements.
|
|
(2)
|
Cash dividends declared include special dividends of $1.00 per share in 2010 and $5.00 per share in 2007.
|
19
|
Five-Year Financial Summary
|
||||||||||||||||||||
|
(Amounts in thousands, except per share and employee data)
|
||||||||||||||||||||
|
2010
|
2009
|
2008
|
2007 (1)
|
2006 (1)
|
||||||||||||||||
|
|
||||||||||||||||||||
|
At end of year:
|
||||||||||||||||||||
|
Working capital
|
$ | 11,868 | $ | 10,858 | $ | 8,048 | $ | 7,447 | $ | 13,338 | ||||||||||
|
Property and equipment - net
|
5,685 | 6,159 | 6,569 | 6,537 | 6,137 | |||||||||||||||
|
Total assets
|
27,212 | 26,835 | 24,113 | 23,838 | 31,012 | |||||||||||||||
|
Long term debt
|
700 | 3,700 | ||||||||||||||||||
|
Shareholders' equity
|
21,379 | 20,573 | 17,332 | 13,788 | 24,517 | |||||||||||||||
|
Book value per share
|
7.75 | 7.59 | 6.28 | 4.97 | 9.22 | |||||||||||||||
|
Number of employees from continuing
|
||||||||||||||||||||
|
operations
|
218 | 212 | 253 | 317 | 287 | |||||||||||||||
|
Key ratios:
|
||||||||||||||||||||
|
Return on net sales (2)
|
8.6 | % | 8.4 | % | 8.2 | % | 4.7 | % | 5.9 | % | ||||||||||
|
Return on average shareholders' equity (2)
|
21.5 | % | 24.7 | % | 31.3 | % | 15.0 | % | 13.3 | % | ||||||||||
|
Return on average total assets (2)
|
16.7 | % | 18.4 | % | 20.3 | % | 10.5 | % | 10.2 | % | ||||||||||
|
Current ratio
|
3.4 | 3.0 | 2.5 | 2.3 | 3.8 | |||||||||||||||
|
(1)
|
As restated to show the safety catheter segment as a discontinued operation. See Note 12 in Notes to Financial Statements.
|
|
(2)
|
These "Return" ratios are calculated using net income as shown above, which includes losses from discontinued operations.
|
20
Item 7. Management's Discussion and Analysis of Financial Condition and Results of Operations
OVERVIEW
Span-America’s operations are divided into two primary business units or segments: medical and custom products. Our revenues, profits and cash flows are derived from the development, manufacture and sale of products for these two market segments. In the medical segment, we manufacture and market a comprehensive selection of pressure management products, including Geo-Matt®, PressureGuard®, Geo-Mattress®, Span-Aids® and Isch-Dish® products. We also market the Risk Manager® bedside safety mat, which is manufactured to our specifications by a third-party supplier. We license and market, but do not manufacture, Selan® skin care products. In the custom products segment, we manufacture consumer mattress pads and pillows for the retail bedding market and various engineered foam products for the industrial market. Our consumer mattress pads and pillows are marketed by our exclusive distributor, Louisville Bedding Company. We sell the industrial product line directly to our customers instead of using distributors. Prior to fiscal year 2008, we had a third business unit engaged in the development, manufacture and sale of safety catheters. We decided to exit the safety catheter business in October 2007. Revenues and expenses related to the safety catheter business in fiscal years 2009 and 2008 are shown in our financial statements as a discontinued operation. We had no revenues or expenses related to the safety catheter business in fiscal year 2010.
RESULTS OF OPERATIONS FISCAL 2010 VS. 2009
Summary
Total sales in fiscal 2010 declined 6% to $52.4 million compared with $55.9 million in fiscal 2009 because of lower sales volumes in both our medical and custom products segments. Medical sales were down 6% to $35.6 million due primarily to lower sales of capital equipment medical goods, which we believe were negatively affected by the soft economy and uncertainty related to health care reform. Custom products sales for fiscal 2010 decreased 7% to $16.8 million due to lower sales of consumer bedding products compared with fiscal year 2009. Net income for fiscal year 2010 declined 4% to $4.5 million, or $1.59 per diluted share, because of lower sales levels, a less profitable sales mix within our consumer product lines and higher R&D expenses in the medical segment.
Sales
Total sales in our core medical business decreased 6% to $35.6 million in fiscal 2010 compared with $37.8 million in fiscal 2009. The decline was due to lower sales of therapeutic support surfaces, which were down by 13% to $22.2 million during fiscal 2010, compared with $25.5 million in fiscal 2009. Therapeutic support surfaces, or mattresses, are our largest medical product line, making up 62% of our medical segment sales in fiscal 2010 and 67% in fiscal 2009. We sell these products to hospitals, long-term care facilities and home care dealers throughout the United States and Canada. Sales of therapeutic support surfaces declined in fiscal 2010 due to reduced demand for capital equipment goods among many of our customers and the previous expiration and subsequent wind down of a private label supply contract with Hill-Rom, which was previously disclosed. Most of the fiscal 2010 decrease in support surface sales came from our PressureGuard® CFT® non-powered products and our PressureGuard APM²® powered products.
21
Performance in our other medical product lines included a 62% increase in sales of the new Risk Manager® bedside safety mat, which we introduced at the beginning of our second fiscal quarter in 2009. Risk Manager sales in fiscal 2010 were $1.3 million compared with $801,000 in fiscal 2009. Sales of our Span-Aids patient positioners and mattress overlays increased by 4% and 5%, respectively, during fiscal 2010 compared with fiscal 2009. Selan skin care sales rose 10%. Sales of seating products remained level during fiscal 2010. The growth in sales of positioners, overlays and Selan products in fiscal 2010 was mainly due to stronger demand from our customers in the acute care portion of the medical market. Medical sales accounted for 68% of total net sales in both fiscal years 2010 and 2009.
We expect medical sales for fiscal 2011 to be similar to those of fiscal 2010. We believe that expected sales growth in the acute care market will be at least partially offset by continued sales weakness in the long-term care and home care markets, primarily involving our therapeutic support surfaces. We expect the sales growth in the acute care market to be broad-based, coming from most of our medical product lines. In particular, we expect to benefit from our recent launch of the Custom Care® line of therapeutic support surfaces, which is targeted primarily at the acute care market. The Custom Care products feature a unique design of foam and air technology available in non-powered models or powered versions that offer alternating pressure and lateral rotation therapy. In the long-term care and home care markets, we expect demand to remain weak for at least the first half of fiscal 2011. Many customers in these markets continue to be pressured by Medicare changes, Medicaid funding uncertainties, capital constraints and general lack of confidence about the economy.
Our custom products segment consists of consumer bedding products and specialty foam products for the industrial market. Sales in the custom products segment decreased 7% during fiscal 2010 to $16.8 million from $18.1 million in fiscal 2009. The entire sales decrease occurred in the consumer part of the custom products segment, where sales were down 10% to $13.8 million compared with $15.3 million in fiscal 2009. The consumer sales decline was caused mainly by the loss of volume from a market test program with a large retailer that increased sales in 2009 but was not repeated in 2010 and the loss of a retail customer in Canada due to a routine change in their sales program. Sales to our largest consumer retail customer declined slightly during fiscal 2010, but the decline was primarily caused by a temporary sales price reduction, which began in June 2010 as part of a sales promotion program. We launched a new line of consumer products to a new customer in the fourth quarter this year, and the early sales performance at the retail level has been positive. We expect that sales to this new customer will grow in future quarters. All of our consumer sales are made through our marketing and distribution partner, Louisville Bedding Company.
22
In the other part of the custom products segment, industrial sales increased 8% in fiscal 2010 to $3.0 million compared with $2.8 million in fiscal 2009. This growth was broad-based and was generated from new and existing customers. During the last three quarters of fiscal 2010, demand for our industrial products increased, particularly among customers in the automotive and packaging markets. However, we believe that industrial sales in fiscal 2011 will be similar to fiscal 2010 levels due to an expected reduction in sales to a customer in the water sports market. This projected decline in water sports sales should be at least partly offset by higher sales to other customers. We believe these expected changes and the new consumer products customer noted above will result in modest overall sales growth in the custom products segment for fiscal 2011.
Gross Profit
Our gross profit decreased by 4% during fiscal 2010 to $19.4 million compared with $20.2 million in fiscal 2009. The decrease was caused by lower sales volume and a less profitable sales mix within our consumer product lines. Gross margin, however, increased to 37.1% for fiscal 2010 from 36.2% in fiscal 2009. The increase in gross margin was the result of a more profitable sales mix in the medical segment, an increase in sales volume of industrial products and improved manufacturing efficiencies in the medical segment as a result of the ongoing implementation of lean manufacturing techniques during the year. We expect our gross profit in fiscal 2011 to be higher than in 2010. However, our gross margin in fiscal 2011 could be slightly lower than 2010 levels due to an expected shift in sales mix toward the lower-margin consumer products.
Selling, Research & Development and Administrative Expenses
Selling and marketing expenses decreased 4%, to $8.7 million and 16.6% of net sales in fiscal 2010 compared with $9.0 million and 16.2% of net sales in fiscal 2009. The decrease occurred in the medical segment and was primarily the result of lower sales commissions related to the decline in sales of therapeutic support surfaces and lower incentive compensation as a result of the earnings decline during the year. We believe that total selling and marketing expenses for fiscal 2011 will increase over 2010 levels.
Total research and development expenses increased 8% to $938,000 in fiscal 2010 compared with $866,000 in fiscal 2009. We incur almost all of our research and development expenses in the medical segment for the development of new products, new features of existing products and design improvements. The increase in expense was caused by a greater number of new product development projects in fiscal 2010 compared with 2009. R&D expenses will likely fluctuate from quarter to quarter and from year to year, depending on the nature of the development projects being pursued. We expect total R&D expenses in fiscal 2011 to be slightly lower than 2010 levels.
General and administrative expenses decreased 10% to $3.1 million in fiscal 2010 from $3.4 million in fiscal 2009. The expense decrease during fiscal 2010 was caused by lower costs for incentive compensation and property-casualty insurance premiums. In addition, we had income of $111,000 in fiscal 2010 from the cash value of life insurance compared with expense of $27,000 in fiscal 2009. We expect administrative expenses for fiscal 2011 to be slightly higher than those of fiscal 2010.
Operating Income
In the medical segment, operating income for fiscal 2010 rose by 3% to $5.7 million compared with $5.6 million in fiscal 2009. The increase occurred even though medical sales declined and was the result of a more profitable medical sales mix, improved manufacturing efficiencies in the medical segment and lower expenses for commissions and incentive compensation compared with last fiscal year.
23
Operating income in the custom products segment decreased 24% to $1.6 million in fiscal 2010 compared with $2.1 million in fiscal 2009. The decrease in profitability of the custom products segment was caused by lower sales volume and a less profitable sales mix among our consumer product lines. In addition, our manufacturing costs for consumer products were higher, particularly in the fourth fiscal quarter, due to costs related to the start-up of a new consumer product line.
Operating income for the total company declined 2% in fiscal 2010 to $6.7 million compared with $6.9 million in fiscal 2009. The decline in operating income was caused primarily by lower sales volume in the medical and custom products segments, a less profitable sales mix within our consumer product lines, higher consumer manufacturing costs and an increase in R&D costs in the medical segment.
Non-Operating Income
Investment and other income increased by 80% to $52,000 in fiscal 2010 compared with $29,000 in fiscal 2009. The increase was caused primarily by higher interest income as a result of higher average levels of short-term investments in 2010 compared with 2009. We expect non-operating income in fiscal 2011 to be lower than in fiscal 2010 because fiscal 2010 included a gain on the sale of assets that is not likely to be repeated in fiscal 2011.
Interest Expense
We repaid the remaining balance of $700,000 on our revolving note in the first quarter of fiscal 2009. Therefore we incurred no interest expense in fiscal 2010. See “Liquidity and Capital Resources” below for further discussion about our revolving credit facility.
Net Income and Dividends
Net income decreased 4% in fiscal 2010 to $4.5 million, or $1.59 per diluted share, compared with $4.7 million, or $1.67 per diluted share, in fiscal 2009. The decline in earnings was caused primarily by lower sales volume in the medical and consumer product lines, a less profitable sales mix among our consumer products and slightly higher R&D expenses in the medical segment.
During fiscal 2010, we paid dividends of $3.9 million, or 86% of net income for the year. This amount consisted of four quarterly dividends of $0.10 per share and one special dividend of $1.00 per share. During fiscal 2009, we paid dividends of $983,000, or 21% of net income for the year. This amount consisted of four quarterly dividends of $0.09 per share.
RESULTS OF OPERATIONS FISCAL 2009 VS. 2008
Summary
Total sales in fiscal 2009 declined 6% to $55.9 million compared with $59.3 million in fiscal 2008 because of lower sales volume in our medical segment, which was partially offset by increases in sales volume in our custom products segment. Medical sales were down 11% to $37.8 million due mainly to a decline in sales of private label therapeutic support surfaces. Custom products sales for fiscal 2009 increased 7% to $18.1 million due to higher sales of consumer bedding products compared with fiscal year 2008.
24
Income from continuing operations declined 4% in fiscal 2009 to $4.7 million, or $1.68 per diluted share, because of lower sales levels. Net income, which includes results from the discontinued safety catheter segment, also fell 4% in fiscal 2009 to $4.7 million, or $1.67 per diluted share.
Sales
Total sales in our core medical business declined 11% to $37.8 million in fiscal 2009 compared with $42.5 million in fiscal 2008. The decline in medical sales was primarily related to the expiration of a private label supply contract with Hill-Rom that accounted for $7.0 million in fiscal 2008 sales compared with $2.0 million in fiscal 2009 sales. Consequently, sales of therapeutic support surfaces, including private label products, declined by 20% to $25.5 million during fiscal 2009 compared with $31.8 million in fiscal 2008. Therapeutic support surfaces, or mattresses, are our largest medical product line, making up 67% of our medical segment sales in fiscal 2009 and 75% in fiscal 2008. We sell these specialty mattresses to hospitals, long-term care facilities and home care dealers throughout the United States and Canada. Sales of therapeutic support surfaces declined in fiscal 2009 compared to previous fiscal years due primarily to the expiration of the private label contract mentioned above and secondarily due to reduced capital spending by many of our customers. Excluding sales to Hill-Rom in both years, sales of therapeutic support surfaces would have declined by 5% in fiscal 2009 compared with fiscal 2008.
Sales of the new Risk Manager™ bedside safety mat, introduced at the beginning of our second fiscal quarter in 2009, were $801,000 in fiscal 2009. Sales of our Span-Aids patient positioners and mattress overlays both increased by 7% during fiscal 2009 compared with fiscal 2008. Selan skin care sales fell 4%, and sales of seating products increased 10% during fiscal 2009. The growth in sales of positioners, overlays and seating products in fiscal 2009 was mainly due to sales price increases during the year. Medical sales accounted for 68% of total net sales in fiscal 2009 compared with 72% in fiscal 2008.
Sales in the custom products segment increased 7% during fiscal 2009 to $18.1 million from $16.8 million in fiscal 2008. The primary reason for the increase occurred in the consumer part of the custom products segment, where sales increased 17% to $15.3 million compared with $13.0 million in fiscal 2008. This increase was caused by higher volumes of consumer mattress overlays sold to existing customers and the addition of several new customers during the year. All of our consumer products are sold through our marketing and distribution partner, Louisville Bedding Company.
Early in 2009, Span-America was selected as one of three companies to supply consumer mattress pads to a customer in the warehouse club market. We began shipping the new products in April 2009, and our sales to this customer in fiscal 2009 were $2.0 million. We learned in August 2009 that the customer had selected an offshore company as its sole supplier of mattress pads, and that Span-America would not be a continuing supplier for this program.
25
In the other part of the custom products segment, industrial sales decreased 26% in fiscal 2009 to $2.8 million compared with $3.8 million in fiscal 2008. This portion of our business was more impacted by the weak economy as our largest customers serve the water sports, automotive and packaging markets that were adversely affected by the recession.
Gross Profit
Our gross profit decreased by 1% during fiscal 2009 to $20.2 million compared with $20.4 million in fiscal 2008. Gross margin increased to 36.2% in fiscal 2009 from 34.4% in fiscal 2008. The decrease in gross profit was caused mostly by lower sales volume in the medical segment. The increase in gross margin was the result of lower raw material costs during fiscal 2009 and the ongoing implementation of lean manufacturing techniques during the year. As a result of the lean manufacturing initiatives, we improved our overall manufacturing efficiency, and specifically we reduced scrap rates, improved product yields and reduced labor costs.
Selling, Research & Development and Administrative Expenses
Selling and marketing expenses increased 1%, or $49,000, to $9.0 million and 16.2% of net sales in fiscal 2009 compared with 15.2% of net sales in fiscal 2008. The increase occurred in the medical segment and was primarily the result of higher incentive compensation, which was partially offset by declines in evaluation samples expense and shipping costs.
Total research and development expenses increased 32% to $866,000 in fiscal 2009 compared with $657,000 in fiscal 2008. The increase in expense during fiscal 2009 was caused by a greater number of new product development projects and higher incentive compensation for R&D employees.
General and administrative expenses increased 6% to $3.4 million in fiscal 2009 from $3.2 million in fiscal 2008. The expense increase during fiscal 2009 was caused by higher incentive compensation expense and an increase in depreciation expenses associated with our new enterprise resource planning system. These expense increases were partially offset by decreases in property and casualty insurance and bad debt expenses. Incentive compensation is determined by comparing actual operating earnings to planned operating earnings for the current fiscal year. Incentive compensation expense increased in 2009 because we exceeded our operating earnings goal by a wider margin in 2009 than in 2008.
Operating Income
In the medical segment, operating income for fiscal 2009 declined by 27% to $5.6 million compared with $7.6 million in fiscal 2008. The decrease for fiscal 2009 was caused by lower medical sales volume and higher R&D expenses compared with fiscal 2008.
Operating income in the custom products segment increased 166% to $2.1 million in fiscal 2009 compared with $801,000 in fiscal 2008. The increase in profitability of the custom products segment was caused by higher sales volume in our consumer product lines, improved manufacturing efficiencies as discussed above and lower raw material costs. The profit improvement for our consumer product lines was partially offset by a profit decline in our industrial product lines caused by a sharp decrease in industrial sales volume.
26
Operating income for the total company declined 9% in fiscal 2009 to $6.9 million compared with $7.5 million in fiscal 2008. As discussed above, the decline in medical operating income, caused by lower medical sales volume, was greater than the improvement in operating income for the custom products segment.
Non-Operating Income
Investment and other income declined by 43% to $29,000 in fiscal 2009 compared with $51,000 in fiscal 2008. The decline was caused by lower interest rates on overnight investments in fiscal 2009 compared with 2008.
Interest Expense
Interest expense in fiscal 2009 decreased 96% to $4,000 compared with $108,000 in fiscal 2008. The decrease was caused by a lower average balance of long-term debt in fiscal 2009 compared with 2008 as we paid off the remaining balance of $700,000 on our revolving note in the first quarter of fiscal 2009. See “Liquidity and Capital Resources” below for further discussion about our revolving credit facility.
Net Income and Dividends
Net income, which includes results from the discontinued safety catheter segment, decreased 4% in fiscal 2009 to $4.7 million, or $1.67 per diluted share, compared with $4.9 million, or $1.70 per diluted share, in fiscal 2008. The decrease in net income was primarily the result of lower medical sales volume.
During fiscal 2009, we paid dividends of $983,000, or 21% of net income for the year. This amount consisted of four quarterly dividends of $0.09 per share. During fiscal 2008, we paid dividends of $943,000, or 19% of net income for the year. This amount consisted of two quarterly dividends of $0.08 per share and two quarterly dividends of $0.09 per share.
LIQUIDITY AND CAPITAL RESOURCES
We generated cash from operations of $3.8 million during fiscal 2010, which represented a 45% decrease compared with cash flow of $6.8 million in fiscal 2009. The decrease in cash flow during 2010 was caused mostly by a change in the level of accounts receivable during fiscal 2010 compared with fiscal 2009. During fiscal 2009, accounts receivable declined by $1.5 million primarily because the balance at the beginning of fiscal 2009 was temporarily higher than usual, and the balance at the end of fiscal 2009 was slightly lower than usual, which created an abnormal reduction in accounts receivable during fiscal 2009. We had the opposite situation, although to a lesser degree, in fiscal 2010. These changes were mainly the result of timing of payments received from customers near the end of each fiscal year and are not necessarily representative of the average level of accounts receivable during the full year.
27
The main uses of cash provided by operations in fiscal 2010 were purchases of marketable securities of $1.7 million, payment of dividends of $3.9 million, stock repurchases of $346,000 and equipment purchases of $271,000.
Working capital increased by $1.0 million, or 9%, to $11.9 million during fiscal 2010. The increase in working capital was primarily caused by a higher balance in accounts receivable. In addition, our current ratio increased to 3.4 at fiscal year-end 2010 from 3.0 at fiscal year-end 2009.
Accounts receivable, net of allowances, increased 13%, or $824,000, to $7.1 million at the end of fiscal 2010 compared with $6.3 million at the end of fiscal 2009. The increase was due to a higher level of non-trade accounts receivable at the end of fiscal 2010 and the timing of customer payments received near the end of the past two fiscal years. Non-trade accounts receivable consist mainly of balances due from suppliers for rebates earned or returned goods. The days sales outstanding (or average collection time), calculated using a 12-month average for trade accounts receivable balances, improved slightly to 42.5 days in 2010 compared with 43.1 days in 2009. The shorter collection time is primarily due to normal month-to-month fluctuations in the timing of payments. All of our accounts receivable are unsecured.
Inventory, net of reserves, increased by $226,000, or 6%, to $4.1 million at fiscal year-end 2010 compared with $3.9 million at fiscal year-end 2009. The change was the result of an increase in raw material inventory for medical products that was partially offset by a decrease in medical finished goods inventory. Inventory turns decreased slightly to 8.2 times in fiscal 2010 compared with 9.0 times in fiscal 2009. We expect inventory levels in fiscal 2011 to be similar to 2010 fiscal year-end levels.
Our deferred income tax asset decreased by 33%, or $330,000, during fiscal 2010 to $667,000 from $997,000 due mostly to a decrease in accrued incentive compensation caused by a decrease in management bonuses in fiscal 2010 compared with fiscal 2009.
Prepaid expenses more than tripled to $431,000 during fiscal 2010 from $102,000 at the end of fiscal 2009. The increase was the result of an expected refund of income taxes.
Net property and equipment decreased by $474,000, or 8%, during fiscal 2010. The change resulted from the combination of $743,000 in depreciation expense offset by capital expenditures of $271,000. We expect capital expenditure levels in fiscal 2011 to be slightly higher than those of fiscal 2010.
Other assets increased by 12%, or $288,000, to $2.8 million during fiscal 2010 compared with $2.5 million at fiscal year-end 2009 due to an increase in deposits placed with raw material suppliers and an increase in the cash value of life insurance.
Our accounts payable increased by 39%, or $656,000, in fiscal 2010 to $2.3 million due mostly to an increase in raw material purchases in September 2010. Accrued and sundry liabilities decreased by 29% during the year to $2.6 million compared with $3.7 million last year. The decrease was caused by lower accruals for incentive compensation and income taxes payable.
28
In the first quarter of fiscal 2009, we repaid the remaining balance of $700,000 on our revolving line of credit, which was outstanding at fiscal year-end 2008. As of October 2, 2010, we had no borrowings under the revolving line of credit. The maximum principal amount we can borrow at any one time under the loan agreement is $10 million. The maturity date is June 5, 2012. The agreement is unsecured and accrues interest at a variable rate equal to 30-day LIBOR plus a margin ranging from 85 to 165 basis points depending on our leverage ratio (as defined in the agreement). The margin in effect during fiscal 2009, the last time we incurred interest, was 85 basis points. The interest rate, including the margin, at November 20, 2008, the last date at which interest expense was incurred, was 3.70%. Interest-only payments are required monthly. There are no unused line fees associated with the revolver. We have pledged to grant the bank a security interest in our accounts, instruments, and chattel paper upon its request in the event of a default as defined in the agreement.
The credit facility includes financial covenants relating to tangible net worth and leverage ratios, and restricts mergers and acquisitions, assets sales, indebtedness, liens and capital expenditures. The credit facility also restricts dividends and stock repurchases during any fiscal year to an aggregate amount of no more than 50% of the sum of (i) our income from continuing operations for that fiscal year plus (ii) the absolute value of any aggregate after-tax, non-cash and extraordinary losses for that fiscal year. As an exception to the restriction above, we may pay a regular quarterly dividend in an amount no greater than the previous quarter’s regular dividend so long as we remain in compliance with the financial covenants after giving effect to the payment of the dividend. Violation of loan covenants could result in acceleration of the term of the agreement.
We believe that we were in compliance with the loan covenants as of October 2, 2010 except for the covenant restricting dividends and stock repurchases. During fiscal year 2010, the total of our dividends and stock repurchases exceeded the maximum permitted threshold because of the $1.00 per share special dividend paid in June 2010, which increased our total 2010 dividend payments by $2.8 million. The lender has granted a waiver of compliance with the restriction on dividends and stock repurchases for our 2010 fiscal year.
We believe that funds on hand, funds generated from operations and funds available under our revolving credit facility are adequate to finance our operations and expected capital requirements during fiscal 2011 and for the foreseeable future.
OFF-BALANCE-SHEET ARRANGEMENTS
We have no off-balance-sheet arrangements.
CONTRACTUAL OBLIGATIONS
The following table summarizes our significant contractual obligations and commercial commitments at October 2, 2010 and the future periods in which such obligations are expected to be settled in cash. For additional information regarding these obligations, see the referenced footnotes in the Notes to Financial Statements under Item 8 below.
29
| Payments Due by Period | ||||||||||||||||||||
|
Contractual Obligations
|
Less Than
|
More Than
|
||||||||||||||||||
|
(dollars in thousands)
|
Total
|
1 Year
|
1-3 Years
|
3-5 Years
|
5 Years
|
|||||||||||||||
|
Operating lease obligations - Note 19
|
$ | 26 | $ | 11 | $ | 11 | $ | 4 | ||||||||||||
|
Purchase obligations - Note 20
|
4,275 | 655 | 1,460 | 1,460 | $ | 700 | ||||||||||||||
|
Deferred compensation - Note 10
|
1,164 | 114 | 227 | 227 | 596 | |||||||||||||||
|
Total contractual obligations
|
$ | 5,465 | $ | 780 | $ | 1,698 | $ | 1,691 | $ | 1,296 | ||||||||||
IMPACT OF INFLATION AND COST OF RAW MATERIALS
Based on current conditions in the markets for our primary raw materials, we expect inflation to be a small to moderate factor for our operations in fiscal 2011. Our raw material costs were relatively stable in fiscal 2010. We expect that stability to continue in the near term. However, we could experience upward pressure on our costs if demand for our commonly-used raw materials increases as a result of a strengthening U.S. economy or if oil prices increase materially. It is difficult to predict the impact that possible future raw material cost changes might have on our profitability. We can give no assurance that we will be able to offset future cost increases, and the inability to do so could negatively affect our profitability.
The cost of polyurethane foam is indirectly influenced by oil prices. However, other market factors also affect foam prices, including supply availability of chemicals used in the foam manufacturing process, demand for related products from domestic and international manufacturers, competition among domestic suppliers, our purchase volumes and regulatory requirements. Consequently, it is difficult for us to accurately predict the impact that inflation might have on our operations.
CRITICAL ACCOUNTING POLICIES
This discussion and analysis of financial condition and results of operations is based on our financial statements that we prepare in conformity with accounting principles generally accepted in the United States of America (GAAP). The preparation of our financial statements requires us to make estimates and assumptions that affect the reported amounts of assets, liabilities, revenues and expenses. These estimates and assumptions are based on historical experience and on various other factors that we believe are reasonable under the circumstances, the results of which form the basis for making judgments about the carrying values of assets and liabilities that are not readily apparent from other sources. These estimates and assumptions also require the application of certain accounting policies, many of which require us to make forecasts about future events and their estimated impact on amounts reported in our financial statements and related notes. We periodically review our accounting policies and estimates and make adjustments when facts and circumstances dictate.
30
Actual results may differ from these estimates under different assumptions or conditions. Any differences could have a material impact on our financial condition and results of operations.
In addition to the accounting policies more fully described in the Notes to Financial Statements included in this report, we have identified the following critical accounting policies used in the preparation of our financial statements.
Allowance for Doubtful Accounts
Credit evaluations are undertaken to set credit limits for all customers. We regularly evaluate past-due accounts included in our accounts receivable and provide what we estimate to be adequate reserves for doubtful accounts. Customer financial conditions may change and increase the risk of non-collectability and may require additional provisions, which would negatively impact our operating results. As of October 2, 2010, our provision for doubtful accounts represented approximately 2.1% of total accounts receivable, or $150,000. This compares with $155,000, or 2.4%, of total accounts receivable at fiscal year-end 2009.
Reserve for Obsolete and Excess Inventories
We regularly review inventory quantities on hand and adjust for excess and obsolete inventory based primarily on historical usage rates and our estimates of future product demand and production. Actual demand may differ from our estimate, in which case we may have understated or overstated the provision required for obsolete and excess inventory, which would have an impact on our operating results. As of October 2, 2010, our provision for excess and obsolete inventory represented approximately 7.3% of total inventories, or $326,000. This compares with $340,000, or 8.0%, of total inventories at fiscal year-end 2009.
Warranty Obligations
We warrant certain of our products for specific periods of time against manufacturing or performance defects. We provide for the estimated future cost of warranty obligations in cost of goods sold when the related revenue is recognized. The accrued warranty cost represents our best estimate at the time of sale of the total cost that we will incur to repair or replace covered products or parts. The amount of accrued estimated warranty cost is primarily based on historical experience as well as current information on repair costs. Actual warranty cost could differ from these estimated amounts. In addition, we receive warranties from certain suppliers of key components of our products, and we rely on these suppliers to replace or provide credit for their defective goods that might be used in our products. Such replacements or credits reduce our direct warranty costs. If our suppliers failed to honor their warranties, our warranty cost could increase. On a quarterly basis, we review the accrued balances and update the historical warranty cost trends. If we were required to accrue additional warranty cost in the future, it would negatively affect operating results. Our actual warranty expense was approximately $407,000 in fiscal 2010, $392,000 in fiscal 2009, and $438,000 in fiscal 2008. Our accrued warranty costs at October 2, 2010, were $570,000. See Note 8 in the Notes to Financial Statements for more information on product warranties.
31
Impairment of Goodwill
We evaluate goodwill in our medical business unit for impairment at least annually or more frequently if events occur or circumstances change that could reduce the fair value of our medical business unit. For fiscal year-end 2010, we determined that the fair value of the medical business unit exceeded its carrying value and thus no impairment charge was required. In assessing the value of goodwill, we must make assumptions regarding estimated future cash flows and other factors to determine the fair value of the medical business unit. If these estimates or their related assumptions change in the future, we may be required to record impairment charges, which would negatively impact operating results. As of October 2, 2010, the carrying value of goodwill was $1.9 million.
Impairment of Long-Lived Assets
“Impairment” is the condition that exists when the carrying amount of a long-lived asset or asset group is greater than its fair value. We evaluate long-lived assets for potential impairment whenever events occur or circumstances indicate that the carrying amount of the assets may not be recoverable. The carrying amount of a long-lived asset is not recoverable if it exceeds the sum of the undiscounted cash flows expected to result from the use and eventual disposition of the asset. If the carrying amount of a long-lived asset is not recoverable and is greater than its fair value, the asset is impaired and an impairment loss must be recognized. Accordingly, we recorded an impairment charge of $2.9 million in September of 2007, which eliminated 100% of the book value of the safety catheter assets. We have attempted to sell the assets related to the safety catheter business, but our efforts so far have been unsuccessful. Proceeds from a future sale of these assets, if any, will be recorded as a gain on the disposition of assets from discontinued operations. (See Note 12 in the Notes to Financial Statements.)
Present Value of Deferred Compensation
We are obligated under the terms of a retirement agreement to make fixed payments for the remaining lives of Span-America’s founder and his ex-wife as discussed in Note 10 “Deferred Compensation” in the Notes to Financial Statements. This obligation can be funded from internally generated cash or from the cash value of company-owned life insurance policies, which had a value of $1.9 million at October 2, 2010. See Item 7A below and Notes 6 and 10 in the Notes to Financial Statements for more information on deferred compensation and the cash value of life insurance. We have fully accrued the present value of the expected payments due over the combined estimated life expectancy of our founder and his ex-wife. In calculating this present value we used a discount rate of 8%, which is an estimate of the effective long-term rate of return on the portfolio. If the actual rate of return was significantly lower than our estimate and we were required to accrue additional deferred compensation costs in the future, it would negatively affect operating results. As of October 2, 2010, we had recorded a deferred compensation liability of approximately $774,000, including current and long-term portions. If we reduced the discount rate by 1%, the deferred compensation liability would be increased by approximately $37,000 and pre-tax income would be reduced by the same amount.
32
Item 7A. Quantitative and Qualitative Disclosures About Market Risk
We are exposed to financial market risk in three areas: our short-term investments, cash value of life insurance, and our credit facility. As of October 2, 2010, we had short-term investments of $3.7 million, which were classified as available for sale. These short-term investments are high quality, highly liquid corporate commercial paper and bonds known as “variable rate demand notes” or “low floaters.” The bonds are issued by municipalities or companies and are backed by letters of credit from federally insured banks. The bonds carry the credit rating of the underlying bank. The interest rate on the bonds is a floating rate which is reset weekly or monthly, depending on the issue, by the re-marketing agent based on market rates for comparable securities or through an auction process. We can liquidate the bonds at any time with a settlement date of seven days after the trade date. Using the level of securities available for sale at fiscal year-end 2010, a 100 basis point increase or decrease in interest rates for one year would increase or decrease pre-tax earnings by approximately $37,000. The effect of a 100 basis point increase or decrease in interest rates will vary from period to period with the dollar amount invested in our low floater portfolio.
We are exposed to financial market risk because our other assets at October 2, 2010 included $1.9 million in cash value of life insurance, which is subject to market risk related to equity pricing and interest rate changes. The cash value is generated from life insurance policies that are being used as the funding vehicle for a retirement program for Span-America’s founder and former chairman. See “Present Value of Deferred Compensation” above. The cash value is invested in a combination of fixed income life insurance contracts and a portfolio of mutual funds managed by an insurance company. The fixed income contracts are similar to fixed income bond funds and are therefore subject to interest rate and company risk. The mutual fund portfolios invest in common stocks and bonds in accordance with their individual investment objectives. These portfolios are exposed to stock market and interest rate risk similar to comparable mutual funds. We believe that substantial fluctuations in equity markets and interest rates and the resulting changes in cash value of life insurance would not have a material adverse effect on our financial position. During the fiscal year ended October 2, 2010, cash value of life insurance increased by 6%, creating after-tax income of approximately $111,000.
Our credit facility accrues interest at a variable rate equal to 30-day LIBOR plus a margin ranging from 85 to 165 basis points depending on our then-applicable leverage ratio (as defined in the credit facility). Interest is payable monthly. There is no unused commitment fee associated with the line of credit. An increase in interest rates would have a negative impact on our financial condition and earnings to the extent that we had outstanding borrowings under the facility. The degree of impact would vary depending on the level of the borrowings. We repaid the outstanding balance of our long-term debt during the first quarter of fiscal year 2009. Unless we borrow under the facility or otherwise incur significant debt with a variable interest rate, a change in interest rates would have no material effect on our interest expense.
33
Item 8. Financial Statements and Supplementary Data
Span-America Medical Systems, Inc.
Financial Statements
October 2, 2010
|
Contents
|
||
|
Report of Independent Registered Public Accounting Firm
|
35
|
|
|
Financial Statements
|
||
|
Statements of Income
|
36
|
|
|
Balance Sheets
|
37
|
|
|
Statements of Changes in Shareholders’ Equity
|
38
|
|
|
Statements of Cash Flows
|
39
|
|
|
Notes to Financial Statements
|
40
|
34
Report of Independent Registered Public Accounting Firm
Shareholders and Board of Directors
Span-America Medical Systems, Inc.
Greenville, South Carolina
We have audited the accompanying balance sheets of Span-America Medical Systems, Inc. as of October 2, 2010 and October 3, 2009 and the related statements of income, changes in shareholders’ equity and comprehensive income, and cash flows for each of the years in the three year period ended October 2, 2010. These financial statements are the responsibility of the Company’s management. Our responsibility is to express an opinion on these financial statements based on our audits.
We conducted our audits in accordance with the Standards of the Public Company Accounting Oversight Board (United States). Those standards require that we plan and perform the audits to obtain reasonable assurance about whether the financial statements are free of material misstatement. The company is not required to have, nor were we engaged to perform an audit of its internal control over financial reporting. Our audits included consideration of internal control over financial reporting as a basis for designing audit procedures that are appropriate in the circumstances, but not for the purpose of expressing an opinion on the effectiveness of the Company’s internal control over financial reporting. Accordingly, we express no such opinion. An audit includes examining, on a test basis, evidence supporting the amounts and disclosures in the financial statements. An audit also includes assessing the accounting principles used and significant estimates made by management, as well as evaluating the overall financial statement presentation. We believe that our audits provide a reasonable basis for our opinion.
In our opinion, the financial statements referred to above present fairly, in all material respects, the financial position of Span-America Medical Systems, Inc. as of October 2, 2010 and October 3, 2009 and the results of its operations and its cash flows for each of the years in the three year period ended October 2, 2010 in conformity with accounting principles generally accepted in the United States of America.
/s/ ELLIOTT DAVIS, LLC
Greenville, South Carolina
December 22, 2010
35
|
Statements of Income
|
||||||||||||
| Years Ended | ||||||||||||
|
October 2,
|
October 3,
|
September 27,
|
||||||||||
|
2010
|
2009
|
2008
|
||||||||||
|
Net sales
|
$ | 52,355,662 | $ | 55,867,104 | $ | 59,265,265 | ||||||
|
Cost of goods sold
|
32,934,427 | 35,658,795 | 38,869,911 | |||||||||
|
Gross profit
|
19,421,235 | 20,208,309 | 20,395,354 | |||||||||
|
Selling and marketing expenses
|
8,672,544 | 9,038,123 | 8,988,657 | |||||||||
|
Research and development expenses
|
937,865 | 866,179 | 657,369 | |||||||||
|
General and administrative expenses
|
3,076,805 | 3,436,114 | 3,230,854 | |||||||||
| 12,687,214 | 13,340,416 | 12,876,880 | ||||||||||
|
Operating income
|
6,734,021 | 6,867,893 | 7,518,474 | |||||||||
|
Non-operating income and expense:
|
||||||||||||
|
Investment income and other
|
52,194 | 28,934 | 50,755 | |||||||||
|
Interest expense
|
- | 4,174 | 108,465 | |||||||||
|
Net non-operating income (expense)
|
52,194 | 24,760 | (57,710 | ) | ||||||||
|
Income from continuing operations before income taxes
|
6,786,215 | 6,892,653 | 7,460,764 | |||||||||
|
Income taxes on continuing operations - Note 13
|
2,280,000 | 2,188,000 | 2,542,000 | |||||||||
|
Income from continuing operations
|
4,506,215 | 4,704,653 | 4,918,764 | |||||||||
|
(Loss) from discontinued operations, net of income tax benefit
|
||||||||||||
|
of $11,000 (2009) and $25,000 (2008) - Note 12
|
- | (20,622 | ) | (49,915 | ) | |||||||
|
Net income
|
$ | 4,506,215 | $ | 4,684,031 | $ | 4,868,849 | ||||||
|
Earnings per share of common stock - Note 14
|
||||||||||||
|
Income from continuing operations:
|
||||||||||||
|
Basic
|
$ | 1.65 | $ | 1.72 | $ | 1.77 | ||||||
|
Diluted
|
$ | 1.59 | $ | 1.68 | $ | 1.71 | ||||||
|
(Loss) from discontinued operations:
|
||||||||||||
|
Basic
|
n/a | $ | (0.01 | ) | $ | (0.02 | ) | |||||
|
Diluted
|
n/a | n/a | n/a | |||||||||
|
Net income:
|
||||||||||||
|
Basic
|
$ | 1.65 | $ | 1.72 | $ | 1.76 | ||||||
|
Diluted
|
$ | 1.59 | $ | 1.67 | $ | 1.70 | ||||||
|
Dividends per share of common stock (1)
|
$ | 1.40 | $ | 0.36 | $ | 0.34 | ||||||
|
Weighted average shares outstanding:
|
||||||||||||
|
Basic
|
2,737,790 | 2,730,426 | 2,771,754 | |||||||||
|
Diluted
|
2,841,133 | 2,803,625 | 2,868,494 | |||||||||
The accompanying notes are an integral part of these financial statements.
|
(1)
|
Dividends per share for fiscal year 2010 include a special dividend of $1.00 per share paid on June 4, 2010.
|
36
|
Balance Sheets
|
||||||||
|
October 2,
|
October 3,
|
|||||||
|
2010
|
2009
|
|||||||
|
ASSETS
|
||||||||
|
Current assets:
|
||||||||
|
Cash and cash equivalents
|
$ | 781,195 | $ | 1,263,944 | ||||
|
Securities available for sale - Note 2
|
3,701,511 | 3,703,839 | ||||||
|
Accounts receivable, net of allowances of $150,000
|
||||||||
|
(2010) and $155,000 (2009)
|
7,129,352 | 6,305,430 | ||||||
|
Inventories - Note 3
|
4,135,379 | 3,909,318 | ||||||
|
Deferred income taxes - Note 13
|
667,000 | 997,000 | ||||||
|
Prepaid expenses
|
430,935 | 101,835 | ||||||
|
Total current assets
|
16,845,372 | 16,281,366 | ||||||
|
Property and equipment, net - Note 4
|
5,684,797 | 6,158,977 | ||||||
|
Goodwill - Note 5
|
1,924,131 | 1,924,131 | ||||||
|
Other assets - Note 6
|
2,757,888 | 2,470,077 | ||||||
| $ | 27,212,188 | $ | 26,834,551 | |||||
|
LIABILITIES AND SHAREHOLDERS' EQUITY
|
||||||||
|
Current liabilities:
|
||||||||
|
Accounts payable
|
$ | 2,335,633 | $ | 1,679,822 | ||||
|
Accrued and sundry liabilities - Note 7
|
2,641,348 | 3,743,968 | ||||||
|
Total current liabilities
|
4,976,981 | 5,423,790 | ||||||
|
Deferred income taxes - Note 13
|
196,000 | 129,000 | ||||||
|
Deferred compensation - Note 10
|
660,618 | 708,421 | ||||||
|
Total long-term liabilities
|
856,618 | 837,421 | ||||||
|
Total liabilities
|
5,833,599 | 6,261,211 | ||||||
|
Commitments and contingencies - Notes 19 and 20
|
||||||||
|
Shareholders' equity - Note 11
|
||||||||
|
Common stock, no par value, 20,000,000 shares
|
||||||||
|
authorized; issued and outstanding shares
|
||||||||
|
2,757,464 (2010) and 2,712,310 (2009)
|
870,946 | 792,466 | ||||||
|
Additional paid-in capital
|
696,491 | 619,460 | ||||||
|
Retained earnings
|
19,811,152 | 19,161,414 | ||||||
|
Total shareholders' equity
|
21,378,589 | 20,573,340 | ||||||
| $ | 27,212,188 | $ | 26,834,551 | |||||
The accompanying notes are an integral part of these financial statements.
37
|
Statements of Changes in Shareholders' Equity
|
||||||||||||||||||||
|
|
|
Additional
|
||||||||||||||||||
|
Common Stock
|
Paid-in
|
Retained
|
||||||||||||||||||
|
|
Shares
|
Amount
|
Capital
|
Earnings
|
Total
|
|||||||||||||||
|
Balance at September 29, 2007
|
2,775,444 | $ | 1,724,225 | $ | 528,945 | $ | 11,534,497 | $ | 13,787,667 | |||||||||||
|
Net income for the 2008 fiscal year
|
4,868,849 | 4,868,849 | ||||||||||||||||||
|
Common stock issued to Directors
|
8,500 | 111,265 | 111,265 | |||||||||||||||||
|
Common stock issued on
|
||||||||||||||||||||
|
exercise of stock options
|
39,394 | 220,901 | 220,901 | |||||||||||||||||
|
Stock repurchase
|
(64,261 | ) | (747,544 | ) | (747,544 | ) | ||||||||||||||
|
Stock option compensation expense
|
34,359 | 34,359 | ||||||||||||||||||
|
Cash dividends paid or declared
|
||||||||||||||||||||
|
($0.34 per share)
|
(943,032 | ) | (943,032 | ) | ||||||||||||||||
|
Balance at September 27, 2008
|
2,759,077 | 1,308,847 | 563,304 | 15,460,314 | 17,332,465 | |||||||||||||||
|
Net income for the 2009 fiscal year
|
4,684,031 | 4,684,031 | ||||||||||||||||||
|
Common stock issued to Directors
|
8,500 | 73,907 | 73,907 | |||||||||||||||||
|
Common stock issued on
|
||||||||||||||||||||
|
exercise of stock options
|
1,265 | 13,491 | 13,491 | |||||||||||||||||
|
Stock repurchase
|
(56,532 | ) | (603,779 | ) | (603,779 | ) | ||||||||||||||
|
Stock option compensation expense
|
56,156 | 56,156 | ||||||||||||||||||
|
Cash dividends paid or declared
|
||||||||||||||||||||
|
($0.36 per share)
|
(982,931 | ) | (982,931 | ) | ||||||||||||||||
|
Balance at October 3, 2009
|
2,712,310 | 792,466 | 619,460 | 19,161,414 | 20,573,340 | |||||||||||||||
|
Net income for the 2010 fiscal year
|
4,506,215 | 4,506,215 | ||||||||||||||||||
|
Common stock issued to Directors
|
8,500 | 136,085 | 136,085 | |||||||||||||||||
|
Common stock issued on
|
||||||||||||||||||||
|
exercise of stock options
|
58,130 | 288,629 | 288,629 | |||||||||||||||||
|
Stock repurchase
|
(21,476 | ) | (346,234 | ) | (346,234 | ) | ||||||||||||||
|
Stock option compensation expense
|
18,936 | 18,936 | ||||||||||||||||||
|
Tax benefits for stock options
exercised
|
58,095 | 58,095 | ||||||||||||||||||
|
Cash dividends paid or declared
|
||||||||||||||||||||
|
($1.40 per share) (1)
|
(3,856,477 | ) | (3,856,477 | ) | ||||||||||||||||
|
Balance at October 2, 2010
|
2,757,464 | $ | 870,946 | $ | 696,491 | $ | 19,811,152 | $ | 21,378,589 | |||||||||||
The accompanying notes are an integral part of these financial statements.
|
(1)
|
Dividends per share for fiscal year 2010 include a special dividend of $1.00 per share paid on June 4, 2010.
|
38
|
Statements of Cash Flows
|
||||||||||||
| Years Ended | ||||||||||||
|
October 2,
|
October 3,
|
September 27,
|
||||||||||
|
2010
|
2009
|
2008
|
||||||||||
|
OPERATING ACTIVITIES:
|
||||||||||||
|
Net income
|
$ | 4,506,215 | $ | 4,684,031 | $ | 4,868,849 | ||||||
|
Adjustments to reconcile net income to net
|
||||||||||||
|
cash provided by operating activities:
|
||||||||||||
|
Depreciation
|
743,158 | 764,194 | 656,075 | |||||||||
|
Amortization
|
70,133 | 85,801 | 73,282 | |||||||||
|
Provision for losses on accounts receivable
|
26,868 | (54,202 | ) | 75,500 | ||||||||
|
Provision for deferred income taxes
|
455,095 | (230,000 | ) | 321,000 | ||||||||
|
Gain on sale and disposal of property and equipment
|
(17,902 | ) | (11,367 | ) | (13,781 | ) | ||||||
|
(Increase) Decrease in cash value of life insurance
|
(106,807 | ) | 17,395 | 82,987 | ||||||||
|
Deferred compensation
|
(47,803 | ) | (44,263 | ) | (40,983 | ) | ||||||
|
Stock compensation expense
|
18,936 | 56,156 | 34,359 | |||||||||
|
Changes in operating assets and liabilities:
|
||||||||||||
|
Accounts receivable
|
(848,462 | ) | 1,516,299 | (782,428 | ) | |||||||
|
Inventories
|
(226,061 | ) | 81,681 | 6,586 | ||||||||
|
Prepaid expenses and other assets
|
(375,195 | ) | (208,265 | ) | 197,243 | |||||||
|
Accounts payable and accrued and sundry liabilities
|
(440,590 | ) | 148,339 | (228,205 | ) | |||||||
|
Net cash provided by operating activities
|
3,757,585 | 6,805,799 | 5,250,484 | |||||||||
|
INVESTING ACTIVITIES:
|
||||||||||||
|
Purchases of securities available for sale
|
(1,700,000 | ) | (3,700,000 | ) | - | |||||||
|
Proceeds from sales of marketable securities
|
1,700,000 | - | - | |||||||||
|
Purchases of property and equipment
|
(270,576 | ) | (355,144 | ) | (692,043 | ) | ||||||
|
Proceeds from sale of property and equipment
|
19,500 | 12,431 | 17,500 | |||||||||
|
Payments for other assets
|
(68,957 | ) | (52,383 | ) | (73,602 | ) | ||||||
|
Net cash used for investing activities
|
(320,033 | ) | (4,095,096 | ) | (748,145 | ) | ||||||
|
FINANCING ACTIVITIES:
|
||||||||||||
|
Dividends paid
|
(3,856,477 | ) | (982,931 | ) | (943,032 | ) | ||||||
|
Repayment of long-term debt
|
- | (700,000 | ) | (3,000,000 | ) | |||||||
|
Purchase and retirement of common stock
|
(346,234 | ) | (603,779 | ) | (747,544 | ) | ||||||
|
Proceeds from exercise of options for common stock
|
282,410 | 6,237 | 213,087 | |||||||||
|
Net cash used for financing activities
|
(3,920,301 | ) | (2,280,473 | ) | (4,477,489 | ) | ||||||
|
(Decrease) Increase in cash and cash equivalents
|
(482,749 | ) | 430,230 | 24,850 | ||||||||
|
Cash and cash equivalents at beginning of year
|
1,263,944 | 833,714 | 808,864 | |||||||||
|
Cash and cash equivalents at end of year
|
$ | 781,195 | $ | 1,263,944 | $ | 833,714 | ||||||
The accompanying notes are an integral part of these financial statements.
39
NOTES TO FINANCIAL STATEMENTS
October 2, 2010
1. SIGNIFICANT ACCOUNTING POLICIES
Description of Business
We manufacture and distribute therapeutic support surfaces, mattress overlays, patient positioners, seating cushions, skin care products and fall prevention products for the medical market and pillows, mattress pads and various foam products for the custom products market throughout the United States and Canada.
Cash and Cash Equivalents
We consider all highly liquid investments with a maturity when purchased of three months or less to be cash equivalents. Depending on market conditions, we may maintain a centralized cash management program whereby our excess cash balances are invested in commercial paper and are considered cash equivalents. Cash balances in our accounts usually exceed federally insured limits.
Accounts Receivable
We provide credit in the normal course of business and perform ongoing credit evaluations on certain of our customers, but we generally do not require collateral to support these receivables. We also establish an allowance for doubtful accounts based upon factors surrounding the credit risk of specific customers, historical trends and other information. Account balances are charged against the allowance after all collection efforts have been exhausted and the potential for recovery is considered remote.
Inventories
Our inventories are valued at the lower of cost (first-in, first-out method) or market.
Property and Equipment
Property and equipment is stated at cost. Maintenance, repairs and minor replacements that do not improve or extend the useful lives of assets are expensed when incurred. Depreciation is computed using the straight-line method. Estimated useful lives for buildings and land improvements range from 15 to 35 years. The estimated useful lives of all other property and equipment range from 3 years to 15 years. For income tax purposes, substantially all depreciation is computed using accelerated methods.
Intangibles
Intangible assets are amortized using the straight-line method. Costs of patents are amortized over periods ranging from 10 to 17 years, and trademarks are amortized over periods of 5 or 10 years. Goodwill, or costs in excess of the fair value of net assets, was acquired from two separate acquisitions. See Note 5. Accumulated amortization of intangible assets at October 2, 2010 and October 3, 2009 was approximately $2,599,000 and $2,539,000, respectively. We annually review the recoverability of the carrying value of these assets. We also review long-lived assets and the related intangible assets for impairment whenever events or changes in circumstances indicate the carrying amount of such assets may not be recoverable.
40
Revenue Recognition
We recognize revenue when goods are shipped and title passes to the customer. There are no customer acceptance provisions, and the right to return exists only in cases of damaged product, non-compliance with customer specifications or warranty claims. Taxes collected from customers and remitted to government authorities are recorded on a net basis (excluded from revenues).
We have applied the accounting and disclosure requirements of Securities and Exchange Commission Staff Accounting Bulletin (SAB) No. 104.
Advertising Costs
Advertising costs are expensed as incurred.
Shipping and Handling Costs
Shipping and handling costs that are not reimbursed by customers are charged to selling and marketing expenses and were approximately $1,784,000 in 2010, $1,715,000 in 2009, and $1,837,000 in 2008.
Customer Rebates
We offer rebates to certain of our distributors based on predetermined sales targets. These rebates vary by the type of product sold and by distributor and are based on a percentage of the applicable sales target. The rebate expense is charged as a reduction of gross sales. Rebate expense and the associated liability are calculated and recorded as the rebate-related revenue is recognized.
Earnings Per Share of Common Stock
Earnings per share of common stock are computed based on the weighted average number of shares outstanding during each period. See Note 14 – Earnings per Share of Common Stock.
Stock-Based Compensation
We measure and recognize compensation expense for all stock-based payments at fair value. Stock-based payments include stock option grants. We grant options to purchase common stock to some of our employees under various plans at prices equal to the market value of the stock on the dates the options were granted. New shares of stock are issued upon share option exercise. We do not have treasury stock.
The fair value of each option grant is estimated on the date of grant using the Black-Scholes option pricing model with the following weighted average assumptions for grants made in 2009: risk-free interest rates between 1.99% and 2.72%; dividend yield of 3.2%; volatility factor of the expected market price of our common stock of between 43.8% and 44.4%; and a weighted average expected life of the option of 8.2 years. No options were granted during fiscal years 2010 or 2008.
41
Fiscal Year
Our fiscal year ends on the Saturday nearest to September 30. Fiscal year 2009 was a 53-week year. Fiscal years 2010 and 2008 were 52-week years. Fiscal year 2011 will be a 52-week year.
Income Taxes
The liability method is used in accounting for income taxes. Under this method, deferred tax assets and liabilities are determined based on differences between financial reporting and tax bases of assets and liabilities and are measured using the enacted tax rates and laws that are projected to be in effect when the differences are expected to reverse.
Use of Estimates
The preparation of financial statements in conformity with accounting principles generally accepted in the United States of America requires us to make estimates and assumptions that affect the amounts reported in the financial statements and accompanying notes and the disclosure of contingent assets and liabilities. Although these estimates are based on our knowledge of current events and actions planned for the future, the estimates may ultimately differ from actual results.
Recently Issued Accounting Standards
Accounting standards that have been issued or proposed by the Financial Accounting Standards Board, FASB, or other standards-setting bodies that do not require adoption until a future date are not expected to have a material impact on our financial statements upon adoption.
2. FAIR VALUE OF FINANCIAL INSTRUMENTS
The Company accounts for the fair value measurements for financial assets and liabilities measured on a recurring basis as required by the Fair Value Measurements and Disclosures topic of the FASB Accounting Standards Codification. This guidance establishes a framework for measuring fair value and expands disclosure about fair value measurements. That framework provides a fair value hierarchy that prioritizes the inputs to valuation techniques used to measure fair value. The hierarchy gives the highest priority to unadjusted quoted prices in active markets for identical assets or liabilities (Level 1 measurements) and the lowest priority to unobservable inputs (Level 3 measurements).
The following is a brief description of these three levels:
Level 1 – Unadjusted quoted prices in active markets that are accessible at the measurement date for identical, unrestricted assets or liabilities;
Level 2 – Quoted prices in markets that are not active, or inputs which are observable, either directly or indirectly, for substantially the full term of the asset or liability;
Level 3 – Prices or valuation techniques that require inputs that are both significant to the fair value measurement and unobservable (i.e. supported by little or no market activity).
42
The asset’s or liability’s fair value measurement level within the fair value hierarchy is based on the lowest level (with “3” being the lowest) of any input that is significant to the fair value measurement. Valuation techniques used need to maximize the use of observable inputs and minimize the use of unobservable inputs.
Following is a description of the valuation methodologies used for assets measured at fair value.
Cash value of life insurance policy: Valued at the cash surrender value of the life insurance policy, as determined by the issuer of the insurance policy, which approximates fair value.
Marketable debt securities: Valued at the closing prices reported on active markets on which the individual securities are traded.
The methods described above may produce a fair value calculation that may not be indicative of net realizable value or reflective of future fair values. Furthermore, although we believe our valuation methods are appropriate and consistent with methods used by other market participants, the use of different methodologies or assumptions to determine fair value of certain financial instruments could result in a different fair value measurement at the reporting date.
The following table summarizes information on the fair value measurement of the Company’s assets as of October 2, 2010 and October 3, 2009 grouped by the categories described above:
|
Total
|
Quoted prices in active markets
(Level 1)
|
Significant other
observable inputs
(Level 2)
|
Significant
unobservable inputs
(Level 3)
|
|||||||||||
|
Cash value of life insurance policy
|
2010
|
$ | 1,927,281 | $ | 1,927,281 | |||||||||
|
2009
|
$ | 1,820,474 | $ | 1,820,474 | ||||||||||
|
Securities available for sale
|
2010
|
$ | 3,701,511 | $ | 3,701,511 | |||||||||
|
2009
|
$ | 3,703,839 | $ | 3,703,839 | ||||||||||
Securities available for sale at October 2, 2010 were variable rate demand notes with contractual maturities ranging from 2018 to 2029. We had no significant unrealized holding gains or losses during fiscal years 2010, 2009 or 2008.
3. INVENTORIES
|
2010
|
2009
|
|||||||
|
Raw materials
|
$ | 3,179,836 | $ | 2,815,080 | ||||
|
Finished goods
|
1,281,543 | 1,434,238 | ||||||
|
Reserve for obsolescence
|
(326,000 | ) | (340,000 | ) | ||||
| $ | 4,135,379 | $ | 3,909,318 | |||||
43
4. PROPERTY AND EQUIPMENT
|
2010
|
2009
|
|||||||
|
Land
|
$ | 469,718 | $ | 469,718 | ||||
|
Land improvements
|
486,698 | 486,698 | ||||||
|
Buildings
|
6,821,343 | 6,793,205 | ||||||
|
Machinery and equipment
|
6,972,197 | 6,909,820 | ||||||
|
Furniture and fixtures
|
487,775 | 487,775 | ||||||
|
Automobiles
|
9,520 | 9,520 | ||||||
| 15,247,251 | 15,156,736 | |||||||
|
Less accumulated depreciation
|
9,562,454 | 8,997,759 | ||||||
| $ | 5,684,797 | $ | 6,158,977 | |||||
5. GOODWILL AND OTHER INTANGIBLES
As of October 2, 2010 and October 3, 2009, we had goodwill of $1,924,131. In addition, we had patents and trademarks (net of accumulated amortization) of $301,842 as of October 2, 2010 and $293,018 as of October 3, 2009. The goodwill is associated with the medical segment, and the patents and trademarks are associated with the medical and custom products segments. Goodwill has an indefinite useful life. The useful lives of individual patents and trademarks have been reviewed, and no material changes were required.
Amortization expense for patents and trademarks from continuing operations during fiscal years 2010, 2009 and 2008 was $60,132, $75,801, and $63,282, respectively. Estimated amortization expense for the next five fiscal years based on existing patents and trademarks is as follows:
|
Estimated
|
||||
|
Amortization
|
||||
|
Fiscal years
|
Expense
|
|||
|
2011
|
$ | 48,583 | ||
|
2012
|
35,258 | |||
|
2013
|
32,181 | |||
|
2014
|
29,316 | |||
|
2015
|
26,106 | |||
6. OTHER ASSETS
|
2010
|
2009
|
|||||||
|
Patents and trademarks, net of accumulated amortization
|
||||||||
|
of $1,571,025 (2010) and $1,510,892 (2009)
|
$ | 301,842 | $ | 293,018 | ||||
|
Cash value of life insurance policies - Note 2
|
1,927,281 | 1,820,474 | ||||||
|
Other
|
528,765 | 356,585 | ||||||
| $ | 2,757,888 | $ | 2,470,077 | |||||
44
7. ACCRUED AND SUNDRY LIABILITIES
|
2010
|
2009
|
|||||||
|
Salaries and other compensation
|
$ | 1,154,995 | $ | 1,910,035 | ||||
|
Federal and state income taxes and sales taxes
|
27,796 | 455,134 | ||||||
|
Payroll taxes accrued and withheld
|
105,760 | 143,392 | ||||||
|
Property taxes
|
175,500 | 169,420 | ||||||
|
Medical insurance
|
203,645 | 249,689 | ||||||
|
Warranty reserve - Note 8
|
570,000 | 461,721 | ||||||
|
Customer rebates
|
287,468 | 339,111 | ||||||
|
Other
|
116,184 | 15,466 | ||||||
| $ | 2,641,348 | $ | 3,743,968 | |||||
8. PRODUCT WARRANTIES
We offer warranties of various lengths to our customers, depending on the specific product sold. The warranties require us to repair or replace non-performing products during the warranty period at no cost to the customer. At the time revenue is recognized for covered products, we record a liability for estimated costs that may be incurred under our warranties. The costs are estimated based on historical experience and any specific warranty problems that have been identified. Although historical warranty costs have been within our expectations, there can be no assurance that future warranty costs will not exceed historical amounts. We regularly evaluate the adequacy of the warranty liability and adjust the balance as necessary.
Changes in our product warranty liability for the years ended October 2, 2010 and October 3, 2009 are as follows:
|
2010
|
2009
|
|||||||
|
Accrued liability at beginning of year
|
$ | 461,721 | $ | 365,721 | ||||
|
Increases in reserve
|
515,642 | 487,909 | ||||||
|
Expenses
|
(407,363 | ) | (391,909 | ) | ||||
|
Accrued liability at end of year
|
$ | 570,000 | $ | 461,721 | ||||
9. REVOLVING CREDIT FACILITY
We have a revolving credit facility from a bank. The maximum principal amount that we can borrow at any one time under the agreement is $10 million. The maturity date is June 5, 2012. The agreement is unsecured and accrues interest at a variable rate equal to 30-day LIBOR plus a margin ranging from 85 to 165 basis points, depending on our leverage ratio (as defined in the agreement). The margin in effect for fiscal 2009, the most recent period in which we paid interest, was 85 basis points. The interest rate at November 20, 2008, the last date interest expense was incurred, was 3.7%. Interest-only payments are required monthly. The agreement includes financial covenants relating to tangible net worth and leverage ratios. The agreement restricts dividends, stock repurchases, mergers and acquisitions, asset sales, indebtedness, liens and capital expenditures. Violation of loan covenants could result in acceleration of the term of the agreement. We have pledged to grant the bank a security interest in our accounts, instruments, and chattel paper upon its request in the event of a default as defined in the agreement.
45
The credit facility restricts dividends and stock repurchases during any fiscal year to an aggregate amount of no more than 50% of the sum of (i) our income from continuing operations for that fiscal year plus (ii) the absolute value of our aggregate after-tax, non-cash and extraordinary losses for that fiscal year, if any. As an exception to the restriction noted above, we may pay a regular quarterly dividend in an amount no greater than the previous quarter’s regular dividend so long as we remain in compliance with the financial covenants after giving effect to the payment of the dividend. We were in violation of this covenant for fiscal year 2010 because of our payment of a special dividend of $2.8 million ($1.00 per share) in June 2010. However, the bank has provided a waiver of this covenant for fiscal year 2010.
We incurred no interest expense in 2010 and paid interest expense of approximately $4,000 in 2009 and $108,000 in 2008.
10. DEFERRED COMPENSATION
We are obligated to make fixed payments of approximately $114,000 per year to our founder and former chief executive officer pursuant to a retirement agreement. The payments will be made for the longer of the executive’s remaining life or his ex-wife's remaining life, if she survives him. We have fully accrued the present value of the expected payments due over the combined life expectancy of the executive and his ex-wife. We recognized expenses of approximately $66,000 in 2010, $69,000 in 2009, and $73,000 in 2008 related to this agreement. An 8% discount rate was used in measuring the present value of our deferred compensation obligation.
11. EQUITY COMPENSATION
In January 2007, the Board adopted the 2007 Equity Incentive Plan (“2007 Plan”), which was approved by shareholders in February 2007. The 2007 Plan authorizes the Board to grant stock-based compensation awards to our officers, directors and key employees for up to 250,000 shares of Company common stock. Awards may be in the form of restricted stock, non-restricted stock, restricted stock units, options or stock appreciation rights (SARs). Total awards under the 2007 Plan may not exceed 250,000 shares, of which no more than 75,000 shares may be in the form of restricted stock, non-restricted stock or restricted stock units. The per share exercise prices of options or SARs granted under the 2007 Plan must be no less than the fair market value of a share on the grant date. The terms and conditions of each award may be set by the Board or a committee of the Board. The 2007 Plan will expire on December 31, 2016 unless terminated earlier in accordance with the plan.
In March 1997, the Board adopted the 1997 Stock Option Plan (“1997 Plan”). The 1997 Plan authorized the Board to grant options to our key officers and employees for up to 200,000 shares of our common stock. Options granted under the 1997 Plan are generally granted at the fair market value on the date of grant. These options become exercisable and vest at the greater of 1,000 shares per year or 20% of the grant. Options expire 10 years from the date of grant for continuing employees, or three months after termination of employment for employees who leave the Company. The 1997 Plan expired by its terms on October 20, 2007. The expiration of the plan does not affect options outstanding under the plan, but no further options can be granted under the 1997 Plan.
46
In November 1991, the Board adopted the 1991 Stock Option Plan (“1991 Plan”). The 1991 Plan authorized the Board to grant options for up to 200,000 shares of Company common stock to our officers and key employees and 50,000 shares to directors who are neither officers nor employees of the Company. All other terms and conditions of the 1991 Plan are similar to the 1997 Plan. The 1991 Plan expired by its terms on November 7, 2001. The expiration of the plan does not affect options outstanding under the plan, but no further options can be granted under the 1991 Plan.
Shown below is a summary of activity under the Company’s three stock option plans.
|
Outstanding
|
Exercisable
|
|||||||||||||||||||
|
Weighted
|
Weighted
|
|||||||||||||||||||
|
Average
|
Average
|
|||||||||||||||||||
|
Shares
|
Number of
|
Ex. Price
|
Number of
|
Ex. Price
|
||||||||||||||||
|
Available
|
Shares
|
Per Share
|
Shares
|
Per Share
|
||||||||||||||||
|
Balance at 9/29/07
|
275,950 | 229,513 | $ | 6.39 | 218,860 | $ | 6.23 | |||||||||||||
|
Fiscal Year 2008
|
||||||||||||||||||||
|
Granted
|
||||||||||||||||||||
|
Exercised
|
(38,743 | ) | 5.50 | |||||||||||||||||
|
Forfeited
|
||||||||||||||||||||
|
1997 Plan expired
|
(25,950 | ) | ||||||||||||||||||
|
Balance at 9/27/08
|
250,000 | 190,770 | 6.57 | 189,802 | 6.55 | |||||||||||||||
|
Fiscal Year 2009
|
||||||||||||||||||||
|
Granted
|
(22,500 | ) | 22,500 | 9.34 | ||||||||||||||||
|
Exercised
|
(645 | ) | 9.67 | |||||||||||||||||
|
Forfeited
|
(1,289 | ) | 9.88 | |||||||||||||||||
|
Balance at 10/3/09
|
227,500 | 211,336 | 6.83 | 200,336 | 6.69 | |||||||||||||||
|
Fiscal Year 2010
|
||||||||||||||||||||
|
Granted
|
||||||||||||||||||||
|
Exercised
|
(57,547 | ) | 4.91 | |||||||||||||||||
|
Forfeited
|
(2,582 | ) | 10.52 | |||||||||||||||||
|
Balance at 10/2/10
|
227,500 | 151,207 | $ | 7.50 | 148,207 | $ | 7.46 | |||||||||||||
47
Shown below is a summary of stock options outstanding and exercisable at fiscal year-end 2010.
|
Outstanding
|
Exercisable
|
|||||||||||||||||||
|
Weighted
|
||||||||||||||||||||
|
Weighted
|
Average
|
Weighted
|
||||||||||||||||||
|
Average
|
Remaining
|
Average
|
||||||||||||||||||
|
Ranges of Exercise
|
Number of
|
Ex. Price
|
Contract
|
Number of
|
Ex. Price
|
|||||||||||||||
|
Prices
|
Shares
|
Per Share
|
Life (yrs)
|
Shares
|
Per Share
|
|||||||||||||||
| $ 3.56 - $ 4.30 | 44,136 | $ | 4.11 | 0.8 | 44,136 | $ | 4.11 | |||||||||||||
| 6.18 - 9.18 | 44,224 | 7.56 | 3.3 | 44,224 | 7.56 | |||||||||||||||
| 9.34 - 10.52 | 62,847 | 9.84 | 5.8 | 59,847 | 9.87 | |||||||||||||||
| $ 3.56 - $ 10.52 | 151,207 | $ | 7.50 | 3.6 | 148,207 | $ | 7.46 | |||||||||||||
The total compensation cost related to non-vested awards not yet recognized at October 2, 2010 was approximately $3,000.
The Board of Directors adopted a stock purchase incentive plan in February 2000. The 2000 Restricted Stock Plan was created to encourage our management employees to purchase and hold Span-America common stock. Plan benefits are paid in shares of Company common stock. Benefits earned and accrued under the plan were $7,788 in 2010, $3,749 in 2009 and $7,254 in 2008. We issued stock valued at $6,219 in 2010, leaving a vested balance of $5,318 at October 2, 2010. The plan expired by its terms in February 2010.
12. IMPAIRMENT OF SAFETY CATHETER ASSETS
In October 2007, we decided to exit the safety catheter business and sell the related assets because we had been unable to generate sufficient sales volume to make it a viable business. As of September 29, 2007, we recorded an impairment charge of approximately $2,879,000, which reduced the book value of our safety catheter assets to zero. As a result of the degree of uncertainty associated with any potential sale of these assets, we concluded that we could not reasonably estimate a net realizable value for the assets. Accordingly, revenues and expenses related to the safety catheter business in fiscal years 2009 and 2008 are shown as a discontinued operation.
We have ceased the use of the safety catheter assets and are committed to a plan of sale or abandonment. We are still engaged in efforts to sell these assets in order to maximize any value that might currently remain. However, we have no offers pending and can give no assurance that the assets will eventually be sold. If we are unable to find a buyer, we will abandon and dispose of the assets.
13. INCOME TAXES
Deferred income taxes reflect the net tax effects of temporary differences between the carrying amounts of assets and liabilities for financial reporting purposes and the amounts used for income tax purposes. Significant components of our deferred tax liabilities and assets as of October 2, 2010 and October 3, 2009 are as follows:
48
|
2010
|
2009
|
|||||||
|
Deferred tax liabilities:
|
||||||||
|
Depreciation
|
$ | (444,000 | ) | $ | (433,000 | ) | ||
|
Deferred tax assets:
|
||||||||
|
Deferred compensation
|
231,000 | 255,000 | ||||||
|
Accrued expenses
|
382,000 | 632,000 | ||||||
|
Inventory
|
277,000 | 354,000 | ||||||
|
Amortization
|
16,000 | 49,000 | ||||||
|
Other
|
9,000 | 11,000 | ||||||
|
Total deferred tax assets
|
915,000 | 1,301,000 | ||||||
|
Net deferred tax assets
|
$ | 471,000 | $ | 868,000 | ||||
We made cash income tax payments, net of refunds, of approximately $2,592,000, $2,039,000, and $2,302,000, in fiscal years 2010, 2009 and 2008, respectively.
Federal and state income tax provisions consist of the following:
|
2010
|
2009
|
2008
|
||||||||||
|
Current:
|
||||||||||||
|
Federal
|
$ | 1,803,000 | $ | 2,267,000 | $ | 2,048,000 | ||||||
|
State
|
80,000 | 140,000 | 160,000 | |||||||||
| 1,883,000 | 2,407,000 | 2,208,000 | ||||||||||
|
Deferred:
|
||||||||||||
|
Federal
|
383,000 | (218,000 | ) | 288,000 | ||||||||
|
State
|
14,000 | (12,000 | ) | 21,000 | ||||||||
| 397,000 | (230,000 | ) | 309,000 | |||||||||
|
Income tax expense
|
$ | 2,280,000 | $ | 2,177,000 | $ | 2,517,000 | ||||||
Income tax expense differs from the amounts computed by applying the federal tax rate to income before income taxes as follows:
|
2010
|
2009
|
2008
|
||||||||||
|
Computed tax at the statutory rate
|
$ | 2,306,000 | $ | 2,333,000 | $ | 2,511,000 | ||||||
|
Increases (decreases):
|
||||||||||||
|
State income taxes, net of federal tax benefit
|
62,000 | 84,000 | 120,000 | |||||||||
|
Officer's life insurance
|
(38,000 | ) | 9,000 | 31,000 | ||||||||
|
Domestic production deduction
|
(115,000 | ) | (151,000 | ) | (133,000 | ) | ||||||
|
Other, net
|
65,000 | (98,000 | ) | (12,000 | ) | |||||||
|
Income tax expense
|
$ | 2,280,000 | $ | 2,177,000 | $ | 2,517,000 | ||||||
As of the beginning of our 2010 fiscal year, we adopted the provisions of FASB ASC Topic 740, “Income Taxes” (ASC 740), which provide specific guidance on the financial statement recognition, measurement, reporting and disclosure of uncertain tax positions taken or expected to be take in a tax return. We recognize the impact of our tax positions in our financial statements if those positions will more likely than not be sustained on audit, based on the technical merit of the position. The adoption of the provisions of ASC Topic 740 did not have a material impact on our financial statements.
49
We file income tax returns in the U.S. federal and various state and local jurisdictions. While we do business in some other countries, we do not maintain a foreign presence that would subject us to foreign income taxes. In the normal course of business, we are subject to examination by taxing authorities. We do not expect to be subject to U.S. federal or state and local income tax examinations by tax authorities in filing jurisdictions for the years before tax year 2005.
14. EARNINGS PER SHARE OF COMMON STOCK
The following table sets forth the computation of basic and diluted earnings per share of common stock.
|
2010
|
2009
|
2008
|
||||||||||
|
Numerator for basic and diluted
|
||||||||||||
|
earnings per share:
|
||||||||||||
|
Income from continuing operations
|
$ | 4,506,215 | $ | 4,704,653 | $ | 4,918,764 | ||||||
|
(Loss) from discontinued operations,
|
||||||||||||
|
net of income taxes
|
- | (20,622 | ) | (49,915 | ) | |||||||
|
Net income
|
$ | 4,506,215 | $ | 4,684,031 | $ | 4,868,849 | ||||||
|
Denominator:
|
||||||||||||
|
Denominator for basic earnings per share:
|
||||||||||||
|
Weighted average shares
|
2,737,790 | 2,730,426 | 2,771,754 | |||||||||
|
Effect of dilutive securities:
|
||||||||||||
|
Employee stock options
|
103,343 | 73,199 | 96,740 | |||||||||
|
Denominator for diluted earnings per share:
|
||||||||||||
|
Adjusted weighted average shares
|
||||||||||||
|
and assumed conversions
|
2,841,133 | 2,803,625 | 2,868,494 | |||||||||
|
Income from continuing operations per share:
|
||||||||||||
|
Basic
|
$ | 1.65 | $ | 1.72 | $ | 1.77 | ||||||
|
Diluted
|
$ | 1.59 | $ | 1.68 | $ | 1.71 | ||||||
|
(Loss) from discontinued operations per share:
|
||||||||||||
|
Basic
|
n/a | $ | (0.01 | ) | $ | (0.02 | ) | |||||
|
Diluted
|
n/a | n/a | n/a | |||||||||
|
Net income per share:
|
||||||||||||
|
Basic
|
$ | 1.65 | $ | 1.72 | $ | 1.76 | ||||||
|
Diluted
|
$ | 1.59 | $ | 1.67 | $ | 1.70 | ||||||
15. EMPLOYEE BENEFITS AND INCENTIVE PLANS
We have a 401(k) plan available to employees meeting eligibility requirements. We match a percentage of employee contributions, with certain limitations. Our 401(k) matching contributions amounted to approximately $184,000, $172,000 and $212,000 for the 2010, 2009 and 2008 fiscal years, respectively.
16. RELATED-PARTY TRANSACTIONS
We had no related-party transactions during any year in the three-year period ended October 2, 2010.
17. MAJOR CUSTOMERS
The largest of our medical customers are distributors who sell our products to acute care hospitals and long term care facilities throughout the United States and Canada. Sales generated by one of these distributors amounted to approximately 9% of net sales in 2010, 12 % of net sales in 2009 and 11% of net sales in 2008.
We have a business relationship with another customer to distribute certain of our consumer products. Sales to this customer amounted to 26% of net sales in 2010 and 2009 and 20% of net sales in 2008.
See Note 18 for further information about sales to major customers.
50
18. OPERATIONS AND INDUSTRY SEGMENTS
For management and reporting purposes, we divide our business into two segments: medical and custom products. This industry segment information corresponds to the markets in the United States and Canada for which we manufacture and distribute our various products. The following table summarizes certain information on industry segments:
|
2010
|
2009
|
2008
|
||||||||||
|
Net sales:
|
||||||||||||
|
Medical
|
$ | 35,572,689 | $ | 37,813,756 | $ | 42,456,763 | ||||||
|
Custom products
|
16,782,973 | 18,053,348 | 16,808,502 | |||||||||
|
Total
|
$ | 52,355,662 | $ | 55,867,104 | $ | 59,265,265 | ||||||
|
Operating profit:
|
||||||||||||
|
Medical
|
$ | 5,742,600 | $ | 5,586,679 | $ | 7,615,385 | ||||||
|
Custom products
|
1,628,106 | 2,129,488 | 800,849 | |||||||||
|
Total
|
7,370,706 | 7,716,167 | 8,416,234 | |||||||||
|
Corporate expense
|
(636,685 | ) | (848,274 | ) | (897,760 | ) | ||||||
|
Other income (expense)
|
52,194 | 24,760 | (57,710 | ) | ||||||||
|
Income from continuing operations
|
||||||||||||
|
before income taxes
|
$ | 6,786,215 | $ | 6,892,653 | $ | 7,460,764 | ||||||
|
Identifiable assets:
|
||||||||||||
|
Medical
|
$ | 14,439,795 | $ | 14,153,908 | $ | 15,852,599 | ||||||
|
Custom products
|
6,016,135 | 5,887,425 | 5,583,170 | |||||||||
|
Corporate
|
6,756,258 | 6,793,218 | 2,677,085 | |||||||||
| $ | 27,212,188 | $ | 26,834,551 | $ | 24,112,854 | |||||||
|
Depreciation and amortization expenses:
|
||||||||||||
|
Operating:
|
||||||||||||
|
Medical
|
$ | 533,184 | $ | 564,184 | $ | 512,415 | ||||||
|
Custom products
|
279,636 | 285,271 | 216,440 | |||||||||
|
Corporate
|
471 | 540 | 502 | |||||||||
| $ | 813,291 | $ | 849,995 | $ | 729,357 | |||||||
|
Capital expenditures:
|
||||||||||||
|
Medical
|
$ | 252,985 | $ | 240,771 | $ | 492,088 | ||||||
|
Custom products
|
17,591 | 114,373 | 199,955 | |||||||||
| $ | 270,576 | $ | 355,144 | $ | 692,043 | |||||||
Total sales by industry segment include sales from unaffiliated customers as reported in our statements of income. In calculating operating profit, non-allocable general corporate expenses, interest expense, other income and income taxes are not included, but certain corporate operating expenses incurred for the benefit of all segments are included on an allocated basis.
51
Identifiable assets are those assets that are used in the operations of each segment on an allocated basis. Amounts shown for corporate assets consist primarily of cash, marketable securities and cash surrender value of life insurance.
We have several customers whose sales represent significant portions of sales in their respective business segments. In the medical segment, sales to the top four distributors represented 45% of net medical sales in 2010 and 2009 and 52% in 2008. In the custom products segment, sales to one customer accounted for 82% of net custom products sales in 2010, 79% in 2009 and 71% in 2008.
Net export sales, including both the medical and custom products segments, were approximately $1,616,000 in 2010, $2,420,000 in 2009 and $3,287,000 in 2008 and were primarily to Canada. We have no physical assets in Canada or any other foreign country.
19. OPERATING LEASES
We lease truck equipment in South Carolina. In addition, we lease a 15,000 square foot distribution facility in Utah for $6,750 a month. The Utah facility lease is cancellable by either party with 60 days notice. Both leases require us to pay certain insurance and maintenance costs.
Rental expense for all operating leases was $108,000 in 2010, $102,000 in 2009 and $104,000 in 2008.
20. COMMITMENTS AND CONTINGENCIES
We are committed to minimum purchases of $700,000 of Selan® skin care products per calendar year beginning in 2011 through 2015. For the fiscal years ended 2010, 2009 and 2008, purchases under this commitment were $832,000, $745,000 and $748,000.
From time to time we are defendants in legal actions involving claims arising in the normal course of business. We believe that, as a result of legal defenses and insurance arrangements, none of these actions should have a material adverse effect on our operations or financial condition.
52
21. QUARTERLY FINANCIAL DATA (Unaudited)
Selected quarterly financial data are shown in the following table.
|
Quarterly Financial Data (Unaudited)
|
||||||||||||||||||||
|
(Amounts in thousands, except per share data)
|
||||||||||||||||||||
|
First
|
Second
|
Third
|
Fourth
|
Year
|
||||||||||||||||
|
For Fiscal 2010
|
||||||||||||||||||||
|
Net sales
|
$ | 12,249 | $ | 13,141 | $ | 13,162 | $ | 13,804 | $ | 52,356 | ||||||||||
|
Gross profit
|
4,686 | 5,109 | 4,710 | 4,916 | 19,421 | |||||||||||||||
|
Operating income
|
1,670 | 1,845 | 1,386 | 1,833 | 6,734 | |||||||||||||||
|
Net income
|
1,129 | 1,241 | 945 | 1,191 | 4,506 | |||||||||||||||
|
Earnings per share
|
||||||||||||||||||||
|
Basic
|
0.42 | 0.45 | 0.34 | 0.43 | 1.65 | |||||||||||||||
|
Diluted
|
0.40 | 0.44 | 0.33 | 0.42 | 1.59 | |||||||||||||||
|
|
|
|
|
|
||||||||||||||||
|
For Fiscal 2009
|
||||||||||||||||||||
|
Net sales
|
$ | 13,392 | $ | 13,376 | $ | 14,327 | $ | 14,771 | $ | 55,867 | ||||||||||
|
Gross profit
|
4,690 | 4,774 | 5,004 | 5,740 | 20,208 | |||||||||||||||
|
Operating income
|
1,346 | 1,598 | 1,748 | 2,176 | 6,868 | |||||||||||||||
|
Income from continuing operations
|
888 | 1,056 | 1,156 | 1,605 | 4,705 | |||||||||||||||
|
Loss from discontinued operations
|
||||||||||||||||||||
|
net of income taxes
|
(1 | ) | - | (19 | ) | - | (21 | ) | ||||||||||||
|
Net income
|
887 | 1,056 | 1,137 | 1,605 | 4,684 | |||||||||||||||
|
Earnings per share
|
||||||||||||||||||||
|
Basic
|
0.32 | 0.39 | 0.42 | 0.59 | 1.72 | |||||||||||||||
|
Diluted
|
0.32 | 0.38 | 0.41 | 0.57 | 1.67 | |||||||||||||||
Item 9. Changes in and Disagreements With Accountants on Accounting and Financial Disclosure
None
53
Item 9A(T). Controls and Procedures
Evaluation of Disclosure Controls and Procedures
Our management has evaluated, with the participation of our Chief Executive Officer and Chief Financial Officer, the effectiveness of our disclosure controls and procedures as of the end of the period covered by this annual report (the “Evaluation Date”), and, based on this evaluation, our Chief Executive Officer and Chief Financial Officer have concluded that these controls and procedures were effective at the Evaluation Date. There were no changes in our internal controls over financial reporting during the last quarter of fiscal 2010 that have materially affected or are reasonably likely to materially affect our internal control over financial reporting.
Disclosure controls and procedures are controls and other procedures that are designed to ensure that information required to be disclosed by us in the reports that we file or submit under the Exchange Act is recorded, processed, summarized and reported, within the time periods specified in the Securities and Exchange Commission’s rules and forms. Disclosure controls and procedures include, without limitation, controls and procedures designed to ensure that information required to be disclosed by the Company in the reports that it files or submits under the Exchange Act is accumulated and communicated to our management, including our Chief Executive Officer and Chief Financial Officer, as appropriate to allow for timely decisions regarding required disclosure.
Management’s Report on Internal Control over Financial Reporting
The management of Span-America Medical Systems, Inc. is responsible for establishing and maintaining adequate internal control over financial reporting, as such term is defined in Exchange Act Rules 13a-15(f) and 15d-15(f). Span-America’s internal control system was designed to provide reasonable assurance regarding the reliability of financial reporting and the preparation of financial statements for external purposes in accordance with generally accepted accounting principles and includes those policies and procedures that:
|
1.
|
pertain to the maintenance of records that in reasonable detail accurately and fairly reflect the transactions and dispositions of the assets of Span-America;
|
|
2.
|
provide reasonable assurance that transactions are recorded as necessary to permit preparation of financial statements in accordance with generally accepted accounting principles, and that receipts and expenditures of Span-America are being made only in accordance with authorizations of management and directors of Span-America; and
|
|
3.
|
provide reasonable assurance regarding prevention or timely detection of unauthorized acquisition, use or disposition of Span-America’s assets that could have a material effect on the financial statements.
|
All internal control systems, no matter how well designed, have inherent limitations. Therefore, even those systems determined to be effective can provide only reasonable assurance with respect to financial statement preparation and presentation.
54
We have assessed the effectiveness of our internal control over financial reporting as of October 2, 2010. In making this assessment, we used the framework set forth by the Committee of Sponsoring Organizations of the Treadway Commission (COSO) in Internal Control-Integrated Framework. Based on that assessment, we believe that as of October 2, 2010, our internal control over financial reporting is effective.
This annual report does not include an attestation report of our independent registered public accounting firm regarding internal control over financial reporting. Our report on internal control was not subject to attestation by our independent registered public accounting firm pursuant to an exemption for non-accelerated filers that permits us to provide only management’s report in this annual report.
Item 9B. Other Information
None
PART III
Item 10. Directors, Executive Officers and Corporate Governance
Information required under Item 10 of Part III is incorporated herein by reference to portions of the definitive Proxy Statement filed or to be filed with the Securities and Exchange Commission on or prior to 120 days following the end of our 2010 fiscal year under the headings “Proposals to be Voted Upon – Election of Directors,” “Corporate Governance,” “Executive Officers” and “Section 16(a) Beneficial Ownership Reporting Compliance.”
Item 11. Executive Compensation
Information required under Item 11 of Part III is incorporated herein by reference to portions of the definitive Proxy Statement filed or to be filed with the Securities and Exchange Commission on or prior to 120 days following the end of our 2010 fiscal year under the headings “Compensation of Executive Officers,” “Corporate Governance – Director Compensation” and “Corporate Governance – Compensation Committee Interlocks and Insider Participation.”
Item 12. Security Ownership of Certain Beneficial Owners and Management and Related Stockholder Matters
The information under the heading “Security Ownership of Certain Beneficial Owners and Management” set forth in our definitive Proxy Statement filed or to be filed with the Securities and Exchange Commission on or prior to 120 days following the end of our 2010 fiscal year is incorporated herein by reference.
55
The following table summarizes information regarding our equity compensation plans as of October 2, 2010:
|
Plan category
|
Number of
securities
to be issued
upon exercise of outstanding
options, warrants and rights
|
Weighted-average
exercise price of
outstanding options,
warrants and rights
|
Number of
securities
remaining available
for future issuance
under equity
compensation plans
(excluding securities
reflected in column (a))
|
|
(a)
|
(b)
|
(c)
|
|
|
Equity compensation plans approved by security holders
|
151,207
|
$7.50
|
228,250
|
|
Equity compensation plans not approved by security holders
|
0
|
0
|
0
|
|
Total
|
151,207
|
$7.50
|
228,250
|
For additional information on our stock option plans, see Note 11 in the Notes to Financial Statements for the year ended October 2, 2010.
Item 13. Certain Relationships and Related Transactions and Director Independence
The information required under Item 13 of Part III is incorporated herein by reference to portions of our definitive Proxy Statement filed or to be filed with the Securities and Exchange Commission on or prior to 120 days following the end of our 2010 fiscal year under the headings “Certain Relationships and Related Transactions” and “Corporate Governance – Director Independence.”
Item 14. Principal Accountant Fees and Services
The information required under Item 14 of Part III is incorporated herein by reference to portions of our definitive Proxy Statement filed or to be filed with the Securities and Exchange Commission on or prior to 120 days following the end of our 2010 fiscal year under the heading “Principal Accountant Fees and Services.”
56
PART IV
Item 15. Exhibits and Financial Statement Schedules
(a) (1) Financial Statements
The response to this portion of Item 15 is submitted under Item 8, Financial Statements and Supplementary Data, beginning on page 34.
(2) Financial Statement Schedules
The response to this portion of Item 15 is submitted below under Item 15(c).
(3) Listing of Exhibits
|
3.1
|
Restated Articles of Incorporation: Incorporated by reference to Exhibit 3(a) to the Company’s Registration Statement on Form S-18, Commission File No. 0-11392.
|
|
3.1.1
|
Articles of Amendment filed with the South Carolina Secretary of State on February 6, 1989: Incorporated by reference to Exhibit 3.1.1 to the Company’s Annual Report on Form 10-K for the fiscal year ended September 28, 1991 (the “1991 10-K”), Commission File No. 0-11392.
|
|
3.1.2
|
Articles of Amendment filed with the South Carolina Secretary of State on March 5, 1992: Incorporated by reference to Exhibit 4.4 to the Company’s Registration Statement on Form S-2 dated May 11, 1992, Commission File No. 33-47670.
|
|
3.1.3
|
Articles of Amendment filed with the South Carolina Secretary of State on April 22, 1993: Incorporated by reference to Exhibit 4.1 to the Company’s Quarterly Report on Form 10-Q for the quarter ended April 3, 1993.
|
|
3.2
|
Amended and Restated By-Laws dated February 4, 1997: Incorporated by reference to Exhibit 3.0 to the Company’s Quarterly Report on Form 10-Q for the quarter ended March 29, 1997.
|
|
3.2.1
|
Amendment to the Company's By-laws dated March 13, 2003: Incorporated by reference to Exhibit 3.2 to the Company's report on Form 8-K dated March 13, 2003, Commission File No. 000-11392.
|
|
3.2.2
|
Amendment to the Company's By-laws dated November 7, 2003: Incorporated by reference to Exhibit 3.2.2 to the Company’s Annual Report on Form 10-K for the fiscal year ended September 27, 2003 (the “2003 10-K”), Commission File No. 0-11392.
|
57
|
4.1
|
Specimen of Common Stock certificate: Incorporated by reference to Exhibit 1 to the Form S-8 filed on January 8, 1990, Commission File No. 33-32896.
|
|
4.2
|
Amended and Restated Shareholder Rights Agreement dated March 24, 2003, between Span-America Medical Systems, Inc. and American Stock Transfer & Trust Company as Rights Agent: Incorporated by reference to Exhibit 4.1 to the Company's report on Form 8-K dated March 24, 2003.
|
|
4.2.1
|
Amendment No. 1 to the Amended and Restated Shareholder Rights Agreement dated November 19, 2003: Incorporated by reference to Exhibit 4.1 to the Company's report on Form 8-K dated December 2, 2003.
|
|
4.3
|
Agreement among Span-America Medical Systems, Inc., Jerry Zucker, and Robert B. Johnston, dated December 17, 2003, regarding nomination of Mr. Johnston to the Span-America Board of Directors: Incorporated by reference to Exhibit 4.4 to the 2003 10-K.
|
|
10.1
|
Patent Assignment and Royalty Agreement between Donald C. Spann and the Company, with letter amendment thereto: Incorporated by reference to Exhibit 10(c) to the Form S-18 filed on June 2, 1983, Commission File No. 2-832-74-A.
|
|
10.2*
|
Retirement Agreement dated February 6, 1991 between the Company and Donald C. Spann: Incorporated by reference to Exhibit 10.7 to the 1991 10-K.
|
|
10.3*
|
Voluntary Resignation Agreement dated July 30, 1993 between the Company and Donald C. Spann: Incorporated by reference to Exhibit 10.1 to the Company's Quarterly Report on Form 10-Q for the quarter ended July 3, 1993, Commission File No. 0-11392.
|
|
10.4*
|
1991 Stock Option Plan: Incorporated by reference to Exhibit 10.6 to the 1991 10-K.
|
|
10.4.1*
|
Amendment No. 1 to the 1991 Stock Option Plan: Incorporated by reference to Exhibit 10.4.2 to the Company’s Annual Report on Form 10-K for the fiscal year ended October 3, 1998 (the “1998 10-K”), Commission File No. 0-11392.
|
|
10.5*
|
1997 Stock Option Plan: Incorporated by reference to Exhibit 10.14 to the Company’s Annual Report on Form 10-K for the fiscal year ended September 27, 1997 (the “1997 10-K”), Commission File No. 0-11392.
|
|
10.5.1*
|
Amendment No. 1 to the 1997 Stock Option Plan: Incorporated by reference to Exhibit 10.14.2 to the 1998 10-K.
|
|
10.6*
|
1997 Long Term Incentive Stock Option Plan: Incorporated by reference to Exhibit 10.15 to the 1997 10-K.
|
58
|
10.7*
|
Span-America Medical Systems, Inc. 2000 Restricted Stock Plan: Incorporated by reference to Exhibit B to the Company’s Definitive Proxy Statement for its 2001 Annual Meeting of Shareholders filed with the Commission on January 11, 2001.
|
|
10.8*
|
Span-America Medical Systems, Inc. 2005 Non-Employee Director Stock Plan: Incorporated by reference to Appendix B to the Company’s Definitive Proxy Statement for its 2005 Annual Meeting of Shareholders filed with the Commission on January 10, 2005.
|
|
10.9*
|
Span-America Medical Systems, Inc. 2007 Equity Incentive Plan: Incorporated by reference to Appendix A to the Company’s Definitive Proxy Statement for its 2007 Annual Meeting of Shareholders filed with the Commission on January 8, 2007.
|
|
10.10*
|
Severance Protection Agreement between the Company and James D. Ferguson dated July 25, 2002: Incorporated by reference to Exhibit 10.20 of the Company’s Annual Report on Form 10-K for the fiscal year ended September 28, 2002 (the “2002 10-K”), Commission File No. 000-11392.
|
|
10.11*
|
Severance Protection Agreement between the Company and Robert E. Ackley dated July 25, 2002: Incorporated by reference to Exhibit 10.21 of the 2002 10-K.
|
|
10.12*
|
Severance Protection Agreement between the Company and Richard C. Coggins dated July 25, 2002: Incorporated by reference to Exhibit 10.22 of the 2002 10-K.
|
|
10.13*
|
Severance Protection Agreement between the Company and James R. O’Reagan dated July 25, 2002: Incorporated by reference to Exhibit 10.23 of the 2002 10-K.
|
|
10.14*
|
Severance Protection Agreement between the Company and Clyde A. Shew dated July 25, 2002: Incorporated by reference to Exhibit 10.24 of the 2002 10-K.
|
|
10.15*
|
Severance Protection Agreement between the Company and Erick C. Herlong dated December 1, 2008: Incorporated by reference to Exhibit 10.16 to the Company's Annual Report on Form 10-K for the fiscal year ended October 3, 2009 (the "2009 10-K"), Commission File No. 0-11392.
|
|
10.16*
|
Severance Protection Agreement between the Company and Marie Sitter dated December 1, 2008: Incorporated by reference to Exhibit 10.17 of the 2009 10-K.
|
|
10.17
|
Distribution Agreement dated March 1, 1999 between the Company and Louisville Bedding Corporation: Incorporated by reference to Exhibit 10.16 to the Company’s Annual Report on Form 10-K for the fiscal year ended September 30, 2000, Commission File No. 000-11392.
|
|
10.17.1
|
Addendum to Distribution Agreement between Louisville Bedding Company and Span-America Medical Systems, Inc. dated January 1, 2002: Incorporated by reference to Exhibit 10.17 to the Company’s Quarterly Report on Form 10-Q for the quarter ended March 30, 2002.
|
59
|
10.18
|
Loan Agreement dated June 5, 2007 by and between Carolina First Bank, as lender, and the Company, as borrower: Incorporated by reference to the Company’s Current Report on Form 8-K dated June 5, 2007 and filed with the commission on June 11, 2007.
|
|
10.18.1
|
Revolving Note dated June 5, 2007 by the Company to Carolina First Bank: Incorporated by reference to the Company’s Current Report on Form 8-K dated June 5, 2007 and filed with the commission on June 11, 2007.
|
|
10.18.2
|
Negative Pledge Agreement dated June 5, 2007 by the Company to Carolina First Bank: Incorporated by reference to the Company’s Current Report on Form 8-K dated June 5, 2007 and filed with the commission on June 11, 2007.
|
|
23.1
|
Consent of Elliott Davis, LLC.
|
|
31.1
|
Officer Certifications Pursuant to Section 302.
|
|
32.1
|
Officer Certifications Pursuant to Section 906.
|
* Management contract or compensatory plan or arrangement.
(b) Exhibits
|
|
The exhibits required by this section of Item 15 are attached hereto or incorporated by reference
|
|
(c)
|
Financial Statement Schedules
|
60
|
Schedule VIII Valuation and Qualifying Accounts
|
|||||||||||||||
|
COL. A
|
COL. B
|
COL C.
|
COL. D
|
COL. E
|
|||||||||||
|
ADDITIONS
|
|||||||||||||||
|
|
|
(1) |
|
|
|||||||||||
|
Balance at
|
Charged to
|
|
Balance at
|
||||||||||||
|
Beginning of
|
Costs and
|
Deductions-
|
End of
|
||||||||||||
|
Description
|
Period
|
Expenses
|
Describe
|
Period
|
|||||||||||
|
Year Ended October 2, 2010
|
|||||||||||||||
|
Deducted from asset accounts:
|
|||||||||||||||
|
Reserve for uncollectible accounts
|
$ | 155,000 | $ | 26,900 | $ | 31,900 |
(a)
|
$ | 150,000 | ||||||
|
Reserve for obsolete inventory
|
$ | 340,000 | $ | 28,000 | $ | 42,000 |
(b)
|
$ | 326,000 | ||||||
|
Year Ended October 3, 2009
|
|||||||||||||||
|
Deducted from asset accounts:
|
|||||||||||||||
|
Reserve for uncollectible accounts
|
$ | 235,000 | $ | (54,200 | ) | $ | 25,800 |
(a)
|
$ | 155,000 | |||||
|
Reserve for obsolete inventory
|
$ | 222,000 | $ | 135,700 | $ | 17,700 |
(b)
|
$ | 340,000 | ||||||
|
Year Ended September 27, 2008
|
|||||||||||||||
|
Deducted from asset accounts:
|
|||||||||||||||
|
Reserve for uncollectible accounts
|
$ | 189,000 | $ | 75,500 | $ | 29,500 |
(a)
|
$ | 235,000 | ||||||
|
Reserve for obsolete inventory
|
$ | 200,000 | $ | 65,200 | $ | 43,200 |
(b)
|
$ | 222,000 | ||||||
(a) Uncollectible accounts written off.
(b) Inventory disposed of
All other schedules for which provision is made in the applicable accounting regulations of the Securities and Exchange Commission are not required under the related instructions or are inapplicable, and therefore have been omitted.
61
SIGNATURES
Pursuant to the requirements of Section 13 or 15(d) of the Securities Exchange Act of 1934, the registrant has duly caused this report to be signed on its behalf by the undersigned, thereunto duly authorized.
SPAN-AMERICA MEDICAL SYSTEMS, INC.
By: /s/ Thomas D. Henrion December 22, 2010
Thomas D. Henrion
Chairman of the Board
Pursuant to the requirements of the Securities Exchange Act of 1934, this report has been signed below by the following persons on behalf of the registrant and in the capacities on the date indicated.
| /s/ James D. Ferguson | President, Chief Executive Officer and Director | |||
| James D. Ferguson | (Principal Executive Officer) |
| /s/ Richard C. Coggins | Chief Financial Officer and Director | |||
|
Richard C. Coggins
|
(Principal Financial Officer)
|
| /s/ Gwendolyn L. Randolph | Controller | |||
| Gwendolyn L. Randolph |
| /s/ Robert H. Dick | Director | |||
|
Robert H. Dick
|
| /s/ Thomas F. Grady, Jr. | Director | |||
| Thomas F. Grady, Jr. |
| /s/ Guy R. Guarch | Director | |||
| Guy R. Guarch |
| /s/ Thomas D. Henrion | Director | |||
| Thomas D. Henrion |
| /s/ Robert B. Johnston | Director | |||
|
Robert B. Johnston
|
| /s/ Dan R. Lee | Director | |||
| Dan R. Lee |
| /s/ Linda D. Norman | Director | |||
| Linda D. Norman |
December 22, 2010
62