Attached files
| file | filename |
|---|---|
| 8-K - Frontier Communications Parent, Inc. | c63669_8k.htm |
| EX-99.2 - Frontier Communications Parent, Inc. | c63669_ex99-2.htm |
Exhibit 99.1

Investor Presentation
December 2010

Safe Harbor Statement
Forward-Looking Language
This document contains forward-looking statements that are subject to risks and uncertainties that could cause actual results to
differ materially from those expressed or implied
in the statements. Statements that are not historical facts are forward-looking statements made pursuant to the safe harbor provisions of the Private Securities Litigation Reform
Act of 1995. Words
such as “believe,” “anticipate,” “expect” and similar expressions are intended to identify forward-looking statements. Forward-looking statements (including
oral representations) are only predictions or statements
of current plans, which we review continuously. Forward-looking statements may differ from actual future results due to,
but not limited to, and our future results may be materially affected by, potential risks or uncertainties. You
should understand that it is not possible to predict or identify all
potential risks or uncertainties. We note the following as a partial list: limitations on the amount of capital stock that we can issue to make acquisitions or to raise additional
capital
during the two years after the Merger; our indemnity obligation to Verizon for taxes which may be imposed upon them as a result of changes in ownership of our stock may
discourage, delay or prevent a third party from acquiring control of us
during the two-year period following the merger in a transaction that stockholders might consider favorable;
our ability to successfully integrate the operations of the acquired business into Frontier’s existing operations; the effects of increased
expenses incurred due to activities related
to the transaction and the integration of the acquired business; the risk that the growth opportunities and cost synergies from the transaction may not be fully realized or may take
longer to realize than
expected; our ability to maintain relationships with customers, employees or suppliers; the effects of greater than anticipated competition requiring new
pricing, marketing strategies or new product or service offerings and the risk that we will not respond
on a timely or profitable basis; reductions in the number of our access lines
that cannot be offset by increases in High-Speed Internet (HSI) subscribers and sales of other products and services; the effects of ongoing changes in the regulation of the
communications
industry as a result of federal and state legislation and regulation; the effects of changes in the availability of federal and state universal funding to us and our
competitors; the effects of competition from cable, wireless and other wireline carriers
(through Voice over Internet Protocol (VOIP), DOCSIS 3.0, 4G or otherwise); our ability to
adjust successfully to changes in the communications industry and to implement strategies for growth; adverse changes in the credit markets or in the ratings given
to our debt
securities by nationally accredited ratings organizations, which could limit or restrict the availability, or increase the cost, of financing; continued reductions in switched access
revenues as a result of regulation, competition or technology
substitutions; our ability to effectively manage service quality in our territories and meet mandated service quality
metrics; our ability to successfully introduce new product offerings, including our ability to offer bundled service packages on terms
that are both profitable to us and attractive to
customers; changes in accounting policies or practices adopted voluntarily or as required by generally accepted accounting principles or regulations; our ability to effectively
manage our operations,
operating expenses and capital expenditures, and to repay, reduce or refinance our debt; the effects of changes in both general and local economic
conditions on the markets that we serve, which can affect demand for our products and services, customer purchasing
decisions, collectability of revenues and required levels of
capital expenditures related to new construction of residences and businesses; the effects of customer bankruptcies and home foreclosures, which could result in difficulty in
collection of
revenues and loss of customers; the effects of technological changes and competition on our capital expenditures and product and service offerings, including the
lack of assurance that our network improvements will be sufficient to meet or exceed the capabilities
and quality of competing networks; the effects of increased medical, retiree
and pension expenses and related funding requirements; changes in income tax rates, tax laws, regulations or rulings, or federal or state tax assessments; the effects of state
regulatory cash management policies on our ability to transfer cash among our subsidiaries and to the parent company; our ability to successfully renegotiate union contracts
expiring in 2010 and thereafter; declines in the value of our pension plan
assets, which would require us to make increased contributions to the pension plan in 2011 and beyond;
our ability to pay dividends on our common shares, which may be affected by our cash flow from operations, amount of capital expenditures, debt service
requirements, cash paid
for income taxes and liquidity; the effects of any unfavorable outcome with respect to any current or future legal, governmental or regulatory proceedings, audits or disputes; the
possible impact of adverse changes to regulatory
requirements imposed by various political bodies or other external factors over which we have no control; and the effects of
severe weather events such as hurricanes, tornados, ice storms or other natural or man-made disasters. These and other
uncertainties related to our business are described in
greater detail in our filings with the Securities and Exchange Commission, including our reports on Forms 10-K and 10-Q, and the foregoing information should be read in
conjunction with these filings. We
undertake no obligation to publicly update or revise any forward-looking statements or to make any other forward-looking statement, whether
as a result of new information, future events or otherwise unless required to do so by securities laws.
2

Non-GAAP Financial Measures
Non-GAAP Financial Measures
The Company uses certain non-GAAP financial measures in evaluating its performance. These include free cash flow, EBITDA or “operating cash flow”, which we define
as
operating income plus depreciation and amortization, and Adjusted EBITDA; a reconciliation of the differences between EBITDA and free cash flow and the most comparable
financial measures calculated and presented in accordance with GAAP is included
in the tables that follow. The non-GAAP financial measures are by definition not measures of
financial performance under generally accepted accounting principles and are not alternatives to operating income or net income reflected in the statement
of operations or to
cash flow as reflected in the statement of cash flows and are not necessarily indicative of cash available to fund all cash flow needs. The non-GAAP financial measures used by
the Company may not be comparable to similarly
titled measures of other companies.
The Company believes that the presentation of non-GAAP financial measures provides useful information to investors regarding the
Company’s financial condition and results of
operations because these measures, when used in conjunction with related GAAP financial measures, (i) together provide a more comprehensive view of the Company’s core
operations and ability to generate
cash flow, (ii) provide investors with the financial analytical framework upon which management bases financial, operational, compensation and
planning decisions and (iii) presents measurements that investors and rating agencies have indicated to management
are useful to them in assessing the Company and its
results of operations. Management uses these non-GAAP financial measures to plan and measure the performance of its core operations, and its divisions measure performance
and report to management
based upon these measures. In addition, the Company believes that free cash flow and EBITDA, as the Company defines them, can assist in
comparing performance from period to period, without taking into account factors affecting cash flow reflected in the
statement of cash flows, including changes in working capital
and the timing of purchases and payments.
The Company has shown adjustments to its financial presentations to exclude $78.5 million and $3.7 million of acquisition and integration costs in the third quarters of 2010 and
2009,
respectively, and $125.9 million and $14.5 million of acquisition and integration costs in the first nine months of 2010 and 2009, respectively, because the Company
believes that such costs in the third quarter and first nine months of 2010 are unusual,
and that the magnitude of such costs in the third quarter and first nine months of 2010
materially exceed the comparable costs in the third quarter and first nine months of 2009. In addition, the Company has shown adjustments to its financial
presentations to
exclude $12.1 million and $8.4 million of non-cash pension and other postretirement benefit costs in the third quarters of 2010 and 2009, respectively, and $24.2 million and $24.8
million of non-cash pension and other postretirement
benefit costs in the first nine months of 2010 and 2009, respectively, and $7.0 million of severance and early retirement
costs in the third quarter of 2010, and $7.7 million and $2.6 million of severance and early retirement costs in the first nine months
of 2010 and 2009, respectively, because
investors have indicated to management that such adjustments are useful to them in assessing the Company and its results of operations.
Management uses these non-GAAP financial measures to (i) assist in analyzing the Company’s underlying financial performance
from period to period, (ii) evaluate the financial
performance of its business units, (iii) analyze and evaluate strategic and operational decisions, (iv) establish criteria for compensation decisions, and (v) assist management in
understanding the
Company’s ability to generate cash flow and, as a result, to plan for future capital and operational decisions. Management uses these non-GAAP financial
measures in conjunction with related GAAP financial measures. The Company
believes that the non-GAAP financial measures are meaningful and useful for the reasons
outlined above.
While the Company utilizes these non-GAAP financial measures in managing and analyzing its business and financial condition and believes that they are useful to management
and to
investors for the reasons outlined above, these non-GAAP financial measures have certain shortcomings. In particular, free cash flow does not represent the residual cash
flow available for discretionary expenditures, since items such as debt
repayments and dividends are not deducted in determining such measure. EBITDA has similar
shortcomings as interest, income taxes, capital expenditures, debt repayments and dividends are not deducted in determining this measure. Management
compensates for the
shortcomings of these measures by utilizing them in conjunction with their comparable GAAP financial measures. The information in this document should be read in conjunction
with the financial statements and footnotes
contained in our documents filed with the U.S. Securities and Exchange Commission.
3
Frontier Introduction
Frontier Communications (NYSE: FTR)
was founded in 1935 as Citizens
Utilities and became a pure-play
telecom network operator in 2004
Frontier’s network provides fast,
reliable data, voice, and video service
to 3.5 million residential customers
and 381,000 business customers
across 27 states
Frontier is the largest communications
company focused on rural America
A transformational
acquisition of
properties from
Verizon tripled
Frontier’s
business size on
July 1, 2010
Key Stats (September 30, 2010)
1
States
27
Total Access Lines
5,875
High Speed Internet Subscribers
1,693
Satellite & FiOS Video Subscribers
516
Employees
14,758
Revenues
$5,747
% Business Customer
42
%
% Residential Customer
45
%
% Regulatory
12
%
EBITDA
$2,746
% Revenues
48
%
Free Cash Flow
$1,281
% Paid as Dividends
58
%
Total Debt
$8,262
Cash
$351
Net Leverage
2.8
(1) $ Millions; Units 000s. May not sum due to rounding. Pro forma for
acquisitions. Revenues, EBITDA, and FCF are for the Last Twelve Months.
4
Investment Summary
Opportunity
Manage the acquired properties with Frontier’s proven Local
Engagement Model and innovative marketing
Bring margins up to Legacy levels
Harness economics of scale from business that is 3x its
former size
Markets
Expand broadband availability in new markets from 68%
towards Legacy Frontier’s 92%
Rural profile, less competition, less regulatory reform
exposure
Business & Broadband are 62% of customer revenues
Returns
Revenue upside from increased product penetration
$550 million operating expense synergy target by 2013
Consistent execution, solid free cash flow, stable dividend
Credit
Quality
Significantly deleveraged on July 1, 2010, now 2.8x
Target leverage of 2.5x or below
Well structured maturity schedule
5
Frontier Local Engagement
Local Area Manager
High Speed Internet (DSL
& FTTP)
Voice
Video (Satellite & FiOS)
Wireless Data (WiFi mesh)
Online backup
24/7 U.S. Tech Support
Residential
Managed IP VPN
VoIP systems
High-Capacity fiber data
Metro Ethernet
Wireless backhaul
Managed router
Business
Over 120 Local Area Managers at the community level respond to unique
customer needs in each market across Frontier’s 27 states
Employees live in the markets they serve, and put the customer first
Innovative marketing, 2-hour appointment windows, exceptional service
levels
6
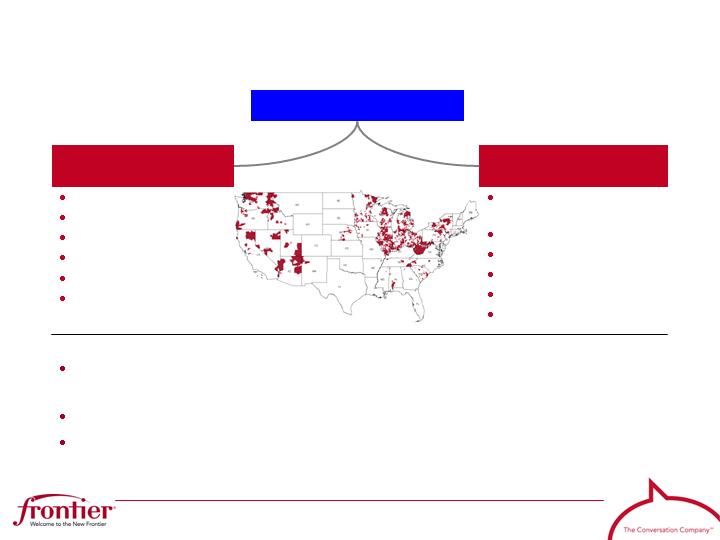
Robust Local Network
Extensive Local Networks
2,609 ILEC exchanges, 2,700 central
offices
Fiber-to-the-Home in all greenfield
builds
Linked by national fiber backbone
Expansion to Drive Penetration
• Acquired
network has 68% broadband
availability vs. Legacy 92%
• FCC Commitments:
1.
12/31/13 – 3Mbps for 85% of households
2.
12/31/15 – 4Mbps for 85% of households
Note: 1) Based on product availability to customers; loop length availability is higher.
Frontier Broadband Network Availability
1
92%
68%
43%
14%
75%
62%
50%
13%
0%
10%
20%
30%
40%
50%
60%
70%
80%
90%
100%
1+ Mbps
3+ Mbps
6+ Mbps
20 Mbps
Jun '10 Legacy
Sep '10 New Frontier
7

High-Capacity National Backbone
Frontier’s fiber network interconnects its 27-state footprint
Phoenix
Palo Alto
Chicago
Salt Lake
Rochester
Atlanta
Ashburn
20
GigE
OC
48
/
Gig
/
e
Core POP
Core POP
/
Peering
Frontier
13
Aggregation POP
Mound
Bloomington
Ft
.
Wayne
Norwalk
Athens
Charleston
Clarksburg
Durham
Myrtle Beach
Beaverton
La Grande
Everett
Kennewick
Gardnerville
Moscow
Wausau
Lakeville
Muskegon
Bluefield
Charles Town
Coos Bay
Portland
Seattle
Carbondale
DeKalb
Sun Prairie
Redmond
Tigard
8
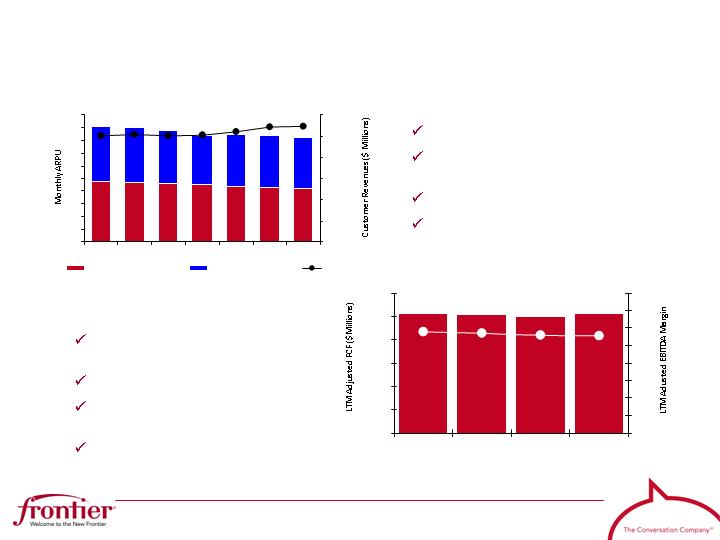
Consistent Execution
Stability of Revenues
Driving recurring customer revenues
Delivering reliable, quality products
and services at a good price
Reducing churn with bundles
Maintaining strong
Business/Enterprise exposure
Notes: Customer revenue is defined as total revenue
less access services revenue. Access services include
switched network access and subsidies.
Stability of Cash Flows
Focus on expense reduction;
competitively fit and flexible
Disciplined capital spending
Legacy EBITDA margins of 54% for
10 quarters through Q2 2010
High conversion rate of EBITDA into
free cash flow (FCF)
Note: Broadband expansion capital expenditures will increase significantly from 4Q10 through 2012.
Pro Forma Frontier
$1,277
$1,264
$1,252
$1,281
$0
$250
$500
$750
$1,000
$1,250
$1,500
4Q09
1Q10
2Q10
3Q10
20
%
25
%
30
%
35
%
40
%
45
%
50
%
55
%
60
%
Pro Forma Frontier Customer Revenue
$67
$67
$67
$67
$68
$70
$71
$25
$30
$35
$40
$45
$50
$55
$60
$65
$70
$75
1Q09
2Q09
3Q09
4Q09
1Q10
2Q10
3Q10
$0
$250
$500
$750
$1,000
$1,250
$1,500
Residential Revenue
Business Revenue
ARPU
9
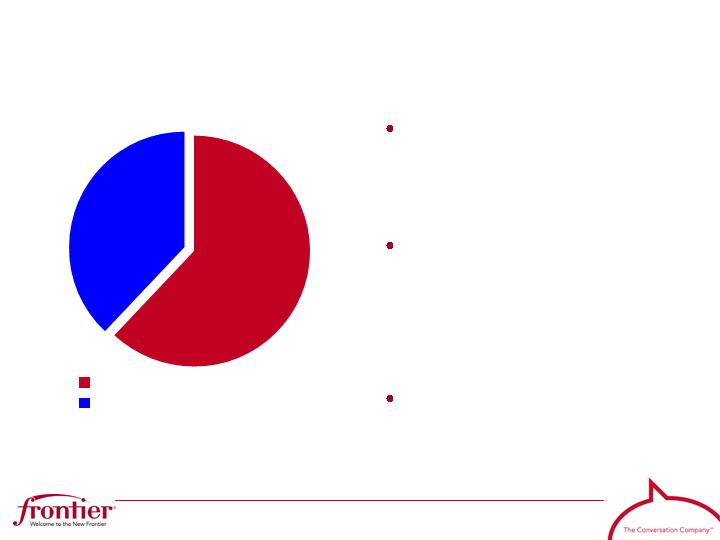
Attractive Revenue Base
For the quarter ended 9/30/10
62%
38%
Business & Broadband Revenue
Other Customer Revenue
Frontier generates 62% of
its customer revenue from
Business and Broadband
sources
Our business capabilities
are very broad and include:
- Advanced IP switching
- VoIP systems
- High-capacity fiber data systems
- Wireless cell site backhaul
- Ethernet
We are re-focusing the
residential relationship on
broadband
10
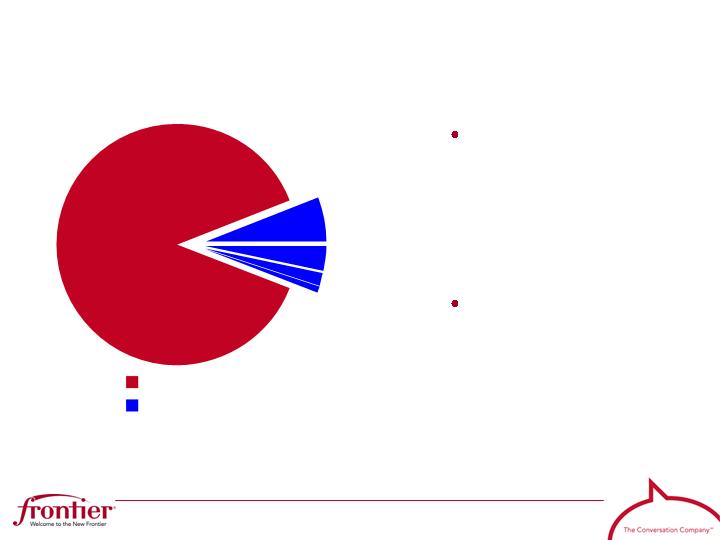
Minimizing Regulatory Risk
For the quarter ended 9/30/10
88.5 %
Switched 5.8 %
Federal 3.1 %
Surcharge 1.9 %
State 0.7 %
Regulatory Revenue
Customer Revenue
The acquired
properties reduced
Frontier’s Regulatory
Revenue exposure
from 17.3% at 3Q09 to
11.5% at 3Q10
We continue to
replace this uncertain,
high-margin revenue
stream with Customer
Revenue
11

Key Pro Forma Financial Data
Notes: ($ millions)
1) See adjustments in Appendix, Reconciliation of Non-GAAP Financial Measures.
(2 Adjusted to exclude $52 million of non-cash pension and OPEB expense.
(3) Annualized actual 3 Months Ended 9/30/10.
(4) Represents $550 million estimate less annualized synergies realized through 9/30/10
LTM 3Q10
LTM 3Q10
LTM 3Q10
Actual
Pro Forma
Pro Forma
Legacy
Acquired
New
Statistics
Frontier
Properties
Frontier
Synergies
Total
Revenue
$2,070
$3,677
$5,747
$0
$5,747
Adjusted EBITDA
(1)
1,105
1,641
(2)
2,746
298
(4)
3,044
% EBITDA Margin
53.4%
44.6%
47.8%
53.0%
Bridge to Free Cash Flow:
Interest Expense
(666)
(3)
(666)
Cash Taxes
(139)
(113)
(252)
Capital Expenditures
(217)
(449)
(666)
(666)
Other
7
7
Free Cash Flow
$1,281
$185
$1,466
Net Debt / Adj. EBITDA
3.93x
1.82x
2.84x
2.56x
Adj. EBITDA / Interest Exp.
2.90x
5.76x
4.12x
4.57x
Dividend ($0.75 / share)
$744
$744
FCF Dividend Payout Ratio
58%
51%
12
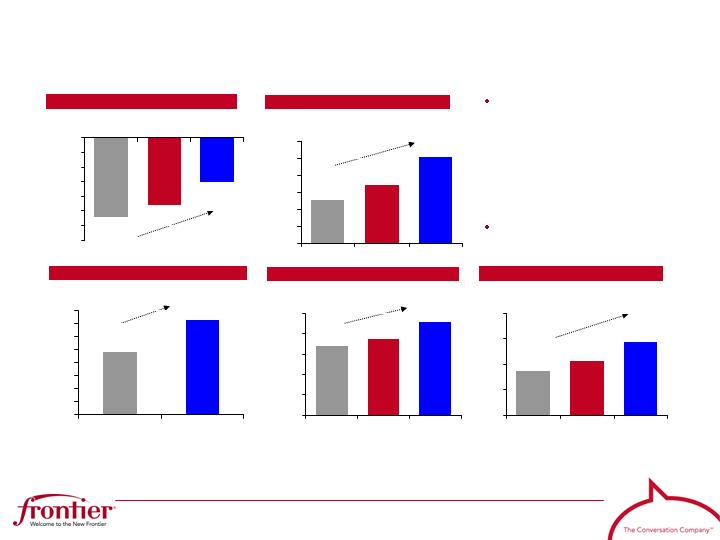
Revenue Opportunity
Our ability to migrate
the acquired properties
to Frontier
’s
performance metrics
offers the potential for
significant operational
enhancement
Driven by broadband
and Local Engagement
Long Distance Penetration
Satellite TV Penetration
Access Line Decline
HSI Penetration
Note: As of 9/30/2010.
Broadband Availability
(10.9)%
(9.3)%
(6.0)%
(14)%
(12)%
(10)%
(8)%
(6)%
(4)%
(2)%
0
%
Acq Prop
Pro Forma
Legacy
27.1
%
28.8
%
32.2
%
22
%
24
%
26
%
28
%
30
%
32
%
34
%
Acq Prop
Pro Forma
Legacy
48.1
%
72.4
%
0
%
10
%
20
%
30
%
40
%
50
%
60
%
70
%
80
%
Acq Prop
Legacy
68.0
%
75.0
%
92.0
%
0
%
20
%
40
%
60
%
80
%
100
%
Acq Prop
Pro Forma
Legacy
8.7
%
10.6
%
14.3
%
0
%
5
%
10
%
15
%
20
%
Acq Prop
Pro Forma
Legacy
13

Broadband Buildout Drives Growth
Revenue opportunity
driven by 850,000 new
broadband homes
open for sale
Emphasis on double
and triple-play
packages, which
lower churn
significantly
9/30/10
12/31/11
12/31/12
12/31/13
Acquired
Properties
Legacy
Note:
(i) Based on
Frontier
commitments
to the FCC on
5/21/10 for
3Mbps
broadband
availability.
This chart
assumes no
change in
Legacy
footprint.
68%
72%
80%
85%
92%
92%
92%
92%
i
i
i
14
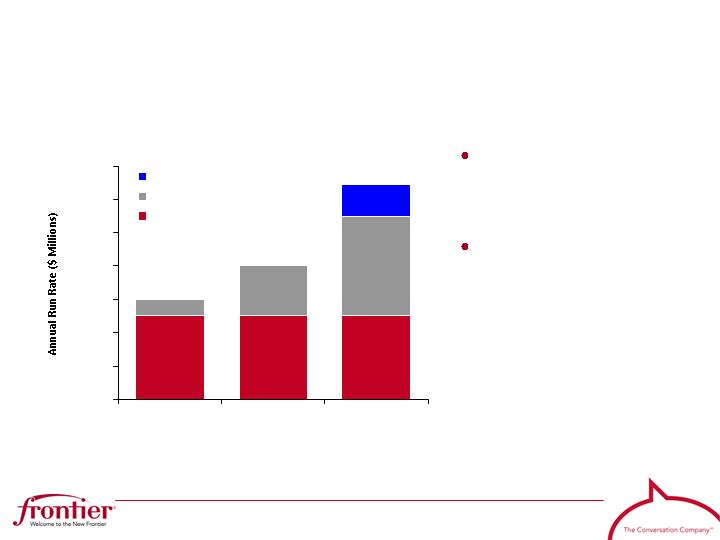
Cost Synergy Overview
Significant savings
from reducing cash
operating expenses
Numerous projects
underway; synergy
estimates include:
- Network savings
- Outside contractors
- IT savings from conversion
- Real estate savings
- Operations
Estimated Cost Synergies
$252
$252
$252
$48
$148
$298
$94
$0
$100
$200
$300
$400
$500
$600
$700
2010
2011
2012
Software License
Other Projects
Allocated Overhead
$300
$400
$550
15
Systems Integration Plan
System mapping and analysis in
process
Systems are identical across all
13 states; processes on the first
conversions will be replicated
Initial expectation is a few states
in the second half of 2011, and
the remaining states in two
groups by end of 2012
Successful conversion despite a
firm July 1 deadline
Billing cycles kept within days of
prior scheduled dates, and all
systems functional out of the
gate
Backlog managed downward
with “bubble workforce” and
current levels within normal
range
Frontier 13
West Virginia
Frontier converted West Virginia, which utilized BellAtlantic
systems, on July 1, 2010
The remaining 13 states of the acquired properties (detailed in the
appendix) will be converted off Verizon (GTE) systems onto
existing Frontier systems by the end of 2012
16
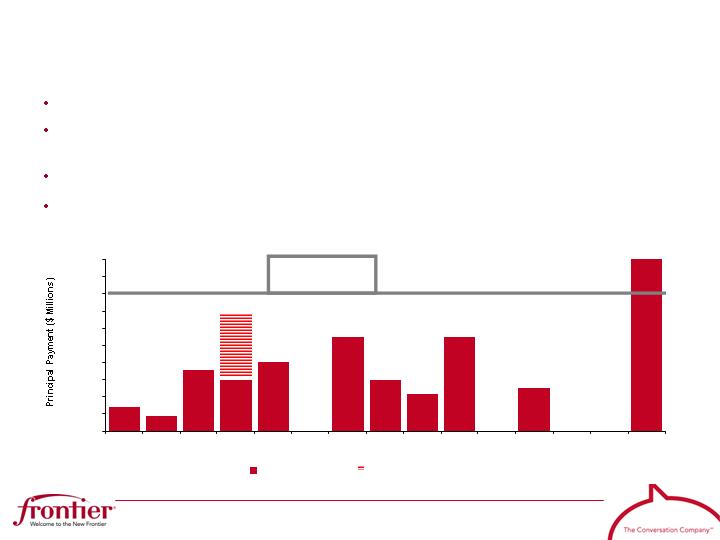
Financing Overview
Deleveraged from 4.0x (6/30/10) to 2.8x (9/30/10)
Strong $1.0 billion liquidity with an undrawn $750M R/C and $250M minimum
cash-on-hand objective
Maturity schedule is well balanced and below run rate FCF levels
Free cash flow levels match well with scheduled debt amortization.
17
$-
$200
$400
$600
$800
$1,000
$1,200
$1,400
$1,600
$1,800
$2,000
2011
2012
2013
2014
2015
2016
2017
2018
2019
2020
2021
2022
2023
2024
2025+
Existing FTR Debt
Undrawn Revolver
LTM 3Q10 Pro Forma
Frontier FCF with
Synergies = $1.6B
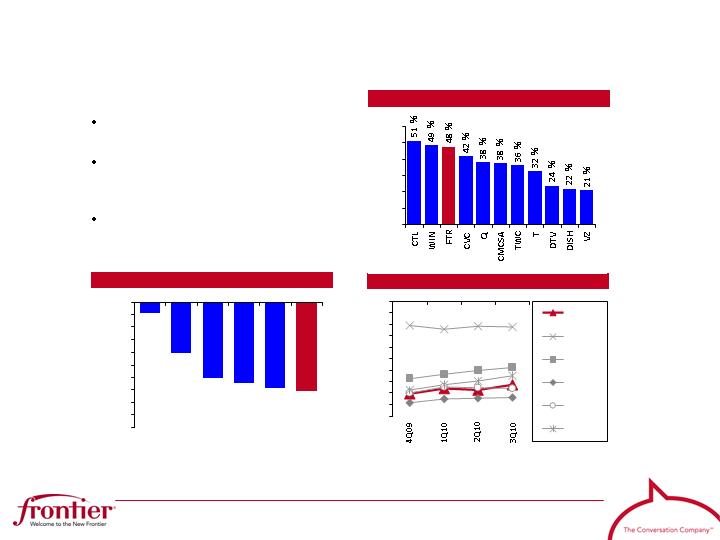
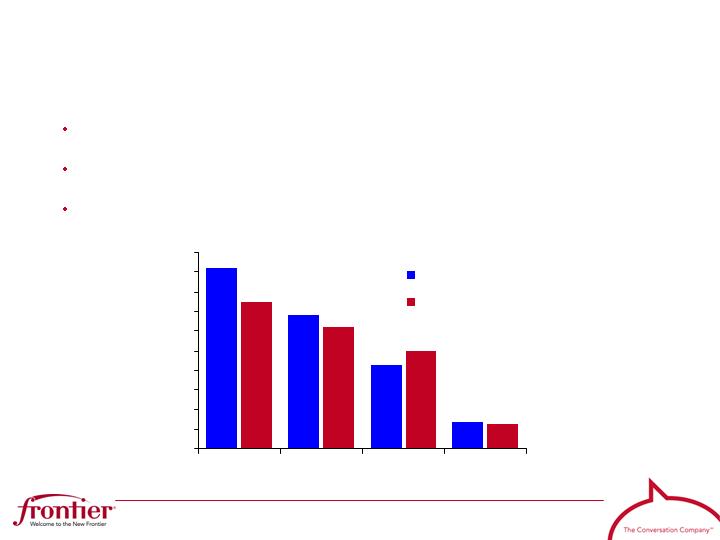
Industry Comparisons
Line Loss Yr/Yr (3)
EBITDA Margin (1)
Change in Lines + HSI Subs (2)
Pro Forma Frontier Results
Results, as expected, weakened by
the acquired properties
Excellent comps going forward as
Frontier turns around the new
markets
Strong starting point on EBITDA
margin
Notes:
1.
Data for the 3-months ended 9/30/10. Adjusted EBITDA; excludes wireless; Cable is network operations only.
2.
Data for the 3-months ended 9/30/10. Represents the yr/yr change in the combined ending base of total access lines and HSI subscribers.
3.
Data for the 3-months ended 9/30/10.
Source: SEC filings; Wall Street research; Frontier.
0%
10%
20%
30%
40%
50%
60%
(0.9)%
(4.1)%
(6.0)%
(6.5)%
(6.9)%
(7.2)%
(10)%
(9)%
(8)%
(7)%
(6)%
(5)%
(4)%
(3)%
(2)%
(1)%
0
%
WIN
CTL
VZ
T
Q
FTR
(12)%
(11)%
(10)%
(9)%
(8)%
(7)%
(6)%
(5)%
(4)%
(3)%
(2)%
New FTR
WIN
CTL
Q
T
VZ
18

Doing What We Say…
Goal
Status
Regulatory approval with appropriate conditions
Completion of financing within expected cost
Distribution of shares with minimal market disruption
Completion of West Virginia systems conversion
Continued delivery of solid Legacy Frontier results
Customer metric improvement and synergy realization
of acquired properties
In Process
19

Appendix
20

Pro Forma Combined Financials
Notes
1. Total revenues including Switched Access & Subsidy.
2. Customer revenue is defined as total revenue less access services. Access services include switched network access and subsidies.
3. Represents Operating Cash Flow (EBITDA), as adjusted. Please see Non-GAAP Reconciliations.
4. Capital expenditures exclude integration capital expenditures related to the acquisition of Verizon lines.
5. Free cash flow as defined by Frontier, and excluding integration costs and capex. Please see Non-GAAP Reconciliations.
$ Millions
3Q09
4Q09
1Q10
2Q10
3Q10
Revenue
(1)
$1,514
$1,454
$1,456
$1,434
$1,403
Customer Revenue
(2)
$1,318
$1,264
$1,266
$1,260
$1,241
Adjusted EBITDA
(3)
$736
$723
$697
$655
$671
EBITDA Margin
48.6%
49.7%
47.9%
45.7%
47.9%
Capital Expenditures
(4)
$193
$209
$136
$162
$159
% Revenue
12.8%
14.4%
9.3%
11.3%
11.3%
Free Cash Flow
(5)
$310
$300
$357
$285
$339
Access Lines (000s)
6,475
6,315
6,171
6,014
5,875
% Change Yr/Yr
NA
NA
(9.6)%
(9.7)%
(9.3)%
Business
2,246
2,212
2,180
2,150
2,140
Residential
4,229
4,103
3,992
3,863
3,735
High Speed Internet
1,676
1,697
1,712
1,698
1,693
Net Adds
15
20
16
(14)
(5)
Penetration
25.9%
26.9%
27.7%
28.2%
28.8%
21

Access Lines by State
As of 9/30/10
FRONTIER
ACQUIRED
COMBINED
% Total
West Virginia
135,656
498,995
634,651
10.8
%
Indiana
4,143
581,334
585,477
10.0
%
Illinois
91,114
473,860
564,974
9.6
%
Ohio
519
516,154
516,673
8.8
%
Michigan
17,105
389,923
407,028
6.9
%
Wisconsin
54,684
230,250
284,934
4.8
%
Oregon
11,883
246,635
258,518
4.4
%
California
129,581
20,216
149,797
2.5
%
Arizona
132,364
2,944
135,308
2.3
%
Idaho
17,987
93,560
111,547
1.9
%
Nevada
22,069
27,916
49,985
0.9
%
COMBINED
617,105
3,081,787
3,698,892
63.0
%
Washington
0
452,768
452,768
7.7
%
North Carolina
0
218,013
218,013
3.7
%
South Carolina
0
99,669
99,669
1.7
%
NEW STATES
0
770,450
770,450
13.1
%
New York
597,409
0
597,409
10.2
%
Pennsylvania
380,622
0
380,622
6.5
%
Minnesota
192,123
0
192,123
3.3
%
Tennessee
71,029
0
71,029
1.2
%
Iowa
40,865
0
40,865
0.7
%
Nebraska
39,180
0
39,180
0.7
%
Alabama
24,142
0
24,142
0.4
%
Utah
20,312
0
20,312
0.3
%
Georgia
17,212
0
17,212
0.3
%
New Mexico
7,437
0
7,437
0.1
%
Montana
7,356
0
7,356
0.1
%
Mississippi
5,081
0
5,081
0.1
%
Florida
3,336
0
3,336
0.1
%
FRONTIER
1,406,104
0
1,406,104
23.9
%
TOTAL
2,023,209
3,852,237
5,875,446
100.0
%
22

Legacy Selected Financials
Notes
1. Revenue for 2007 excludes the favorable one-time impact of $38.7 million for a significant settlement of a carrier dispute.
2. Customer revenue is defined as total revenue less access services. Access services include switched network access and subsidies.
3. Represents Operating Cash Flow (EBITDA), as adjusted. Please see Non-GAAP Reconciliations.
4. Capital expenditures for 2007 and 2009 exclude $9.6 million and $25.0 million, respectively, related to integration activities.
5. Free cash flow includes ELI for all years prior to its sale in July 2006. Please see Non-GAAP Reconciliations.
$ Millions
2005
2006
2007
2008
2009
Revenue
(1)
2,017
$
2,025
$
2,249
$
2,237
$
2,118
$
Customer Revenue
(2)
1,586
$
1,597
$
1,809
$
1,832
$
1,758
$
Adjusted EBITDA
(3)
1,116
$
1,128
$
1,213
$
1,214
$
1,149
$
EBITDA Margin
55.3%
55.7%
53.9%
54.3%
54.2%
Capital Expenditures
(4)
259
$
269
$
306
$
288
$
231
$
% Revenue
12.9%
13.3%
13.6%
12.9%
10.9%
Free Cash Flow
(5)
544
$
562
$
538
$
493
$
491
$
Access Lines (000s)
2,238
2,127
2,429
2,254
2,118
High Speed Internet
318
393
523
580
636
Penetration
14.2
%
18.5
%
21.5
%
25.7
%
30.0
%
23

Reconciliation of Non-GAAP Financial Measures
2009 Pro Forma Frontier and Acquired Properties
Verizon's Separate
Pro Forma
Total
($ in millions)
Frontier
Telephone Operations
Adjustments
Pro Forma
EBITDA
Operating Income
606
$
542
$
219
$
1,367
$
Add back:
Depreciation and amortization
477
781
253
1,511
EBITDA, as reported
1,083
$
1,323
$
472
$
2,878
$
Add/(subtract):
34
52
-
86
Severance and early retirement costs
4
-
-
4
Acquisition and integration costs
28
-
(28)
-
Adjusted EBITDA
1,149
$
1,375
$
444
$
2,968
$
Reconciliation of Non-GAAP Financial Measures
For the year ended December 31, 2009
Non-cash pension and other
postretirement costs
24

Reconciliation of Non-GAAP Financial Measures
Frontier (Legacy)
($ in 000's)
2005
2006
2007
2008
2009
EBITDA (Operating Cash Flow)
Operating Income
588,968
$
644,490
$
705,416
$
642,456
$
606,165
$
Add back:
Depreciation and amortization
520,204
476,487
545,856
561,801
476,391
EBITDA (Operating Cash Flow), as reported
1,109,172
$
1,120,977
$
1,251,272
$
1,204,257
$
1,082,556
$
Add / (Subtract)
Severance and early retirement costs
6,981
7,193
13,874
7,598
3,788
Pension curtailment gain (Non-Cash)
-
-
(14,379)
-
-
Non-Cash Pension Costs
-
-
-
-
34,196
Legal settlement costs
-
-
816
2,113
-
Carrier dispute settlement
-
-
(38,700)
-
-
Acquisition and integration costs
-
-
-
-
28,334
Adjusted EBITDA
1,116,153
$
1,128,170
$
1,212,883
$
1,213,968
$
1,148,874
$
Revenue, as reported
2,017,041
$
2,025,367
$
2,288,015
$
2,237,018
$
2,117,894
$
Deduct:
Favorable revenue settlement (one-time)
-
-
(38,700)
-
-
Revenue, as adjusted
2,017,041
$
2,025,367
$
2,249,315
$
2,237,018
$
2,117,894
$
Adjusted EBITDA as % of Adj. Revenue
55.3%
55.7%
53.9%
54.3%
54.2%
For the years ended December 31,
25

Reconciliation of Non-GAAP Financial Measures
Frontier (Legacy)
($ in 000's)
2005
2006
2007
2008
2009
Net income
202,375
$
344,555
$
216,514
$
184,274
$
123,181
$
Add back:
Depreciation and amortization
520,204
476,487
545,856
561,801
476,391
Income tax expense
75,270
136,479
128,014
106,496
69,928
Acquisition and integration costs
-
-
-
-
28,334
Pension expense (non-cash)
-
-
-
-
34,196
Stock based compensation
8,427
10,340
9,022
7,788
9,368
Subtract:
Cash paid (refunded) for income taxes
4,711
5,365
54,407
78,878
59,735
Pension Curtailment Gain (Non-Cash)
-
-
14,379
-
-
Other income (loss), net
(2,843)
60,271
(13,178)
20
(40,133)
Capital expenditures - business operations
259,448
268,806
306,203
288,264
230,966
Gain on sale of discontinued operations
1,167
71,635
-
-
-
Free cash flow
543,793
$
561,784
$
537,595
$
493,197
$
490,830
$
Revenue
2,017,041
$
2,025,367
$
2,288,015
$
2,237,018
$
2,117,894
$
Free cash flow as % of Revenue, as reported
27.0%
27.7%
23.5%
22.0%
23.2%
For the years ended December 31,
26

Reconciliation of Non-GAAP Financial Measures
Notes
1. Includes pension and other
postretirement benefit
(OPEB) expense of $22.2
million and $10.0 million, less
amounts
capitalized into the
cost of capital expenditures
of $2.0 million and $1.6
million, for the quarters
ended September 30, 2010
and 2009, respectively, and
pension/OPEB expense of
$40.3 million and $30.3
million, less amounts
capitalized
into the cost of
capital expenditures of $5.4
million and $5.5 million, for
the nine months ended
September 30, 2010 and
2009, respectively. Amounts
for the quarter and nine
months ended September
30, 2010 have also
been
reduced by $8.1 million and
$10.7 million, respectively,
for cash
pension
contributions.
2. Includes gain on debt
repurchases of $4.1 million
and $7.8 million for the
quarter and nine months
ended September 30, 2009,
respectively.
3. Excludes capital expenditures
for integration activities.
(Amounts in thousands)
2010
2009
2010
2009
Net Income to Free Cash Flow;
Net Cash Provided by Operating Activities
Net income
29,684
$
52,746
$
109,095
$
118,011
$
Add back:
Depreciation and amortization
339,894
103,123
540,917
373,499
Income tax expense
40,358
29,021
88,752
65,328
Acquisition and integration costs
78,533
3,706
125,867
14,457
Pension/OPEB costs (non-cash)
(1)
12,065
8,348
24,224
24,802
Stock based compensation
4,702
2,413
9,930
6,974
Subtract:
Cash paid for income taxes
4,847
19,495
4,042
59,953
Other income, net
(2)
2,315
5,373
17,069
14,038
Capital expenditures - Business operations
(3)
159,010
54,136
252,360
161,893
Free cash flow
339,064
120,353
625,314
367,187
Add back:
Deferred income taxes
3,856
2,778
10,092
11,097
Non-cash (gains)/losses, net
26,056
9,665
40,020
25,314
Other income, net
(2)
2,315
5,373
17,069
14,038
Cash paid for income taxes
4,847
19,495
4,042
59,953
Capital expenditures - Business operations
(3)
159,010
54,136
252,360
161,893
Subtract:
Changes in current assets and liabilities
(169,110)
8,021
(186,046)
37,300
Income tax expense
40,358
29,021
88,752
65,328
Acquisition and integration costs
78,533
3,706
125,867
14,457
Pension/OPEB costs (non-cash)
(1)
12,065
8,348
24,224
24,802
Stock based compensation
4,702
2,413
9,930
6,974
Net cash provided by operating activities
568,600
$
160,291
$
886,170
$
490,621
$
For the quarter ended September 30,
For the nine months ended September 30,
27

Reconciliation of Non-GAAP Financial Measures
Notes
1. Includes pension and other postretirement benefit (OPEB) expense of $22.2 million and $10.0 million, less amounts
capitalized into the cost of capital expenditures of $2.0
million and $1.6 million, for the quarters ended September 30, 2010 and 2009, respectively, and pension/OPEB expense of $40.3 million and $30.3 million, less amounts
capitalized into the cost
of capital expenditures of $5.4 million and $5.5 million, for the nine months ended September 30, 2010 and 2009, respectively. Amounts for the quarter
and nine months ended September 30, 2010 have also been reduced by $8.1 million and
$10.7 million, respectively, for cash pension contributions.
(Amounts in thousands)
Acquisition
Severance
Acquisition
and
Non-cash
and Early
and
Non-cash
Operating Cash Flow and
As
Integration
Pension/OPEB
Retirement
As
As
Integration
Pension/OPEB
As
Operating Cash Flow Margin
Reported
Costs
Costs
(1)
Costs
Adjusted
Reported
Costs
Costs
(1)
Adjusted
Operating Income
234,045
$
(78,533)
$
(12,065)
$
(6,945)
$
331,588
$
172,490
$
(3,706)
$
(8,348)
$
184,544
$
Add back:
Depreciation and
amortization
339,894
-
-
-
339,894
103,123
-
-
103,123
Operating cash flow
573,939
$
(78,533)
$
(12,065)
$
(6,945)
$
671,482
$
275,613
$
(3,706)
$
(8,348)
$
287,667
$
Revenue
1,402,968
$
1,402,968
$
526,816
$
526,816
$
Operating income margin
(Operating income divided
by revenue)
16.7%
23.6%
32.7%
35.0%
Operating cash flow margin
(Operating cash flow divided
by revenue)
40.9%
47.9%
52.3%
54.6%
Acquisition
Severance
Acquisition
Severance
and
Non-cash
and Early
and
Non-cash
and Early
Operating Cash Flow and
As
Integration
Pension/OPEB
Retirement
As
As
Intregration
Pension/OPEB
Retirement
As
Operating Cash Flow Margin
Reported
Costs
Costs
(1)
Costs
Adjusted
Reported
Costs
Costs
(1)
Costs
Adjusted
Operating Income
532,318
$
(125,867)
$
(24,224)
$
(7,658)
$
690,067
$
448,616
$
(14,457)
$
(24,802)
$
(2,567)
$
490,442
$
Add back:
Depreciation and
amortization
540,917
-
-
-
540,917
373,499
-
-
-
373,499
Operating cash flow
1,073,235
$
(125,867)
$
(24,224)
$
(7,658)
$
1,230,984
$
822,115
$
(14,457)
$
(24,802)
$
(2,567)
$
863,941
$
Revenue
2,438,954
$
2,438,954
$
1,596,914
$
1,596,914
$
Operating income margin
(Operating income divided
by revenue)
21.8%
28.3%
28.1%
30.7%
Operating cash flow margin
(Operating cash flow divided
by revenue)
44.0%
50.5%
51.5%
54.1%
For the quarter ended September 30, 2010
For the quarter ended September 30, 2009
For the nine months ended September 30, 2010
For the nine months ended September 30, 2009
28

Frontier Values
Put the customer first
Treat one another with respect
Keep our commitments; be accountable
Be ethical in all of our dealings
Take the initiative
Be team players
Be innovative; practice continuous improvement
Be active in our communities
Do it right the first time
Use resources wisely
Have a positive attitude
Use Frontier products and services
29

Frontier Communications Corp.
(NYSE: FTR)
Investor Relations
3 High Ridge Park
Stamford, CT 06905
203.614.4606
IR@FTR.com