Attached files
| file | filename |
|---|---|
| EX-23.1 - EX-23.1 - INNOVATIVE SOLUTIONS & SUPPORT INC | a2201359zex-23_1.htm |
| EX-21 - EX-21 - INNOVATIVE SOLUTIONS & SUPPORT INC | a2201359zex-21.htm |
| EX-31.1 - EX-31.1 - INNOVATIVE SOLUTIONS & SUPPORT INC | a2201359zex-31_1.htm |
| EX-31.2 - EX-31.2 - INNOVATIVE SOLUTIONS & SUPPORT INC | a2201359zex-31_2.htm |
| EX-32.1 - EX-32.1 - INNOVATIVE SOLUTIONS & SUPPORT INC | a2201359zex-32_1.htm |
Use these links to rapidly review the document
Table of Contents
INDEX TO CONSOLIDATED FINANCIAL STATEMENTS
UNITED STATES
SECURITIES AND EXCHANGE COMMISSION
Washington, D.C. 20549
FORM 10-K
ý |
ANNUAL REPORT PURSUANT TO SECTION 13 OR 15(d) OF THE SECURITIES EXCHANGE ACT OF 1934 |
|
For the fiscal year ended September 30, 2010 |
||
OR |
||
o |
TRANSITION REPORT PURSUANT TO SECTION 13 OR 15(d) OF THE SECURITIES EXCHANGE ACT OF 1934 |
|
For the transition period from to . |
||
Commission File No. 0-31157
INNOVATIVE SOLUTIONS AND SUPPORT, INC.
(Exact name of registrant as specified in its charter)
| Pennsylvania (State or other jurisdiction of incorporation) |
23-2507402 (IRS Employer Identification No.) |
|
720 Pennsylvania Drive, Exton, Pennsylvania (Address of principal executive offices) |
19341 (Zip Code) |
(610) 646-9800
(Registrant's telephone number, including area code)
Securities registered pursuant to Section 12(b) of the Act:
| Title of each class: | Name of each exchange on which registered | |
|---|---|---|
| Common Stock par value $.001 per share | The NASDAQ Stock Market, LLC |
Securities registered pursuant to Section 12(g) of the Act: None
Indicate by check mark if the registrant is a well-known seasoned issuer, as defined in Rule 405 of the Securities Act. Yes o No ý
Indicate by check mark if the registrant is not required to file reports pursuant to Section 13 or Section 15(d) of the Act Yes o No ý
Note: Checking the box above will not relieve any registrant required to file reports pursuant to Section 13 or section 15(d) of the Exchange Act from their obligations under those sections.
Indicate by check mark whether the registrant (1) has filed all reports required to be filed by Section 13 or 15(d) of the Securities Exchange Act of 1934 during the preceding 12 months (or for such shorter period that the registrant was required to file such reports), and (2) has been subject to such filing requirements for the past 90 days. Yes ý No o
Indicate by check mark whether the registrant has submitted electronically and posted on its corporate Web site, if any, every Interactive Data File required to be submitted and posted pursuant to Rule 405 of Regulation S-T (§ 232.405 of this chapter) during the preceding 12 months (or for such shorter period that the registrant was required to submit and post such files).). Yes o No o
Indicate by check mark if disclosure of delinquent filers pursuant to Item 405 of Regulation S-K (§229.405) is not contained herein, and will not be contained, to the best of the registrant's knowledge, in definitive proxy or information statements incorporated by reference in Part III of this Form 10-K or any amendment to this Form 10-K. ý
Indicate by check mark whether the registrant is a large accelerated filer, an accelerated filer, a non-accelerated filer, or a smaller reporting company. See the definitions of "large accelerated filer," "accelerated filer," "non-accelerated filer," and "smaller reporting company," in Rule 12b-2 of the Exchange Act. (Check one):
| Large accelerated filer o | Accelerated filer ý | Non-accelerated filer o (Do not check if a smaller reporting company) |
Smaller Reporting Company o |
Indicate by check mark whether the registrant is a shell company (as defined in Rule 12b-2 of the Act). Yes o No ý
The aggregate market value of the Registrant's common stock held by non-affiliates of the Registrant as of March 31, 2010 (the last business day of the registrant's most recently completed second quarter) was approximately $80.1 million. Shares of common stock held by each executive officer and director and by each person who owns 10% or more of our outstanding common stock have been excluded since such persons may be deemed affiliates. This determination of affiliate status is not necessarily a conclusive determination for other purposes.
As of December 04, 2010, there were 16,770,415 outstanding shares of the Registrant's Common Stock
Documents Incorporated by Reference
Portions of the Registrant's Proxy Statement for the 2011 Annual Meeting of Shareholders to be filed prior to January 28, 2010 are incorporated by reference into Part III of this Report. Such Proxy Statement, except for the parts therein which have been specifically incorporated by reference, shall not be deemed "filed" for the purposes of this Report on Form 10-K.
INNOVATIVE SOLUTIONS AND SUPPORT, INC.
2010 Annual Report on Form 10-K
1
This report contains forward looking statements within the meaning of Section 21E of the Securities Exchange Act of 1934. We have based these forward looking statements largely on our current expectations and projections about future events and trends affecting our business. In this report, the words "believe," "may," "will," "estimate," "continue," "anticipate," "intend," "forecast," "expect," "plan," "should," "is likely" and similar expressions, as they relate to our business or our management, are intended to identify forward looking statements, but they are not exclusive means of identifying them.
The forward looking statements in this report are only predictions and actual events or results may differ materially. In evaluating such statements, a number of risks, uncertainties and other factors could cause our actual results, performance, financial condition, cash flows, prospects and opportunities to differ materially from those expressed in, or implied by, the forward-looking statements. These risks, uncertainties and other factors include those set forth in Item 1A (Risk Factors) of this Annual Report on Form 10-K and the following factors:
- •
- the impact of general economic trends on our
business;
- •
- the deferral or termination of programs or contracts for convenience by
customers;
- •
- difficulties in developing and producing our COCKPIT/IP™ Flat Panel Display System or
other planned products or product enhancements;
- •
- market acceptance of our flat COCKPIT/IP™ Flat Panel Display System or other planned
products or product enhancements;
- •
- our ability to gain regulatory approval of our products in a timely
manner;
- •
- failure to retain/recruit key personnel;
- •
- continued market acceptance of our air data systems and
products;
- •
- the availability of government funding;
- •
- delays in receiving components from third party
suppliers;
- •
- the competitive environment;
- •
- the bankruptcy or insolvency of one or more key
customers;
- •
- new product offerings from competitors;
- •
- protection of intellectual property rights;
- •
- our ability to service the international
market;
- •
- potential future acquisitions; and
- •
- other factors disclosed from time to time in our filings with the Securities and Exchange Commission.
Except as expressly required by the federal securities laws, we undertake no obligation to publicly update or revise any forward looking statements, whether as a result of new information, future events or otherwise after the date of this report. Our results of operations in any past period should not be considered indicative of the results to be expected for future periods. Fluctuations in operating results may also result in fluctuations in the price of our common stock.
Investors should also be aware that while we do, from time to time, communicate with securities analysts, it is against our policy to disclose any material non-public information or other confidential commercial information. Accordingly, shareholders should not assume that we agree with any statement or report issued by any analyst irrespective of the content of the statement or report. Furthermore, we have a policy against issuing or confirming financial forecasts or projections issued by others. Thus, to the extent that reports issued by securities analysts contain any projections, forecasts or opinions, such reports are not the responsibility of Innovative Solutions and Support, Inc.
2
Overview
Innovative Solutions and Support, Inc. (the "Company," "IS&S" or "we") was founded in 1988. The Company designs, manufactures and sells Flat Panel Display Systems, Flight Information Computers and advanced monitoring systems to the Department of Defense (DoD), government agencies, defense contractors, commercial air transport carriers, original equipment manufacturers (OEMs), and corporate/general aviation markets. The Company is increasingly positioning itself as a system integrator; this capability provides the Company with the potential to generate more substantive orders over a broader product base. The Company has demonstrated an ability to incorporate added functionality such as electronic flight bags, charting and mapping systems into its Flat Panel Display System product line. Our strategy as both a manufacturer and integrator is to leverage the latest technologies developed for the personal computer and telecommunications industries into advanced, cost-effective solutions for both the aviation industry and DoD. We believe this approach, combined with our industry experience, enables us to develop high-quality products and systems, substantially reduce product time to market and achieve cost advantages over products offered by our competitors.
For several years the Company has been working with advances in technology to provide pilots increasing amounts of information that enhance both the safety and efficiency of flying. These advances have come together in the Company's COCKPIT/IP™ (Cockpit Information Portal or CIP) Flat Panel Display System product line that incorporates proprietary technology, low cost, reduced power consumption, decreased weight and increased functionality. The Company's Flat Panel Display System product line is suited to address market demand that we believe will be driven by regulatory mandates, new technologies and aging equipment on airplanes that have been in service for up to fifty years. We believe the transition to Flat Panel Display Systems as part of airplane retrofit requirements continues. This shift in regulatory and technological environment is illustrated by the dramatic increase in the number of Wide Area Augmentation System (WAAS) approach qualified airports. Aircraft equipped with our Flat Panel Display System product line will be qualified to land at such airports, which we believe will further increase the demand for our products.
In fiscal 2010, IS&S announced it received FAA certification for its Class 3 Electronic Charts and XM Satellite Weather upgrade to the AVIO NG integrated cockpit system of the Eclipse Aerospace, Inc. (EAI) EA500 Very Light Jet. IS&S commenced sales to EAI of the upgrade for installation on existing aircraft. IS&S introduced and began sales of increased functionality for its COCKPIT/IP™ Flat Panel Display System for application on the B757/B767 platform. The company also received additional Transport Canada Supplement Type Certificate (STC) certification for the B757 to further address the needs of that market.
In fiscal 2009, IS&S announced it began delivering a new product to the U.S. military: high resolution, 20 inch diagonal displays. These displays are used in the rear of the aircraft by tactical mission officers. The Company also initiated shipments of the Flat Panel Display System being marketed by Cessna as the "AdViz" cockpit upgrade solution for legacy Citation 500/501, 550/551, S550 and 560 aircraft. "AdViz" provides access to navigational aids such as XM Weather, navigation charts, remote radio tuning, and enhanced video all while improving reliability and reducing weight. IS&S received an amended Supplement Type Certificate (STC) on the PC-12 Flat Panel Display System for the WAAS program with Lateral and Vertical Precision Performance with a fully coupled auto-pilot. The company also received a Supplemental Type Certificate (STC) for RVSM Compliance of its PC-12 Flat Panel Display System in fiscal 2009.
In fiscal 2008, IS&S announced an addition to its COCKPITt/IPTM Flat Panel Display System product line: the IS&S Vantage COCKPIT/IP™ Flat Panel Display System, an open architecture flat
3
panel display system capable of interfacing with most third party avionics. The Vantage system can be retrofitted into a variety of airframes. The Company launched a Wide Area Augmentation System (WAAS) program with Lateral and Vertical Precision Performance with a fully coupled auto-pilot for its PC-12 COCKPIT/IP™ Flat Panel Display System. WAAS capability allows PC-12 operators to fly precision approaches at smaller airports. This capability is also available on other aircraft platforms. IS&S received amended Supplemental Type Certificates (STC) for the Boeing 757/767 platform from the Federal Aviation Administration (FAA) adding increased functionality to the COCKPIT/IP™ Flat Panel Display System. The Company increased the volume of work it is conducting for Homeland Security's Pilatus PC-12 and Lockheed Martin C-130 fleets.
Our Industry
A wide range of information, including airspeed and altitude, is critical for proper and safe operation of aircraft. With advances in technology, new types of information to assist pilots, such as satellite based weather and ground terrain maps, are becoming available for display in cockpits. We believe aircraft cockpits will increasingly become information centers, capable of delivering additional information that is either mandated by regulation or demanded by pilots to assist in the safe and efficient operation of aircraft.
There are three general types of flight data: aircraft heading and altitude information, flight critical aircraft control data and navigation data. Aircraft heading and altitude information includes aircraft speed, altitude and rates of ascent and descent. Flight critical aircraft control information includes engine data such as fuel and oil quantity and other engine measurements. Navigation data includes radio position, flight management, Global Positioning System (GPS) and alternative source information; which is information not originating on the aircraft, including weather depiction maps, GPS navigation and surface terrain maps. Air data calculations are based primarily on air pressure measurements derived from sensors on the aircraft. Engine data are determined by measuring various indices such as temperature, volume, revolutions per minute (RPM) and pressure within an aircraft's engines and other mechanical equipment. GPS and alternative source information is typically derived from satellites or equipment located on land and fed by satellite or radio signals to the aircraft. Pilots can then display this information in the cockpit for reference and enhanced position awareness.
Traditionally, flight data and other cockpit information were displayed on a series of separate analog instruments. In the early 1980s, digital displays using Cathode Ray Tubes (CRT) began to replace some individual analog instruments. The industry now offers high resolution color flat panels using Active Matrix Liquid Crystal Displays (AMLCD) to replace traditional analog instruments or CRT displays. We expect that the ability to display more information in a space efficient and customized platform will become increasingly important if additional information, such as weather depiction maps, traffic information and surface terrain maps, become mandated by regulation or demanded by pilots. Accordingly, we believe flat panel displays, which can integrate and display a "suite" of information, will increasingly replace individual instruments and CRTs as the method for delivering and ordering information displayed in cockpits.
Equipment data, such as engine and fuel related information, were traditionally displayed on conventional analog instruments. Engine and fuel instruments provide information on engine activity, including oil and hydraulic pressures and temperature. These instruments are clustered throughout an aircraft's cockpit. Engine and fuel instruments tend to be replaced more frequently than other instruments due to increased obsolescence problems and normal wear-and-tear. As information displayed by this instrumentation is vital for safe and efficient flight, aircraft operators continue to purchase individual conventional engine and fuel instruments to replace older or non-functioning instruments. Increasingly, operators are replacing their individual instrument clusters with integrated COCKPIT/IP™ Flat Panel Display Systems.
4
As the skies and airports are becoming more crowded, the aviation industry and regulators are concentrating on new technologies, procedures and regulations that allow more aircraft to operate in the skies and on the ground safely, efficiently and with less impact on the environment. These new technologies and procedures, such as traffic avoidance, ground awareness, increased precision of navigation and vertical position, runway incursion prevention and increased digital communication, will require innovation and intuitive methods to display situational awareness information for the pilots. The Company believes that flat panel displays are the best method to handle these and future requirements.
Strategy
Our objective is to become a leading supplier and integrator of cockpit information. We believe our industry experience and reputation, our technology and products and our business strategy provide a basis to achieve this objective. Key elements of our strategy include:
- •
- Retrofit focus. We believe offering cockpit avionics
upgrades for existing aircraft is of great interest in today's economic environment. Retrofitting an aircraft with the COCKPIT/IP™ Flat Panel Display System is cost effective compared to
acquiring a new aircraft and yet can provide the same functionality. When the economy returns to more robust levels, we believe lead times to acquire new aircraft will lengthen and demand for
retrofits will continue as operators update their existing fleets to provide needed lift capacity.
- •
- Establishing leadership in the flat panel display
market. We expect that over the next several years, many aircraft will be retrofitted with flat panel displays. Given the versatility,
visual appeal and lower cost of displaying a series of instruments and other flight relevant information on a single flat panel, we believe flat panel displays will increasingly replace individual
analog and digital instruments and CRTs. We also believe our COCKPIT/IP™ has significant benefits over flat panel displays currently offered by competitors, including lower cost, larger
size, reduced weight, enhanced viewing angles and a broad array of functions. Our patented and proprietary Integrity Checking Processor and Zooming features provide increased situational awareness,
reliability, performance and utility to the owner/operator. Accordingly, we believe these advantages will allow us to generate significant revenues from our COCKPIT/IP™ and increase market
share. Demand for new aircraft, FAA mandates to upgrade older aircraft and obsolescence issues on older aircraft will fuel this growth.
- •
- Continuing our engineering and product development
successes. We developed innovative products by combining our avionics, engineering and design expertise with commercially available
technologies, components and products from non-aviation applications, including the personal computer and telecommunications industries. Our COCKPIT/IP™ Flat Panel Display
System is an example of our ability to engineer products through the selective application of non-avionic technology. Our research and development expenses were $5.2 million,
$5.3 million and $10.3 million for fiscal years ended September 30, 2010, 2009 and 2008, respectively.
- •
- Maintaining our leadership in air data markets. We believe
we are one of the largest suppliers of air data products to the U.S. retrofit market. Significant demand remains to retrofit aging aircraft with newer, more advanced and more supportable air data
systems. Additionally upgrading business jets with higher performance engines is driving a need for more sophisticated air data products supplied by us.
- •
- Increasing our sales to the DoD, other government agencies, defense contractors, commercial air transport and corporate/general aviation markets. We strengthened efforts to diversify our sales to include all end user markets of the aviation industry, particularly legacy military aircraft programs and the commercial air transport market. This includes national and regional carriers and other fleet operators, the corporate/general aviation market, primarily through aircraft
5
- •
- Expanding our international presence. We plan to increase
our international sales by adding sales and marketing personnel and foreign offices. As large flat panel displays become more prevalent, we believe European and other international aircraft operators
and aircraft modification centers will accelerate retrofitting activities, thereby increasing demand for large flat panel displays. Presently, we are in the process of obtaining EASA approval for
European installations.
- •
- Growth through acquisitions or joint ventures. We may pursue strategic acquisitions or joint ventures as a means of growing our business with respect to technology, distribution, customers or products. We may seek to acquire developers or suppliers of complementary products, technology or information, or we may acquire suppliers of similar products as a means of increasing our product offerings and market share.
modification centers, and the OEM market. We continue to build a sales and marketing force dedicated to expanding our sales efforts to these markets while at the same time maintaining our position as a provider of avionics products for the DoD.
Our Products
Our current line of products includes:
Flat Panel Display Systems
In recent years color flat panel displays have been introduced into aircraft cockpits. Flat Panel Displays are Liquid Crystal Display (LCD) screens that can replicate the display of one or a suite of analog or digital displays on one screen. Like other instrumentation, flat panel displays can be installed in new aircraft or used to replace existing displays in aircraft already in use. LCDs are also used for security monitoring on-board aircraft and as tactical workstations on military aircraft. The flat panel product line also presents numerous advantages for presentation of engine performance data. During fiscal 2010, 2009 and 2008 we derived 68%, 75% and 77% respectively, of our total revenues from sales of Flat Panel Display Systems.
We developed a Flat Panel Display System that can replace conventional analog and digital displays currently used in a cockpit and can display additional information that is not now commonly displayed in the cockpit. Our COCKPIT/IP™ is capable of displaying nearly all types of air data, engine and fuel data, altitude, heading and navigational data, and alternative source information. As technology and information delivery systems further develop, additional information, such as surface terrain maps and data link messaging, will be displayed in the cockpit. We designed our COCKPIT/IP™ to be capable of displaying information generated from a variety of sources, including our Reduced Vertical Separation Minimum (RVSM) air data system, engine and fuel instrumentation, and third-party data and information products.
From time to time customers may order one or more flat panel display systems customized to their particular requirements. Depending on the amount of non-recurring engineering effort needed to accommodate the customized request, the Company has and will continue to charge a fee for added development cost. This will result in revenue to the Company that is characterized as Engineering- modification and development on the income statement. Consistent with this approach, engineering cost incurred in the performance of customizing the flat panel display system will be allocated from Operating expenses (Research and development) to Cost of Sales (Engineering—modification and development) and will be included in the Company's gross profit calculations.
6
Air Data Systems and Components
Our air data products calculate and display various measures such as aircraft speed, altitude and rate of ascent and descent. The functionality of our air data systems use advanced sensors to gather air pressure data and use customized algorithms to interpret data, thus allowing the system to more accurately calculate altitude. During fiscal 2010, 2009, and 2008 we derived 32%, 25%, and 23%, respectively, of our total revenues from sales of air data systems and related products.
We sell individual components as well as partial and complete air data systems. Our components and systems include:
- •
- digital air data computers, which calculate various air data parameters such as altitude, airspeed, vertical speed, angle
of attack and other information derived from the measure of air pressure;
- •
- integrated air data computers and display units, which calculate and convey air data information;
- •
- altitude displays, which convey aircraft altitude measurements;
- •
- airspeed displays, which convey various types of airspeed measurements including vertical airspeed and rates of ascent and
descent; and
- •
- altitude alerters, which allow the pilot to select a desired cruising altitude that the aircraft will reach and maintain, and also provide warnings to pilots when an unacceptable deviation occurs.
We develop, manufacture and market engine and fuel displays. Our solid-state multifunction displays convey information with respect to fuel and oil levels and engine activity, such as oil and hydraulic pressure and temperature. This instrumentation includes individual and multiple displays clustered throughout an aircraft's cockpit. Our displays can be used in conjunction with our own engine and fuel data equipment or that of other manufacturers.
Engine and fuel displays are found in all aircraft and are vital to safe and proper aircraft flight. In addition, accurate conveyance of engine and fuel information is critical for monitoring of engine stress and maintenance of engine parts. Engine and fuel displays tend to be replaced more frequently than other displays and have remained largely unchanged since their introduction due to their low cost, standard design and universal use.
We believe our air data engine and fuel displays are extremely reliable, and we have designed them to be programmable to adapt easily without major modification to most modern aircraft. Our products have been installed on C-130H, DC-9, DC-10, P-3, F-16 and A-10 aircraft.
Customers
Our customers include the United States government (including DoD and Homeland Security), ABX Air, American Airlines, The Boeing Company, Bombardier Aerospace, Cessna Aircraft Corporation, Eclipse Aerospace, Inc., Federal Express Corporation, L-3 Communication, Lockheed Martin Corporation, Raytheon, Rockwell Collins, Marshalls of Cambridge, United Kingdom, and the Department of National Defense, Canada, among others.
Retrofit Market
Historically, a majority of our sales have come from the retrofit market. Among other reasons, we have pursued the retrofit market because of its continued rapid growth in response to the increasing need to support the world's aging fleet of aircraft. In fiscal 2010, our two largest customers, Lockheed Martin and FedEx, accounted for 11% and 10% of our total revenue, respectively. In fiscal year 2009, our two largest customers, American Airlines and DoD, accounted for 24% and 11% of our total revenue, respectively. In fiscal year 2008 our two largest customers, Eclipse Aviation, Inc. and FedEx, accounted for 42%, and 10% of our total revenue, respectively.
7
Updating an individual aircraft's existing electronics equipment has become increasingly common as new technology makes existing instrumentation outdated while an aircraft is still structurally and mechanically sound. Retrofitting an aircraft is generally a substantially less expensive alternative to purchasing a new aircraft. We expect our main customers in the retrofit market to be:
- •
- the DoD and defense contractors;
- •
- aircraft operators; and
- •
- aircraft modification centers.
Department of Defense and Defense Contractors. We sell our products directly to the DoD as well as to domestic and international defense contractors for end use on military aircraft retrofit programs. DoD programs generally take one of two forms, a subcontract with a prime government contractor, such as Boeing, Lockheed Martin or Rockwell Collins, or a direct contract with the appropriate government agency such as the U.S. Air Force to satisfy its requirement for replacing Central Air Data Computers on its fleet of A-10 aircraft. The government's desire for cost-effective retrofitting of aircraft has led it to purchase commercial off-the-shelf equipment rather than requiring development of specially designed products, which are usually more costly and take longer to develop. These contracts tend to be on arms length commercial terms, although some termination and other provisions of government contracts described under "Government Regulation" below are typically applicable to these contracts. Each government agency or general contractor retains the right to terminate a contract at any time at its convenience. Upon such alteration or termination, we typically would be entitled to an equitable adjustment to the contract price so that we would receive the purchase price for already delivered items and reimbursement for allowable costs incurred.
Aircraft Operators. We also sell our products to aircraft operators, including commercial airlines, cargo carriers and business and general aviation. Our products are used mostly in retrofitting aircraft owned or operated by these customers, which generally retrofit and maintain their aircraft themselves. Our commercial fleet customers include or have included, among others, American Airlines, ABX Air, Air Canada, Federal Express and Northwest Airlines. We sell these customers a range of products from flat panel display systems to air data systems.
Aircraft Modification Centers. The primary retrofit market for private and corporate jets is through aircraft modification centers, which repair and retrofit private aircraft in a manner similar to the way auto mechanics service a person's car. We have established relationships with a number of aircraft modification centers throughout the United States. These modification centers essentially act as distribution outlets for our products. We believe our air data systems and related components are being promoted by aircraft modification centers to update older or outdated equipment. Our large modification center customers include Bombardier Learjet, Western Aircraft, Aeromech, Star Aviation, Duncan Aviation, and Raytheon Aircraft Services.
OEM Market
In fiscal 2008 the Company suspended work on the Eclipse VLJ program and Eclipse Aviation Inc. filed for Chapter 11 Bankruptcy. New owners have resurrected the former Eclipse Aviation, Inc. and formed a new entity named Eclipse Aerospace, Inc to purchase Eclipse Aviation, Inc's assets. At the 2010 National Business Aviation Association (NBAA) convention, it was announced that Sikorsky Aircraft intends to invest in Eclipse Aviation, Inc. In fiscal 2010 the Company resumed deliveries to Eclipse Aerospace, Inc. of equipment and functionality to support upgrades to their existing fleet of approximately 250 aircraft. The Company believes that Eclipse aspires to begin new aircraft production.
We also market our products to other original equipment manufacturers, particularly manufacturers of corporate and private jets as well as to contractors manufacturing military jets.
8
Customers of our products have included Bombardier, Gulfstream, Boeing, Raytheon, Piaggio and Lockheed Martin.
Backlog
As of September 30, 2010 and 2009, our backlog was $32.3 million and $34.1 million, respectively. The year over year decrease of $1.8 million or 5.3% was the result of $29.9 million in new business offset by $25.3 million of recognized revenue and $6.4 million of order de-bookings. The preponderance of the de-bookings relate to one customer and is due to the requirement to rebid the project in accordance with the procurement procedures. Air Data product backlog as of September 30, 2010 decreased by $2.4 million from September 30, 2009; while Flat Panel Display Systems backlog as of September 30, 2010 increased by $0.6 million from September 30, 2009.
Sales and Marketing
We focus our sales efforts on passenger and cargo carrying aircraft operators, general aviation operators, aircraft modification centers, the DoD, DoD contractors and OEMs. We continually evaluate our sales and marketing efforts with respect to these focus areas and, where appropriate, have made use of third-party sales representatives who receive compensation through commissions based on performance.
We believe our ability to provide prompt and effective repair and upgrade service is critical to our marketing efforts. As part of our customer service program, we offer a 24-hour hotline that customers can call for product repair or upgrade concerns. We employ field service engineers to service our equipment and, depending on the service required, we may either dispatch a service crew to make necessary repairs or request the customer return the product to us for repairs or upgrades at our facility. In the event repairs or upgrades are required to be made at our facility, we provide spare products for use by our customers during the repair time. Our in-house turnaround times for both repairs and upgrades average less than 30 days. Before returning our products to customers, all repaired or upgraded products are retested for airworthiness.
In connection with our customer service program, we typically provide customers with a two-year warranty on new products. We also offer customers extended warranties of varying terms for additional fees.
The majority of the Company's sales, operating results and identifiable assets are in the United States. In fiscal year 2010, 2009, and 2008 net sales outside the United States amounted to $2.8 million, $4.4 million and $1.7 million, respectively.
Government Regulation
The manufacture and installation of our products in aircraft owned and operated in the United States is governed by FAA regulations. We maintain a production facility that is FAA certified. The most significant of the product and installation regulations focus on Technical Standard Order Authorizations and Supplemental Type Certificates. These certifications set forth the minimum performance standards that a certain type of equipment should meet. As required, we deliver our product in accordance with FAA regulations.
Sales of our products to European or other non-U.S. owners of aircraft also typically require approval of the European Aviation Safety Agency (EASA), the European counterpart of the FAA, or another appropriate governmental agency. EASA certification requirements for manufacturing and installation of our products in European owned aircraft mirror FAA regulations. Much like the FAA certification process, the EASA has established a process for granting European Certifications.
9
In addition to product related regulations, we are also subject to U.S. Government procurement regulations with respect to sale of our products to government entities or government contractors. These regulations dictate the manner in which products may be sold to the government and set forth other requirements that must be met in order to do business with or on behalf of government entities. For example, the government agency or general contractor may alter the price, quantity or delivery schedule of our products. In addition, the government agency or general contractor retains the right to terminate the contract at any time at its convenience. Upon such alteration or termination, we would typically be entitled to an equitable adjustment to the contract price so that we would receive the purchase price for already delivered items and reimbursement for allowable costs incurred.
Manufacturing, Assembly and Materials Acquisition
Our manufacturing activities consist primarily of assembling and testing components and subassemblies and integrating them into a fully tested finished system. We believe this method allows us to achieve relatively flexible manufacturing capacity while minimizing expenses. We typically purchase components for our products from third-party suppliers and assemble them in a clean room environment to reduce impurities and improve the performance of our products. Many of the components we purchase are standard products, although certain parts are made to our specifications.
When appropriate, we enter into long-term supply agreements and use our relationships with long-term suppliers to improve product quality and availability and to reduce delivery times and product costs. In addition, we continually identify alternative suppliers for important component parts. Using component parts from new suppliers in our products generally requires FAA certification of the entire finished product if the newly sourced component varies significantly from our original drawings and specifications. To date, we have not experienced any significant delays in delivery of our products caused by the inability to obtain either component parts or FAA approval of products incorporating new component parts.
Quality Assurance
Product quality is of vital importance to our customers, and we have taken steps to enhance the overall quality of our products. We are ISO 9001 and AS 9100B certified. ISO 9001 and AS 9100B standards are an international consensus on effective management practices with the goal of ensuring a company can consistently deliver its products and related services in a manner that meets or exceeds customer quality requirements. These standards allow us to represent to customers that we maintain high quality industry standards in the education of our employees and the design and manufacture of our products. In addition, our products undergo extensive quality control testing prior to being delivered to customers. As part of our quality assurance procedures, we maintain detailed records of test results and our quality control processes.
Our Competition
The market for our products is highly competitive and characterized by several industry niches in which a number of manufacturers specialize. Our competitors vary in size and resources, and substantially all of our competitors are much larger than we are and have substantially greater resources than we do. With respect to air data systems and related products, our principal competitors include Honeywell International Inc., Rockwell Collins, Inc., Thales, and GE Aviation. With respect to flat panel displays, our principal competitors currently include Honeywell, Rockwell Collins, Inc., L-3 Communications and GE Aviation. However, because the flat panel display industry is a new and evolving market, as the demand for flat panel displays increases we may face competition in this area from additional companies in the future.
10
We believe the principal competitive factors in markets we serve are cost, development cycle time, responsiveness to customer preferences, product quality, technology and reliability. We believe our significant and long-standing customer relationships reflect our ability to compete favorably with respect to these factors.
Intellectual Property and Proprietary Rights
We rely on patents to protect our proprietary technology. As of September 30, 2010 the Company holds 22 U.S. patents and has 2 U.S. patent applications pending relating to our technology. In addition, we hold 27 international patents and have 24 international patent applications pending. Certain of these patents and patent applications cover technology relating to air data measurement systems and calibration techniques while others cover technology relating to flat panel display systems and other aspects of our COCKPIT/IP™ solution. While we believe these patents have significant value in protecting our technology, we believe also that the innovative skill, technical expertise and know-how of our personnel in applying the technology reflected in our patents would be difficult, costly and time consuming to reproduce.
While we are not aware of any pending lawsuits against us alleging patent infringement or the violation of other intellectual property rights, we cannot be certain such infringement claims will not be asserted against us in the future.
Our Employees
As of September 30, 2010, we had 133 employees, 45 were in engineering, research and development, 55 in manufacturing and assembly operations, 8 in quality and 25 in selling and general administrative positions.
Our future success depends on our ability to attract, train and retain highly qualified personnel. We plan to hire additional personnel, including, in particular, sales and marketing personnel, during the next twelve months. Competition for such qualified personnel is intense and we may not be able to attract, train and retain highly qualified personnel in the future. Our employees are not represented by a labor union.
Executive Officers of the Registrant
The following is a list of our executive officers, their ages and their positions:
Name
|
Age | Position | |||
|---|---|---|---|---|---|
| Geoffrey S. M. Hedrick | 68 | Chairman of the Board and Chief Executive Officer | |||
| Roman G. Ptakowski | 62 | President | |||
| Ronald C. Albrecht | 65 | Chief Financial Officer | |||
Geoffrey S. M. Hedrick was the Chief Executive Officer from the time he founded the Company in February 1988 through June 4, 2007 and was reappointed as Chief Executive Officer on September 8, 2008. He has also been Chairman of the Board since 1997. Prior to founding IS&S, Mr. Hedrick served as President and Chief Executive Officer of Smiths Industries North American Aerospace Companies. He also founded Harowe Systems, Inc. in 1971, which was subsequently acquired by Smiths Industries. Mr. Hedrick has over 35 years of experience in the avionics industry, and he holds a number of patents in the electronics, optoelectric, electromagnetic, aerospace and contamination-control fields.
Roman G. Ptakowski has been President since March 2003. Prior to that, Mr. Ptakowski served as a Group Vice President and General Manager and, before that, as a Vice President of Sales and Marketing at B/E Aerospace, Inc. Previously, Mr. Ptakowski held a number of positions with increasing responsibility within ASEA Brown Boveri Power T&D Company, Inc. There, he was General Manager
11
of the Protective Relay Division before leaving to join B/E Aerospace, Inc. Mr. Ptakowski received a B.S. in Electrical Engineering from New York University and a MBA from Duke University.
Ronald C. Albrecht has been Chief Financial Officer since August 2010. Prior to joining the Company, Mr. Albrecht served in a number of executive positions, both operational and financial, with Smiths Aerospace (UK) and later GE Aviation Systems (GEAS) following the GEAS purchase of Smiths Aerospace in 2007. Recently he has served as Vice President and General Manager of Smiths and later GEAS' Electro Mechanical Business. Prior to his operational roles, he served as Chief Financial Officer of Smiths Aerospace, based in London and has substantial mergers & acquisition and strategic planning experience. Mr. Albrecht received a B.A. in Government and Economics from Dartmouth College and an MBA in Finance from Stanford University. He is a Certified Public Accountant (California/Inactive).
Other
The public may read and copy any materials filed by us with the SEC at the SEC's public reference room located at 100 F Street, N.E., Washington, D.C. 20549. The public may obtain information about the operation of the SEC's public reference rooms by calling the SEC at 1-800-SEC-0330. The SEC also maintains a website at http://www.sec.gov that contains reports, proxy and information statements and other information about issuers that file electronically with the SEC.
Our primary website is http://www.innovative-ss.com. We make available, free of charge, at our corporate website our annual report on Form 10-K, quarterly reports on Form 10-Q, current reports on Form 8-K and amendments to those as reasonably practicable after we electronically file such material with, or furnish it to, the SEC. The information on our web site is not incorporated as part of this annual report.
12
You should carefully consider the risks, uncertainties and other factors described below, in addition to the other information set forth in this report, because they could materially and adversely affect our business, operating results, financial condition, cash flows and prospects as well as adversely affect the value of an investment in our common stock.
Risks Related to Our Business
The recent global recession and credit tightening could adversely affect us.
The recent global recession and continued concern regarding credit availability, including failures of financial institutions, has initiated unprecedented government intervention in the U.S., Europe and other regions of the world. If these concerns continue or worsen, risks to us include:
- •
- Declines in revenues and profitability from reduced orders, payment delays or other factors caused by the economic
problems of customers;
- •
- reprioritization of government spending away from defense programs in which we participate;
- •
- adverse impacts on our access to credit sources; and
- •
- supply problems associated with any financial constraints faced by our vendors.
A portion of our sales have been, and we expect will continue to be, to defense contractors or government agencies in connection with government aircraft retrofit or original equipment manufacturing contracts. Sales to government contractors and government agencies could decline as a result of DoD spending cuts and general budgetary constraints which may become more frequent as tax revenues decline due to the weakening of general economic conditions.
The loss of a key customer or a significant deterioration in the financial condition of a key customer could have a material adverse effect on our results of operations.
Our revenue is concentrated with a limited number of customers. During fiscal year 2010 we derived 48% of revenue from five customers. We derived 56% of revenue during fiscal year 2009 from five customers. We derived 72% of revenue during fiscal year 2008 from five customers. We expect a relatively small number of customers to account for a majority of our revenues for the foreseeable future. As a result of our concentrated customer base, a loss of one or more of these customers or a dispute or litigation with one of these key customers could have a material adverse effect on our revenue and results of operations. In addition, we continually monitor and evaluate the credit status of our customers and attempt to adjust sales terms as appropriate. Despite these efforts, a significant deterioration in the financial condition or bankruptcy filing of a key customer could have a material adverse effect on our business, results of operations and financial condition.
On November 25, 2008, Eclipse Aviation, Inc. filed a voluntary petition for relief under Chapter 11 of the U.S. Bankruptcy Code. New owners have resurrected the former Eclipse Aviation, Inc. and formed a new entity named Eclipse Aerospace, Inc. to purchase Eclipse Aviation, Inc.'s assets. In fiscal 2010 the Company began deliveries to Eclipse Aerospace, Inc. of equipment and functionality to support upgrades to their existing fleet of approximately 250 aircraft. The Company has not received and does not anticipate receiving any payment on its pre-petition claims. Additionally, claims have been made against the Company to try to recover amounts paid to the Company during the 90 days preceding the filing of the bankruptcy petition. See Item 3, Legal Proceedings.
13
Growth of our customer base could be limited by delays or difficulties in completing development and introduction of our planned products or product enhancements. If we fail to enhance existing products or develop and achieve market acceptance for flat panel displays and other new products that meet customer requirements, our business will be adversely affected.
Although historically a substantial majority of our revenue has come from sales of air data systems and related products, we currently spend a large portion of our research and development efforts in developing and marketing our flat panel display systems and complementary products. Our ability to grow and diversify our operations through introduction and sale of new products is dependent upon our success in continuing product development and engineering activities as well as our sales and marketing efforts and our ability to obtain requisite approvals to sell such products. Our sales growth will also depend in part on market acceptance of and demand for our CIP and future products. We cannot be certain we will be able to develop, introduce or market our CIP or other new products or product enhancements in a timely or cost-effective manner or that any new products will receive market acceptance or necessary regulatory approval.
During fiscal 2010, 2009, and 2008 we derived 68%, 75% and 77% of our total revenue from the sale of flat panel display systems, respectively. We expect revenues from our air data products will decline as a percent of total sales as peak demand associated with the FAA's Reduced Vertical Separation Minimum (RVSM) mandate has been accommodated. Our revenues and profitability will decrease if new products such as our Flat Panel Display Systems do not receive market acceptance or if our existing customers do not continue to incorporate our products in their retrofitting or manufacturing of aircraft. In seeking new customers, it may be difficult for our products to displace competing products. Accordingly, we cannot be assured that potential customers will accept our products or that existing customers will not abandon them.
Our revenue and operating results may vary significantly from quarter to quarter, which may cause our stock price to decline.
Our revenue and operating results may vary significantly from quarter to quarter due to a number of factors, including:
- •
- demand for our products and/or delivery schedule changes by our customers;
- •
- capital expenditure budgets of aircraft owners and operators and appropriation cycles of the U.S. government;
- •
- changes in the use of our products, including air data systems and flat panel displays;
- •
- delays in introducing or obtaining government approval for new products;
- •
- new product introductions by competitors;
- •
- changes in our pricing policies or pricing policies of our competitors, and
- •
- costs related to possible acquisition of technologies or businesses.
We plan to expand our sales and marketing operations and fund levels of product development proportionate to our total sales. As a result, a delay in generating revenues could cause significant variations in our operating results from quarter to quarter.
Contracts can be terminated by customers at any time and therefore may not result in sales.
Our retrofit projects are generally pursuant to either a direct contract with a customer or a subcontract with a general contractor to a customer (including government agencies). Each contract, including our contracts with government agencies, includes various terms and conditions that impose certain requirements on us, including the ability of the customer or general contractor to alter the
14
price, quantity or delivery schedule of our products. In addition, the customer or general contractor typically retains the right to terminate the contract at any time at its convenience. Upon alteration or termination of these contracts, we could be entitled to an equitable adjustment to the contract price so we may receive the purchase price for items we have delivered and reimbursement for allowable costs we have incurred. Accordingly, because these contracts can be terminated, we cannot be assured that our retrofit backlog will result in sales.
We depend on key personnel to manage our business effectively, and if we are unable to retain our key employees, our ability to compete could be harmed.
Our success depends on the efforts, abilities and expertise of our senior management and other key personnel. There can be no assurance we will be able to retain such employees, the loss of some of whom could hurt our ability to execute our business strategy. We intend to continue hiring key management and sales and marketing personnel. In spite of a U.S. unemployment rate of 9.6% as of October, 2010, competition for such personnel is intense, and we may not be able to attract or retain additional qualified personnel.
Our future success will depend in part on our ability to implement and improve our operational, administrative and financial systems and controls and to manage, train and expand our employee base. We cannot be assured that after giving effect to our cost containment initiatives that our current and planned personnel levels, systems, procedures and controls will be adequate to support our current and future customer base. If inadequate, we may not be able to exploit existing and potential market opportunities. Any delays or difficulties we encounter could impair our ability to attract new customers or maintain our relationships with existing customers.
We rely on third party suppliers for components of our products, and any interruption in supply of these components could hinder our ability to deliver our products.
Our manufacturing process consists primarily of assembling components purchased from our supply chain. These suppliers may not continue to be available to us. If we are unable to maintain relationships with key third party suppliers, the development and distribution of our products could be delayed until equivalent components can be obtained and integrated into our products. In addition, substitution of certain components from other manufacturers may require product redesign, FAA or other approval, which could delay our ability to ship products.
Our competition includes other manufacturers of air data systems and flight information displays against whom we may not be able to compete successfully.
The markets for our products are intensely competitive and subject to rapid technological change. Our competitors include Honeywell International Inc., Rockwell Collins, Inc., Thales, GE Aviation and L-3 Communications. Substantially all of our competitors have significantly greater financial, technical and human resources than we do. In addition, our competitors have much greater experience in and resources for marketing their products. As a result, our competitors may be able to respond more quickly to new or emerging technologies and customer preferences or devote greater resources to development, promotion and sale of their products than we can. Our competitors may also have greater name recognition and more extensive customer bases that they can use to their benefit. This competition could result in price reductions, fewer customer orders, reduced gross margins and loss of market share.
15
Our success depends on our ability to protect our proprietary rights against potential risk of infringement. If we are unable to protect and enforce our intellectual property rights, we may be unable to compete effectively.
Our success and ability to compete will depend in part on our ability to obtain and maintain patent or other protection for our technology and products, both in the United States and abroad. In addition, we must operate without infringing the proprietary rights of others.
We currently hold 22 U.S. patents and have 2 U.S. patent applications pending. In addition, we hold 27 international patents and have 24 international patent applications pending. We cannot be certain that patents will be issued on any of our present or future applications. In addition, our existing patents or any future patents may not adequately protect our technology if they are not broad enough, are successfully challenged or other entities are able to develop competing methods without violating our patents. If we are not successful in protecting our intellectual property, competitors could begin to offer products that incorporate our technology. Patent protection involves complex legal and factual questions and, therefore, is highly uncertain, and litigation relating to intellectual property is often very time consuming and expensive. If a successful claim of patent infringement were made against us or we are unable to develop non-infringing technology or license the infringed or similar technology on a timely and cost-effective basis, we might not be able to produce and sell some of our products. In addition, we have incurred in the past and may continue in the future to incur significant legal and other costs in defense of our intellectual property.
Potential lenders may have suffered losses related to the weakening economy and may not be able to provide us with needed financing.
Potential lenders may have suffered losses related to their lending and other financial relationships, especially because of the general weakening of the national economy and increased financial instability of many borrowers. As a result, lenders may become insolvent or tighten their lending standards, which could make it more difficult for us to borrow or to obtain new financing on favorable terms or at all, if we determine that it would be in our interests to obtain such financing, whether to finance acquisitions or otherwise. Our financial condition and results of operations could be adversely affected if we were unable to obtain cost-effective financing in the future.
We may not be able to identify or complete acquisitions or we may consummate an acquisition that adversely affects our operating results.
One of our strategies is to acquire businesses or technologies that complement our existing operations. We have limited experience in acquiring businesses or technologies. There can be no assurance we will be able to acquire or profitably manage acquisitions or successfully integrate them into our operations. Furthermore, certain risks are inherent in pursuing acquisitions, such as the demands of management's time and attention and combining disparate company cultures and facilities. Acquisitions may have an adverse effect on our operating results, particularly in quarters immediately following the consummation of such transactions, as we integrate operations of acquired businesses into our operations. Once integrated, acquisitions may not perform as expected.
Risks Related to Our Industry
If we are unable to respond to rapid technological change, our products could become obsolete and our reputation could suffer.
Future generations of air data systems, engine and fuel displays, and flat panel displays embodying new technologies or new industry standards could render our products obsolete. The market for
16
aviation products is subject to rapid technological change, new product introductions, changes in customer preferences and evolving industry standards. Our future success will depend on our ability to:
- •
- adapt to rapidly changing technologies;
- •
- adapt our products to evolving industry standards; and
- •
- develop and introduce a variety of new products and product enhancements to address the increasingly sophisticated needs of our customers.
Our future success will also depend on our developing high quality, cost-effective products and enhancements to our products that satisfy needs of customers and on our introducing these new technologies to the marketplace in a timely manner. If we fail to modify or improve our products in response to evolving industry standards, our products could rapidly become obsolete.
Our products are currently subject to direct regulation by the FAA, its European counterpart, the European Aviation Safety Administration (EASA), and other comparable organizations. Our products, as they relate to aircraft applications, must be approved by the FAA, EASA or other comparable organizations before they can be used in an aircraft. To be certified, we must demonstrate that our products are accurate and able to maintain certain levels of repeatability over time. Although certification requirements of the FAA and the EASA are substantially similar, there is no formal reciprocity between the two systems. Accordingly, even though some of our products are FAA-approved, we may need to obtain approval from the EASA or other appropriate organizations to have them certified for installation outside the United States.
Significant delay in receiving certification for newly developed products or enhancements to our products or losing certification for our existing products could result in lost sales or delays in sales. Furthermore, adoption of additional regulations or product standards, as well as changes to existing product standards, could require us to change our products and underlying technology. We cannot assure you that we will receive regulatory approval on a timely basis or at all.
Because our products utilize sophisticated technology and are deployed in complex aircraft cockpit environments, problems with these products may arise that could seriously harm our reputation for quality assurance and our business.
Our products use complex system designs and components that may contain errors, omissions or defects, particularly when we incorporate new technologies into our products or we release new versions or enhancements of our products. Despite our quality assurance process, errors, omissions or defects could occur in our current products, in new products or in new versions or enhancements of existing products after commercial shipment has begun. We may be required to redesign or recall those products or pay damages. Such an event could result in the following:
- •
- delay or loss of revenues;
- •
- cancellation of customer contracts;
- •
- diversion of development resources;
- •
- damage to our reputation;
- •
- increased service and warranty costs; or
- •
- litigation costs.
Although we currently carry product liability insurance, this insurance may not be adequate to cover our losses in the event of a product liability claim. Moreover, we may not be able to maintain such insurance in the future.
17
We have limited experience in marketing and distributing our products internationally.
We expect to derive an increasing amount of our revenues from sales outside the United States, particularly in Europe. There are certain risks inherent in doing business on an international basis, such as:
- •
- differing regulatory requirements for products being installed in aircraft;
- •
- legal uncertainty regarding liability;
- •
- tariffs, trade barriers, and other regulatory barriers;
- •
- political and economic instability;
- •
- changes in diplomatic and trade relationships;
- •
- potentially adverse tax consequences;
- •
- the impact of recessions in economies outside the United States; and
- •
- variance and unexpected changes in local laws and regulations.
Currently, all of our international sales are denominated in U.S. dollars. An increase in the dollar's value compared to other currencies could make our products less competitive in foreign markets. In the future, we may be required to conduct sales in local currencies, exposing us to changes in exchange rates that could adversely affect our operating results.
Item 1B. Unresolved Staff Comments.
None
In fiscal 2001 we purchased 7.5 acres of land in the Eagleview Corporate Park in Exton, Pennsylvania. Shortly thereafter the Company constructed a 44,800 square foot design, manufacturing and office facility on this site. Land development approval allows for expansion of up to 20,400 square feet. This would provide for a 65,200 square foot facility. The construction was principally funded with a Chester County, Pennsylvania, Industrial Revenue Bond. The building served as security for the Industrial Revenue Bond until the bond was repaid in August 2009.
In the ordinary course of business, we are at times subject to various legal proceedings and claims. We do not believe any such matters that are currently pending will have a material adverse effect on our results of operations or financial position.
On November 18, 2010, Jeoffrey L. Burtch, the Chapter 7 Trustee for AE Liquidation, Inc. (formerly Eclipse Aviation Corporation), filed avoidance actions against IS&S on behalf of AE Liquidation, Inc. for the avoidance of seven payments totaling $321,095 as allegedly preferential transfers paid to the Company during the 90 days preceding the filing of the bankruptcy petition of Eclipse Aviation Corporation on November 25, 2008. The Company believes it has meritorious defenses to these avoidance actions, intends to vigorously defend against them, and believes that the likelihood of the avoidance actions prevailing is remote. Accordingly, the Company has not accrued any loss reserve related to this claim.
On January 17, 2007 the Company filed suit in the Court of Common Pleas for Delaware County, Pennsylvania against Strathman Associates, a former software consultant for IS&S, alleging that Strathman had improperly used IS&S trade secret and proprietary information in assisting J2 and Kollsman in developing the J2/Kollsman Air Data Computer. The case is ongoing.
18
Item 5. Market for the Registrant's Common Equity, Related Stockholder Matters and Issuer Repurchases of Equity Securities.
Our common stock has been traded on the Nasdaq Stock Market, LLC under the symbol "ISSC" since our initial public offering on August 4, 2000. The following table lists the high and low per share sale prices for our common stock for the periods indicated:
| |
Fiscal Year 2010 |
Fiscal Year 2009 |
|||||||||||
|---|---|---|---|---|---|---|---|---|---|---|---|---|---|
Period
|
High | Low | High | Low | |||||||||
First Quarter |
$ | 5.37 | $ | 4.17 | $ | 7.65 | $ | 3.02 | |||||
Second Quarter |
7.14 | 3.81 | 6.06 | 2.52 | |||||||||
Third Quarter |
6.72 | 4.32 | 5.90 | 4.02 | |||||||||
Fourth Quarter |
6.28 | 2.12 | 6.00 | 3.34 | |||||||||
On December 06, 2010, there were 15 holders of record of the shares of outstanding common stock. This does not reflect beneficial shareholders who hold their stock in nominee or "street" name through brokerage firms.
No dividends were paid in fiscal 2009 or fiscal 2010. The Company does not expect to declare or pay cash dividends on our common stock in the near future. We intend to retain any earnings to finance the growth of our business.
On February 16, 2010, the Company's Board of Directors approved the Company's repurchase program to acquire up to 1,000,000 shares of the Company's outstanding Common Stock. Under the repurchase program, the Company may purchase shares of its common stock through open market transactions or in privately negotiated block purchases or other private transactions (either solicited or unsolicited). The timing and amount of repurchase transactions under this program will depend on market conditions and corporate and regulatory considerations. The plan will expire on February 16, 2011, unless extended by the Board of Directors; however, the program may be discontinued or suspended at any time. During the year ended September 30, 2010 the Company purchased 12,000 shares of common stock under the program at a cost of $48,630, or an average market price of $4.03 per share, financed with available cash. The following table sets forth the purchases made under this new plan for each month since the extension date through September 30, 2010:
Period
|
Total Number of Shares Purchased |
Average Price Paid per Share |
Total Number of Shares Purchased as Part of Publicly Announced Plans or Programs |
Number of Shares that May Yet Be Purchased Under the Program |
|||||||||
|---|---|---|---|---|---|---|---|---|---|---|---|---|---|
January, 2010 |
— | — | — | — | |||||||||
February, 2010 |
4,100 | $ | 4.16 | 4,100 | 995,900 | ||||||||
March, 2010 |
1,100 | 4.20 | 1,100 | 994,800 | |||||||||
April, 2010 |
— | — | — | 994,800 | |||||||||
May, 2010 |
— | — | — | 994,800 | |||||||||
June, 2010 |
— | — | — | 994,800 | |||||||||
July, 2010 |
6,800 | 3.93 | 6,800 | 988,000 | |||||||||
August, 2010 |
— | — | — | 988,000 | |||||||||
September, 2010 |
— | — | — | 988,000 | |||||||||
|
12,000 | 4.03 | 12,000 | ||||||||||
19
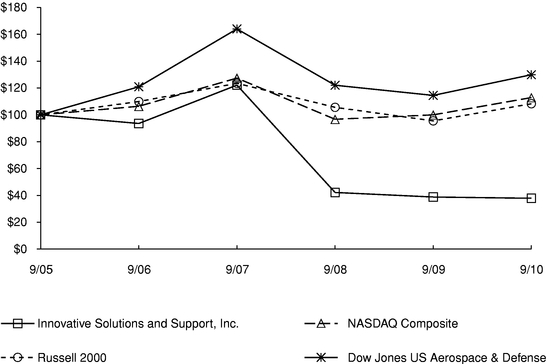
COMPARISON OF 5 YEAR CUMULATIVE TOTAL RETURN*
Among Innovative Solutions and Support, Inc., The NASDAQ Composite Index,
The Russell 2000 Index And Dow Jones US Aerospace & Defense
Index
| |
9/05 | 9/06 | 9/07 | 9/08 | 9/09 | 9/10 | |||||||||||||
|---|---|---|---|---|---|---|---|---|---|---|---|---|---|---|---|---|---|---|---|
Innovative Solutions and Support, Inc. |
100.00 | 93.56 | 122.15 | 42.18 | 38.78 | 37.85 | |||||||||||||
NASDAQ Composite |
100.00 | 106.39 | 127.37 | 96.70 | 100.00 | 112.86 | |||||||||||||
Russell 2000 |
100.00 | 109.92 | 123.49 | 105.60 | 95.52 | 108.27 | |||||||||||||
Dow Jones US Aerospace & Defense |
100.00 | 120.91 | 164.01 | 122.06 | 114.49 | 129.88 | |||||||||||||
- *
- $100
invested on 9/30/05 in stock or index—including reinvestment of dividends.
Fiscal year ending September 30.
The graph above shows the cumulative shareholder return on $100 invested at the market close on September 30, 2005 through and including September 30, 2010, the last trading day before the end of our most recently completed fiscal year, with the cumulative total return over the same time period of the same amount invested in the Nasdaq, Composite Index, the Russell 2000 Index and the Dow Jones US Aerospace & Defense Index.
20
Item 6. Selected Consolidated Financial Data.
The following tables present portions of our consolidated financial statements. The following selected consolidated financial data set forth below should be read together with "Management's Discussion and Analysis of Financial Condition and Results of Operations" and our consolidated financial statements and related notes to our financial statements appearing elsewhere herein. The selected statement of operations data for the fiscal years ended September 30, 2010, 2009 and 2008 and the balance sheet data as of September 30, 2010 and 2009 are derived from our audited consolidated financial statements included elsewhere in this Annual Report on Form 10-K. The selected statements of operations data for the fiscal years ended September 30, 2007 and 2006 and the balance sheet data as of September 30, 2008, 2007 and 2006 are derived from our audited consolidated financial statements that are not included in this Annual Report on Form 10-K.
| |
Fiscal year ended September 30, | ||||||||||||||||
|---|---|---|---|---|---|---|---|---|---|---|---|---|---|---|---|---|---|
| |
2010 | 2009 | 2008 | 2007 | 2006 | ||||||||||||
Statement of Operations Data: |
|||||||||||||||||
Net Sales |
25,257,323 | 36,734,150 | 30,533,311 | 18,348,128 | 16,721,967 | ||||||||||||
Cost of sales |
11,520,029 | 17,895,984 | 20,551,857 | 14,154,425 | 8,631,761 | ||||||||||||
Gross profit |
13,737,294 | 18,838,166 | 9,981,454 | 4,193,703 | 8,090,206 | ||||||||||||
Research and development |
5,234,240 | 5,313,007 | 10,304,279 | 5,180,360 | 6,749,426 | ||||||||||||
Selling, general and administrative |
8,099,587 | 8,647,506 | 22,306,016 | 15,840,255 | 9,863,758 | ||||||||||||
Asset Impairment |
— | — | 2,475,000 | — | — | ||||||||||||
Total operating expenses |
13,333,827 | 13,960,513 | 35,085,295 | 21,020,615 | 16,613,184 | ||||||||||||
Operating income (loss) |
403,467 | 4,877,653 | (25,103,841 | ) | (16,826,912 | ) | (8,522,978 | ) | |||||||||
Interest income, net |
185,815 | 315,765 | 1,415,732 | 2,886,602 | 3,091,986 | ||||||||||||
Other income |
50,000 | 50,099 | 17,300,000 | — | — | ||||||||||||
Income (loss) before income taxes |
639,282 | 5,243,517 | (6,388,109 | ) | (13,940,310 | ) | (5,430,992 | ) | |||||||||
Income tax expense (benefit), net |
(109,094 | ) | 234,856 | 1,509,139 | (5,095,022 | ) | (2,548,600 | ) | |||||||||
Net income (loss) |
748,376 | 5,008,661 | (7,897,248 | ) | (8,845,288 | ) | (2,882,392 | ) | |||||||||
Net income (loss) per common share: |
|||||||||||||||||
Basic |
0.04 | 0.30 | (0.47 | ) | (0.52 | ) | (0.17 | ) | |||||||||
Diluted |
0.04 | 0.30 | (0.47 | ) | (0.52 | ) | (0.17 | ) | |||||||||
Weighted average shares outstanding: |
|||||||||||||||||
Basic |
16,751,528 | 16,745,379 | 16,887,049 | 16,865,028 | 17,388,524 | ||||||||||||
Diluted |
16,777,886 | 16,760,500 | 16,887,049 | 16,865,028 | 17,388,524 | ||||||||||||
Cash dividends declared per Common Share |
— |
1.00 |
— |
— |
|||||||||||||
| |
As of September 30, | |||||||||||||||
|---|---|---|---|---|---|---|---|---|---|---|---|---|---|---|---|---|
| |
2010 | 2009 | 2008 | 2007 | 2006 | |||||||||||
Balance Sheet Data: |
||||||||||||||||
Cash and cash equivalents |
40,916,346 | 35,565,694 | 35,031,932 | 49,151,078 | 62,984,829 | |||||||||||
Working capital |
46,311,056 | 44,624,477 | 42,491,253 | 62,453,234 | 73,751,866 | |||||||||||
Total assets |
57,590,522 | 57,536,012 | 59,896,714 | 84,585,785 | 87,232,880 | |||||||||||
Debt and capital lease obligations, less current portion |
15,560 | 26,991 | 4,362,725 | 4,382,542 | 4,339,587 | |||||||||||
Total shareholders' equity |
53,468,037 | 52,398,742 | 46,804,126 | 70,733,779 | 78,201,353 | |||||||||||
21
Item 7. Management's Discussion and Analysis of Financial Condition and Results of Operations.
The following discussion and analysis should be read in conjunction with "Selected Consolidated Financial Data" and our financial statements and related notes included in this report.
Overview
Innovative Solutions and Support was founded in 1988. The Company designs, develops, manufactures and sells flight information computers, large flat-panel displays, and advanced monitoring systems that measure and display critical flight information, including data relative to aircraft separation, airspeed, altitude as well as engine and fuel data measurements.
Our sales are derived from the sale of our products to the retrofit market and, to a lesser extent, original equipment manufacturers ("OEMs"). Our customers include the United States Department of Defense ("DoD") and their commercial contractors, aircraft operators, aircraft modification centers and various OEMs. Although we occasionally sell our products directly to the DoD, we have sold our products primarily to commercial customers for end use in DoD programs. Sales to defense contractors are on commercial terms, although some of the termination and other provisions of government contracts are applicable to these contracts.
Our cost of sales related to product sales is comprised of material and components purchased through our supplier base and direct in-house assembly labor and overhead costs. Many components we use in assembling our products are standard, although certain parts are manufactured to meet our specifications. The overhead portion of cost of sales is primarily comprised of salaries and benefits, building occupancy, supplies, and outside service costs related to our production, purchasing, material control and quality departments, and warranty costs.
Our cost of sales related to Engineering—modification and development ("EMD") is comprised of engineering labor, consulting services, and other cost associated with specific design and development projects that are billable under specific customer agreements.
We intend to continue investing in development of new products that complement our current product offerings and will expense associated costs as they are incurred.
Our selling, general and administrative expenses consist of sales, marketing, business development, professional services, and salaries and benefits for executive and administrative personnel as well as facility costs, recruiting, legal, accounting, and other general corporate expenses.
We sell our products to agencies of the United States and foreign governments, aircraft operators, aircraft modification centers and original equipment manufacturers. Our customers have been and may continue to be affected by the recent adverse economic conditions both in the United States and abroad. Such conditions may cause our customers to curtail or delay spending on both new and existing aircraft. Factors that can impact general economic conditions and the level of spending by our customers include but are not limited to general levels of consumer spending, increases in fuel and energy costs, conditions in the real estate and mortgage markets, labor and healthcare costs, access to credit, consumer confidence and other macroeconomic factors affecting spending behavior. In addition, future spending by government agencies may be further reduced due to declining tax revenues associated with this economic downturn. If our customers curtail or delay their spending or are forced to declare bankruptcy or liquidate their operations due to recent adverse economic conditions, our revenues and results of operations will be adversely affected. However, we believe that in a declining economic environment a customer that may have otherwise elected to purchase newly manufactured aircraft will instead be interested in retrofitting existing aircraft as a cost effective alternative, which will create a market opportunity for our products.
22
The Company experienced significant reductions of headcount costs in fiscal 2010 and 2009, as a result of a 52 person workforce reduction that was implemented in late fiscal 2008. The reductions affected most departments in the Company with the majority coming from the engineering department.
Results of Operations
The following table sets forth statement of operations data expressed as a percentage of total net sales for the fiscal years indicated (some items may not add due to rounding):
| |
Twelve Months Ending September 30, |
|||||||||||
|---|---|---|---|---|---|---|---|---|---|---|---|---|
| |
2010 | 2009 | 2008 | |||||||||
Net sales: |
||||||||||||
Product |
92.6 | % | 86.7 | % | 85.0 | % | ||||||
Engineering—modification and development |
7.4 | % | 13.3 | % | 15.0 | % | ||||||
Total net sales |
100.0 | % | 100.0 | % | 100.0 | % | ||||||
Cost of sales |
||||||||||||
Product |
42.5 | % | 45.2 | % | 57.6 | % | ||||||
Engineering—modification and development |
3.1 | % | 3.5 | % | 9.7 | % | ||||||
Total cost of sales |
45.6 | % | 48.7 | % | 67.3 | % | ||||||
Gross profit |
54.4 | % | 51.3 | % | 32.7 | % | ||||||
Operating expenses: |
||||||||||||
Research and development |
20.7 | % | 14.5 | % | 33.7 | % | ||||||
Selling, general and administrative |
32.1 | % | 23.5 | % | 73.1 | % | ||||||
Asset impairment |
0.0 | % | 0.0 | % | 8.1 | % | ||||||
Total operating expenses |
52.8 | % | 38.0 | % | 114.9 | % | ||||||
Operating income (loss) |
1.6 | % | 13.3 | % | (82.2) | % | ||||||
Interest income |
0.7 |
% |
1.1 |
% |
5.2 |
% |
||||||
Interest (expense) |
(0.0 | )% | (0.2 | )% | (0.5 | )% | ||||||
Other income |
0.2 | % | 0.1 | % | 56.7 | % | ||||||
Income (loss) before income taxes |
2.5 | % | 14.3 | % | (20.9 | )% | ||||||
Income tax expense (benefit) |
-0.4 |
% |
0.6 |
% |
4.9 |
% |
||||||
Net income (loss) |
3.0 | % | 13.6 | % | (25.9 | )% | ||||||
Fiscal Year Ended September 30, 2010 Compared to Fiscal Year Ended September 30, 2009
Net sales. Net sales decreased $11.5 million, or 31.2%, to $25.3 million for fiscal 2010 from $36.7 million for fiscal 2009. For fiscal 2010, product sales decreased $8.5 million and EMD sales decreased $3.0 million from fiscal 2009. The decrease in product sales was primarily driven by customer delays in delivery schedules for backlog orders, while the decrease in EMD sales was primarily driven by a reduction in volume and a delayed contract award.
Cost of sales. Cost of sales decreased $6.4 million or 35.6%, to $11.5 million, or 45.6% of net sales for fiscal 2010 from $17.9 million, or 48.7% of net sales for fiscal 2009. The decrease was primarily driven by a decrease in variable production costs associated with reduced sales volume in fiscal 2010 as compared to fiscal 2009, resumed sales associated with the Eclipse E500 aircraft that had de minimis direct costs and a continued focus on cost reduction.
23
Research and development. Research and development expense decreased $0.1 million or 1.5% to $5.2 million or 20.7% of net sales for fiscal 2010—from $5.3 million or 14.5% of net sales for fiscal 2009. This reduction is consistent with the Company's strategy to target a percentage of total costs in a given period, for the purposes of continued investment in on-going research and development of our core products.
Selling, general, and administrative. Selling, general and administrative expenses decreased $0.5 million, or 6.3%, to $8.1 million, or 32.1% of net sales for fiscal 2010 from $8.6 million or 23.5% of net sales for fiscal 2009. The decrease was primarily due to a reduction in compensation expenses associated with the forfeiture of non-vested stock options of $0.3 million related to the resignation of the former CFO and of $0.1 million on the elimination of amortization expense related to an Industrial Development Bond that was retired in August, 2009.
Interest (income) expense, net. Net interest income decreased $0.1 million or 41.1%, to $0.2 million for fiscal 2010 from $0.3 million for fiscal 2009 which was primarily the result of lower interest rates during fiscal 2010 compared to fiscal 2009, partially offset by the elimination of interest related to an Industrial Development Bond that was retired in August, 2009.
Other income. Other income was $0.1 million for both fiscal 2010 and fiscal 2009.
Income taxes. The income tax benefit for fiscal year ended September 30, 2010 was $0.1 million compared to an income tax expense of $0.2 million for the fiscal year ended September 30, 2009. The decrease in the amount of tax from a tax expense to a tax benefit was primarily attributable to the decrease in pre-tax income.
Effective tax rates for the years ended September 30, 2010 and 2009 were (17.1)% and 4.5%, respectively. The effective tax rate differs from the statutory rate for the year ended September 30, 2010 due to: 1) reversal of certain deductible temporary differences in the fiscal year ended September 30, 2010 which at September 30, 2009 were offset by a valuation allowance, as such reversals generated current tax benefits in the fiscal year ended September 30, 2010, and 2) decreases in uncertain tax positions due to the lapse of applicable statutes of limitations.
The effective tax rate differs from the statutory rate for the year ended September 30, 2009 due to: 1) reversal of certain deductible temporary differences in the fiscal year ended September 30, 2009, which at September 30, 2008 were offset by a valuation allowance, as such reversals generated current tax benefits in the fiscal year ended September 30, 2009, and 2) utilization of research and experimentation tax credits.
Net income (loss). As a result of the factors described above, our net income for fiscal 2010 was $0.7 million. The net income for fiscal 2009 was $5.0 million. On a fully diluted basis, the net income per share of $0.04 for fiscal 2010 compared to a net income per share of $0.30 for fiscal 2009.
Fiscal Year Ended September 30, 2009 Compared to Fiscal Year Ended September 30, 2008
Net sales. Net sales increased $6.2 million, or 20.3%, to $36.7 million for fiscal 2009 from $30.5 for fiscal 2008. For fiscal 2009, product sales increased $5.9 million and EMD sales increased $0.3 million from fiscal 2008. The increase in product sales was primarily related to growth in flat panel display associated with B757/B767 and C130 aircraft, partially offset by sales declines associated with the Eclipse 500 aircraft ($12.8 million in 2008 and $0.1 million in 2009), which resulted due to the bankruptcy of Eclipse on November 25, 2008. Excluding Eclipse sales from fiscal 2008, the Company's net sales would have increased $19.0 million or 107% for fiscal 2009. The increase in EMD sales was primarily a result of a new agreement with the DoD.
24
Cost of sales. Cost of sales decreased $2.7 million or 12.9%, to $17.9 million, or 48.7% of net sales for fiscal 2009 from $20.6 million, or 67% of net sales for fiscal 2008. The decrease was primarily driven by inventory reserves in fiscal 2008 of approximately $1.9 million, associated with suspension of activity related to the Eclipse program in anticipation of Eclipse's bankruptcy, which occurred on November 25, 2008, the financial impact of this event did not repeat in fiscal 2009. Decrease was also attributable to lower employee related expenses as a result of the cost containment efforts described at the end of the Overview section of Management's Discussion and Analysis of Financial Condition and Results of Operations, partially offset by the cost of sales associated with net sales growth. Cost of sales for fiscal 2009 included reserves of approximately $0.5 million for warranty and costs associated with product support program initiated by the Company.
Research and development. Research and development expense decreased $5.0 million or 48% to $5.3 million or 15% of net sales for fiscal 2009; from $10.3 million or 34% of net sales for fiscal 2008. The decreased expense in fiscal 2009 was primarily due to a reduction in headcount related costs and a decrease in costs from third-party subcontractors of $3.3 million and $3.5 million, respectively, offset by an increase in deferred EMD costs of $1.8 million.
Selling, general, and administrative. Selling, general and administrative expenses decreased $13.7 million, or 61.2%, to $8.6 million, or 23.5% of net sales for fiscal 2009 from $22.3 million or 73% of net sales for fiscal 2008. The decrease was primarily due to a reduction in professional fees, specifically legal costs incurred in connection with litigation related to protecting its intellectual property, and a decrease in headcount related costs of $5.7 million and $2.1 million respectively.
Interest (income) expense, net. Net interest income decreased $1.1 million or 78%, to $0.3 million for fiscal 2009 from $1.4 million for fiscal 2008 which was primarily the result of lower interest rates during fiscal 2009 compared to fiscal 2008.
Other income. Other income was $0.1 million for fiscal 2009 as compared to $17.3 million for fiscal 2008. Other income in fiscal 2008 was driven by the receipt of $17.0 million in proceeds related to the settlement of the Company's trade secret litigation and $0.3 million related to short-swing profit disgorgement proceeds from a shareholder that occurred in 2008.
Income taxes. Income tax expense for the fiscal year ended September 30, 2009 was $0.2 million compared to $1.5 million for the fiscal year ended September 30, 2008. The decrease in the amount of income tax expense is primarily the result of the reversal of certain deductible temporary differences in the fiscal year ended September 30, 2009 and the establishment of a full valuation allowance on the deferred tax assets during the fiscal year ended September 30, 2008.
The effective tax rates for the years ended September 30, 2009 and 2008 were 4.5% and (23.6)%, respectively. The effective tax rate differs from the statutory rate for the year ended September 30, 2009 due to: 1) reversal of certain deductible temporary differences in the fiscal year ended September 30, 2009, which at September 30, 2008 were offset by a valuation allowance, as such reversals generated current tax benefits in the fiscal year ended September 30, 2009, and 2) utilization of research and experimentation tax credits. The effective tax rate differs from the statutory rate for the year ended September 30, 2008 due to the establishment of a full valuation allowance on net deferred tax assets during the quarter ended March 31, 2008.
Net income (loss). As a result of the factors described above, our net income for fiscal 2009 was $5.0 million. The net loss for fiscal 2008 was ($7.9 million). On a fully diluted basis, the net income per share of $0.30 for fiscal 2009 compares to a loss per share of ($0.47) for fiscal 2008.
Related-Party Transactions:
The Company incurred legal fees of $138,000, $105,000 and $128,000 with a law firm whose partners are shareholders of the Company for the years ended September 30, 2010, 2009 and 2008 respectively. The fees paid and services rendered were comparable with fees paid to other unrelated law firms.
25
For the years ended September 30, 2010, 2009 and 2008, respectively, the Company incurred service fees of $25,000, $0 and $67,000 with a commercial graphics firm controlled by an individual who is married to a shareholder and daughter of the Company's Chairman and Chief Executive Officer.
Liquidity and Capital Resources
The following table highlights key financial measurements of the Company:
| |
September 30, 2010 |
September 30, 2009 |
|||||
|---|---|---|---|---|---|---|---|
Cash and cash equivalents |
$ | 40,916,346 | $ | 35,565,694 | |||
Accounts receivable, net |
2,529,976 | 6,188,706 | |||||
Current assets |
49,607,834 | 48,792,791 | |||||
Current liabilities |
3,296,778 | 4,168,314 | |||||
Deferred revenue |
166,621 | 225,648 | |||||
Total debt and other non-current liabilities(1) |
826,927 | 918,072 | |||||
Quick ratio(2) |
13.18 | 10.02 | |||||
Current ratio(3) |
15.05 | 11.71 | |||||
| |
Twelve Months Ending September 30, |
|||||||
|---|---|---|---|---|---|---|---|---|
| |
2010 | 2009 | ||||||
Cash flow activites: |
||||||||
Net cash provided by operating activites |
$ | 5,600,467 | $ | 5,319,549 | ||||
Net cash (used in) investing activites |
(189,790 | ) | (331,895 | ) | ||||
Net cash (used in) financing activites |
(60,025 | ) | (4,453,892 | ) | ||||
- (1)
- Excludes
deferred revenue, includes current portion of capitalized lease obligations
- (2)
- Calculated
as: (Cash and cash equivalents and Accounts receivable, net) divided by Current liabilities
- (3)
- Calculated as: Current assets divided by Current liabilities
Our primary source of liquidity was cash flow provided by operating activities. We require cash principally to finance inventory, payroll and accounts receivable.
Cash flow provided by operating activities was $5.6 million in fiscal 2010 as compared to $5.3 million from operating activities in fiscal 2009, despite the $4.3 million decline in net income in fiscal 2010. The $0.3 million difference was primarily attributable to decrease in accounts receivable and a continued focus on inventory reduction, offset by a decrease in accounts payable, accrued expenses and income taxes payable. The Company had positive operating cash flow of $4.2 million for fiscal 2008 primarily as a result of a change in the provision for losses on accounts receivable, an increase to excess and obsolete expense, an asset impairment charge and a decrease in prepaid expenses and other assets, partially offset by the net operating loss realized.
Cash used in investing activities was $0.2 million, $0.3 million and $0.6 million for fiscal year 2010, 2009 and 2008 respectively, and consisted of spending for licensing fees, production equipment and laboratory test equipment.
Cash used in financing activities was $0.1 million for fiscal year 2010 and consisted primarily of the repurchase of 12,000 shares of common stock for $0.1 million. Cash used in financing activities was $4.5 million for fiscal year 2009 and consisted primarily of the repayment in full of the Industrial Development Bond of $4.3 million and the repurchase of 25,000 shares of common stock for
26
$0.1 million. Cash used in financing activities was $17.7 million for fiscal year 2008 and consisted primarily of a special dividend of $16.7 million paid along with share repurchases of $1.0 million.
To accommodate future growth, in 2001 the Company purchased 7.5 acres of land in the Eagleview Corporate Park, Exton, Pennsylvania, and built a 44,800 square foot facility that is expandable to 65,200 square feet. Both the land and building cost approximate $6.5 million, $4.3 million of which was funded through an Industrial Development Bond (IDB) and the remainder from cash from operations. The Company retired the IDB during August 2009, for $4.3 million.
Our future capital requirements depend on numerous factors, including market acceptance of our products (in particular flat panel display systems), the timing and rate of expansion of our business, acquisitions, joint ventures and other factors. We have experienced increases in our expenditures since our inception consistent with growth in our operations, personnel, and product line and we anticipate that our operations and expenditures will continue to increase in the foreseeable future. We believe our cash and cash equivalents will provide sufficient capital to fund our operations for at least the next twelve months. However, we may need to raise additional funds through public or private financing or other arrangements if our business grows more rapidly than we anticipate. Potential lenders may have suffered losses related to their lending and other financial relationships, especially because of the general weakening of the national economy and increased financial instability of many borrowers. As a result, lenders may become insolvent or tighten their lending standards, which could make it more difficult for us to borrow or to obtain new financing on favorable terms or at all. Our financial condition and results of operations would be adversely affected if we were unable to obtain cost-effective financing in the future. Further, we may develop and introduce new or enhanced products, respond to competitive pressures, invest in or acquire businesses or technologies or respond to unanticipated requirements or developments.
Our contractual obligations as of September 30, 2010 mature as follows:
| |
Payments Due by Period | |||||||||||||||
|---|---|---|---|---|---|---|---|---|---|---|---|---|---|---|---|---|
Contractual Obligations(1)
|
Total | Less than 1 Year |
1 - 3 Years | 4 - 5 Years | After 5 Years |
|||||||||||
Capital Leases, including interest |
25,468 | 9,908 | 15,560 | — | — | |||||||||||
Purchase obligations(2) |
1,663,136 | 1,502,709 | 160,427 | — | — | |||||||||||
|
1,688,604 | 1,512,617 | 175,987 | — | — | |||||||||||
- (1)
- Since
we are unable to reasonably estimate the timing of ultimate payment, the amounts set forth above do not include any payments that may be made related
to uncertain tax positions including interest.
- (2)
- A "purchase obligation" is defined as an agreement to purchase goods or services that is enforceable and legally binding on the company and that specifies all significant terms, including: fixed or minimum quantities to be purchased; fixed, minimum or variable price provisions; and the approximate timing of the transaction. These amounts are primarily comprised of open purchase order commitments entered in the ordinary course of business with vendors and subcontractors pertaining to fulfillment of our current order backlog.
Off-Balance Sheet Arrangements
The Company has no off-balance sheet arrangements.
27
Inflation
We do not believe inflation had a material effect on our financial position or results of operations during the past three years, however, we cannot predict future effects of inflation.
Critical Accounting Policies
The preparation of financial statements in conformity with accounting principles generally accepted in the United States of America requires management to make estimates and assumptions that affect reported amounts of assets and liabilities, disclosure of contingent assets and liabilities at the date of the financial statements and the reported amount of revenues and expenses during the reporting period. The Company's most critical accounting policies are revenue recognition, income taxes, inventory valuation, share based compensation, and warranty reserves.
Revenue recognition
The Company enters into sales arrangements with customers that, in general, provide for the Company to design, develop, manufacture and deliver flight information computers, large flat-panel displays, and advanced monitoring systems that measure and display critical flight information, including data relative to aircraft separation, airspeed, and altitude, as well as engine and fuel data measurements. Additionally, during fiscal year ended September 30, 2010 the Company began delivery in accordance with a new arrangement with a new customer to provide, among other deliverables, functional upgrades to the Company's flight information computers and flat-panel displays. The Company's sales arrangements may include multiple deliverables as defined in FASB ASC Topic 605-25 "Multiple-Element Arrangements" (ASC Topic 605-25) which typically include design and engineering services and the production and delivery of the flat panel display and related components.
Multiple Element Arrangements—
The Company identifies all goods and/or services that are to be delivered separately under such a sales arrangement and allocates revenue to each deliverable (if more than one) based on that deliverable's selling price. The Company then considers the appropriate recognition method for each deliverable; deliverables under multiple element arrangements are typically purchased engineering and design services and product sales and/or the sale of functional upgrades. The Company's multiple element arrangements can typically include defined design and development activities and/or functional upgrades, along with product sales.
The Company utilizes the selling price hierarchy that has been established by FASB Accounting Standards Update (ASU) 2009-13, "Multiple-Deliverable Revenue Arrangements—a consensus of the FASB Emerging Issues Task Force" (ASU 2009-13), which requires that the selling price for each deliverable be based on vendor-specific objective evidence if available, third-party evidence if vendor-specific objective evidence is not available, or estimated selling price if neither vendor-specific objective evidence nor third-party evidence is available. To the extent that an arrangement includes a deliverable for which estimated selling price is used, the Company's determines the best estimate of selling price by applying the same pricing policies and methodologies that would be used to determine the price to sell the deliverable on a standalone basis.
To the extent that an arrangement contains software elements that are essential to the functionality of tangible products sold in the arrangement, the Company recognizes revenue for the deliverables in accordance with the guidance included in FASB Accounting Standards Update 2009-14, "Revenue Arrangements That Include Software Elements", ASU 2009-13 and FASB ASC Topic 605, "Revenue Recognition" (ASC Topic 605).
28
To the extent that an arrangement contains defined design and development activities as an identified deliverable in addition to products (resulting in a multiple element arrangement), the Company recognizes as Engineering—Modification and Development ("EMD") revenue amounts earned during the design and development phase of the contract following the guidance included in FASB ASC Topic 605-35, "Construction-Type and Production-Type Contracts" (ASC Topic 605-35). To the extent that multiple element arrangements include product sales, revenue is generally recognized once revenue recognition criteria for the product deliverable has been met based on the provisions of FASB ASC Topic 605, "Revenue Recognition"(ASC Topic 605).
To the extent that an arrangement contains software components, which include functional upgrades, that are sold on a standalone basis and the Company has deemed outside the scope the exception defined by ASU 2009-14, the Company recognizes software revenue in accordance with ASC Topic 985, "Software" (ASC Topic 985).
Single Element Arrangements—
Products—
To the extent that a single element arrangement provides for product sales and repairs, revenue is generally recognized once revenue recognition criteria for the product deliverable has been met based on the provisions of ASC Topic 605. The Company also receives orders for existing equipment and parts. Revenue from the sale of such products is generally recognized upon shipment to the customer.
The Company offers its customers extended warranties for additional fees. These warranty sales are recorded as deferred revenue and recognized as sales on a straight-line basis over the warranty period.
Engineering Services—
The Company also may enter into service arrangements to perform specified design and development services related to its products. The Company recognizes revenue from these arrangements as EMD revenue, following the guidance included in ASC Topic 605-35. The Company considers the nature of these service arrangements (including term, size of contract, level of effort) when determining the appropriate accounting treatment for a particular contract. The Company recognizes the revenue from these contracts using either the percentage-of-completion method or completed contract method of accounting.
The Company records revenue relating to these contracts using the percentage-of-completion method when the Company determines that progress toward completion is reasonable and reliably estimable and the contract is long-term in nature; the Company uses the completed contract method for all others.
Income taxes
Income taxes are recorded in accordance with FASB ASC Topic 740, "Income Taxes" (ASC Topic 740), which principally utilizes a balance sheet approach to provide for income taxes. Under this method, the Company recognizes deferred tax assets and liabilities for temporary differences between the financial reporting basis and the tax basis of the Company's assets, liabilities and expected benefits of utilizing net operating loss and tax credit carry-forwards. The impact on deferred taxes of changes in tax rates and laws, if any, applied to the years during which temporary differences are expected to be settled, are reflected in the consolidated financial statements in the period of enactment.
Deferred tax assets are reduced by valuation allowances if, based on the consideration of all available evidence, it is more likely than not that some portion of the deferred tax asset will not be
29
realized. Significant weight is given to evidence that can be objectively verified. The Company evaluates deferred income taxes on a quarterly basis to determine if valuation allowances are required by considering available evidence. Deferred tax assets are realized by having sufficient future taxable income to allow the related tax benefits to reduce taxes otherwise payable. The sources of taxable income that may be available to realize the benefit of deferred tax assets are future reversals of existing taxable temporary differences, future taxable income exclusive of reversing temporary differences and carry-forwards, taxable income in carry-back years and tax planning strategies that are both prudent and feasible. In the event the Company were to determine that it would be able to realize its deferred tax assets in the future in excess of the net recorded amount, an adjustment would be made to the valuation allowance which would reduce the provision for income taxes.
The accounting for uncertainty in income taxes requires a more likely than not threshold for financial statement recognition and measurement of tax positions taken or expected to be taken in a tax return. The Company records a liability for the difference between the (i) benefit recognized and measured for financial statement purposes and (ii) the tax position taken or expected to be taken on our tax return. To the extent that our assessment of such tax positions changes, the change in estimate is recorded in the period in which the determination is made. The Company has elected to record any interest or penalties from the uncertain tax position as income tax expense.
The Company files a consolidated United States federal income tax return. The Company prepares and files tax returns based on the interpretation of tax laws and regulations, and records estimates based on these judgments and interpretations. In the normal course of business, the tax returns are subject to examination by various taxing authorities. Such examinations may result in future tax and interest assessments by these taxing authorities, and the Company records a liability when it is probable that there will be an assessment. The Company adjusts the estimates periodically because of ongoing examinations by and settlements with the various taxing authorities, as well as changes in tax laws, regulations and precedent. The consolidated tax provision of any given year includes adjustments to prior year income tax accruals that are considered appropriate and any related estimated interest. Management believes that adequate accruals have been made for income taxes. Differences between estimated and actual amounts determined upon ultimate resolution, individually or in the aggregate, are not expected to have a material adverse effect on our consolidated financial position but could possibly be material to our consolidated results of operations or cash flow of any one period.
Inventories
The Company values inventory at the lower of cost (first-in, first-out) or market through the establishment of inventory reserves. Inventories are written down for estimated obsolescence equal to the difference between inventory cost and estimated net realizable value based on assumptions about future market conditions. The Company's reserve contains uncertainties because the calculation requires management to make assumptions and to apply judgment regarding inventory aging, forecasted future demand, market conditions and technological obsolescence. If actual future demand or market conditions are less favorable than those projected by management, additional inventory write-downs may be required.
Share-based compensation
The Company adopted the provisions of ASC Topic 505-50, "Equity-Based Payments to Non-Employees" and ASC Topic 718, "Stock Compensation", using the modified prospective approach and accounts for share-based compensation applying the fair value method for expensing stock options and non-vested stock awards.
Accordingly, adoption of SFAS 123(R)'s (ASC Topic 505-50 and ASC Topic 718) fair value method results in recording compensation costs under the Company's stock based compensation plans. The
30
Company determined the fair value of its stock option awards at the date of grant using the Black-Scholes option pricing model. Option-pricing models and generally accepted valuation techniques require management to make assumptions and to apply judgment to determine the fair value of our awards. These assumptions and judgments include estimating future volatility of our stock price, expected dividend yield, future employee turnover rates and future employee stock option exercise behaviors. Changes in these assumptions can materially affect fair value estimates. The Company does not believe that there is a reasonable likelihood that there will be a material change in future estimates or assumptions used to determine stock-based compensation expense. However, if actual results are not consistent with the Company's estimates or assumptions, there may be exposure to changes in stock-based compensation expense that could be material.
Warranty reserves
The Company offers warranties on some products of various lengths. At the time of shipment, the Company establishes a reserve for estimated costs of warranties based on the best estimate of the amounts necessary to settle future and existing claims using historical data on products sold as of the balance sheet date. The length of the warranty period, the product's failure rates and the customer's usage affects warranty cost. If actual costs of warranties differ from the Company's estimated amounts, future results of operations could be adversely affected.
New Accounting Pronouncements
In October 2009, the FASB issued Accounting Standards Update No. 2009-13 (ASU 2009-13), Multiple-Deliverable Revenue Arrangements which updates ASC Topic 605-25, Multiple Elements Arrangements, of the FASB codification. ASU 2009-13 provides new guidance on how to determine if an arrangement involving multiple deliverables contains more than one unit of accounting, and if so allows companies to allocate arrangement considerations in a manner more consistent with the economics of the transaction. ASU 2009-13 establishes a selling price hierarchy for determining the selling price of each specific deliverable, which includes vendor-specific objective evidence ("VSOE") if available, third party evidence if VSOE is not available or estimated selling price if neither VSOE nor third party evidence is available. This update expands the disclosure requirements regarding a vendor's multiple-deliverable revenue arrangements. In accordance with ASU 2009-13 the Company has chosen to adopt this guidance retrospectively for fiscal 2010 and determined that it did not have a material impact on the Company's financial condition or operating results, as the Company did not have a significant amount of sales that contained multiple elements. Additionally the Company has assessed any potential impact the new accounting guidance would have had on all prior periods presented and determined that it would have had no impact on any of the Company's prior financial statements or operating results. The Company is required to adopt, and has adopted the amendments in both ASU 2009-13 and 2009-14 in the same period and using the same transitional method.
In October 2009, the FASB issued Accounting Standards Update No. 2009-14 (ASU 2009-14), Revenue Arrangements that include Software Elements which amends ASC Topic 985-605, Software—Revenue Recognition in regard to the scope of software guidance. ASU 2009-14 excludes software components of tangible products that function together to provide the tangible product's essential functionality. While ASU 2009-14 does not create any new methods of revenue recognition, it could significantly affect the Company's recognition of revenue from period to period. In accordance with ASU 2009-14 the Company has chosen to adopt this guidance retrospectively for fiscal 2010 and determined that it did not have a material impact on the Company's financial condition or operating results, as the Company did not previously have arrangements and/or sales that were included within the scope of ASC Topic 985-605, Software—Revenue Recognition. Additionally the Company has assessed any potential impact the new accounting guidance would have had on all prior periods being presented and determined that it would have had no impact on any of the Company's prior financial
31
statements or operating results. The Company is required to adopt, and has adopted the amendments in both ASU 2009-13 and 2009-14 in the same period and using the same transitional method.
In January 2010, the FASB issued Accounting Standards Update No. 2010-06 (ASU 2010-06), Fair Value Measurements and Disclosures which amends ASC Topic 820, adding new requirements for disclosures for Levels 1 and 2, separate disclosures of purchases, sales, issuances, and settlements relating to Level 3 measurements and clarification of existing fair value disclosures. ASU 2010-06 is effective for interim and annual periods beginning after December 15, 2009 (the Company's fiscal year 2011), except for the requirement to provide Level 3 activity of purchases, sales, issuances, and settlements on a gross basis, which will be effective for fiscal years beginning after December 15, 2010 (the Company's fiscal year 2012); early adoption is permitted. The Company is currently evaluating the impact of adopting ASU 2010-06 on its financial statements.
In April 2010, the FASB issued Accounting Standards Update No. 2010-17 (ASU 2010-17), Revenue Recognition—Milestone Method which amends ASC Topic 605, Revenue Recognition, providing a consistent framework for applying the milestone method, thus adding clarity in practice on its application. The objective of ASU 2010-17 is to provide guidance on defining a milestone and determining when to apply the milestone method of revenue recognition to research and development transactions. ASU 2010-17 is effective for the Company, prospectively, for milestones achieved in fiscal years, and interim periods within those years, beginning on or after June 15, 2010 (the Company's fiscal year 2011); early adoption is permitted. The Company is currently evaluating the impact of adopting ASU 2010-17 on its financial statements.
Business Segments
The Company operates in one principal business segment which designs, manufactures and sells flight information computers, large flat-panel displays and advanced monitoring systems to the DoD, government agencies, defense contractors, commercial air transport carriers and corporate/general aviation markets. The Company currently derives virtually all of its revenues from the sale of this equipment and related EMD services. Almost all of the Company's sales, operating results and identifiable assets are in the United States. Net sales, operating results, and identifiable assets outside the U.S. are not significant.
In fiscal year 2010, 2009, and 2008 net sales outside the United States amounted to $2.8 million, $4.4 million and $1.7 million, respectively.
Item 7A. Quantitative and qualitative disclosures about market risk.
The Company's operations are exposed to market risks primarily as a result of changes in interest rates. The Company does not use derivative financial instruments for speculative or trading purposes. The Company's exposure to market risk for changes in interest rates relates to its cash equivalents. The Company's cash equivalents consist of funds invested in money market accounts, which bear interest at a variable rate. Assuming that the balances during fiscal 2010 were to remain constant and no actions were taken to alter the existing interest rate sensitivity, a hypothetical 1% increase in our variable interest rates would have affected interest income by approximately $0.4 million. This would result in a net impact on cash flows of approximately $0.4 million for fiscal 2010.
Item 8. Financial statements and supplementary data.
The financial statements of Innovative Solutions and Support, Inc. listed in the index appearing under Item 8 herein are filed as part of this Report.
32
Innovative Solutions and Support, Inc.
INDEX TO CONSOLIDATED FINANCIAL STATEMENTS
33
REPORT OF INDEPENDENT REGISTERED PUBLIC ACCOUNTING FIRM
To
the Board of Directors and Shareholders of
Innovative Solutions and Support, Inc.
Exton, Pennsylvania
We have audited the accompanying consolidated balance sheets of Innovative Solutions and Support, Inc. and subsidiaries (the "Company") as of September 30, 2010 and 2009, and the related consolidated statements of operations, cash flows, and shareholders' equity for each of the three years in the period ended September 30, 2010. These consolidated financial statements are the responsibility of the Company's management. Our responsibility is to express an opinion on the financial statements based on our audits.
We conducted our audits in accordance with the standards of the Public Company Accounting Oversight Board (United States). Those standards require that we plan and perform the audit to obtain reasonable assurance about whether the financial statements are free of material misstatement. An audit includes examining, on a test basis, evidence supporting the amounts and disclosures in the financial statements. An audit also includes assessing the accounting principles used and significant estimates made by management, as well as evaluating the overall financial statement presentation. We believe that our audits provide a reasonable basis for our opinion.
In our opinion, such consolidated financial statements present fairly, in all material respects, the financial position of the Company as of September 30, 2010 and 2009, and the results of its operations and its cash flows for each of the three years in the period ended September 30, 2010, in conformity with accounting principles generally accepted in the United States of America.
As discussed in Note 10 to the consolidated financial statements, the Company adopted Financial Accounting Standards Board Interpretation No. 48, Accounting for Uncertainty in Income Taxes (ASC Topic 740, Income Taxes), effective October 1, 2007.
We have also audited, in accordance with the standards of the Public Company Accounting Oversight Board (United States), the Company's internal control over financial reporting as of September 30, 2010, based on the criteria established in Internal Control—Integrated Framework issued by the Committee of Sponsoring Organizations of the Treadway Commission and our report dated December 14, 2010 expressed an unqualified opinion on the Company's internal control over financial reporting.
DELOITTE & TOUCHE LLP
Philadelphia,
Pennsylvania
December 14, 2010
34
INNOVATIVE SOLUTIONS AND SUPPORT, INC.
CONSOLIDATED BALANCE SHEETS
| |
September 30, 2010 |
September 30, 2009 |
|||||||||
|---|---|---|---|---|---|---|---|---|---|---|---|
ASSETS |
|||||||||||
Current Assets |
|||||||||||
Cash and cash equivalents |
$ | 40,916,346 | $ | 35,565,694 | |||||||
Accounts receivable, net |
2,529,976 | 6,188,706 | |||||||||
Inventories |
4,656,392 | 5,306,985 | |||||||||
Deferred income taxes |
522,352 | 503,993 | |||||||||
Prepaid expenses and other current assets |
982,768 | 1,227,413 | |||||||||
Total current assets |
49,607,834 | 48,792,791 | |||||||||
Property and equipment, net |
7,761,538 |
8,343,701 |
|||||||||
Other assets |
221,150 |
399,520 |
|||||||||
Total Assets |
$ | 57,590,522 | $ | 57,536,012 | |||||||
LIABILITIES AND SHAREHOLDERS' EQUITY |
|||||||||||
Current Liabilities |
|||||||||||
Current portion of capitalized lease obligations |
$ | 9,908 | $ | 9,908 | |||||||
Accounts payable |
543,877 | 1,207,990 | |||||||||
Accrued expenses |
2,585,060 | 2,785,560 | |||||||||
Deferred revenue |
157,933 | 164,856 | |||||||||
Total current liabilities |
3,296,778 | 4,168,314 | |||||||||
Long-term portion of capitalized lease obligations |
15,560 |
26,991 |
|||||||||
Deferred revenue |
8,688 | 60,792 | |||||||||
Deferred income taxes |
649,929 | 642,651 | |||||||||
Other liabilities |
151,530 | 238,522 | |||||||||
Total Liabilities |
4,122,485 | 5,137,270 | |||||||||
Commitments and contingencies |
— | — | |||||||||
Shareholders' Equity |
|||||||||||
Preferred Stock, 10,000,000 shares authorized, $.001 par value, of which 200,000 shares are authorized as Class A Convertible stock. No shares issued and outstanding at September 30, 2010 and 2009 |
— |
— |
|||||||||
Common stock, $.001 par value: 75,000,000 shares authorized, 18,244,701 and 18,206,839 issued at September 30, 2010 and 2009, respectively |
18,245 |
18,207 |
|||||||||
Additional paid-in capital |
46,831,646 |
46,462,135 |
|||||||||
Retained earnings |
25,909,652 | 25,161,276 | |||||||||
Treasury stock, at cost, 1,482,510 and 1,470,510 shares at September 30, 2010 and 2009, respectively |
(19,291,506 | ) | (19,242,876 | ) | |||||||
Total Shareholders' Equity |
53,468,037 | 52,398,742 | |||||||||
Total Liabilities and Shareholders' Equity |
$ | 57,590,522 | $ | 57,536,012 | |||||||
The accompanying notes are an integral part of these statements.
35
INNOVATIVE SOLUTIONS & SUPPORT, INC.
CONSOLIDATED STATEMENTS OF OPERATIONS
| |
For the Fiscal Year Ended September 30, | |||||||||||
|---|---|---|---|---|---|---|---|---|---|---|---|---|
| |
2010 | 2009 | 2008 | |||||||||
Net sales: |
||||||||||||
Product |
$ | 23,383,504 | $ | 31,855,060 | $ | 25,946,917 | ||||||
Engineering—modification and development |
1,873,819 | 4,879,090 | 4,586,394 | |||||||||
Total net sales |
25,257,323 | 36,734,150 | 30,533,311 | |||||||||
Cost of sales: |
||||||||||||
Product |
10,732,091 | 16,601,739 | 17,584,314 | |||||||||
Engineering—modification and development |
787,938 | 1,294,245 | 2,967,543 | |||||||||
Total cost of sales |
11,520,029 | 17,895,984 | 20,551,857 | |||||||||
Gross profit |
13,737,294 | 18,838,166 | 9,981,454 | |||||||||
Operating expenses: |
||||||||||||
Research and development |
5,234,240 | 5,313,007 | 10,304,279 | |||||||||
Selling, general and administrative |
8,099,587 | 8,647,506 | 22,306,016 | |||||||||
Asset impairment |
— | — | 2,475,000 | |||||||||
Total operating expenses |
13,333,827 | 13,960,513 | 35,085,295 | |||||||||
Operating income (loss) |
403,467 | 4,877,653 | (25,103,841 | ) | ||||||||
Interest income |
188,171 |
398,041 |
1,576,599 |
|||||||||
Interest (expense) |
(2,356 | ) | (82,276 | ) | (160,867 | ) | ||||||
Other income |
50,000 | 50,099 | 17,300,000 | |||||||||
Income (loss) before income taxes |
639,282 | 5,243,517 | (6,388,109 | ) | ||||||||
Income tax expense (benefit) |
(109,094 |
) |
234,856 |
1,509,139 |
||||||||
Net income (loss) |
$ | 748,376 | $ | 5,008,661 | $ | (7,897,248 | ) | |||||
Net income (loss) per common share: |
||||||||||||
Basic |
$ | 0.04 | $ | 0.30 | $ | (0.47 | ) | |||||
Diluted |
$ | 0.04 | $ | 0.30 | $ | (0.47 | ) | |||||
Weighted Average Shares Outstanding: |
||||||||||||
Basic |
16,751,528 | 16,745,379 | 16,887,049 | |||||||||
Diluted |
16,777,886 | 16,760,500 | 16,887,049 | |||||||||
The accompanying notes are an integral part of these statements.
36
INNOVATIVE SOLUTIONS AND SUPPORT, INC.
CONSOLIDATED STATEMENTS OF SHAREHOLDERS' EQUITY
| |
Common Stock |
Additional Paid-In Capital |
Retained Earnings |
Treasury Stock |
Total | |||||||||||
|---|---|---|---|---|---|---|---|---|---|---|---|---|---|---|---|---|
Balance, September 30, 2007 |
18,161 | 44,607,993 | 44,194,053 | (18,086,428 | ) | 70,733,779 | ||||||||||
Exercise of options to purchase common stock |
5 |
22,055 |
— |
— |
22,060 |
|||||||||||
Share-based compensation |
— | 938,013 | — | — | 938,013 | |||||||||||
Issuance of stock to directors |
11 | 199,899 | — | — | 199,910 | |||||||||||
Purchase of treasury stock |
— | — | — | (1,048,198 | ) | (1,048,198 | ) | |||||||||
Cumulative effect of adoption of FIN 48 |
— | — | 587,324 | — | 587,324 | |||||||||||
Dividends |
— | — | (16,731,514 | ) | — | (16,731,514 | ) | |||||||||
Net loss |
— | — | (7,897,248 | ) | — | (7,897,248 | ) | |||||||||
Balance, September 30, 2008 |
18,177 | 45,767,960 | 20,152,615 | (19,134,626 | ) | 46,804,126 | ||||||||||
Share-based compensation |
— | 494,084 | — | — | 494,084 | |||||||||||
Issuance of stock to directors |
30 | 200,091 | — | — | 200,121 | |||||||||||
Purchase of treasury stock |
— | — | — | (108,250 | ) | (108,250 | ) | |||||||||
Net income |
— | — | 5,008,661 | — | 5,008,661 | |||||||||||
Balance, September 30, 2009 |
18,207 | 46,462,135 | 25,161,276 | (19,242,876 | ) | 52,398,742 | ||||||||||
Share-based compensation |
— | 169,565 | — | — | 169,565 | |||||||||||
Issuance of stock to directors |
38 | 199,946 | — | — | 199,984 | |||||||||||
Purchase of treasury stock |
— | — | — | (48,630 | ) | (48,630 | ) | |||||||||
Net income |
— | — | 748,376 | — | 748,376 | |||||||||||
Balance, September 30, 2010 |
18,245 | 46,831,646 | 25,909,652 | (19,291,506 | ) | 53,468,037 | ||||||||||
The accompanying notes are an integral part of these statements.
37
INNOVATIVE SOLUTIONS AND SUPPORT, INC.
CONSOLIDATED STATEMENTS OF CASH FLOWS
| |
For the Twelve Months Ended September 30, |
|||||||||||||
|---|---|---|---|---|---|---|---|---|---|---|---|---|---|---|
| |
2010 | 2009 | 2008 | |||||||||||
CASH FLOWS FROM OPERATING ACTIVITIES: |
||||||||||||||
Net (Loss) income |
$ | 748,376 | $ | 5,008,661 | (7,897,248 | ) | ||||||||
Adjustments to reconcile net income to net cash provided by operating activities: |
||||||||||||||
Depreciation and amortization |
826,748 | 1,085,316 | 1,048,267 | |||||||||||
Deposit forfeiture, installation kits |
118,660 | — | — | |||||||||||
Share-based compensation expense: |
||||||||||||||
Stock options |
171,491 | 490,989 | 938,013 | |||||||||||
Nonvested stock awards |
199,946 | 200,121 | 199,910 | |||||||||||
Tax benefit from share-based compensation: |
||||||||||||||
Stock options |
— | — | 10,497 | |||||||||||
Nonvested stock awards |
(1,926 | ) | 3,095 | (21,655 | ) | |||||||||
Provision for loss on accounts receivable |
— | 185,848 | 4,077,319 | |||||||||||
Excess tax benefits from share-based payment arrangements |
— | — | (11,424 | ) | ||||||||||
Loss on disposal of property and equipment |
4,917 | 56,678 | 9,531 | |||||||||||
Excess and obsolete inventory cost |
— | 506,656 | 1,856,827 | |||||||||||
Asset Impairment |
— | — | 2,475,000 | |||||||||||
Deferred income taxes |
(11,081 | ) | (89,357 | ) | 1,227,955 | |||||||||
(Increase) decrease in: |
||||||||||||||
Accounts receivable |
3,658,730 | (2,156,111 | ) | (2,047,156 | ) | |||||||||
Inventories |
650,593 | 3,547,616 | (1,854,289 | ) | ||||||||||
Prepaid expenses and other current assets |
273,711 | 178,847 | 4,802,544 | |||||||||||
Other non-current assets |
— | (1,870 | ) | (41,080 | ) | |||||||||
Increase (decrease) in: |
||||||||||||||
Accounts Payable |
(664,113 | ) | (1,141,991 | ) | (1,727,808 | ) | ||||||||
Accrued expenses |
(200,500 | ) | (1,658,551 | ) | 1,046,955 | |||||||||
Income taxes payable |
(116,058 | ) | (686,352 | ) | — | |||||||||
Deferred revenue |
(59,027 | ) | (339,350 | ) | (145,937 | ) | ||||||||
Other non-current liabilities |
— | 129,304 | 249,969 | |||||||||||
Net cash provided by operating activities |
5,600,467 | 5,319,549 | 4,196,190 | |||||||||||
CASH FLOWS FROM INVESTING ACTIVITIES: |
||||||||||||||
Purchases of property and equipment |
(189,790 | ) | (332,515 | ) | (573,357 | ) | ||||||||
Proceeds from the sale of property and equipment |
— | 620 | 3,000 | |||||||||||
Net cash used in investing activities |
(189,790 | ) | (331,895 | ) | (570,357 | ) | ||||||||
CASH FLOWS FROM FINANCING ACTIVITIES: |
||||||||||||||
Repayment of Industrial Development Bond |
— | (4,335,000 | ) | — | ||||||||||
Proceed from exercise of stock options |
— | — | 33,218 | |||||||||||
Purchase of treasury stock |
(48,630 | ) | (108,250 | ) | (1,048,198 | ) | ||||||||
Dividend paid |
— | — | (16,731,514 | ) | ||||||||||
Repayment of capitalized lease obligations |
(11,431 | ) | (10,642 | ) | (9,909 | ) | ||||||||
Excess tax benefits from share-based payment arrangements |
— | — | 11,424 | |||||||||||
Other |
36 | — | — | |||||||||||
Net cash used in financing activities |
(60,025 | ) | (4,453,892 | ) | (17,744,979 | ) | ||||||||
Net increase (decrease) in cash and cash equivalents |
5,350,652 | 533,762 | (14,119,146 | ) | ||||||||||
Cash and cash equivalents, beginning of year |
35,565,694 | 35,031,932 | 49,151,078 | |||||||||||
Cash and cash equivalents, end of year |
$ | 40,916,346 | $ | 35,565,694 | $ | 35,031,932 | ||||||||
SUPPLEMENTAL DISCLOSURE OF CASH FLOW INFORMATION |
||||||||||||||
Cash paid for interest |
$ | 2,357 | $ | 48,303 | 120,650 | |||||||||
Cash paid for income tax |
$ | 121,473 | $ | 804,486 | 9,073 | |||||||||
Cash received from income tax refund |
$ | (1,000 | ) | $ | (25,115 | ) | (5,107,269 | ) | ||||||
The accompanying notes are an integral part of these statements.
38
INNOVATIVE SOLUTIONS AND SUPPORT, INC.
NOTES TO CONSOLIDATED FINANCIAL STATEMENTS
1. Background:
Innovative Solutions and Support, Inc., (the "Company"), was incorporated in Pennsylvania on February 12, 1988. The Company's primary business is the design, manufacture and sale of flight information computers, large flat panel displays and advanced monitoring systems to the Department of Defense ("DoD"), defense contractors, commercial air transport and corporate/general aviation markets.
2. Concentrations:
Major Customers and Products
In fiscal 2010, 2009, and 2008 the Company derived 48%, 56%, and 72% of total sales from five customers, although not all the same customers in each year. Accounts receivable related to those top five customers was $0.3 million, $2.8 million, and $2.3 million for the twelve month periods ended September 30, 2010, 2009, and 2008, respectively.
In fiscal 2010 two of the Company's customers, Lockheed Martin and FedEx, accounted for 11% and 10% of total sales, respectively. In fiscal 2009 two of the Company's customers, American Airlines and United States Department of Defense accounted for 24% and 11% of total sales, respectively. In fiscal 2008 two of the Company's customers, Eclipse and Fed Ex, accounted for 42% and 10% of total sales, respectively.
Sales of air data systems and components were 32%, 25%, and 23% of total sales for the years ended September 30, 2010, 2009, and 2008 respectively. Flat Panel sales were 68%, 75%, and 77% of total sales in the years ended September 30, 2010, 2009, and 2008 respectively. Sales to government contractors and agencies accounted for approximately 43%, 46%, and 23% of total sales during fiscal years 2010, 2009, and 2008, respectively. While under these contracts the government agency or general contractor typically retains the right to terminate the contract at any time at its convenience, to date these contracts generally have included provisions requiring the payment to the Company of all revenue earned and costs incurred by the Company through the date of contract termination and do not entitle the customer to receive a refund of any previously paid fees.
Major Suppliers
The Company currently buys several of its components from sole source suppliers. Although there are a limited number of manufacturers of particular components, management believes other suppliers could provide similar components on comparable terms.
During fiscal 2010 the Company had one suppler who accounted for 22% of the Company's total inventory related purchases. During fiscal 2009 the Company had two suppliers who accounted for 38% and 10% of the Company's total inventory related purchases.
Concentration of Credit Risk
Financial instruments that potentially subject the Company to concentration of credit risk consist principally of cash balances and accounts receivable. The Company invests its excess cash where preservation of principal is the major consideration. The Company's customer base principally consists of companies within the aviation industry. The Company routinely requests advance payments and/or letters of credit from new customers.
39
INNOVATIVE SOLUTIONS AND SUPPORT, INC.
NOTES TO CONSOLIDATED FINANCIAL STATEMENTS (Continued)
2. Concentrations: (Continued)
The Company maintained a reserve for doubtful accounts in the amount of $0.2 million and $0.2 million for fiscal year 2010 and 2009, respectively. The reserve balance for both fiscal 2010 and 2009 is related to sales of Engineering Modification and Development (EMD) services to a customer that was negatively impacted by the current economic environment.
3. Summary of Significant Accounting Policies:
Principles of Consolidation
The consolidated financial statements include the accounts of the Company and its subsidiaries. All significant inter-company balances and transactions have been eliminated in consolidation.
Use of Estimates
Preparation of consolidated financial statements in conformity with accounting principles generally accepted in the United States of America requires management to make estimates and assumptions that affect reported amounts of assets and liabilities, and disclosure of contingent assets and liabilities, as of the date of the financial statements and the reported amounts of revenues and expenses during the reporting period. Estimates are used in accounting for, among other items, allowance for doubtful accounts, inventory obsolescence, product warranty cost liability, income taxes and contingencies. Actual results could differ materially from those estimates.
Cash and Cash Equivalents
Highly liquid investments purchased with an original maturity of three months or less are classified as cash equivalents. Cash equivalents at September 30, 2010 and 2009 consist of funds invested in money market accounts with financial institutions.
Inventories
Inventories are stated at the lower of cost (first-in, first-out) or market and consist of the following:
| |
September 30, 2010 |
September 30, 2009 |
|||||
|---|---|---|---|---|---|---|---|
Raw materials |
$ | 2,725,268 | $ | 3,535,109 | |||
Work-in-process |
236,060 | 315,179 | |||||
Finished goods |
1,695,064 | 1,456,697 | |||||
|
$ | 4,656,392 | $ | 5,306,985 | |||
The balances above are net of excess and obsolete inventory reserves of $3.2 million and $3.3 million for fiscal 2010 and 2009, respectively.
Property and Equipment
Property and equipment are stated at cost. Depreciation is provided using an accelerated method over estimated useful lives of the assets (the lesser of three to seven years or over the lease term), except for the airplane and manufacturing facility, which are depreciated using the straight-line method
40
INNOVATIVE SOLUTIONS AND SUPPORT, INC.
NOTES TO CONSOLIDATED FINANCIAL STATEMENTS (Continued)
3. Summary of Significant Accounting Policies: (Continued)
over estimated useful lives of ten years and thirty-nine years. Major additions and improvements are capitalized, while maintenance and repairs that do not improve or extend the life of assets are charged to expense as incurred. Depreciation expense was $0.8 million, $0.9 million and $1.0 million for the fiscal years ended September 30, 2010, 2009 and 2008, respectively.
Long-Lived Assets
The Company assesses the impairment of long-lived assets in accordance with FASB ASC Topic 360-10, "Property, Plant and Equipment". This statement requires that long-lived assets be reviewed for impairment whenever events or changes in circumstances indicate the carrying amount of an asset may not be recoverable. In addition, long-lived assets to be disposed of should be reported at the lower of the carrying amount or fair value less cost to sell. The Company considers historical performance and future estimated results in its evaluation of potential impairment and then compares the carrying amount of the asset to estimated future cash flows expected to result from use of the asset. If the carrying amount of the asset exceeds the estimated expected undiscounted future cash flows, the Company measures the amount of the impairment by comparing the carrying amount of the asset to its fair value. The estimation of fair value is generally measured by discounting expected future cash flows. No impairment charges were recorded in fiscal year 2010, 2009 or 2008.
Revenue Recognition
The Company enters into sales arrangements with customers that, in general, provide for the Company to design, develop, manufacture and deliver flight information computers, large flat-panel displays, and advanced monitoring systems that measure and display critical flight information, including data relative to aircraft separation, airspeed, and altitude, as well as engine and fuel data measurements. Additionally, during the three months ended June 30, 2010 the Company began delivery in accordance with a new arrangement with a new customer to provide, among other deliverables, functional upgrades to the Company's flight information computers and flat-panel displays. The Company's sales arrangements may include multiple deliverables as defined in FASB ASC Topic 605-25, "Multiple-Element Arrangements" (ASC Topic 605-25), which typically include design and engineering services and the production and delivery of the flat panel display and related components.
Multiple Element Arrangements—
The Company identifies all goods and/or services that are to be delivered separately under such a sales arrangement and allocates revenue to each deliverable (if more than one) based on that deliverable's selling price. The Company then considers the appropriate recognition method for each deliverable; deliverables under multiple element arrangements are typically purchased engineering and design services, product sales and/or the sale of functional upgrades. The Company's multiple element arrangements can typically include defined design and development activities and/or functional upgrades, along with product sales.
The Company utilizes the selling price hierarchy that has been established by FASB Accounting Standards Update (ASU) 2009-13, "Multiple-Deliverable Revenue Arrangements—a consensus of the FASB Emerging Issues Task Force" (ASU 2009-13), which requires that the selling price for each deliverable be based on vendor-specific objective evidence if available, third-party evidence if vendor-specific objective evidence is not available, or estimated selling price if neither vendor-specific objective evidence nor
41
INNOVATIVE SOLUTIONS AND SUPPORT, INC.
NOTES TO CONSOLIDATED FINANCIAL STATEMENTS (Continued)
3. Summary of Significant Accounting Policies: (Continued)
third-party evidence is available. To the extent that an arrangement includes a deliverable for which estimated selling price is used, the Company's determines the best estimate of selling price by applying the same pricing policies and methodologies that would be used to determine the price to sell the deliverable on a standalone basis.
To the extent that an arrangement contains software elements that are essential to the functionality of tangible products sold in the arrangement, the Company recognizes revenue for the deliverables in accordance with the guidance included in FASB Accounting Standards Update 2009-14, "Revenue Arrangements That Include Software Elements" (ASU 2009-14), ASU 2009-13 and FASB ASC Topic 605, "Revenue Recognition" (ASC Topic 605).
To the extent that an arrangement contains defined design and development activities as an identified deliverable in addition to products (resulting in a multiple element arrangement), the Company recognizes as EMD revenue amounts earned during the design and development phase of the contract following the guidance included in the FASB ASC Topic 605-35, "Construction-Type and Production-Type Contracts" (ASC Topic 605-35). To the extent that multiple element arrangements include product sales, revenue is generally recognized once revenue recognition criteria for the product deliverable has been met based on the provisions of ASC Topic 605.
To the extent that an arrangement contains software components, which include functional upgrades, that are sold on a standalone basis and the Company has deemed outside the scope the exception defined by ASU 2009-14, the Company recognizes software revenue in accordance with ASC Topic 985, "Software", although no such sales have occurred to date.
Single Element Arrangements—
Products—
To the extent that a single element arrangement provides for product sales and repairs, revenue is generally recognized once revenue recognition criteria for the product deliverable has been met based on the provisions of ASC Topic 605. The Company also receives orders for existing equipment and parts. Revenue from the sale of such products is generally recognized upon shipment to the customer.
The Company offers its customers extended warranties for additional fees. These warranty sales are recorded as deferred revenue and recognized as sales on a straight-line basis over the warranty period.
Engineering Services—
The Company also may enter into service arrangements to perform specified design and development services related to its products. The Company recognizes revenue from these arrangements as EMD revenue, following the guidance included in ASC Topic 605-35. The Company considers the nature of these service arrangements (including term, size of contract, level of effort) when determining the appropriate accounting treatment for a particular contract. The Company recognizes the revenue from these contracts using either the percentage-of-completion method or completed contract method of accounting.
The Company records revenue relating to these contracts using the percentage-of-completion method when the Company determines that progress toward completion is reasonable and reliably
42
INNOVATIVE SOLUTIONS AND SUPPORT, INC.
NOTES TO CONSOLIDATED FINANCIAL STATEMENTS (Continued)
3. Summary of Significant Accounting Policies: (Continued)
estimable and the contract is long-term in nature; the Company uses the completed contract method for all others.
Income Taxes
Income taxes are recorded in accordance with FASB ASC Topic 740, "Income Taxes" (ASC Topic 740), which principally utilizes a balance sheet approach to provide for income taxes. Under this method, the Company recognizes deferred tax assets and liabilities for temporary differences between the financial reporting basis and the tax basis of the Company's assets, liabilities and expected benefits of utilizing net operating loss and tax credit carry-forwards. The impact on deferred taxes of changes in tax rates and laws, if any, applied to the years during which temporary differences are expected to be settled, are reflected in the consolidated financial statements in the period of enactment.
Deferred tax assets are reduced by valuation allowances if, based on the consideration of all available evidence, it is more likely than not that some portion of the deferred tax asset will not be realized. Significant weight is given to evidence that can be objectively verified. The Company evaluates deferred income taxes on a quarterly basis to determine if valuation allowances are required by considering available evidence. Deferred tax assets are realized by having sufficient future taxable income to allow the related tax benefits to reduce taxes otherwise payable. The sources of taxable income that may be available to realize the benefit of deferred tax assets are future reversals of existing taxable temporary differences, future taxable income exclusive of reversing temporary differences and carry-forwards, taxable income in carry-back years and tax planning strategies that are both prudent and feasible. In the event the Company were to determine that it would be able to realize its deferred tax assets in the future in excess of the net recorded amount, an adjustment would be made to the valuation allowance which would reduce the provision for income taxes.
The accounting for uncertainty in income taxes requires a more likely than not threshold for financial statement recognition and measurement of tax positions taken or expected to be taken in a tax return. The Company records a liability for the difference between the (i) benefit recognized and measured for financial statement purposes and (ii) the tax position taken or expected to be taken on our tax return. To the extent that our assessment of such tax positions changes, the change in estimate is recorded in the period in which the determination is made. The Company has elected to record any interest or penalties from the uncertain tax position as income tax expense.
The Company files a consolidated United States federal income tax return. The Company prepares and files tax returns based on the interpretation of tax laws and regulations, and records estimates based on these judgments and interpretations. In the normal course of business, the tax returns are subject to examination by various taxing authorities. Such examinations may result in future tax and interest assessments by these taxing authorities, and the Company records a liability when it is probable that there will be an assessment. The Company adjusts the estimates periodically because of ongoing examinations by and settlements with the various taxing authorities, as well as changes in tax laws, regulations and precedent. The consolidated tax provision of any given year includes adjustments to prior year income tax accruals that are considered appropriate and any related estimated interest. Management believes that adequate accruals have been made for income taxes. Differences between estimated and actual amounts determined upon ultimate resolution, individually or in the aggregate,
43
INNOVATIVE SOLUTIONS AND SUPPORT, INC.
NOTES TO CONSOLIDATED FINANCIAL STATEMENTS (Continued)
3. Summary of Significant Accounting Policies: (Continued)
are not expected to have a material adverse effect on our consolidated financial position but could possibly be material to our consolidated results of operations or cash flow of any one period.
Research and Development
Research and development charges incurred for product design, product enhancements and future product development are expensed as incurred. Product development and design charges incurred related to a specific customer agreement that are billable are capitalized and then charged to cost of sales—engineering modification and development as the revenue related to the agreements are recognized.
Comprehensive Income
Pursuant to FASB ASC Topic 220, "Comprehensive Income" the Company is required to classify items of other comprehensive income by their nature in a financial statement and display the accumulated balance of other comprehensive income separately from retained earnings and additional paid-in capital in the equity section of our condensed consolidated balance sheets. For fiscal 2010 and 2009, comprehensive income consists of net income and there were no items of other comprehensive income for any of the periods presented.
Fair Value of Financial Instruments
The Company adopted FASB ASC Topic 820, "Fair Value Measurements and Disclosures" (ASC Topic 820) in the first quarter of fiscal 2009 for financial assets and liabilities. This standard defines fair value as the price at which an asset could be exchanged in a current transaction between knowledgeable, willing parties. A liability's fair value is defined as the amount that would be paid to transfer the liability to a new obligor, not the amount that would be paid to settle the liability with the creditor.
Assets and liabilities measured at fair value are categorized based upon the level of judgment associated with the inputs used to measure their fair value. Hierarchical levels, defined by ASC Topic 820 and directly related to the amount of subjectivity associated with the inputs to fair valuation of these assets and liabilities, are as follows:
- •
- Quoted prices for similar assets or liabilities in active markets;
- •
- Quoted prices for identical or similar assets in non-active markets;
- •
- Inputs other than quoted prices that are observable for the asset or liability; and
- •
- Inputs that are derived principally from or corroborated by other observable market data.
Level 1—Unadjusted quoted prices that are available in active markets for the identical assets or liabilities at the measurement date.
Level 2—Other observable inputs available at the measurement date, other than quoted prices included in Level 1, either directly or indirectly, including:
Level 3—Unobservable inputs that cannot be corroborated by observable market data and reflect the use of significant management judgment. These values are generally determined
44
INNOVATIVE SOLUTIONS AND SUPPORT, INC.
NOTES TO CONSOLIDATED FINANCIAL STATEMENTS (Continued)
3. Summary of Significant Accounting Policies: (Continued)
using pricing models for which the assumptions utilize management's estimates of market participant assumptions.
The following table sets forth by level within the fair value hierarchy the Company's financial assets and liabilities that were accounted for at fair value on a recurring basis as of September 30, 2010 and 2009, according to the valuation techniques the Company used to determine their fair values.
| |
Fair Value Measurement on June 30, 2010 | |||||||||||
|---|---|---|---|---|---|---|---|---|---|---|---|---|
| |
Quoted Price in Active Markets for Identical Assets |
Significant Other Observable Inputs |
Significant Unobservable Inputs |
|||||||||
| |
(Level 1) | (Level 2) | (Level 3) | |||||||||
Assets |
||||||||||||
Cash and cash equivalents: |
||||||||||||
Money market funds |
$ | 36,903,024 | $ | — | $ | — | ||||||
| |
Fair Value Measurement on September 30, 2009 | |||||||||||
|---|---|---|---|---|---|---|---|---|---|---|---|---|
| |
Quoted Price in Active Markets for Identical Assets |
Significant Other Observable Inputs |
Significant Unobservable Inputs |
|||||||||
| |
(Level 1) | (Level 2) | (Level 3) | |||||||||
Assets |
||||||||||||
Cash and cash equivalents: |
||||||||||||
Money market funds |
$ | 34,793,543 | $ | — | $ | — | ||||||
Stock-Based Compensation
The Company accounts for stock-based compensation under FASB ASC Topic 505-50, "Equity-Based Payments to Non-Employees" (ASC Topic 505-50) and ASC Topic 718, "Stock Compensation" (ASC Topic 718), which requires the Company to measure the cost of employee services received in exchange for an award of equity instruments based on the grant-date fair value of the award using an option pricing model. That cost is recognized over the period during which an employee is required to provide service in exchange for the award.
Warranty
We offer warranties on some products of various lengths. At the time of shipment, we establish a reserve for estimated costs of warranties based on our best estimate of the amounts necessary to settle future and existing claims using historical data on products sold as of the balance sheet date. The length of the warranty period, the product's failure rates and the customer's usage affects warranty cost. If actual warranty costs differ from our estimated amounts, future results of operations could be adversely affected.
New Accounting Pronouncements
In October 2009, the FASB issued ASU 2009-13, which updates ASC Topic 605-25, of the FASB codification. ASU 2009-13 provides new guidance on how to determine if an arrangement involving multiple deliverables contains more than one unit of accounting, and if so allows companies to allocate
45
INNOVATIVE SOLUTIONS AND SUPPORT, INC.
NOTES TO CONSOLIDATED FINANCIAL STATEMENTS (Continued)
3. Summary of Significant Accounting Policies: (Continued)
arrangement considerations in a manner more consistent with the economics of the transaction. ASU 2009-13 establishes a selling price hierarchy for determining the selling price of each specific deliverable, which includes vendor-specific objective evidence ("VSOE") if available, third party evidence if VSOE is not available or estimated selling price if neither VSOE nor third party evidence is available. This update expands the disclosure requirements regarding a vendor's multiple-deliverable revenue arrangements. In accordance with ASU 2009-13 the Company has chosen to adopt this guidance retrospectively for fiscal 2010 and determined that it had no impact on the Company's financial condition or operating results, as the Company did not have a significant amount of sales that contained multiple elements. Additionally the Company has assessed any potential impact the new accounting guidance would have had on all prior periods presented and determined that it would have had no impact on any of the Company's prior financial statements or operating results. The Company is required to adopt, and has adopted the amendments in ASU 2009-13 using the same transitional method.
In October 2009, the FASB issued ASU 2009-14 which amends ASC Topic 985-605, Software—Revenue Recognition (ASC Topic 985-605) in regard to the scope of software guidance. ASU 2009-14 excludes software components of tangible products that function together to provide the tangible product's essential functionality. While ASU 2009-14 does not create any new methods of revenue recognition, it could significantly affect the Company's recognition of revenue from period to period. In accordance with ASU 2009-14 the Company has chosen to adopt this guidance retrospectively for fiscal 2010 and determined that it had no impact on the Company's financial condition or operating results, as the Company did not previously have arrangements and/or sales that were included within the scope of ASC Topic 985-605. Additionally the Company has assessed any potential impact the new accounting guidance would have had on all prior periods being presented and determined that it would have had no impact on any of the Company's prior financial statements or operating results. The Company is required to adopt, and has adopted the amendment in 2009-14 using the transitional method.
In January 2010, the FASB issued Accounting Standards Update No. 2010-06 (ASU 2010-06), Fair Value Measurements and Disclosures which amends ASC Topic 820, adding new requirements for disclosures for Levels 1 and 2, separate disclosures of purchases, sales, issuances, and settlements relating to Level 3 measurements and clarification of existing fair value disclosures. ASU 2010-06 is effective for interim and annual periods beginning after December 15, 2009 (the Company's fiscal year 2011), except for the requirement to provide Level 3 activity of purchases, sales, issuances, and settlements on a gross basis, which will be effective for fiscal years beginning after December 15, 2010 (the Company's fiscal year 2012); early adoption is permitted. The Company is currently evaluating the impact of adopting ASU 2010-06 on its financial statements.
In April 2010, the FASB issued Accounting Standards Update No. 2010-17 (ASU 2010-17), Revenue Recognition—Milestone Method which amends ASC Topic 605, Revenue Recognition, providing a consistent framework for applying the milestone method, thus adding clarity in practice on its application. The objective of ASU 2010-17 is to provide guidance on defining a milestone and determining when to apply the milestone method of revenue recognition to research and development transactions. ASU 2010-17 is effective for the Company, prospectively, for milestones achieved in fiscal years, and interim periods within those years, beginning on or after June 15, 2010 (the Company's fiscal year 2011); early adoption is permitted. The Company is currently evaluating the impact of adopting ASU 2010-17 on its financial statements.
46
INNOVATIVE SOLUTIONS AND SUPPORT, INC.
NOTES TO CONSOLIDATED FINANCIAL STATEMENTS (Continued)
4. Net Income (Loss) Per Share:
Net income (loss) per share is calculated pursuant to ASC Topic 260 Earnings per share. Basic earnings per share (EPS) excludes potentially dilutive securities and is computed by dividing net income by the weighted average number of Common shares outstanding for the period. Diluted EPS is computed assuming the conversion or exercise of all dilutive securities such as employee stock options.
In fiscal 2010 there was a difference of 26,358 shares between basic weighted average shares outstanding and diluted weighted average shares outstanding used in the computation of diluted EPS. In fiscal 2009 there was a difference of 15,121 shares between basic weighted average shares outstanding and diluted weighted average shares outstanding used in the computation of diluted EPS. There is no difference between basic weighted average shares outstanding and diluted weighted average shares outstanding used to compute diluted EPS for fiscal 2008, due to the Company experiencing a net loss.
The number of incremental shares from the assumed exercise of stock options is calculated by using the treasury stock method. As of September 30, 2010 and 2009, there were 491,200 and 606,549 options to purchase common stock outstanding, respectively. For fiscal year 2010, 240,770 options to purchase common stock were excluded from the computation of diluted earnings per share, as the effect would be anti-dilutive. For fiscal year 2009, 425,949 options to purchase common stock were excluded from the computation of diluted earnings per share, as the effect would be anti-dilutive.
5. Prepaid expenses and other current assets:
Prepaid expenses and other current assets consist of the following:
| |
September 30, 2010 |
September 30, 2009 |
|||||
|---|---|---|---|---|---|---|---|
Revenue recognized not yet invoiced |
$ | 420,429 | $ | 491,417 | |||
Prepaid insurance |
298,308 | 307,477 | |||||
Deferred engineering costs |
48,237 | 81,957 | |||||
Income tax refund receivable |
29,066 | — | |||||
Other |
186,728 | 346,562 | |||||
|
$ | 982,768 | $ | 1,227,413 | |||
47
INNOVATIVE SOLUTIONS AND SUPPORT, INC.
NOTES TO CONSOLIDATED FINANCIAL STATEMENTS (Continued)
6. Property and equipment:
Property and equipment, net consists of the following balances:
| |
September 30, 2010 |
September 30, 2009 |
||||||
|---|---|---|---|---|---|---|---|---|
Computer equipment |
$ | 1,968,365 | $ | 1,986,028 | ||||
Corporate airplane |
3,082,186 | 3,082,186 | ||||||
Furniture and office equipment |
1,077,698 | 1,074,031 | ||||||
Manufacturing facility |
5,576,466 | 5,558,553 | ||||||
Equipment |
4,070,171 | 4,037,689 | ||||||
Land |
1,021,245 | 1,021,245 | ||||||
|
16,796,131 | 16,759,732 | ||||||
Less: Accumulated depreciation and amortization |
(9,034,593 | ) | (8,416,031 | ) | ||||
|
$ | 7,761,538 | $ | 8,343,701 | ||||
Depreciation and amortization related to property and equipment was approximately $0.8 million, $0.9 million and $1.0 million for fiscal 2010, 2009 and 2008, respectively.
7. Other assets:
Other assets consist of the following:
| |
September 30, 2010 |
September 30, 2009 |
|||||
|---|---|---|---|---|---|---|---|
Intangible assets, net of accumulated amortization of $257,850 and $198,140 at September 30, 2010 and September 30, 2009 |
$ | 221,150 | $ | 280,860 | |||
Installation kits, deposit forfeiture |
— | 118,660 | |||||
|
$ | 221,150 | $ | 399,520 | |||
Intangible assets consist of licensing and certification rights which are amortized over a defined number of units. The Company had non-cash purchases of other assets of $0, $100,000 and $0 in 2010, 2009 and 2008, respectively. No impairment charge was recorded in fiscal 2010 or 2009. The Company recorded an asset impairment charge of $2.5 million in 2008 related to acquired engineering software that was determined to offer no future cash flow generation and is no longer part of the Company's product offerings.
Total intangible amortization expense was approximately $0.1 million, $0.2 million and $0.1 million for fiscal 2010, 2009 and 2008, respectively. Because the intangible assets are being amortized over a defined number of units, the future amortization expense over the next five years cannot be determined at this time.
48
INNOVATIVE SOLUTIONS AND SUPPORT, INC.
NOTES TO CONSOLIDATED FINANCIAL STATEMENTS (Continued)
8. Accrued expenses:
Accrued expenses consist of the following:
| |
September 30, 2010 |
September 30, 2009 |
|||||
|---|---|---|---|---|---|---|---|
Warranty |
$ | 933,270 | $ | 808,544 | |||
Salary, benefits and payroll taxes |
552,646 | 617,224 | |||||
Reduction in workforce / severance(a) |
— | 166,453 | |||||
Professional fees |
303,139 | 188,349 | |||||
Income taxes payable |
— | 112,449 | |||||
Materials on order |
18,772 | 108,210 | |||||
Other |
777,233 | 784,331 | |||||
|
$ | 2,585,060 | $ | 2,785,560 | |||
- (a)
- The amount included in Reduction in work force/severance as of September 30, 2009 is severance related to the former Chief Executive Officer which is payable under the terms of the Release Agreement dated November 10, 2008.
9. Warranty:
The Company provides for the estimated cost of product warranties at the time revenue is recognized. Warranty cost is recorded as cost of sales and the reserve balance recorded as an accrued expense in the financial statements. While the Company engages in extensive product quality programs and processes, the Company's warranty obligation is affected by product failure rates and the related material, labor and delivery costs incurred in correcting a product failure. Should actual product failure rates, material or labor costs differ from the Company's estimates, further revisions to the estimated warranty liability would be required.
Warranty cost and accrual information for fiscal years ended September 30, 2010 and 2009:
| |
2010 | 2009 | |||||
|---|---|---|---|---|---|---|---|
Warranty Accrual as of October 1, |
808,544 | 736,815 | |||||
Accrued expense for fiscal year |
410,551 | 353,726 | |||||
Warranty cost incurred for fiscal year |
(285,825 | ) | (281,997 | ) | |||
Warranty accrual as of September 30, |
933,270 | 808,544 | |||||
10. Income Taxes:
Income taxes are recorded in accordance with ASC Topic 740 "Income Taxes", which utilizes a balance sheet approach to provide for income taxes. Under this method, the Company recognizes deferred tax assets and liabilities for temporary differences between the financial reporting basis and the tax basis of the Company's assets, liabilities and expected benefits of utilizing net operating loss and tax credit carry-forwards. The impact on deferred taxes of changes in tax rates and laws, if any, applied to the years during which temporary differences are expected to be settled, are reflected in the consolidated financial statements in the period of enactment.
49
INNOVATIVE SOLUTIONS AND SUPPORT, INC.
NOTES TO CONSOLIDATED FINANCIAL STATEMENTS (Continued)
10. Income Taxes: (Continued)
The components of income taxes are as follows:
| |
For the Fiscal Year Ended September 30, | ||||||||||
|---|---|---|---|---|---|---|---|---|---|---|---|
| |
2010 | 2009 | 2008 | ||||||||
Current provision (benefit): |
|||||||||||
Federal |
$ | (33,770 | ) | $ | 134,560 | $ | 236,170 | ||||
State |
(64,243 | ) | (38,362 | ) | (30,708 | ) | |||||
Total current provision (benefit) |
(98,013 | ) | 96,198 | 205,462 | |||||||
Deferred provision (benefit): |
|||||||||||
Federal |
— | — | 883,439 | ||||||||
State |
(11,081 | ) | 138,658 | 420,238 | |||||||
Total deferred provision (benefit) |
(11,081 | ) | 138,658 | 1,303,677 | |||||||
Total current and deferred provision (benefit) |
$ |
(109,094 |
) |
$ |
234,856 |
$ |
1,509,139 |
||||
Following is a reconciliation of the statutory federal rate to the Company's effective income tax rate:
| |
For the Fiscal Year Ended September 30, |
||||||||||
|---|---|---|---|---|---|---|---|---|---|---|---|
| |
2010 | 2009 | 2008 | ||||||||
Federal statutory tax rate |
34.0 | % | 34.0 | % | 34.0 | % | |||||
State income taxes, net of federal benefit |
13.8 | % | (0.1 | )% | 7.3 | % | |||||
Research and development tax credits |
(20.7 | )% | (13.1 | )% | 1.8 | % | |||||
Valuation allowance |
(38.7 | )% | (14.1 | )% | (74.5 | )% | |||||
Additional benefit from federal amended and carryback claims |
0.0 | % | 0.0 | % | 6.3 | % | |||||
Other |
(5.5 | )% | (2.2 | )% | 1.5 | % | |||||
Effective income tax rate |
(17.1 | )% | 4.5 | % | (23.6 | )% | |||||
In October 2008, the Emergency Economic Stabilization Act of 2008 was enacted, which retroactively reinstated and extended the Federal Research & Development (R&D) Tax Credit from January 1, 2008 to December 31, 2009. The impact of this retroactive extension was recognized in the first quarter of the fiscal year ending September 30, 2009 as required by ASC Topic 740; accordingly the Company's effective income tax rate for that year reflected the benefit of the R&D credit generated over the period January 1, 2008 through September 30, 2009. Due to the lapse of the federal R&D credit on December 31, 2009, the Company has recorded the impact of the R&D credit for only the first quarter in the fiscal year ended September 30, 2010.
50
INNOVATIVE SOLUTIONS AND SUPPORT, INC.
NOTES TO CONSOLIDATED FINANCIAL STATEMENTS (Continued)
10. Income Taxes: (Continued)
The deferred tax effect of temporary differences giving rise to the Company's deferred tax assets and liabilities consists of the components below.
| |
As of September 30, | |||||||||||||
|---|---|---|---|---|---|---|---|---|---|---|---|---|---|---|
| |
2010 | 2009 | ||||||||||||
| |
Current | Non Current | Current | Non Current | ||||||||||
Deferred tax assets: |
||||||||||||||
Deferred revenue |
$ | 18,180 | $ | 3,031 | $ | 19,265 | $ | 21,981 | ||||||
Reserves and accruals |
1,609,142 | 256,645 | 1,740,317 | 277,324 | ||||||||||
Research and development credit |
655,214 | 208,384 | 582,329 | 142,027 | ||||||||||
Software |
— | — | 298,297 | — | ||||||||||
NOL carryforwards—state |
— | 1,189,643 | — | 1,146,081 | ||||||||||
Stock options |
— | 628,640 | — | 865,445 | ||||||||||
Other |
— | 11,437 | — | 40,138 | ||||||||||
|
2,282,536 | 2,297,780 | 2,640,208 | 2,492,996 | ||||||||||
Less: Valuation allowance |
(1,760,184 | ) | (2,291,087 | ) | (2,136,215 | ) | (2,425,047 | ) | ||||||
Total deferred tax assets |
522,352 | 6,693 | 503,993 | 67,949 | ||||||||||
Deferred tax liabilities: |
||||||||||||||
Depreciation |
— | (656,622 | ) | — | (710,600 | ) | ||||||||
Total deferred tax liabilities |
— | (656,622 | ) | — | (710,600 | ) | ||||||||
Net deferred tax asset (liability) |
$ |
522,352 |
$ |
(649,929 |
) |
$ |
503,993 |
$ |
(642,651 |
) |
||||
During the fiscal year ended September 30, 2010, the Company generated a federal net operating loss (NOL) of approximately $155,000. The Company plans to carry back this NOL to a previous tax year, such that a refund receivable of $29,000 has been recorded. As of September 30, 2010, the Company has state net operating losses of $20.2 million, which begin to expire in varying amounts after fiscal year ending September 30, 2026. In addition, the Company has federal research and development tax credit carryforwards of approximately $655,000, which begin to expire in varying amounts after fiscal year ending September 30, 2028, and state research and development tax credit carryforwards of $208,000 (net of federal impact), which begin to expire in varying amounts after fiscal year ending September 30, 2023.
The Company evaluates deferred income taxes on a quarterly basis to determine if valuation allowances are required by considering available evidence, including historical and projected taxable income and tax planning strategies that are both prudent and feasible. ASC Topic 740 requires the consideration of a valuation allowance to reflect the likelihood of realization of deferred tax assets. Significant management judgment is required in determining any valuation allowance recorded against net deferred tax assets. Based on the weight of available evidence at that time, the Company recorded a full valuation allowance against net deferred tax assets during the quarter ended March 31, 2008. As of September 30, 2010, the Company considered all available positive and negative evidence, including the cumulative operating loss related to the fiscal years ended September 30, 2008, 2009, and 2010, and the uncertainty as to the extent and timing of profitability in future periods.
51
INNOVATIVE SOLUTIONS AND SUPPORT, INC.
NOTES TO CONSOLIDATED FINANCIAL STATEMENTS (Continued)
10. Income Taxes: (Continued)
As a result of this analysis, there were no significant changes in management's judgment during the year ended September 30, 2010, and the Company continues to carry a full valuation allowance against its net deferred tax assets. The valuation allowance decreased by $510,000 and $736,000 for the year ended September 30, 2010 and 2009, respectively, due primarily to net reversals of deductible temporary differences.
If realization of deferred tax assets in the future is considered more likely than not, a reduction to the valuation allowance related to deferred tax assets would increase net income in the period such determination is made. The amount of deferred tax assets considered realizable is based on significant estimates, and it is possible that changes in these estimates could materially affect the financial condition and results of operations. The Company's effective tax rate may vary from period to period based on changes in estimated taxable income or loss; changes to the valuation allowance; changes to federal or state tax laws; and as a result of acquisitions and changes in UTP's, if any.
In accordance with ASC Topic 740, the Company adopted the provisions related to accounting for uncertain income tax positions on October 1, 2007. The $587,000 cumulative effect of adoption was recorded as an increase to retained earnings in the first quarter of the fiscal year ended September 30, 2008.
Following is a reconciliation of beginning and ending balances of total amounts of gross unrecognized tax benefits:
| |
For the Fiscal Year Ended September 30, |
|||||||||
|---|---|---|---|---|---|---|---|---|---|---|
| |
2010 | 2009 | 2008 | |||||||
Balance at beginning of year |
$ | 474,000 | $ | 324,000 | $ | 435,000 | ||||
Unrecognized tax benefits related to prior years |
— | — | (125,000 | ) | ||||||
Unrecognized tax benefits related to current year |
34,000 | 191,000 | 72,000 | |||||||
Settlements |
— | — | — | |||||||
Decrease in unrecognized tax benefits due to the lapse of applicable statute of limitations |
(83,000 | ) | (41,000 | ) | (58,000 | ) | ||||
Balance at end of year |
$ | 425,000 | $ | 474,000 | $ | 324,000 | ||||
The total liabilities associated with the unrecognized tax benefits that, if recognized, would impact the Company's effective tax rate were $425,000, $474,000 and $324,000 at September 30, 2010, 2009 and 2008, respectively. It is not anticipated that unrecognized tax benefits taken regarding previously filed returns will change significantly over the next twelve months.
The Company's policy is to recognize interest accrued and, if applicable, penalties related to unrecognized tax benefits in income tax expense for all periods presented. The Company has accrued approximately $8,000 and $19,000 for the payment of interest, net of tax benefits, at September 30, 2010 and 2009, respectively. There is no accrual recorded for penalties.
For the fiscal year ended September 30, 2010, 2009 and 2008, the Company recognized a benefit of $10,000, $2,000 and $6,000, respectively, of interest (net of federal impact) within income tax expense.
The Company is subject to income taxes in the U.S. federal and various state jurisdictions. Tax regulations within each jurisdiction are subject to the interpretation of related tax laws and regulations
52
INNOVATIVE SOLUTIONS AND SUPPORT, INC.
NOTES TO CONSOLIDATED FINANCIAL STATEMENTS (Continued)
10. Income Taxes: (Continued)
and require significant judgment to apply. During the fiscal year ended September 30, 2008, the Internal Revenue Service concluded an examination for tax years through September 30, 2006. The Company also files income tax returns in various state jurisdictions, as appropriate, with varying statutes of limitation. There are no state income tax examinations in process at this time.
11. Notes Payable:
The Company entered into a $4,335,000 loan agreement dated August 1, 2000 with the Chester County, Pennsylvania Industrial Development Authority. The purpose of the loan was to fund the construction of the Company's new office and manufacturing facility. The loan was scheduled to mature in 2015 and carried an interest rate set by the remarketing agent that was consistent with 30-day tax-exempt commercial paper. The Company exercised its option to pay-down the outstanding balance during August, 2009.
The interest cost related to this debt for fiscal years 2010, 2009 and 2008 was $0, $45,000 and $117,000, respectively. The Company was required to maintain a letter of credit in the amount of $5,000,000 covering the debt, prior to the August, 2009 retirement.
12. Savings Plan:
The Company sponsors a voluntary defined contribution savings plan covering all employees. The Company made contributions of $175,000, $195,000, and $172,000 for the fiscal years ended September 30, 2010, 2009 and 2008, respectively.
13. Share-Based Compensation:
The Company accounts for share-based compensation under the provisions of ASC Topic 505-50 and ASC Topic 718, using the modified prospective approach and accounts for share-based compensation applying the fair value method for expensing stock options and non-vested stock awards.
Total share-based compensation expense was $371,000, $691,000 and $1,138,000 for the fiscal years ended September 30, 2010, 2009, and 2008, respectively. The total income tax impact is recognized as a (charge) credit to additional paid-in capital in the statement of shareholders' equity related to share-based compensation arrangements was ($2,000), $2,000 and ($11,000) for the fiscal years ended September 30, 2010, 2009, and 2008, respectively. Compensation expense related to share-based awards is recorded as a component of general and administrative expense.
The Company maintains the 1998 Stock Option Plan (the "1998 Plan"), the 2003 Restricted Stock Plan (the "Restricted Plan") and the 2009 Stock-Based Incentive Compensation Plan (the "2009 Plan"). These plans were approved by the Company's shareholders. The 1998 Plan expired on November 13, 2008.
1998 Stock Option Plan
The 1998 Plan allowed granting of incentive and nonqualified stock options to employees, officers, directors and independent contractors and consultants. No stock options were granted to independent contractors or consultants under this plan. Total compensation expense associated with awards under the 1998 Plan was $159,000, $492,000, and $938,000 for fiscal years ended September 30, 2010, 2009, and 2008 respectively.
53
INNOVATIVE SOLUTIONS AND SUPPORT, INC.
NOTES TO CONSOLIDATED FINANCIAL STATEMENTS (Continued)
13. Share-Based Compensation: (Continued)
Incentive stock options granted under the 1998 Plan have exercise prices that are at least equal to the fair value of the common stock on grant date. Nonqualified stock options granted under the plan have exercise prices that are less than, equal to or greater than the fair value of the common stock on the date of grant. The Company reserved 3,389,000 shares of Common Stock for awards under the plan. On November 13, 2008, the plan expired and no additional shares were granted under the Plan after that date.
Following is a summary of option activity under the plan for fiscal years ended September 30, 2010, 2009, and 2008 and changes during the periods then ended:
| |
Options | Weighted Average Exercise Price |
Aggregate Intrinsic Value |
||||||||
|---|---|---|---|---|---|---|---|---|---|---|---|
Outstanding at September 30, 2007 |
572,959 | $ | 10.30 | ||||||||
Granted |
409,000 | 10.16 | |||||||||
Exercised |
(4,497 | ) | 7.31 | ||||||||
Cancelled |
(226,854 | ) | 11.88 | ||||||||
Outstanding at September 30, 2008 |
750,608 | $ | 9.76 | ||||||||
Granted |
— | — | |||||||||
Exercised |
— | — | |||||||||
Cancelled |
(144,059 | ) | 11.09 | ||||||||
Outstanding at September 30, 2009 |
606,549 | 9.45 | |||||||||
Granted |
— | ||||||||||
Exercised |
— | ||||||||||
Cancelled |
(115,349 | ) | 10.49 | ||||||||
Outstanding at September 30, 2010 |
491,200 | $ | 9.21 | $ | 123,599 | ||||||
Vested and expected to vest |
488,800 | $ | 8.33 | $ | 123,599 | ||||||
Options exercisable at September 30, 2010 |
443,200 | $ | 8.78 | $ | 123,599 | ||||||
In fiscal 2010 and 2009 there were no options granted or exercised under the 1998 Plan, therefore there is no weighted-average grant date fair value of individual options granted and no intrinsic value of exercised options. The weighted-average grant date fair value of individual options granted during the fiscal year ended September 30, 2008 was $5.05, and the total intrinsic value of options exercised was $33,000.
54
INNOVATIVE SOLUTIONS AND SUPPORT, INC.
NOTES TO CONSOLIDATED FINANCIAL STATEMENTS (Continued)
13. Share-Based Compensation: (Continued)
The following table summarizes information about stock options under the 1998 Plan at September 30, 2010:
| Options Outstanding | Options Exercisable | |||||||||||||||
|---|---|---|---|---|---|---|---|---|---|---|---|---|---|---|---|---|
Range of Exercise Prices
|
Outstanding As of September 30, 2010 |
Weighted- Average Remaining Contractual Life |
Weighted- Average Exercise Price |
As of September 30, 2010 |
Weighted- Average Exercise Price |
|||||||||||
0.00 - 5.00 |
181,800 | 2.7 | $ | 4.21 | 181,800 | $ | 4.21 | |||||||||
5.01 - 10.00 |
124,900 | 4.5 | 7.71 | 94,900 | 7.69 | |||||||||||
10.01 - 15.00 |
133,000 | 6.2 | 12.24 | 127,800 | 12.18 | |||||||||||
15.01 - 20.00 |
18,000 | 4.5 | 17.17 | 17,200 | 17.24 | |||||||||||
20.01 - 26.00 |
33,500 | 6.4 | 25.57 | 21,500 | 25.32 | |||||||||||
|
491,200 | 4.4 | $ | 9.21 | 443,200 | $ | 8.78 | |||||||||
Fair value of each option grant is estimated on the date of grant using the Black-Scholes option pricing model. Options are exercisable over a maximum term of ten years from date of grant and typically vest over periods of five years from the grant date. The expected term of options represents the period of time that options granted are expected to be outstanding and is based on historical experience. Expected volatility is based on historical volatility of the Company's stock. The risk free interest rate is based on U.S. Treasuries with constant maturities in effect at the time of grant. Compensation expense for employee stock options also includes an estimate for forfeitures and is recognized ratably over the vesting term. Below are fair value assumptions used to record compensation expense, related to the 1998 Plan, for the period identified:
| |
Fiscal Year Ended September 30, |
|||||||||
|---|---|---|---|---|---|---|---|---|---|---|
| |
2010 | 2009 | 2008 | |||||||
Expected dividend rate |
* | * | — | |||||||
Expected volatility |
* | * | 61.9 | % | ||||||
Weighted average risk-free interest rate |
* | * | 2.1 | % | ||||||
Expected term of expected life (years) |
* | * | 8.00 | |||||||
- *
- No options were granted in fiscal 2010 and 2009 from the 1998 plan; therefore the data in the above table is not applicable.
At September 30, 2010, there was approximately $199,000 of unrecognized compensation cost, net of forfeitures, related to non-vested stock options, which is expected to be recognized over a period of approximately 4 years.
55
INNOVATIVE SOLUTIONS AND SUPPORT, INC.
NOTES TO CONSOLIDATED FINANCIAL STATEMENTS (Continued)
13. Share-Based Compensation: (Continued)
Restricted Plan
The Restricted Plan for non-employee directors was approved by shareholders at the Company's February 26, 2004 Annual Meeting of Shareholders. It calls for an annual award of non-vested stock having a fair market value of $40,000 at close of business on October 1 of the current fiscal year for all eligible non-employee directors. The stock was awarded in four quarterly installments during the fiscal year provided the director is still serving on the board on the quarterly issue date. Total expense was $190,000, $200,000 and $200,000 for the fiscal years ended September 30, 2010, 2009, and 2008, respectively. The last awards were made under this plan in 2010 and there are no further shares to award under this plan. The following table outlines restricted stock awards for fiscal years ended September 30, 2010, 2009, and 2008:
| |
Non-vested Stock Awards |
Weighted Average Share Price |
||||||
|---|---|---|---|---|---|---|---|---|
Balance at September 30, 2007 |
3,465 | $ | 14.43 | |||||
Granted |
10,525 | 19.00 | ||||||
Issued |
(11,355 | ) | 17.61 | |||||
Cancelled |
— | — | ||||||
Balance at September 30, 2008 |
2,635 | $ | 19.00 | |||||
Granted |
36,230 | 5.52 | ||||||
Issued |
(29,815 | ) | 6.71 | |||||
Cancelled |
— | — | ||||||
Balance at September 30, 2009 |
9,050 | $ | 5.52 | |||||
Granted |
41,150 | 4.86 | ||||||
Issued |
(37,862 | ) | 5.02 | |||||
Cancelled |
— | — | ||||||
Balance at September 30, 2010 |
12,338 | 4.86 | ||||||
2009 Stock-Based Incentive Compensation Plan
The 2009 Plan authorizes the grant of Stock Appreciation Rights ("SARs"), Restricted Stock, Options and other equity-based awards under the 2009 Plan (collectively referred to as "Awards"). Options granted under the 2009 Plan may be either "incentive stock options" as defined in section 422 of the Internal Revenue Code (the "Code"), or nonqualified stock options, as determined by the Compensation Committee of the Company's Board of Directors (the "Committee").
Subject to an adjustment necessary upon a stock dividend, recapitalization, forward split or reverse split, reorganization, merger, consolidation, spin-off, combination, repurchase or share exchange, extraordinary or unusual cash distribution or other similar corporate transaction or event, the maximum number of shares of Common Stock available for Awards under the 2009 Plan shall be 1,200,000, all of which may be issued pursuant to Awards of incentive stock options. In addition, the Plan provides that no more than 300,000 shares may be awarded to any employee as a performance-based Award under Section 162(m) of the Code. At September 30, 2010 there were 1,150,000 shares of Common Stock available for awards under the plan.
56
INNOVATIVE SOLUTIONS AND SUPPORT, INC.
NOTES TO CONSOLIDATED FINANCIAL STATEMENTS (Continued)
13. Share-Based Compensation: (Continued)
If any Award is forfeited, or if any Option terminates, expires or lapses without being exercised, shares of Common Stock subject to such Award will again be available for future grant. Any shares tendered by a participant in payment of the exercise price of an Option or the tax liability with respect to an Award (including, in any case, shares withheld from any such Award) will not be available for future grant under the 2009 Plan. If there is any change in the Company's corporate capitalization, the Committee shall proportionately and equitably adjust the number and kind of shares of Common Stock which may be issued in connection with future Awards, the number and kind of shares of Common Stock covered by Awards then outstanding under the 2009 Plan, the number and kind of shares of Common Stock available under the 2009 Plan, the exercise or grant price of any Award, or if deemed appropriate, make provision for a cash payment with respect to any outstanding Award, provided that no adjustment may be made that would adversely affect the status of any Award that is intended to be a performance-based Award under Section 162(m) of the Code, unless otherwise determined by the Committee. In addition, the Committee may make adjustments in the terms and conditions of any Awards, including any performance goals, in recognition of unusual or nonrecurring events affecting the Company or any subsidiary, or in response to changes in applicable laws, regulations or accounting principles, provided that no adjustment may be made that would adversely affect the status of any Award that is intended to be a performance-based Award under Section 162(m) of the Code, unless otherwise determined by the Committee.
The following table summarizes information about stock options under the 2009 Plan at September 30, 2010:
| Options Outstanding | Options Exercisable | |||||||||||||||
|---|---|---|---|---|---|---|---|---|---|---|---|---|---|---|---|---|
Range of Exercise Prices
|
Outstanding As of September 30, 2010 |
Weighted- Average Remaining Contractual Life |
Weighted- Average Exercise Price |
As of September 30, 2010 |
Weighted- Average Exercise Price |
|||||||||||
0.00 - 5.00 |
50,000 | 4.1 | $ | 4.50 | — | $ | — | |||||||||
5.01 - 10.00 |
— | — | — | — | — | |||||||||||
10.01 - 15.00 |
— | — | — | — | — | |||||||||||
15.01 - 20.00 |
— | — | — | — | — | |||||||||||
20.01 - 26.00 |
— | — | — | — | — | |||||||||||
|
50,000 | 4.1 | $ | 4.50 | — | $ | — | |||||||||
Fair value of each option grant is estimated on the date of grant using the Black-Scholes option pricing model. Options are exercisable over a maximum term of ten years from date of grant and typically vest over periods of five years from the grant date. The expected term of options represents the period of time that options granted are expected to be outstanding and is based on historical experience. Expected volatility is based on historical volatility of the Company's stock. The risk free interest rate is based on U.S. Treasuries with constant maturities in effect at the time of grant. Compensation expense for employee stock options also includes an estimate for forfeitures and is
57
INNOVATIVE SOLUTIONS AND SUPPORT, INC.
NOTES TO CONSOLIDATED FINANCIAL STATEMENTS (Continued)
13. Share-Based Compensation: (Continued)
recognized ratably over the vesting term. Below are fair value assumptions used to record compensation expense, related to the 2009 Plan, for the period identified:
| |
Fiscal Year Ended September 30, |
|||||||||
|---|---|---|---|---|---|---|---|---|---|---|
| |
2010 | 2009 | 2008 | |||||||
Expected dividend rate |
— | * | * | |||||||
Expected volatility |
70.0 | % | * | * | ||||||
Weighted average risk-free interest rate |
2.6 | % | * | * | ||||||
Expected term of expected life (years) |
4.15 | * | * | |||||||
- *
- No options were granted in fiscal 2009 and 2008 from the 2009 plan; therefore the data in the above table is not applicable.
Total compensation expense associated with awards under the 2009 Plan was $23,000, $0 and $0 for fiscal years ended September 30, 2010, 2009 and 2008 respectively. At September 30, 2010, there was approximately $101,000 of unrecognized compensation cost, net of forfeitures, related to non-vested stock options, which is expected to be recognized over a period of approximately 4 years.
14. Commitments and Contingencies:
Capital Lease
The Company leases certain equipment under capital leases with terms of five years and an implicit interest rate of 7.2%. The capitalized cost of $57,450 and related annual amortization of $7,178, $10,050 and $22,816 have been included in property and equipment at September 30, 2010, 2009 and 2008 respectively. The balance due on these leases was $25,500, $36,899 and $47,542 as of September 30, 2010, 2009 and 2008 respectively. Future payments, including interest relating to these leases are $13,788 annually for the next two years.
Operating Leases
Rent expense under operating leases totaled $25,900, $39,065 and $196,000 for the years ended September 30, 2010, 2009 and 2008, respectively. As of September 30, 2010 the company has no future minimum payments related to any non-cancelable operating leases in fiscal 2010.
Product Liability
The Company has product liability insurance of $50,000,000, which management believes is adequate to cover potential liabilities that may arise.
Legal Proceedings
In the ordinary course of business, we are at times subject to various legal proceedings and claims. We do not believe any such matters that are currently pending will have a material adverse effect on our results of operations or financial position.
On November 18, 2010, Jeoffrey L. Burtch, the Chapter 7 Trustee for AE Liquidation, Inc. (formerly Eclipse Aviation Corporation), filed avoidance actions against IS&S on behalf of
58
INNOVATIVE SOLUTIONS AND SUPPORT, INC.
NOTES TO CONSOLIDATED FINANCIAL STATEMENTS (Continued)
14. Commitments and Contingencies: (Continued)
AE Liquidation, Inc. for the avoidance of seven payments totaling $321,095 as allegedly preferential transfers paid to IS&S during the 90 days preceding the filing of the bankruptcy petition of Eclipse Aviation Corporation on November 25, 2008. The Company believes it has meritorious defenses to these avoidance actions, intends to vigorously defend against them and believes that the likelihood of the avoidance actions prevailing is remote. Accordingly, the Company has not accrued any loss reserve related to this claim.
On January 17, 2007 the Company filed suit in the Court of Common Pleas for Delaware County, Pennsylvania against Strathman Associates, a former software consultant for IS&S, alleging that Strathman had improperly used IS&S trade secret and proprietary information in assisting J2 and Kollsman in developing the J2/Kollsman Air Data Computer. The case is ongoing.
15. Related-Party Transactions:
The Company incurred legal fees of $138,000, $105,000 and $128,000 for the fiscal years ended September 30, 2010, 2009 and 2008, respectively with a law firm which is a shareholder of the Company. The fees paid and services rendered were comparable with fees paid to other unrelated law firms.
For the years ended September 30, 2010, 2009 and 2008, respectively, the Company incurred service fees of $25,000, $0, and $67,000 with a commercial graphics firm controlled by an individual who is married to a shareholder and a daughter of the Company's Chairman and Chief Executive Officer.
16. Quarterly Financial Data (unaudited):
Summarized quarterly results of operations of the Company for the years ended September 30, 2010 and September 30, 2009 are presented below:
| |
Fiscal Year Ended September 30, 2010 | |||||||||||||
|---|---|---|---|---|---|---|---|---|---|---|---|---|---|---|
| |
First Quarter | Second Quarter | Third Quarter | Fourth Quarter | ||||||||||
Net Sales |
$ | 4,607,239 | $ | 5,372,957 | $ | 7,813,816 | $ | 7,463,311 | ||||||
Cost of sales |
2,836,773 | 2,942,496 | 3,010,810 | 2,729,950 | ||||||||||
Gross profit |
1,770,466 | 2,430,461 | 4,803,006 | 4,733,361 | ||||||||||
Operating income (loss) |
(1,545,378 | ) | (850,570 | ) | 1,589,723 | 1,209,692 | ||||||||
Net income (loss) |
(1,145,173 | ) | (745,765 | ) | 1,388,032 | 1,251,282 | ||||||||
Net income (loss) per common share |
||||||||||||||
Basic |
$ | (0.07 | ) | $ | (0.04 | ) | $ | 0.08 | $ | 0.07 | ||||
Diluted |
$ | (0.07 | ) | $ | (0.04 | ) | $ | 0.08 | $ | 0.07 | ||||
59
INNOVATIVE SOLUTIONS AND SUPPORT, INC.
NOTES TO CONSOLIDATED FINANCIAL STATEMENTS (Continued)
16. Quarterly Financial Data (unaudited): (Continued)
| |
Fiscal Year Ended September 30, 2009 | |||||||||||||
|---|---|---|---|---|---|---|---|---|---|---|---|---|---|---|
| |
First Quarter | Second Quarter | Third Quarter | Fourth Quarter | ||||||||||
Net Sales |
$ | 10,575,346 | $ | 10,465,726 | $ | 7,759,300 | $ | 7,933,778 | ||||||
Cost of sales |
5,255,173 | 5,217,613 | 3,621,045 | 3,802,153 | ||||||||||
Gross profit |
5,320,173 | 5,248,113 | 4,138,255 | 4,131,625 | ||||||||||
Operating income (loss) |
1,680,365 | 1,365,346 | 1,010,287 | 821,655 | ||||||||||
Net income (loss) |
1,823,386 | 1,347,530 | 1,252,311 | 585,434 | ||||||||||
Net income (loss) per common share |
||||||||||||||
Basic |
$ | 0.11 | $ | 0.08 | $ | 0.07 | $ | 0.03 | ||||||
Diluted |
$ | 0.11 | $ | 0.08 | $ | 0.07 | $ | 0.03 | ||||||
Quarterly and total year earnings per share are calculated independently based on the weighted average number of shares outstanding during each period.
17. Business Segments
The Company operates in one principal business segment which designs, manufactures and sells flight information computers, flat panel displays and advanced monitoring systems to the DoD, government agencies, commercial air transport carriers and corporate/general aviation markets. The Company currently derives virtually all of its revenues from the sale of this equipment. Almost all of the Company's sales, operating results and identifiable assets are in the United States. Net sales, operating results and identifiable assets outside the U.S. are not material. During fiscal 2010, 2009 and 2008 we derived 68%, 75%, and 77% respectively, of our total revenues from the sale of Flat Panel Display Systems. During fiscal 2010, 2009, and 2008 we derived 32%, 25%, and 23% respectively, of total revenues from the sale of air data systems related products.
Geographic Data
Almost all of the Company's sales, operating results and identifiable assets are in the United States. Net sales, operating results and identifiable assets outside the U.S. are not material. In fiscal year 2010, 2009 and 2008 net sales outside the United States amounted to $2.8 million, $4.4 million and $1.7 million, respectively.
Product Data
Our current product line includes flat panel display systems and air data systems and components, During fiscal 2010, 2009 and 2008, the Company derived 68%, 75%, and 77%, respectively, of its revenue from sales of flat panel display systems. The remaining revenue for each of the fiscal years was from sales of air data systems and components.
60
Item 9. Changes in and disagreements with accountants on accounting and financial disclosure.
None
Item 9A. Controls and procedures
- (a)
- An
evaluation was performed under supervision and with participation of the Company's management, including its Chief Executive Officer, or CEO, and Chief
Financial Officer, or CFO, of the effectiveness of the Company's disclosure controls and procedures, as such term is defined under Rule 13a-15(e) promulgated under the Securities
Exchange Act of 1934, as amended (the "Exchange Act") as of September 30, 2010. Based on that evaluation, the Company's management, including the CEO and CFO, concluded the Company's disclosure
controls and procedures are effective to provide reasonable assurance that information required to be disclosed by the Company in reports that it files or submits under the Exchange Act, is recorded,
processed, summarized and reported as specified in Securities and Exchange Commission rules and forms and that such information is accumulated and communicated by the Company's management, including
the CEO and CFO, or persons performing similar functions, as appropriate to allow timely decisions regarding required disclosure.
- (b)
- Management's
annual report on internal control over financial reporting and the attestation report of our independent registered public accounting firm are
set forth below on this Annual Report on Form 10-K.
- (c)
- There were no changes in the Company's internal control over financial reporting identified in connection with the evaluation of such controls that occurred during the Company's most recent fiscal quarter that has materially affected, or is reasonably likely to materially affect, the Company's internal control over financial reporting.
Management's Report on Internal Control over financial reporting
Management of Innovative Solutions & Support, Inc. and its subsidiaries (the Company) is responsible for establishing and maintaining adequate internal control over financial reporting. The Company's internal control over financial reporting is a process designed under the supervision of the Company's principal executive officer and principal financial officer to provide reasonable assurance regarding the reliability of financial reporting and preparation of the Company's financial statements for external purposes in accordance with accounting principles generally accepted in the United States of America.
The Company's internal control over financial reporting includes policies and procedures that (1) pertain to maintenance of records that, in reasonable detail, accurately and fairly reflect transactions and dispositions of the assets of the Company; (2) provide reasonable assurance that transactions are recorded as necessary to permit preparation of financial statements in accordance with generally accepted accounting principles, and that receipts and expenditures of the Company are being made only in accordance with authorizations of management and directors of the Company; and (3) provide reasonable assurance regarding prevention or timely detection of unauthorized acquisition, use, or disposition of Company assets that could have a material effect on financial statements.
Due to its inherent limitations, internal control over financial reporting may not prevent or detect misstatements and, even when determined to be effective, can only provide reasonable, not absolute, assurance with respect to financial statement preparation and presentation. Projections of any evaluation of effectiveness to future periods are subject to risk that controls may become inadequate as a result of changes in conditions or deterioration in the degree of compliance.
Management assessed the effectiveness of the Company's internal control over financial reporting as of September 30, 2010. This assessment was based on criteria for effective internal control over
61
financial reporting described in "Internal Control—Integrated Framework," issued by the Committee on Sponsoring Organizations of the Treadway Commission. Based on this assessment, management believes that, as of September 30, 2010, internal control over financial reporting was effective to provide reasonable assurance regarding the reliability of financial reporting and the preparation of financial statements in accordance with U.S. generally accepted accounting principles.
Our internal control over financial reporting has been audited by Deloitte & Touche LLP, an independent registered public accounting firm, as stated in their report which is included herein.
62
REPORT OF INDEPENDENT REGISTERED PUBLIC ACCOUNTING FIRM
To
the Board of Directors and Shareholders of
Innovative Solutions and Support, Inc.
Exton, Pennsylvania
We have audited the internal control over financial reporting of Innovative Solutions and Support, Inc. and subsidiaries (the "Company") as of September 30, 2010, based on criteria established in Internal Control—Integrated Framework issued by the Committee of Sponsoring Organizations of the Treadway Commission. The Company's management is responsible for maintaining effective internal control over financial reporting and for its assessment of the effectiveness of internal control over financial reporting, included in the accompanying Management's Report on Internal Control over Financial Reporting. Our responsibility is to express an opinion on the Company's internal control over financial reporting based on our audit.
We conducted our audit in accordance with the standards of the Public Company Accounting Oversight Board (United States). Those standards require that we plan and perform the audit to obtain reasonable assurance about whether effective internal control over financial reporting was maintained in all material respects. Our audit included obtaining an understanding of internal control over financial reporting, assessing the risk that a material weakness exists, testing and evaluating the design and operating effectiveness of internal control based on the assessed risk, and performing such other procedures as we considered necessary in the circumstances. We believe that our audit provides a reasonable basis for our opinion.
A company's internal control over financial reporting is a process designed by, or under the supervision of, the company's principal executive and principal financial officers, or persons performing similar functions, and effected by the company's board of directors, management, and other personnel to provide reasonable assurance regarding the reliability of financial reporting and the preparation of financial statements for external purposes in accordance with generally accepted accounting principles. A company's internal control over financial reporting includes those policies and procedures that (1) pertain to the maintenance of records that, in reasonable detail, accurately and fairly reflect the transactions and dispositions of the assets of the company; (2) provide reasonable assurance that transactions are recorded as necessary to permit preparation of financial statements in accordance with generally accepted accounting principles, and that receipts and expenditures of the company are being made only in accordance with authorizations of management and directors of the company; and (3) provide reasonable assurance regarding prevention or timely detection of unauthorized acquisition, use, or disposition of the company's assets that could have a material effect on the financial statements.
Because of the inherent limitations of internal control over financial reporting, including the possibility of collusion or improper management override of controls, material misstatements due to error or fraud may not be prevented or detected on a timely basis. Also, projections of any evaluation of the effectiveness of the internal control over financial reporting to future periods are subject to the risk that the controls may become inadequate because of changes in conditions, or that the degree of compliance with the policies or procedures may deteriorate.
In our opinion, the Company maintained, in all material respects, effective internal control over financial reporting as of September 30, 2010, based on the criteria established in Internal Control—Integrated Framework issued by the Committee of Sponsoring Organizations of the Treadway Commission.
63
We have also audited, in accordance with the standards of the Public Company Accounting Oversight Board (United States), the consolidated financial statements as of and for the year ended September 30, 2010 of the Company and our report dated December 14, 2010 expressed an unqualified opinion on those consolidated financial statements and included an explanatory paragraph relating to the Company's adoption of Financial Accounting Standards Board (FASB) Interpretation No. 48 (FIN 48), Accounting for Uncertainty in Income Taxes (ASC Topic 740, Income Taxes), effective October 1, 2007.
DELOITTE & TOUCHE LLP
Philadelphia,
Pennsylvania
December 14, 2010
64
Item 10. Directors, executive officers and corporate governance.
This information (other than information relating to executive officers included in Part I Item 1.) will be included in our Proxy Statement relating to our Annual Meeting of Shareholders, which will be filed within 120 days after the close of our fiscal year covered by this Report, and is hereby incorporated by reference to such Proxy Statement. We have adopted a written code of business conduct and ethics, known as our code of conduct, which applies to all of our directors, officers, and employees, including our chief executive officer, our president and our chief financial officer. Our code of conduct is available on our Internet website, www.innovative-ss.com. Our code of conduct may also be obtained by contacting investor relations at (610) 646-9800. Any amendments to our code of conduct or waivers from provisions of the code for our directors and our officers will be disclosed on our Internet website promptly following the date of such amendment or waiver.
Item 11. Executive compensation.
This information will be included in our Proxy Statement relating to our Annual Meeting of Shareholders, which will be filed within 120 days after close of our fiscal year covered by this Report, and is hereby incorporated by reference to such Proxy Statement.
Item 12. Security ownership of certain beneficial owners and management and related stockholder matters.
This information will be included in our Proxy Statement relating to our Annual Meeting of Shareholders, which will be filed within 120 days after close of our fiscal year covered by this Report, and is hereby incorporated by reference to such Proxy Statement.
Equity Compensation Plan Information
The following table gives information about our common stock that may be issued upon the exercise of options and rights under all of our existing equity compensation plans and arrangements as of September 30, 2010.
Plan Category
|
Number of Securities to be issued upon exercise of outstanding options and rights |
Weighted-average exercise price of outstanding options and rights |
Number of Securities remaining available for future issuance under equity compensation plans (excluding securities reflected in second column) |
|||||||
|---|---|---|---|---|---|---|---|---|---|---|
Equity compensation plans approved by security holders |
553,538 | $ | 8.68 | 1,151,138 | ||||||
Equity compensation plans not approved by security holders |
— |
$ |
— |
— |
||||||
The 2003 Restricted Stock Plan for non-employee directors was approved by shareholders at the Company's February 26, 2004 Annual Meeting of Shareholders. The Plan called for an annual award of restricted stock having a fair market value of $25,000 as of the close of business on October 1 of the current fiscal year for all eligible non-employee directors. In fiscal year 2005 the annual award was increased to $40,000 effective the fourth quarter of the fiscal year. The stock is awarded in four installments quarterly during the fiscal year provided the director is still serving on the board on the quarterly issue date.
In the fiscal years ended September 30, 2010, 2009 and 2008, awards to our non-employee directors under the Plan were 37,862, 29,815 and 11,355 shares respectively.
65
Item 13. Certain relationships and related transactions and Director independence.
This information will be included in our Proxy Statement relating to our Annual Meeting of Shareholders, which will be filed within 120 days after close of our fiscal year covered by this Report, and is hereby incorporated by reference to such Proxy Statement.
Item 14. Principal accounting fees and services
This information will be included in our Proxy Statement relating to our Annual Meeting of Shareholders, which will be filed within 120 days after close of our fiscal year covered by this Report, and is hereby incorporated by reference to such Proxy Statement.
Item 15. Exhibits, financial statement schedules.
- (a)
- The
following documents are filed as part of this report:
- (1)
- Financial Statements
See index to Financial Statements at Item 8 on page 29 of this report.
- (2)
- Financial Statement Schedules
Schedules have been omitted because they are not applicable or are not required or the information required to be set forth therein is included in the financial statements or notes thereto.
- (3)
- The following exhibits are filed as part of, or incorporated by reference into this report:
| Exhibit Number |
Exhibit Title | |
|---|---|---|
| 3.1 | ^ | Articles of Incorporation of IS&S. |
| 3.2 $ | Bylaws of IS&S. | |
| 10.1 | *# | IS&S 1988 Incentive Stock Option Plan. |
| 10.2 | *& | IS&S 1998 Stock Option Plan. |
| 10.3 | *! | IS&S 2003 Restricted Stock Plan |
| 10.4 | *@ | Employment Agreement by and between IS&S and John C. Long dated January 28, 2008 |
| 10.5 | @ | Settlement Agreement by and between IS&S and Kollsman, Inc. dated August 27, 2008 |
| 10.6 | † | IS&S 2009 Stock-Based Incentive Compensation Plan |
| 21 | Subsidiaries of IS&S. | |
| 23.1 | Consent of Deloitte and Touche LLP. | |
| 31.1 | Certification of Chief Executive Officer pursuant to Rule 13a-14(a) | |
| 31.2 | Certification of Chief Financial Officer Pursuant to Rule 13a-14(a) | |
| 32.1 | Certification Pursuant to U.S.C. Section 1350, as Adopted Pursuant to Section 906 of the Sarbanes-Oxley Act of 2002. | |
| 99.1 | *@ | Amendment to the IS&S 1998 Stock Option Plan |
- *
- Constitutes a management contract or compensatory plan or arrangement required to be filed as an exhibit to this form.
66
- ^
- Incorporated
by reference from the Registrant's Current Report on Form 8-K filed with the Commission on September 19, 2007.
- #
- Incorporated
by reference from the Registrant's Registration Statement on Form S-1 (File No. 333-96584) filed with the
Commission on May 9, 2000, as amended.
- &
- Incorporated
by reference from the Registrant's Proxy Statement filed with the Commission on March 1, 2005.
- @
- Incorporated
by reference from the Registrant's Form 10-K filed with the Commission for fiscal year 2008.
- †
- Incorporated
by reference from the Registrant's Proxy Statement filed with the Commission on January 28, 2009.
- !
- Incorporated
by reference from the Registrant's Proxy Statement filed with the Commission on January 26, 2004
- $
- Incorporated by reference from the Registrant's Quarterly Report on Form 10-Q filed with the Commission on August 6, 2010.
67
Pursuant to the requirements of Section 13 or 15(d) of the Securities Exchange Act of 1934, the Registrant has duly caused this report to be signed on its behalf by the undersigned, thereunto duly authorized.
| |
|
|
||
|---|---|---|---|---|
| INNOVATIVE SOLUTIONS AND SUPPORT, INC. | ||||
By: |
/s/ GEOFFREY S. M. HEDRICK Geoffrey S. M. Hedrick Chairman & Chief Executive Officer |
|||
Dated: December 14, 2010 |
||||
Pursuant to the requirements of the Securities Exchange Act of 1934, this report has been signed by the following persons on behalf of the Registrant and in the capacities and on the dates indicated.
Signature
|
Title
|
Date
|
||
|---|---|---|---|---|
| /s/ GEOFFREY S. M. HEDRICK Geoffrey S. M. Hedrick |
Chairman & Chief Executive Officer | December 14, 2010 | ||
/s/ ROMAN G. PTAKOWSKI Roman G. Ptakowski |
President |
December 14, 2010 |
||
/s/ RONALD C. ALBRECHT Ronald C. Albrecht |
Chief Financial Officer (Principal Accounting Officer) |
December 14, 2010 |
||
/s/ GLEN R. BRESSNER Glen R. Bressner |
Director |
December 14, 2010 |
||
/s/ WINSTON J. CHURCHILL Winston J. Churchill |
Director |
December 14, 2010 |
||
/s/ ROBERT MIONIS Robert Mionis |
Director |
December 14, 2010 |
||
/s/ ROBERT E. MITTELSTAEDT, JR. Robert E. Mittelstaedt, Jr. |
Director |
December 14, 2010 |
||
/s/ ROBERT H. RAU Robert H. Rau |
Director |
December 14, 2010 |
68