Attached files
| file | filename |
|---|---|
| 8-K - FORM 8-K - ANDEAVOR | d78315e8vk.htm |
| EX-99.2 - EX-99.2 - ANDEAVOR | d78315exv99w2.htm |
Exhibit 99.1
| Analyst Day Monday, December 13, 2010 Greg Goff President and CEO, Tesoro Corporation |
| Forward Looking Statements This Presentation includes forward-looking statements within the meaning of the Private Securities Litigation Reform Act of 1995. These statements relate to, among other things, projections of refining margins, debt reduction, cash flows and capital expenditures. We have used the words "anticipate", "believe", "could", "estimate", "expect", "intend", "may", "plan", "predict", "pro ject", "should", "will" and similar terms and phrases to identify forward-looking statements in this Presentation. Although we believe the assumptions upon which these forward-looking statements are based are reasonable, any of these assumptions could prove to be inaccurate and the forward-looking statements based on these assumptions could be incorrect. Our operations involve risks and uncertainties, many of which are outside our control, and any one of which, or a combination of which, could materially affect our results of operations and whether the forward-looking statements ultimately prove to be correct. Actual results and trends in the future may differ materially from those suggested or implied by the forward-looking statements depending on a variety of factors which are described in greater detail in our filings with the SEC. All future written and oral forward-looking statements attributable to us or persons acting on our behalf are expressly qualified in their entirety by the previous statements. We undertake no obligation to update any information contained herein or to publicly release the results of any revisions to any forward-looking statements that may be made to reflect events or circumstances that occur, or that we become aware of, after the date of this Presentation. 2 |
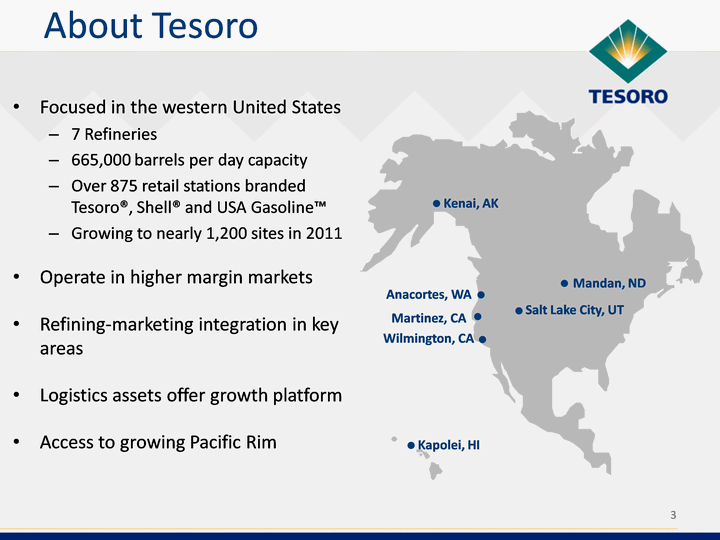
| Focused in the western United States 7 Refineries 665,000 barrels per day capacity Over 875 retail stations branded Tesoro(r), Shell(r) and USA Gasoline(tm) Growing to nearly 1,200 sites in 2011 Operate in higher margin markets Refining-marketing integration in key areas Logistics assets offer growth platform Access to growing Pacific Rim About Tesoro Kenai, AK Mandan, ND Salt Lake City, UT Anacortes, WA Martinez, CA Wilmington, CA Kapolei, HI 3 |

| Anacortes safely restarted; at planned rates Insurance recoveries underway Solid earnings in the 2nd and 3rd quarters despite weaker margins and downtime Implemented $120 - $140 million in overhead and benefit cost reductions Announced intention to form logistics MLP Completed comprehensive review of business, developed plans to improve all assets Restructured organization to support business strategy 2010 Highlights 4 Anacortes, WA |
| Cautiously optimistic about improving market conditions Opportunity to drive significant value from existing assets, despite margins Our strategic priorities are clear, our plan is focused and the organization is aligned Delivery will drive financial strength and position Tesoro as an industry leader Enthusiastic about our future 5 Key Messages |
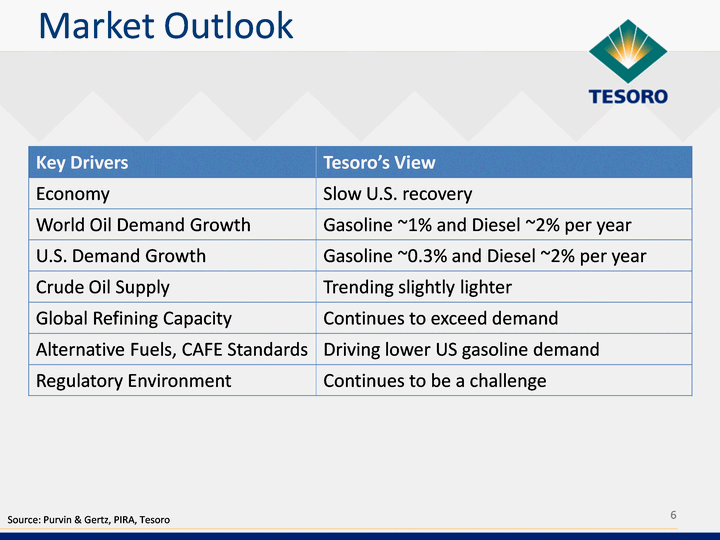
| 6 Market Outlook Key Drivers Tesoro's View Economy Slow U.S. recovery World Oil Demand Growth Gasoline ~1% and Diesel ~2% per year U.S. Demand Growth Gasoline ~0.3% and Diesel ~2% per year Crude Oil Supply Trending slightly lighter Global Refining Capacity Continues to exceed demand Alternative Fuels, CAFE Standards Driving lower US gasoline demand Regulatory Environment Continues to be a challenge Source: Purvin & Gertz, PIRA, Tesoro |
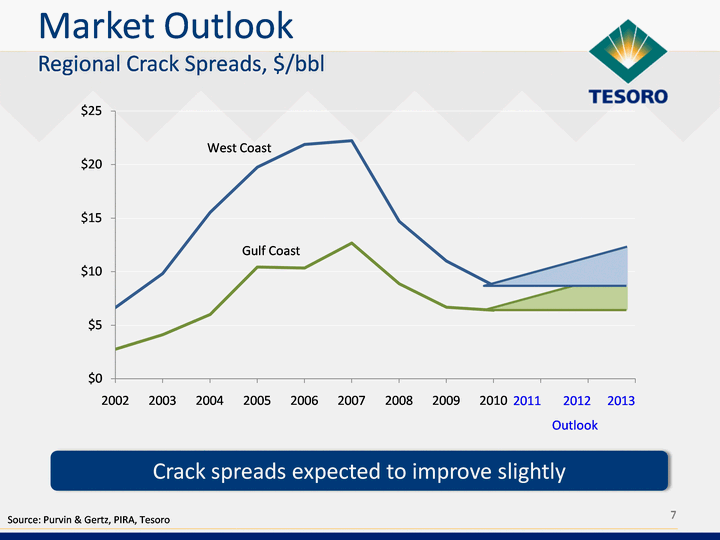
| (CHART) 7 Crack spreads expected to improve slightly Outlook Market Outlook Regional Crack Spreads, $/bbl Gulf Coast Source: Purvin & Gertz, PIRA, Tesoro 2011 2012 2013 |
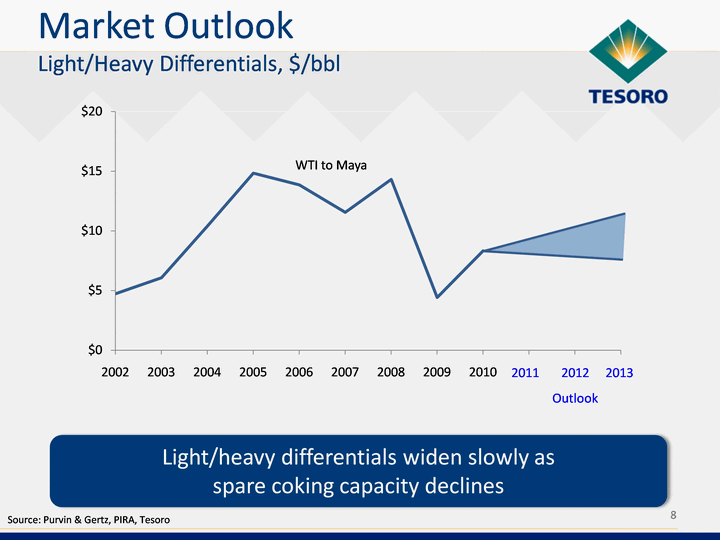
| (CHART) 8 Light/heavy differentials widen slowly as spare coking capacity declines Outlook Market Outlook Light/Heavy Differentials, $/bbl WTI to Maya Source: Purvin & Gertz, PIRA, Tesoro 2011 2012 2013 |
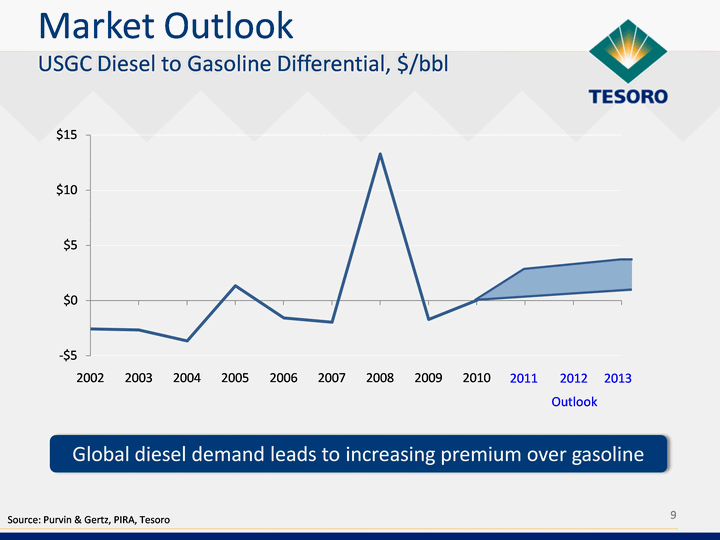
| (CHART) 9 Global diesel demand leads to increasing premium over gasoline Market Outlook USGC Diesel to Gasoline Differential, $/bbl Outlook Source: Purvin & Gertz, PIRA, Tesoro 2011 2012 2013 |
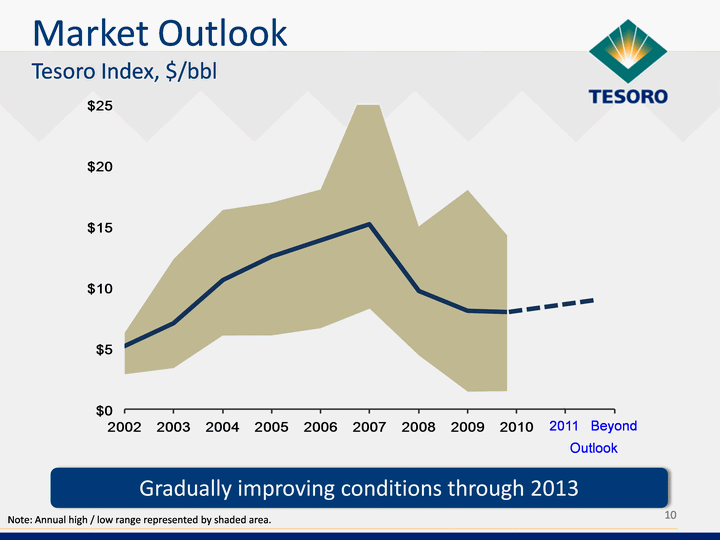
| Market Outlook Tesoro Index, $/bbl 10 Gradually improving conditions through 2013 Note: Annual high / low range represented by shaded area. 2011 Beyond Outlook |
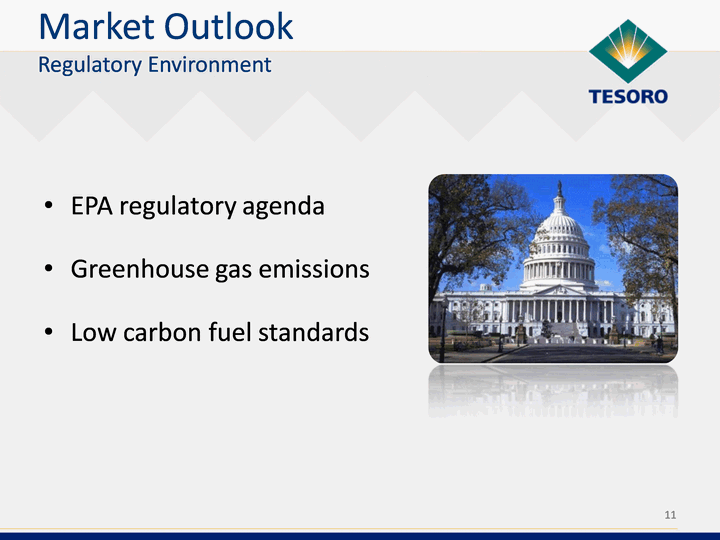
| EPA regulatory agenda Greenhouse gas emissions Low carbon fuel standards 11 Market Outlook Regulatory Environment |
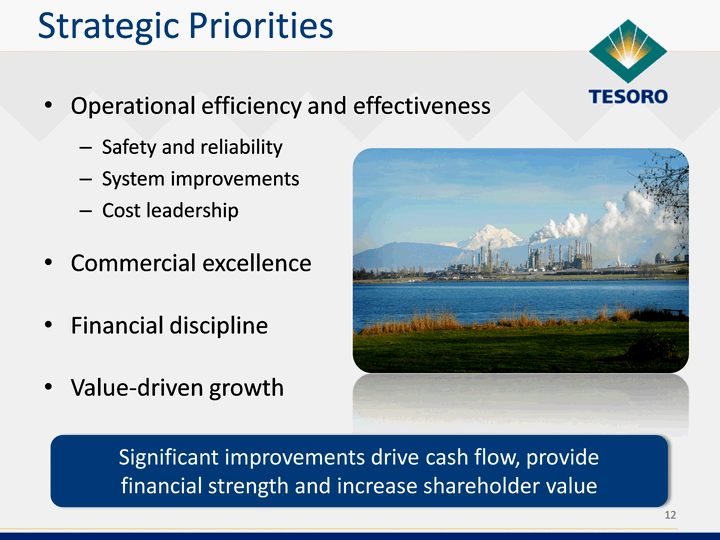
| Operational efficiency and effectiveness Safety and reliability System improvements Cost leadership Commercial excellence Financial discipline Value-driven growth Strategic Priorities 12 Significant improvements drive cash flow, provide financial strength and increase shareholder value |
| 13 Operational Efficiency & Effectiveness People and Process Safety Improving asset integrity and personal safety OSHA's Voluntary Protection Program (VPP) DuPont assessment of process safety practices underway BakerRisk inspection program review underway Fluor hydroprocessing review |
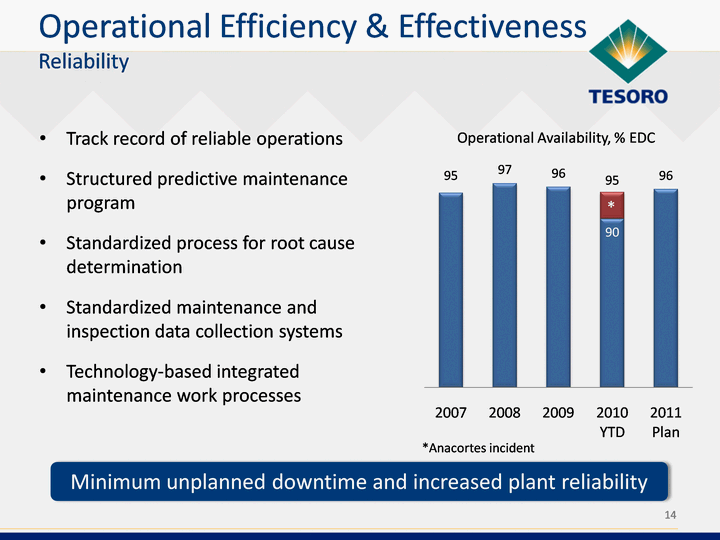
| Track record of reliable operations Structured predictive maintenance program Standardized process for root cause determination Standardized maintenance and inspection data collection systems Technology-based integrated maintenance work processes 14 (CHART) Operational Efficiency & Effectiveness Reliability Operational Availability, % UEDC Minimum unplanned downtime and increased plant reliability * *Anacortes incident |
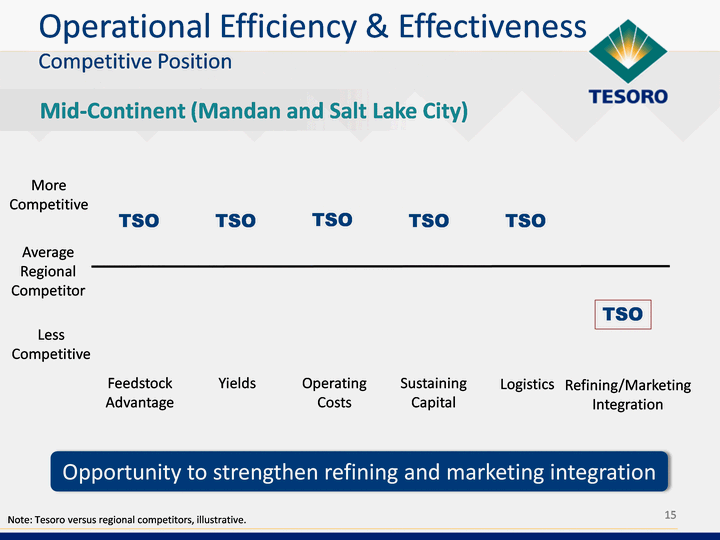
| 15 Mid-Continent (Mandan and Salt Lake City) Operational Efficiency & Effectiveness Competitive Position Opportunity to strengthen refining and marketing integration (CHART) TSO TSO TSO TSO TSO TSO Note: Tesoro versus regional competitors, illustrative. Less Competitive More Competitive Average Regional Competitor Feedstock Advantage Yields Operating Costs Sustaining Capital Logistics Refining/Marketing Integration |
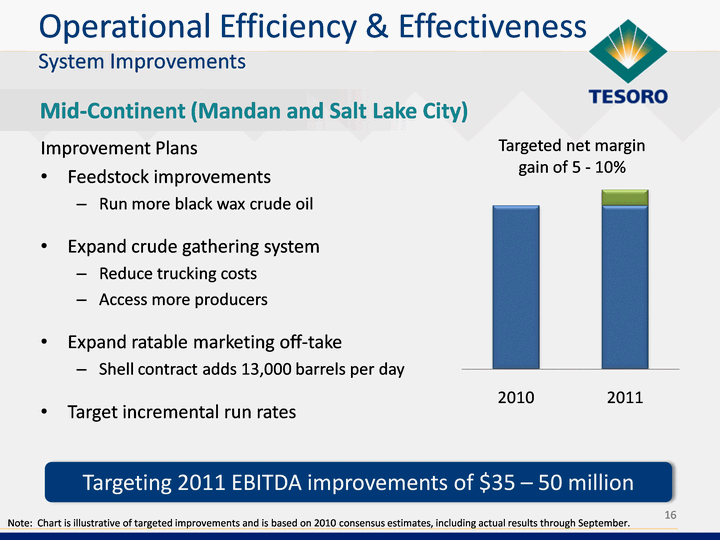
| 16 Mid-Continent (Mandan and Salt Lake City) Targeting 2011 EBITDA improvements of $35 - 50 million Operational Efficiency & Effectiveness System Improvements (CHART) Improvement Plans Feedstock improvements Run more black wax crude oil Expand crude gathering system Reduce trucking costs Access more producers Expand ratable marketing off-take Shell contract adds 13,000 barrels per day Target incremental run rates Targeted net margin gain of 5 - 10% Note: Chart is illustrative of targeted improvements and is based on 2010 consensus estimates, including actual results through September. |
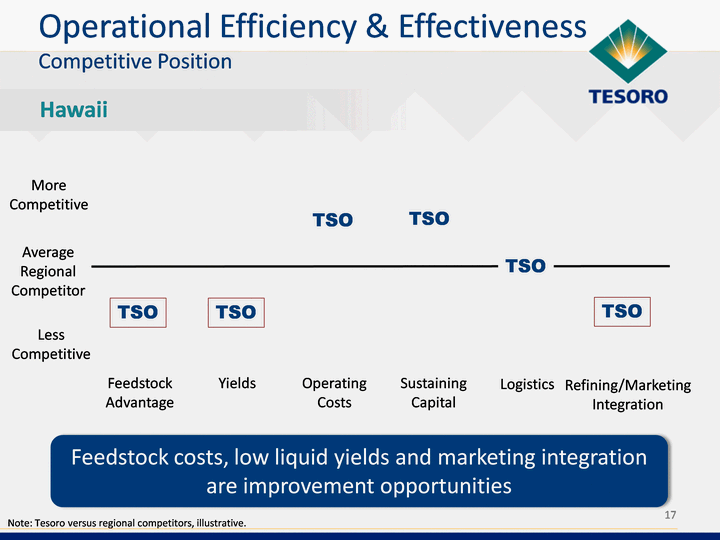
| 17 Hawaii (CHART) Operational Efficiency & Effectiveness Competitive Position Feedstock costs, low liquid yields and marketing integration are improvement opportunities TSO TSO TSO TSO TSO Note: Tesoro versus regional competitors, illustrative. Less Competitive More Competitive Average Regional Competitor Feedstock Advantage Yields Operating Costs Sustaining Capital Logistics Refining/Marketing Integration TSO |
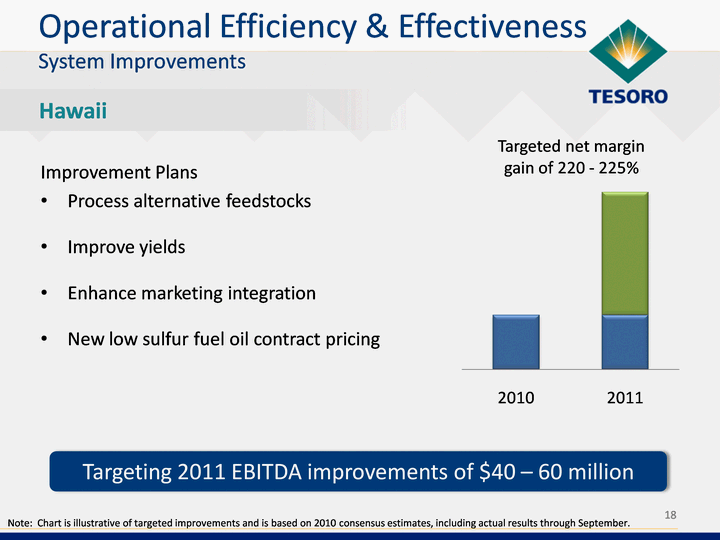
| 18 Hawaii Targeting 2011 EBITDA improvements of $40 - 60 million Operational Efficiency & Effectiveness System Improvements (CHART) Improvement Plans Process alternative feedstocks Improve yields Enhance marketing integration New low sulfur fuel oil contract pricing Targeted net margin gain of 220 - 225% Note: Chart is illustrative of targeted improvements and is based on 2010 consensus estimates, including actual results through September. |
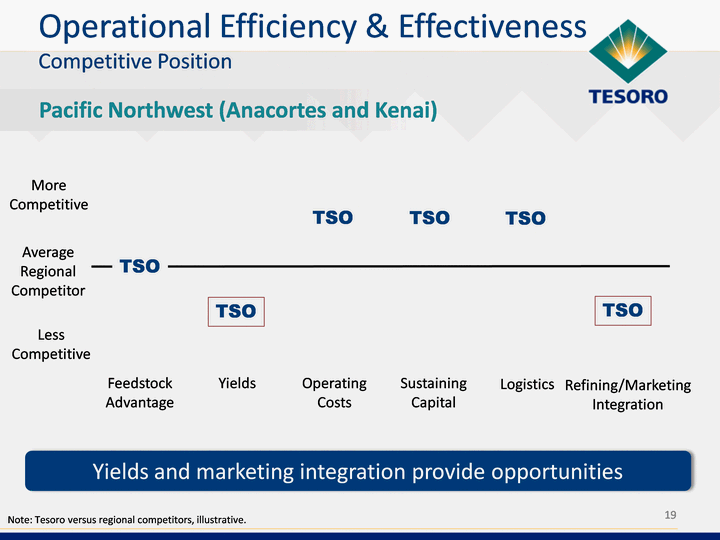
| 19 Pacific Northwest (Anacortes and Kenai) Yields and marketing integration provide opportunities Operational Efficiency & Effectiveness Competitive Position (CHART) TSO TSO TSO TSO TSO Note: Tesoro versus regional competitors, illustrative. Less Competitive More Competitive Average Regional Competitor Feedstock Advantage Yields Operating Costs Sustaining Capital Logistics Refining/Marketing Integration TSO |
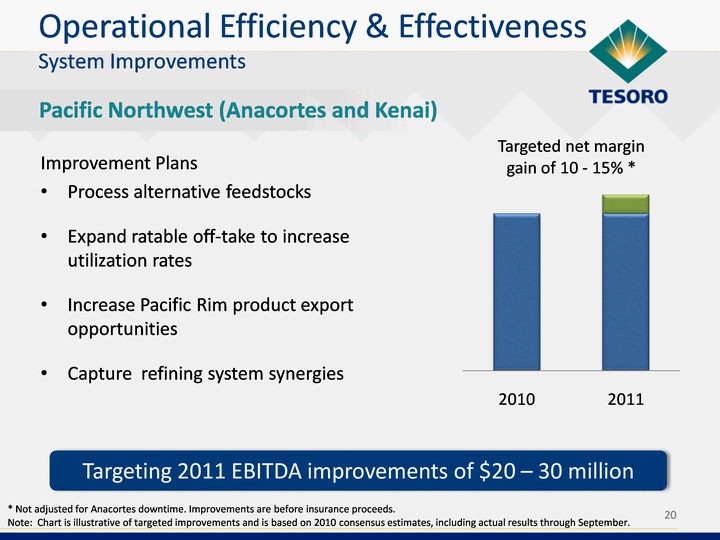
| 20 Pacific Northwest (Anacortes and Kenai) Targeting 2011 EBITDA improvements of $20 - 30 million Operational Efficiency & Effectiveness System Improvements (CHART) Improvement Plans Process alternative feedstocks Expand ratable off-take to increase utilization rates Increase Pacific Rim product export opportunities Capture refining system synergies Targeted net margin gain of 10 - 15% * * Not adjusted for Anacortes downtime. Improvements are before insurance proceeds. Note: Chart is illustrative of targeted improvements and is based on 2010 consensus estimates, including actual results through September. |
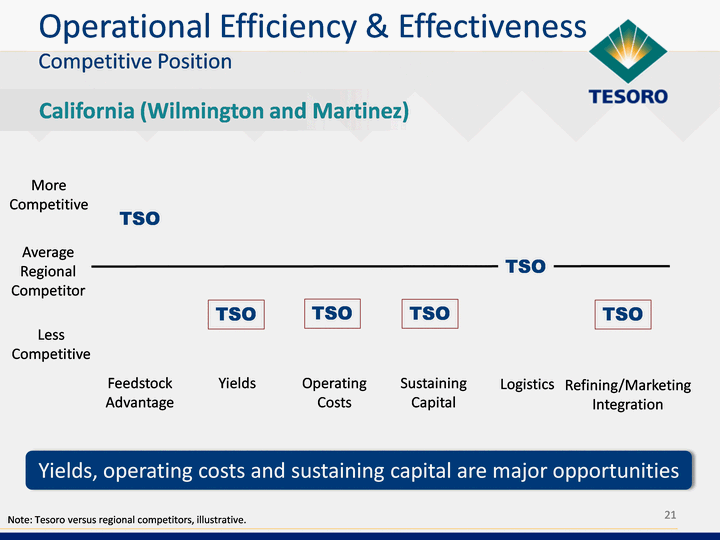
| 21 California (Wilmington and Martinez) Yields, operating costs and sustaining capital are major opportunities Operational Efficiency & Effectiveness Competitive Position (CHART) TSO TSO TSO TSO TSO Note: Tesoro versus regional competitors, illustrative. Less Competitive More Competitive Average Regional Competitor Feedstock Advantage Yields Operating Costs Sustaining Capital Logistics Refining/Marketing Integration TSO |
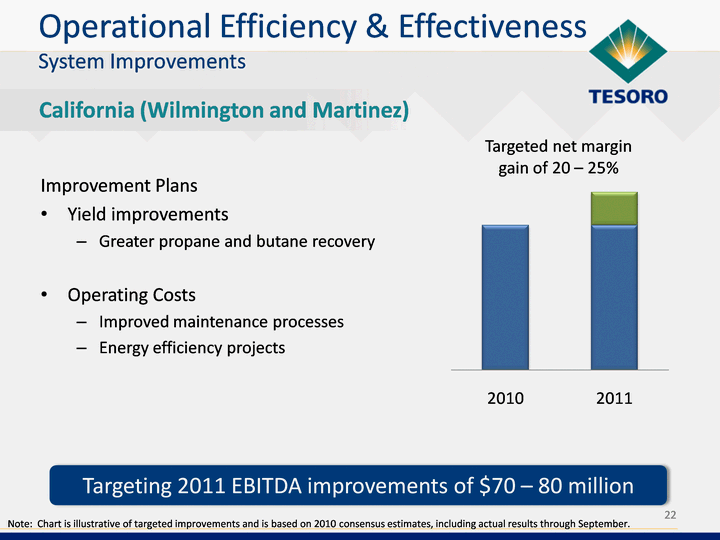
| 22 California (Wilmington and Martinez) (CHART) Targeting 2011 EBITDA improvements of $70 - 80 million Operational Efficiency & Effectiveness System Improvements Improvement Plans Yield improvements Greater propane and butane recovery Operating Costs Improved maintenance processes Energy efficiency projects Targeted net margin gain of 20 - 25% Note: Chart is illustrative of targeted improvements and is based on 2010 consensus estimates, including actual results through September. |
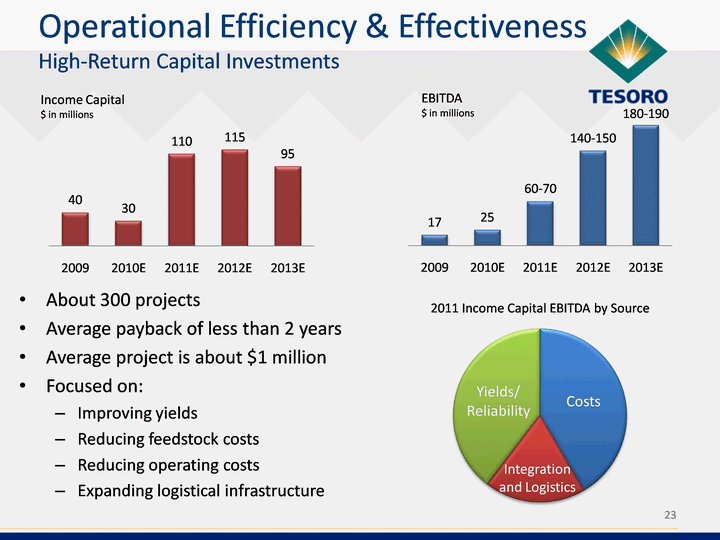
| About 300 projects Average payback of less than 2 years Average project is about $1 million Focused on: Improving yields Reducing feedstock costs Reducing operating costs Expanding logistical infrastructure 23 23 (CHART) Income Capital $ in millions (CHART) EBITDA $ in millions Operational Efficiency & Effectiveness High-Return Capital Investments (CHART) Integration and Logistics Yields/ Reliability Costs |
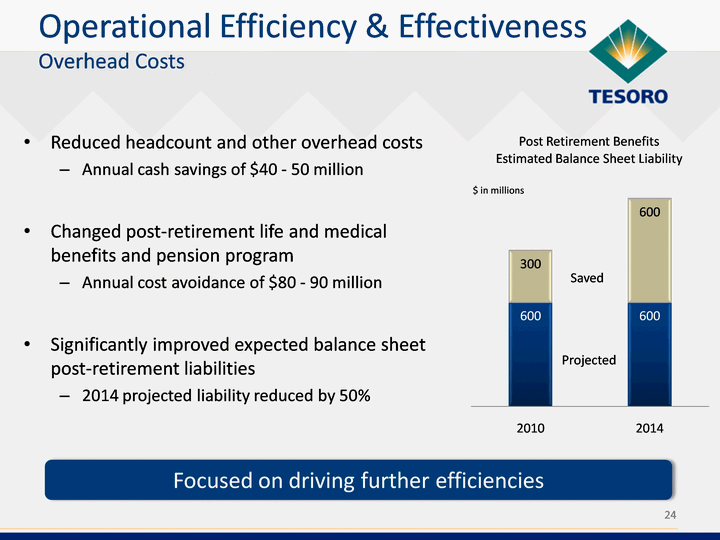
| Reduced headcount and other overhead costs Annual cash savings of $40 - 50 million Changed post-retirement life and medical benefits and pension program Annual cost avoidance of $80 - 90 million Significantly improved expected balance sheet post-retirement liabilities 2014 projected liability reduced by 50% 24 (CHART) Projected Saved Focused on driving further efficiencies Operational Efficiency & Effectiveness Overhead Costs |
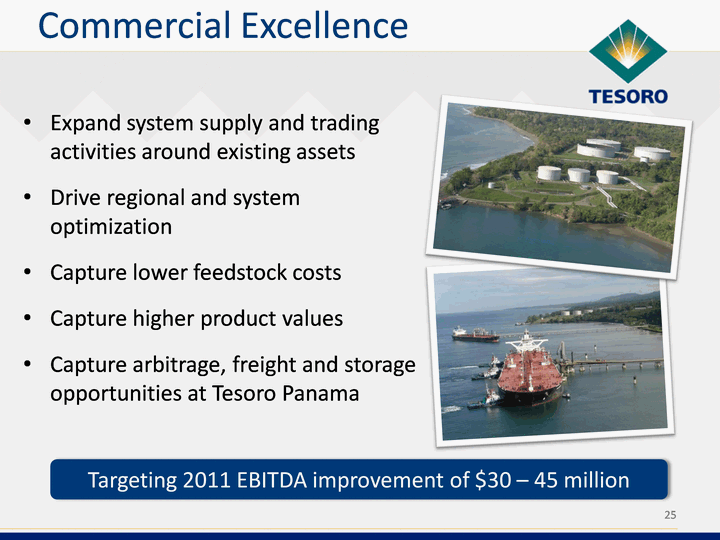
| Expand system supply and trading activities around existing assets Drive regional and system optimization Capture lower feedstock costs Capture higher product values Capture arbitrage, freight and storage opportunities at Tesoro Panama 25 Commercial Excellence Targeting 2011 EBITDA improvement of $30 - 45 million |
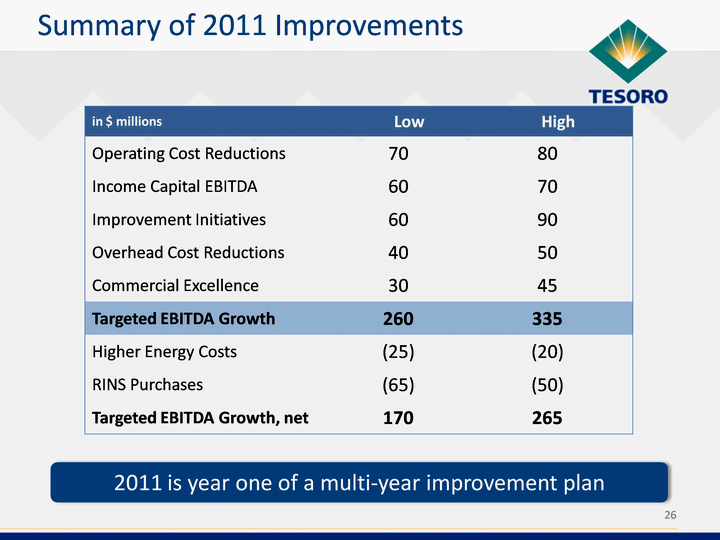
| 26 in $ millions Low High Operating Cost Reductions 70 80 Income Capital EBITDA 60 70 Improvement Initiatives 60 90 Overhead Cost Reductions 40 50 Commercial Excellence 30 45 Targeted EBITDA Growth 260 335 Higher Energy Costs (25) (20) RINS Purchases (65) (50) Targeted EBITDA Growth, net 170 265 2011 is year one of a multi-year improvement plan Summary of 2011 Improvements |
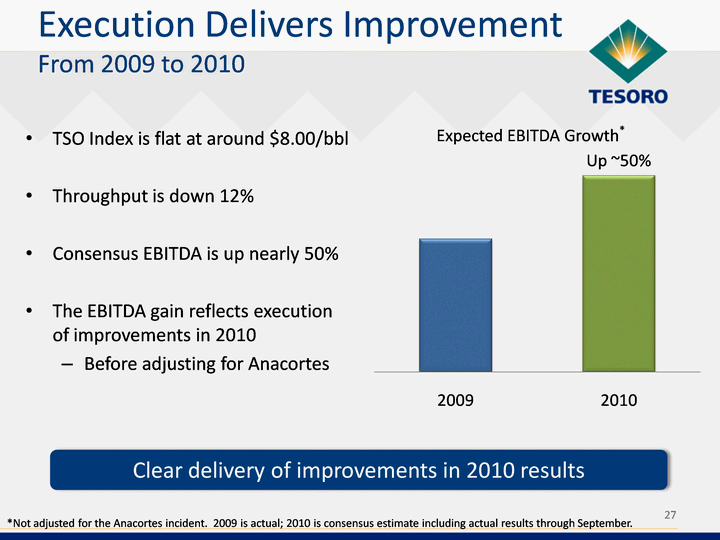
| 27 Execution Delivers Improvement From 2009 to 2010 (CHART) Expected EBITDA Growth* *Not adjusted for the Anacortes incident. 2009 is actual; 2010 is consensus estimate including actual results through September. TSO Index is flat at around $8.00/bbl Throughput is down 12% Consensus EBTIDA is up nearly 50% The EBITDA gain reflects execution of improvements in 2010 Before adjusting for Anacortes Clear delivery of improvements in 2010 results Up ~50% |
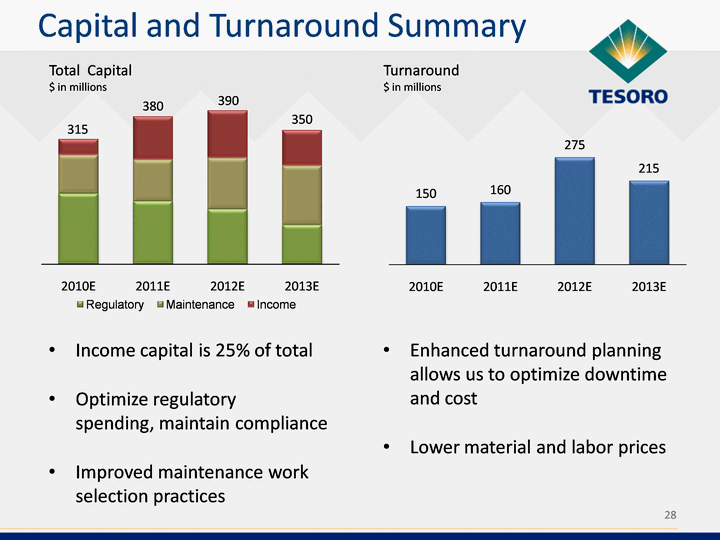
| Income capital is 25% of total Optimize regulatory spending, maintain compliance Improved maintenance work selection practices Capital and Turnaround Summary 28 (CHART) Total Capital $ in millions (CHART) Turnaround $ in millions Enhanced turnaround planning allows us to optimize downtime and cost Lower material and labor prices 315 380 390 350 |
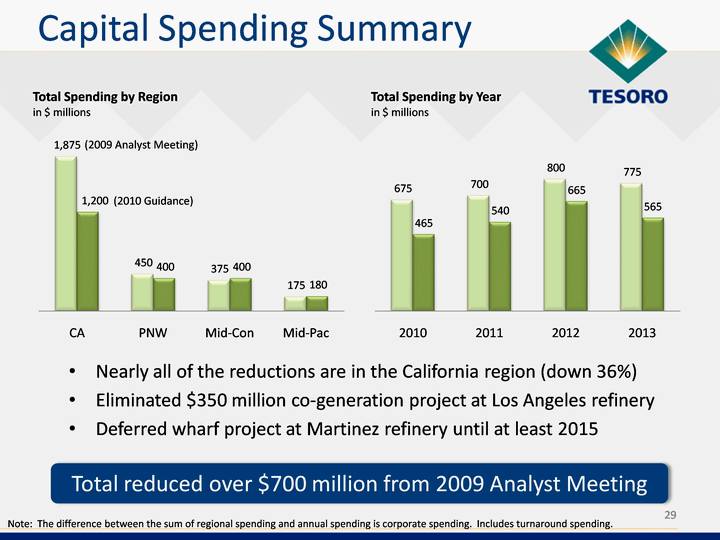
| Capital Spending Summary (CHART) (CHART) Total Spending by Year in $ millions Total Spending by Region in $ millions (2009 Analyst Meeting) (2010 Guidance) Nearly all of the reductions are in the California region (down 36%) Eliminated $350 million co-generation project at Los Angeles refinery Deferred wharf project at Martinez refinery until at least 2015 29 Total reduced over $700 million from 2009 Analyst Meeting Note: The difference between the sum of regional spending and annual spending is corporate spending. Includes turnaround spending. |
| Exercise capital discipline Reduce total debt to total capitalization Strengthen the balance sheet Drive towards investment-grade credit rating 30 Financial Discipline |
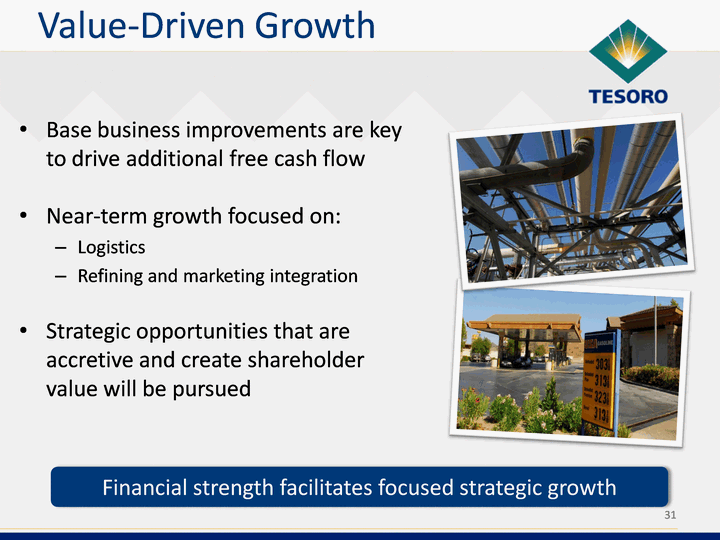
| Value-Driven Growth 31 Financial strength facilitates focused strategic growth Base business improvements are key to drive additional free cash flow Near-term growth focused on: Logistics Refining and marketing integration Strategic opportunities that are accretive and create shareholder value will be pursued |
| This slide intentionally left blank 32 Tesoro Logistics MLP |

| Ratable, secure off-take allows increased refinery utilization Shifts barrels into higher netback channels of trade Achieve greater integration with minimal capital 33 Refining and Marketing Integration Focused, targeted marketing growth, highly accretive |
| Clear and focused strategy Well understood values Relentless focus on results Clear accountability Incentive compensation directly tied to value creation Strong, committed leadership team 34 Capability to Deliver Superior Execution |
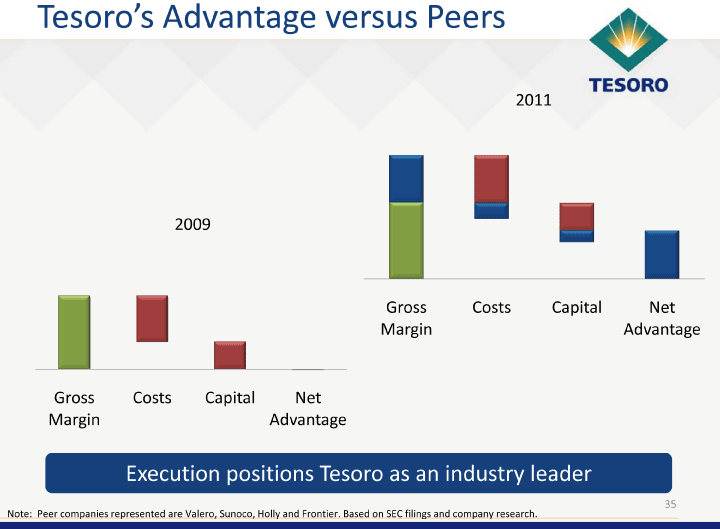
| 35 2009 Note: Peer companies represented are Valero, Sunoco, Holly and Frontier. Based on SEC filings and company research. Tesoro's Advantage versus Peers Execution positions Tesoro as an industry leader 2011 (CHART) (CHART) |
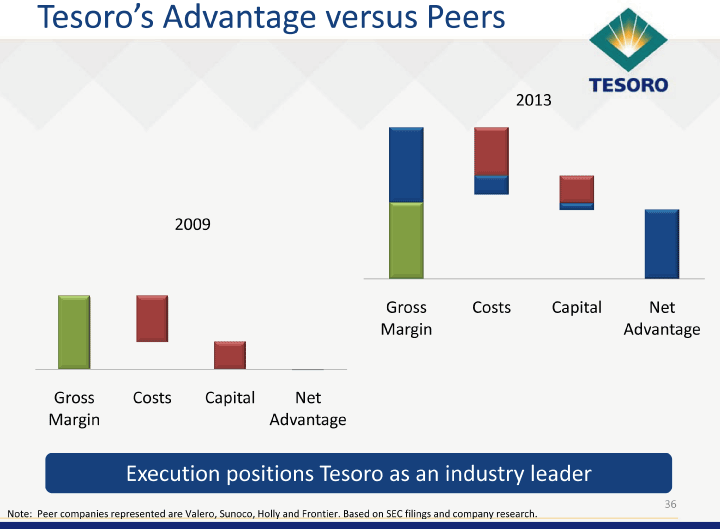
| 36 2009 Note: Peer companies represented are Valero, Sunoco, Holly and Frontier. Based on SEC filings and company research. Tesoro's Advantage versus Peers Execution positions Tesoro as an industry leader 2013 (CHART) (CHART) |
| Targeting over $200 million of improvements in 2011 Capital spending reduced $700 million over 4 years versus 2009 plan Focused on driving operating efficiency and effectiveness Improvements deliver significant free cash flow Our strategic priorities are clear, our plan is focused and the organization is aligned 37 Becoming an Industry Leader We are committed to driving shareholder value |
