Attached files
Table of Contents
UNITED STATES
SECURITIES AND EXCHANGE COMMISSION
Washington, D.C. 20549
FORM 10-K
(Mark One)
| x | ANNUAL REPORT PURSUANT TO SECTION 13 or 15(d) OF THE SECURITIES EXCHANGE ACT OF 1934 |
For the fiscal year ended September 30, 2010
OR
| ¨ | TRANSITION REPORT PURSUANT TO SECTION 13 OR 15(d) OF THE SECURITIES EXCHANGE ACT OF 1934 |
For the transition period from to
Commission file number 0-23084
INTEGRATED SILICON SOLUTION, INC.
(Exact name of Registrant as specified in its charter)
| Delaware | 77-0199971 | |
| (State or other jurisdiction of incorporation or organization) |
(I.R.S. Employer Identification No.) | |
| 1940 Zanker Road, San Jose, California | 95112 | |
| (Address of principal executive offices) | (zip code) | |
Registrant’s telephone number, including area code (408) 969-6600
Securities registered pursuant to Section 12(b) of the Act:
| Title of each class | Name of each exchange on which registered | |
| Common Stock, par value $0.0001 per share | Nasdaq Global Market |
Securities registered pursuant to Section 12(g) of the Act:
None
(Title of Class)
Indicate by check mark whether the registrant is a well-known seasoned issuer, as defined in Rule 405 of the Securities Act. Yes ¨ No x
Indicate by check mark if the registrant is not required to file reports pursuant to Section 13 or Section 15(d) of the Act. Yes ¨ No x
Indicate by check mark whether the registrant (1) has filed all reports required to be filed by Section 13 or 15(d) of the Securities Exchange Act of 1934 during the preceding 12 months (or for such shorter period that the registrant was required to file such reports), and (2) has been subject to such filing requirements for the past 90 days. Yes x No ¨
Indicate by check mark whether the registrant has submitted electronically and posted on its corporate Website, if any, every Interactive Data File required to be submitted and posted pursuant to Rule 405 of Regulation S-T (§232.405 of this chapter) during the preceding 12 months (or for such shorter period that the registrant was required to submit and post such files). Yes ¨ No ¨
Indicate by check mark if disclosure of delinquent filers pursuant to Item 405 of Regulation S-K is not contained herein, and will not be contained, to the best of registrant’s knowledge, in definitive proxy or information statements incorporated by reference in Part III of this Form 10-K or any amendment to this Form 10-K. x
Indicate by check mark whether the registrant is a large accelerated filer, an accelerated filer, a non-accelerated filer or a smaller reporting company. See definitions of “large accelerated filer,” “accelerated filer” and “smaller reporting company” in Rule 12b-2 of the Exchange Act. (Check one):
Large accelerated filer ¨ Accelerated filer x Non-accelerated filer ¨ Smaller reporting company ¨
Indicate by check mark whether the registrant is a shell company (as defined in Rule 12b-2 of the Exchange Act). Yes ¨ No x
The aggregate market value of the common stock held by non-affiliates of the registrant, based upon the price at which the registrant’s Common Stock was last sold as of March 31, 2010 (the last business day of the registrant’s second quarter of fiscal 2010), was approximately $217.1 million. Shares of Common Stock held by each officer and director and by each person who owns 5% or more of the outstanding Common Stock have been excluded in that such persons may be deemed to be affiliates. This determination of affiliate status is not necessarily a conclusive determination for other purposes.
The number of outstanding shares of the registrant’s Common Stock on December 3, 2010 was 26,339,358.
DOCUMENTS INCORPORATED BY REFERENCE
Portions of the Proxy Statement for the Registrant’s 2011 Annual Meeting of Stockholders are incorporated by reference in Part III of this Form 10-K.
Table of Contents
| 1 | ||||||
| PART I | ||||||
| Item 1. |
2 | |||||
| Item 1A. |
11 | |||||
| Item 1B. |
22 | |||||
| Item 2. |
22 | |||||
| Item 3. |
22 | |||||
| Item 4. |
22 | |||||
| PART II | ||||||
| Item 5. |
23 | |||||
| Item 6. |
25 | |||||
| Item 7. |
Management’s Discussion and Analysis of Financial Condition and Results of Operations |
26 | ||||
| Item 7A. |
35 | |||||
| Item 8. |
36 | |||||
| Item 9. |
Changes in and Disagreements with Accountants on Accounting and Financial Disclosure |
72 | ||||
| Item 9A. |
72 | |||||
| Item 9B. |
73 | |||||
| PART III | ||||||
| Item 10. |
74 | |||||
| Item 11. |
74 | |||||
| Item 12. |
Security Ownership of Certain Beneficial Owners and Management and Related Stockholder Matters |
74 | ||||
| Item 13. |
Certain Relationships and Related Transactions, and Director Independence |
74 | ||||
| Item 14. |
74 | |||||
| PART IV | ||||||
| Item 15. |
75 | |||||
| 77 | ||||||
References in this Annual Report on Form 10-K to “we,” “us,” “our” and “ISSI” mean Integrated Silicon Solution, Inc. and all entities owned or controlled by Integrated Silicon Solution, Inc.
All brand names, trademarks and trade names referred to in this report are the property of their respective holders.
Table of Contents
SPECIAL NOTE REGARDING FORWARD-LOOKING STATEMENTS
We have made forward-looking statements in this report that are subject to risks and uncertainties. Forward-looking statements include information concerning possible or assumed future results of our operations. Also, when we use words such as “believes,” “expects,” “anticipates” or similar expressions, we are making forward-looking statements. You should note that an investment in our securities involves certain risks and uncertainties that could affect our future results. Our actual results could differ materially from those anticipated in our forward-looking statements as a result of certain factors, including those set forth in “Risk Factors” beginning on page 11 and elsewhere in this report.
We believe it is important to communicate our expectations to our investors. However, there may be events in the future that we are not able to predict accurately or over which we have no control. The risks described in “Risk Factors” included in this report, as well as any other cautionary language in this report, provide examples of risks, uncertainties and events that may cause our actual results to differ materially from the expectations we describe in our forward-looking statements. Before you invest in our common stock, you should be aware that the occurrence of the events described in “Risk Factors” and elsewhere in this report could harm our business and adversely affect our results.
All forward-looking statements made by us are expressly qualified in their entirety by the Risk Factors and other cautionary statements set forth in this report. Except as required by federal securities laws, we undertake no obligation to update any forward-looking statement, whether as a result of new information, future events, or otherwise.
1
Table of Contents
Overview
We are a fabless semiconductor company that designs and markets high performance integrated circuits for the following key markets: (I) digital consumer electronics, (ii) networking and telecommunications, (iii) mobile communications, (iv) automotive electronics and (v) industrial applications. Our primary products are low and medium density DRAM in both package and Known Good Die (KGD) form and high speed and low power SRAM. In fiscal 2010, approximately 90% of our revenue was derived from our DRAM and SRAM products. We target large markets with our cost-effective, high quality semiconductor products and seek to build long-term relationships with our customers. A key part of our strategy is to offer a long-term commitment supplying many of the legacy DRAM and SRAM memories that are of less interest to many of our competitors. Our customers frequently cite our commitment to long-term supply of these memories as one reason they buy products from ISSI.
In January 2010, we formed a separate business unit, Giantec Semiconductor, Inc. (Giantec). As part of this formation, Shanghai Zhang Jiang Science & Technology Investment Corporation invested approximately $3.8 million in Giantec. We still own more than 50% of Giantec and, as such, continue to consolidate the financial results of Giantec. Giantec is actively seeking additional equity investment and in the event such investment is obtained, our ownership could be less than 50%, in which case we would no longer consolidate Giantec. Through our Giantec business unit, we design and market application specific standard products (ASSP) primarily EEPROMs and SmartCards focused on our key markets.
Our outsourced manufacturing model is based upon relationships with key foundries such as GlobalFoundries Inc., Hynix, IBM, Nanya, Powerchip, ProMOS Technologies Inc. (ProMOS), Taiwan Semiconductor Manufacturing Corporation (TSMC), and Semiconductor Manufacturing International Corporation (SMIC). We have an established presence in the important Asian market that includes our design groups in Shanghai, China, Hsinchu, Taiwan and Songham, Korea. These locations also have product engineering, sales and marketing, quality assurance, production control, and other operating functions. Our worldwide headquarters are in San Jose, California.
Our customers include leaders in each of our five target markets, including LG Electronics, NEC, Sharp, Panasonic, Samsung, Sony, and Toshiba in digital consumer electronics; Alcatel-Lucent, Cisco, Foxconn, Fujitsu, Huawei Technologies, Polycom, Tellabs, UT Starcom and ZTE in networking and telecommunications; Ericsson, Garmin, LG Electronics, Motorola, Nokia Siemens, and VTech in mobile communications; Bosch, Bose, Continental, Delphi, Harman Becker, Hyundai Mobis, Johnson Controls, Kenwood, Panasonic, Philips (PLDS), and TRW in automotive electronics; and General Electric, Hypercom, Ingenico, Philips, Siemens, Schneider and Tyco in industrial applications. Due to their significant size and market influence, these customers generally drive memory volumes in their market segments and help define the direction of future memory needs.
Company Background
We were incorporated in California in October 1988 and changed our state of incorporation to Delaware in August 1993. We have one operating segment which is to design, develop and market high performance DRAM and SRAM and other memory and non-memory semiconductor products. Our principal executive offices are located at 1940 Zanker Road, San Jose, California 95112, and our telephone number is (408) 969-6600. On our Investor Relations web site, located at www.issi.com, we post the following filings as soon as reasonably practicable after they are electronically filed with or furnished to the Securities and Exchange Commission: our annual report on Form 10-K, our quarterly reports on Form 10-Q, our current reports on Form 8-K and any amendments to those reports filed or furnished pursuant to Section 13(a) or 15(d) of the Securities Exchange Act of 1934. All such documents on our Investor Relations web site are available free of charge.
2
Table of Contents
Market Background
In recent years, the need for sophisticated semiconductor memory architecture has expanded beyond the PC market and into electronic systems in a wide variety of markets, including digital consumer electronics, networking, telecommunications, mobile communications, automotive electronics and industrial applications. Advances in technology have allowed for increasingly complex digital consumer systems, set-top boxes, digital cameras and HDTVs. Significant memory content is often required in these products to manage large amounts of data that create images and sounds in a digital format. As a result, virtually all electronic systems incorporate semiconductor memory devices to enable and enhance system performance.
As more consumers and businesses utilize the internet and broadband communications networks, the demand for networking products has accelerated. Consumers and businesses require high speed access to internet content and other services to transmit and receive large amounts of data, such as highly graphical web sites, MP3 audio files, HD video and streaming multimedia applications. The numerous and complex applications that facilitate connections within networking and broadband products, such as cable and DSL modems, switches and routers, require optimized high speed memory architectures to maximize bus bandwidth and speed data transfer.
Mobile communication products have gained broad acceptance among consumers. Applications for cellular communications, wireless local area networks (WLAN) and global positioning systems (GPS) are increasingly able to access a wide range of data services, from internet connectivity to location detection, and are delivering information to consumers through sophisticated mobile products. Mobile products connect without wires to a base station that receives and sends data or voice to the mobile device. As more data and user content is accessed and stored on the mobile devices, advanced memory is required to store and access this information in the mobile products. As 3G and 4G mobile broadband services proliferate, the volume of data is expected to increase significantly, and memory will play a crucial role in ensuring quality of service in the mobile infrastructure market.
The complexity of automobile electronics is also increasing rapidly. The significant increase in automotive electronic applications has resulted in an increase in microcontrollers and memory responsible for delivering control and command functionality. Automobile designers are increasing semiconductor content in automobiles to allow for improved telematics, digital audio and video entertainment systems, advanced safety features and powertrain functions such as engine control and fuel efficiency management systems. These systems require memory devices that meet the automotive industry’s high quality and reliability standards.
The industrial memory market matches our strategy of providing long-term customer support. Memory products are used in various industrial applications such as power management, imaging, point of sale terminals, bar code scanners, smart meters, instrumentation and data acquisition systems. We have a wide range of DRAM, SRAM and EEPROM products that meet the needs of the industrial market segment.
Integrated circuits that address the semiconductor memory market can be segmented into volatile memory, such as DRAM and SRAM, and non-volatile memory, such as Flash and EEPROM. Volatile memory loses its data if the power is turned off, while non-volatile memory retains its data when the power is turned off. SRAM is used for applications that require very high speed access to stored data and it typically requires four to six transistors to store each bit of data. DRAM uses only a single transistor to store each bit of data. As a result, the storage capacity of DRAM tends to be much greater than that of SRAM. SRAM is faster than DRAM, but more expensive on a cost per bit basis. The same equipment manufacturers that use high performance SRAM may also use low and medium density DRAM and such products can be sold through the same channels.
System designers use SRAM in the most performance sensitive portions of their memory architecture. High performance SRAM operates at either very high speed or very low power or both. High speed SRAM is used in applications such as base stations, aggregators, routers, switches, modems and peripherals. Low power SRAM is used in applications such as wireless handheld devices and mobile phones.
3
Table of Contents
The DRAM market can be segmented into high density devices (currently 2 Gb and above) and low and medium density devices (currently 1 Gb and below). High density DRAM is used in applications that require high capacity storage, such as PCs, servers and other high-end computing devices. Currently, DRAM in PCs is migrating from 2 Gb to 4 Gb and above. Low and medium density DRAM is used in applications such as digital consumer electronics, networking, mobile communications, and automotive electronics, which require less memory capacity than PCs and high end computing applications. Large captive memory manufacturers tend to focus production on higher density DRAM devices, where the volumes are greater and manufacturing economies of scale can be optimized. As a result, to the extent the large, captive memory manufacturers limit or cease production of low and medium density DRAM, customers will seek long-term, steady supply of these products. We focus on providing long-term support for these low and medium density DRAM products.
Memory suppliers compete on the basis of speed, power consumption, density, reliability, and cost, all of which are a function of process technology and design expertise. Success in the memory market is determined not only by the quality of the device design, but also by the process through which the device is fabricated. Process technology improvements allow design line widths to be reduced, which in turn allow the integrated circuit design to operate at faster speeds and increased memory density. To meet the demands for high performance memories, a memory supplier must also have a wafer fabrication strategy allowing it to migrate to the newest generations of process technology on a timely basis. Process technology shifts occur frequently and are developed in high end wafer fabrication facilities that typically cost over $1.0 billion. Although most of the large multinational memory companies fabricate their own semiconductor wafers, fabless suppliers rely on third-party wafer foundries. The fabless model is much less capital intensive, but requires strong relationships with foundries to secure wafer supply and access to advanced process technology.
We believe the demand for high performance memory products across a variety of end markets provides a substantial opportunity for a focused supplier of high performance memory integrated circuits to penetrate these markets and support customers’ long-term needs.
Strategy
Since our inception in 1988, we have developed a broad range of SRAM products that enable designers to meet the demanding density, speed, cost, reliability and power consumption requirements of semiconductors used in high technology products. In the late 1990’s, we began to establish ourselves as a supplier of low and medium density DRAM products, which are complementary to our SRAM products. For both product lines, we emphasize our commitment to be a long-term provider of legacy, small to medium density memories that are of less interest to some of our larger competitors. Our customers are among the largest manufacturers in the digital consumer electronics, networking, telecommunications, mobile communications, automotive electronic and industrial markets. Unlike many other fabless semiconductor companies, we employ our own process development team to work collaboratively with our key foundry suppliers, which are mostly located in Asia. Our management has extensive experience working with Asian foundries. These factors allow us to build strong relationships with our foundry suppliers and facilitate access to leading edge process technology and wafer capacity. The key elements of our strategy are:
Target Specific Memory Market Segments. The memory markets are large and diverse, but also prone to the economics of demand and supply imbalances which can cause fluctuations in product prices. We work to market and sell our DRAM and SRAM products into certain specific markets that provide sufficient volume for sales, but which also may provide better stability in prices over time. Examples of the market segments that we target are industrial applications, automotive, die sales, networking, telecommunications, and some medical equipment.
Commit to Being a Long-Term Supplier of our Products. We are a long-term supplier of products to many of our customers. Our fabless model provides us the flexibility to accommodate small volume production runs for products such as low and medium density memories. In contrast, many large captive suppliers will reduce or
4
Table of Contents
cease production of lower density products in periods of tight capacity, as manufacturing such products is less attractive to them than making higher density memories, which typically have higher volumes and greater economies of scale. As an example, we still supply low density 4 Mb EDO 3.3 volt DRAM and 64K SRAM, while most large captive memory companies ceased production of such devices many years ago.
Continue to Develop and Offer High Performance Products. We provide cost effective, high performance products, including a complete family of SRAM products and a broad range of low and medium density DRAM products. We work with our customers to identify the memory requirements of their next generation products and then focus our development efforts on achieving high performance standards through advanced process technology, circuit density, high speed, reliability and optimized power consumption. Examples of our high performance product offerings include a 72 Mb synchronous high speed SRAM product targeting high-end networking applications and 512 Mb DDR DRAM and 1 GB DDR2 DRAM products targeting the digital consumer electronics and networking markets.
Expand our Low Cost Asian-Based Development Teams Close to our Customers. We intend to continue to capitalize on our extensive experience in Asia. We have established low cost engineering development teams close to our customers through our subsidiaries in Taiwan, China and Korea and have a full complement of research and development and sales and marketing capability in these Asian subsidiaries.
Further Penetrate Industry Leading Customers. We leverage our expertise in producing high quality memory products to penetrate our target markets through industry leading accounts, such as LG Electronics, NEC, Sharp, Panasonic, Samsung, Sony, and Toshiba in digital consumer electronics; Alcatel-Lucent, Cisco, Foxconn, Fujitsu, Huawei Technologies, Polycom, Tellabs, UT Starcom and ZTE in networking and telecommunications; Ericsson, Garmin, LG Electronics, Motorola, Nokia, and VTech in mobile communications; Bosch, Bose, Continental, Delphi, Harman Becker, Hyundai Mobis, Johnson Controls, Kenwood, Panasonic, Philips (PLDS), and TRW in automotive electronics; and General Electric, Hypercom, Ingenico, Philips, Siemens, Schneider and Tyco in industrial applications. We target these customers because we believe they drive high volumes in their markets, have long life cycle products and define the direction of future memory requirements. We believe our success with these market leaders enables us to attract other customers and broaden our customer base.
Develop Selected Application Specific Standard Products (ASSP) for Key Markets. Through our Giantec business unit, we develop selected ASSP products for use in our key markets. Our goal is to increase product diversification and to offer products that are synergistic with our DRAM and SRAM expertise. Currently, these products include primarily EEPROM and SmartCards.
Customers and Marketing
Over the years, we have established a strong customer base, including industry leading accounts. Our key customers in each of our target markets are presented in the following table:
| Digital Consumer Electronics |
Networking |
Mobile Communications |
Automotive Electronics |
Industrial | ||||
| LG Electronics |
Alcatel-Lucent | Ericsson | Bosch | General Electric | ||||
| NEC |
Cisco | Garmin | Bose | Hypercom | ||||
| Panasonic |
Foxconn | LG Electronics | Continental | Ingenico | ||||
| Samsung |
Fujitsu | Motorola | Delphi | Philips | ||||
| Sharp |
Huawei | Nokia Siemens | Harman Becker | Schneider | ||||
| Sony |
Polycom | VTech | Johnson Controls | Siemens | ||||
| Toshiba |
Tellabs | Hyundai Mobis | Tyco | |||||
| UT Starcom | Kenwood | |||||||
| ZTE | Panasonic | |||||||
| Philips (PLDS) | ||||||||
| TRW |
5
Table of Contents
Our sales and marketing efforts are directed from our San Jose headquarters, but we also have sales and marketing teams in Asia and a sales team in Europe. We market and sell our products in Asia, the U.S. and Europe through our direct sales force, independent sales representatives and distributors. We have distributors in North America and in many countries in Europe, including a Pan-European distributor. In Asia, we sell primarily through distributors who work closely with our Asian resident direct sales force. We have sales offices in the U.S., UK, Germany, Brazil, Taiwan, China, Hong Kong, Japan, India, Korea, and Singapore. Our marketing group focuses on product strategy, product development road maps, new product introduction, demand assessment and competitive analysis. The group also helps ensure that product launches, channel marketing programs, and ongoing demand and supply planning occur on a well-managed, timely basis.
In fiscal 2010, revenue from our largest and second largest distributor accounted for approximately 15% and 10%, respectively, of our total net sales. In fiscal 2009, revenue recognized for one distributor accounted for approximately 13% of our total net sales. In fiscal 2008, no single customer accounted for over 10% of our total net sales. The percentage of our sales from customers located outside the U.S. was approximately 85%, 85%, and 84% in fiscal 2010, 2009, and 2008, respectively. We measure sales location by the shipping destination, even if the customer is headquartered in the U.S. We anticipate that sales to international customers will continue to represent a significant percentage of our net sales. The percentages of our sales by region are set forth in the following table:
| Fiscal Year
Ended September 30, |
||||||||||||
| 2010 | 2009 | 2008 | ||||||||||
| Asia |
66 | % | 70 | % | 66 | % | ||||||
| Europe |
18 | 14 | 17 | |||||||||
| U.S. |
15 | 15 | 16 | |||||||||
| Other |
1 | 1 | 1 | |||||||||
| Total |
100 | % | 100 | % | 100 | % | ||||||
Information regarding our long-lived assets is contained in Note 14 to our Consolidated Financial Statements.
Our sales are generally made pursuant to standard purchase orders, which can be revised by our customers to reflect changes in the customer’s requirements. Generally, our purchase orders and OEM agreements allow customers to reschedule delivery dates and cancel purchase orders without significant penalties. For these reasons, we believe that our backlog, while useful for scheduling production, is not necessarily a reliable indicator of future revenues. To meet customer requirements, we often must deliver products on relatively short notice. Accordingly, we must maintain a significant inventory of certain items to be able to meet these requirements.
See page 27 of this Report on Form 10-K for a discussion of the impact of seasonality on our business. See “Risk Factors” for information regarding risks related to our international operations.
Markets and Products
Our memory products are used in a variety of specific applications within the digital consumer electronics, networking, telecommunications, mobile communications, automotive electronics and industrial markets. In particular, our SRAM products are used in WLANs, cell phones, base stations, networking switches and routers, fiber to the home (FTTH), DSL modems, LCD TVs, set-top boxes, GPS systems, instrumentation, engine control systems, medical equipment, telematics, audio and video equipment, satellite radio, POS terminals, fax machines, copiers, tape drives, and other applications. Our low and medium density DRAM products are used in WLANs, base stations, networking switches and routers, FTTH, DSL and cable modems, set top boxes, digital cameras, MP3, flat panel TVs, LCD TVs, HDTVs, video phones, voice over internet protocol (VOIP), printers, disk
6
Table of Contents
drives, tape drives, audio/video equipment, instrumentation, GPS, telematics, infotainment, smart meters and other applications. Many of the same customers that purchase our SRAM products also purchase our DRAM products.
Prior to fiscal 2003, SRAM products generated a majority of our revenue, initially for high performance, low cost SRAM for PC cache memory applications and subsequently for networking and telecommunications applications. In 1997, we introduced our first low and medium density DRAM products for use in the consumer electronics market. As a result of growth in the consumer electronics market and diversification into other applications, sales of our low and medium density DRAM products have represented a majority of our net sales in each year since fiscal 2003.
SRAM. Our SRAM strategy is to offer a broad range of devices and to be a complete supplier of our customers’ SRAM requirements. We offer advanced, leading-edge products, such as our 72 Mb synchronous SRAM, and we also make long-term supply commitments on established SRAM products, such as a 32K x 8, 5 volt asynchronous SRAM. Our high performance SRAM products generally focus on either high speed or low power applications.
We offer both asynchronous and synchronous high speed SRAM products. Our high speed asynchronous SRAM products are used in applications such as LANs, telecommunication equipment such as base stations, routers, modems, automotive electronics, multimedia products, peripherals, and industrial instrumentation. We have also developed a low power family of SRAM products for wireless applications. Our high speed synchronous SRAM products are used in a variety of networking and telecommunications applications, such as high performance switches and routers, as well as in automotive applications. Additional SRAM products under development are expected to include performance-leading features in speed, configuration, power levels, density and packaging. We are also developing certain Psuedo SRAM products as a cost effective replacement for ultra low power SRAMs.
DRAM. Our DRAM strategy is to be a long-term supplier of low and medium density DRAM products. Our DRAM products are not targeted at the largest DRAM markets requiring the highest density DRAM products used in PCs and workstations. Instead, we provide 4, 16, 64, 128, 256 and 512 Mb and 1 Gb DRAM products, including a 1.8 volt low power version of our 16, 64, 128 and 256 Mb synchronous DRAM (SDRAM) products. We also provide EDO, SDRAM, DDR and DDR II memory solutions in both x 32 and x 16 configurations to meet our customers’ memory requirements. We also offer both high performance and lower memory solutions. Applications for our low and medium density DRAM products include products such as WLANs, base stations, networking switches and routers, FTTH, DSL and cable modems, set top boxes, digital cameras, MP3, flat panel TVs, LCD TVs, HDTVs, video phones, VOIP, printers, disk drives, tape drives, audio/video equipment, instrumentation, GPS, telematics, infotainment, and other applications. Most of these applications do not require high density products, and our customers’ memory component strategy typically follows one or more generations behind the high density DRAM market. Additional DRAM products are under development. For most SDRAM products, we offer both packaged and known good die (KGD) only solutions. We also offer FBGA packages, which are very small and thin, for all of our synchronous and low power DRAM products.
ASSP and Other Products. Through our Giantec business unit, our ASSP products include high performance serial EEPROM, SmartCard and selected other products. Applications for our EEPROM products include TVs, networking systems, modems, telephone sets, security systems, video games, automobiles and other consumer products. We currently sell 1 Kb to 256 Kb Serial EEPROM products. These products are offered in two-wire, microwire and serial peripheral interface protocols. Applications for our Smartcard products include transportation passes, payment cards, health care cards and other cards that store secure data. We currently sell 1 Kb to 128 Kb SmartCard products. These products are offered in two-wire, secure serial, MCU based and contactless protocols. Sales from our ASSP products constituted approximately 10%, 14% and 12% of our total revenue in fiscal 2010, 2009, and 2008, respectively.
7
Table of Contents
Product Warranty. Consistent with semiconductor memory industry practice, we generally provide a limited warranty that our semiconductor memory devices are in compliance with specifications existing at the time of delivery. Liability for a stated warranty period is usually limited to replacement of defective items or return of amounts paid.
Manufacturing
We outsource our manufacturing operations, including wafer fabrication, assembly and testing. Since memory products are particularly well suited for the development of advanced process technology, we seek to participate in developing and refining the process technology used to manufacture many of our products. We believe that this strategy enables us to achieve earlier introduction of smaller geometries for our memory products, which results in increased performance and lower manufacturing costs, as well as facilitates access to needed capacity. Our principal manufacturing relationships are with GlobalFoundries, Hynix, IBM, Nanya, Powerchip, ProMOS, SMIC, and TSMC.
The manufacturing of our products begins at independent wafer foundries. Once the foundry has completed wafer processing, the wafers are shipped to subcontractors for wafer testing. They are then cut into individual memory chips, assembled into final packages and tested at our third-party subcontractors in Taiwan, China and the Philippines. Our operations groups in the U.S., China and Taiwan perform subcontractor management. We are certified to ISO 9001/2000 standards and ISO 14001, the environmental standard, and our quality system is periodically reviewed and approved by both ISO registrars and our customers. We are compliant to ISO/TS 16949:2002, the automotive standard.
Each of our wafer suppliers also fabricates for other integrated circuit companies, including certain of our competitors. In addition, some of our wafer suppliers manufacture memories for their own account. Although we are allocated specific wafer capacity from our suppliers, we may not be able to obtain such capacity in periods of tight supply. There can be no assurance that the foundries we use will not encounter construction or production difficulties or that they will allocate sufficient wafer capacity to satisfy our wafer requirements, especially in times of wafer capacity shortages. Moreover, there can be no assurance that we would be able to qualify additional manufacturing sources for existing or new products in a timely manner or that such additional manufacturing sources would be able to produce an adequate supply of wafers. If we were unable to obtain an adequate supply of wafers from our current or any alternative sources in a timely manner, our business and operating results would be harmed.
Our suppliers for wafer testing, assembly, and final test also provide services to other companies. There can be no assurance that these suppliers will not encounter production difficulties or that they will allocate sufficient capacity to satisfy our requirements. If we were unable to obtain an adequate supply of wafer testing, assembly, or final test services, our business and operating results would be harmed.
Competition
The semiconductor market is intensely competitive and has been characterized by cyclical market conditions, an oversupply of product, price erosion, rapid technological change and short product life cycles. Key factors impacting our competitive capabilities include:
| • | the pricing of our products; |
| • | the supply and cost of wafers; |
| • | product design, functionality, performance and reliability; |
| • | successful and timely product development; |
| • | wafer manufacturing over or under capacity; |
| • | access to advanced process technologies at competitive prices; |
8
Table of Contents
| • | access to assembly and test capacity; and |
| • | time to market. |
Any of these factors may impact our ability to compete successfully in the future and our failure to do so could harm our business.
In the market for SRAM products we compete with several domestic and international semiconductor companies including Cypress, Etron, GSI Technology, Integrated Device Technology, Renesas Electronics and Samsung. We also may face significant competition from other domestic and foreign integrated circuit manufacturers which have advanced technological capabilities but are not currently participating in the SRAM market sector.
In the low to medium density DRAM area we generally compete with Elpida, Hynix, Micron, Nanya, Oki, Samsung and Winbond. In addition, there are several fabless Taiwanese companies that are competitors, including ESMT and Etron. Other large DRAM manufacturers could address the low and medium density DRAM market in the future.
In the EEPROM market, our primary competitors include Atmel, Fudan Microelectronics, Microchip, ON Semiconductor and STMicroelectronics. We also compete with many small to medium-sized companies in one or more segments of the market.
Certain of our competitors offer broader product lines and have greater financial, technical, marketing, distribution and other resources than us. In industry down cycles, they may be willing to sell below fully absorbed costs at prices we cannot match. We may not be able to compete successfully against any of these competitors.
The process technology used by our manufacturing sources, including process technology that we have developed jointly with our foundries, can be used by such foundries to produce products for other companies, including our competitors. Although we believe that our participation in the development of the processes provides us the advantage of early access to such processes, the knowledge of the wafer manufacturer may be used to benefit our competitors.
Research and Development
Rapid technological change and continuing price competition require research and development efforts on both new products and advanced processes employing smaller geometries. Our research and development activities are focused primarily on the development of new memory circuit designs at the smallest die size and utilization of advanced process technologies. We currently have design teams in California, Taiwan, China and Korea. Our research and development expenditures in fiscal 2010, 2009, and 2008 were $24.1 million, $20.0 million, and $20.8 million, respectively.
New SRAM products in development include a die shrink on our 4Mb Asynchronous SRAM, a 9Mb Synchronous SRAM, a 2Mb ultra low power Asynchronous SRAM, a 36Mb Synchronous SRAM, and a 72Mb Synchronous SRAM. New DRAM products in development include 1.8 volt, low power 128Mb, 256Mb and 512Mb SDRAMs and various densities of DDR/DDR2 DRAMs. We are developing new products on advanced 72 and 65 nanometer process technology as well as 0.09 micron, 0.11 micron, 0.13 micron, and 0.14 micron process technology.
Patents and Intellectual Property
As of September 30, 2010, we held 97 U.S. patents. These patents expire between 2010 and 2027. We do not believe that the expiration of any particular patent in the short-term will have a material impact on our
9
Table of Contents
business. We have one additional patent application pending and expect to continue to file patent applications where appropriate to protect our proprietary technologies. In addition, we hold nine Taiwan patents which expire between 2021 and 2024 and have two patent applications which are pending in Taiwan. We also have three patents in China which expire between 2027 and 2029 and have one patent application in China which is pending. Although patents are an important element of our intellectual property, we believe that our continued success depends primarily on factors such as the technological skills and innovation of our personnel rather than on our patents. The process of seeking patent protection can be expensive and time consuming. There can be no assurance that patents will be issued from pending or future applications or that, if patents are issued, they will not be challenged, invalidated or circumvented, or that any rights granted thereunder will provide meaningful protection or other commercial advantage to us. Moreover, there can be no assurance that any patent rights will be upheld in the future or that we will be able to preserve any of our other intellectual property rights.
In the semiconductor industry, it is not unusual for companies to receive notices alleging infringement of patents or other intellectual property rights of others. We have been, and from time-to-time expect to be, notified of claims that we may be infringing patents, maskwork rights or copyrights owned by third parties. If it appears necessary or desirable, we may seek licenses under patents that we are alleged to be infringing. Although patent holders commonly offer such licenses, licenses may not be offered and the terms of any offered licenses may not be acceptable to us. The failure to obtain a license under a key patent or intellectual property right from a third party for technology used by us could harm our business.
Part of our outsourcing strategy includes licensing product designs. To control our R&D expenses, we occasionally license some of our DRAM and SRAM designs from other companies or our foundries. We also license our own designs to other companies.
Employees
As of September 30, 2010, we had 452 employees worldwide, including 61 employees in the U.S., 124 in China, 233 in Taiwan, 8 in Hong Kong, 2 in Europe, 5 in India, 7 in Japan, 11 in Korea, and 1 in Singapore. Our future success will be dependent on our ability to attract, retain and motivate highly qualified technical and management personnel. The employment market for such personnel can be very competitive and there can be no assurance that we will successfully staff all necessary positions. Our employees are not represented by any collective bargaining agreements, we have never experienced a work stoppage and we believe our employee relations are good.
Executive Officers of the Registrant
Our executive officers and their ages as of December 1, 2010 are as follows:
| Name |
Age | Position | ||
| Jimmy S.M. Lee |
55 | Executive Chairman of the Board of Directors | ||
| Scott D. Howarth |
50 | President and Chief Executive Officer | ||
| John M. Cobb |
54 | Vice President and Chief Financial Officer | ||
| Kong Yeu Han |
55 | Vice Chairman | ||
| Chang-Chaio (James) Han |
57 | Executive Vice President, GM ISSI-Taiwan and SRAM/DRAM Business Division |
Set forth below is certain information relating to our executive officers.
Jimmy S.M. Lee has served as our Executive Chairman since April 2008 and as Chairman, Chief Executive Officer and a director from October 1988, when he co-founded ISSI, until March 2008. He reassumed the role of President in November 2005 until December 2007. From 1985 to 1988, Mr. Lee was engineering manager at International CMOS Technology, a semiconductor company, and from 1983 to 1985, he was a design manager at
10
Table of Contents
Signetics Corporation, a semiconductor company. He has served as a director of Chrontel, a video optics company, since July 1995 and as a director of Alpha & Omega Semiconductor, Inc., a developer of advanced power semiconductor solutions, from March 2006 through January 2010. Mr. Lee holds an M.S. degree in electrical engineering from Texas Tech University and a B.S. degree in electrical engineering from National Taiwan University.
Scott D. Howarth has served as our Chief Executive Officer since April 2008, as a director since October 2008 and as our President since December 2007. He also served as our Chief Financial Officer from February 2006 until May 2008. From September 2001 to February 2006, Mr. Howarth was the Vice President of Finance and Administration and Chief Financial Officer of Chrontel, Inc., a fabless video optics company. Prior to joining Chrontel, Mr. Howarth was acting Chief Financial Officer at Securecom Networks, a start-up that was acquired. From 1984 to 2000, he was employed with Intel Corporation in both finance and operation positions, and held several group controller positions in the company. Mr. Howarth holds an MBA degree in Finance and a B.S. degree in Mining Engineering from the University of Idaho.
John M. Cobb has served as our Vice President of Finance and Administration and Chief Financial Officer since May 2008. He served as Vice President Finance and Administration and Chief Financial Officer of Power Integrations, Inc., a power conversion semiconductor company, from 2001 through 2006. From 1990 to 2000, Mr. Cobb held various senior level financial positions at Quantum Corporation, a computer storage company, most recently as Vice President Finance and Chief Financial Officer of the company’s hard disk drive group. Mr. Cobb holds a B.S. degree in accounting from Villanova University.
Kong Yeu Han has served as our Vice Chairman since May 2005 and as a director since August 2005. He served as Chief Executive Officer of Integrated Circuit Solution, Inc. (ICSI) from January 1999 to May 2005. Mr. Han was a co-founder of ISSI and served as the Company’s Executive Vice President from April 1995 to December 1998, as Vice President from December 1988 to March 1995, and as General Manager, ISSI-Taiwan from September 1990 to December 1998. Mr. Han holds an M.S. degree in electrical engineering from the University of California, Santa Barbara and a B.S. degree in electrical engineering from National Taiwan University.
Chang-Chaio (James) Han has served as the Company’s Executive Vice President and as General Manager, ISSI-Taiwan and SRAM/DRAM Business Division since May 2005. He served as President of ICSI from October 2003 to April 2005, and as Vice President of Design of ICSI from July 1998 to October 2003. He has served as a director of Win Win Precision Technology Co., a solar energy and semiconductor equipment company, since August 2010. Mr. Han holds a PhD degree in electrical engineering from Case Western Reserve University and M.S. and B.S. degrees in electrical engineering from National Taiwan University.
Officers serve at the discretion of the Board and are appointed annually. There are no family relationships among the directors or officers of ISSI.
Uncertain general economic conditions and any future downturn in the markets we serve are expected to adversely affect our business and financial results.
Substantially all of our products are incorporated into products for the digital consumer electronics, networking, telecommunications, mobile communications, automotive electronics and industrial markets. Historically, these markets have experienced cyclical depressed business conditions, often in connection with, or in anticipation of, a decline in general economic conditions, or due to adverse supply and demand conditions in such markets. Industry downturns have resulted in reduced demand and declining average selling prices for our products which adversely affected our business. Due to the continued uncertain economic conditions, our current or potential customers may delay or reduce purchases of our products which would adversely affect our revenues
11
Table of Contents
and harm our business and financial results. In addition, the continued uncertainty in the economy may negatively impact the spending patterns of businesses including our current and potential customers. We expect our business to be adversely impacted by any further downturn in the U.S. or global economies.
Our sales depend on DRAM and SRAM products and reduced demand for these products or a decline in average selling prices could harm our business.
In fiscal 2010, fiscal 2009 and fiscal 2008, approximately 90%, 86% and 88%, respectively, of our net sales were derived from the sale of DRAM and SRAM products, which are subject to unit volume fluctuations and declines in average selling prices that could harm our business. We experienced a sequential decline in revenue from $37.7 million in our December 2008 quarter to $31.3 million in our March 2009 quarter primarily as a result of a significant decrease in unit shipments of our SRAM products and a decline in the average selling prices for our DRAM products. We also experienced a sequential decline in revenue from $55.3 million in our September 2008 quarter to $37.7 million in our December 2008 quarter primarily as a result of a significant decrease in unit shipments of both our DRAM and SRAM products. We expect our revenue for the quarter ending December 31, 2010 to decrease from our revenue in the quarter ended September 30, 2010 as a result of reduced demand for our DRAM and SRAM products. We may not be able to offset any future price declines for our products by higher volumes or by higher prices on newer products. While we have experienced increases in the average selling prices for certain of our products in fiscal 2010, historically, average selling prices for semiconductor memory products have declined, and we expect that average selling prices for our products will decline in the future. Our ability to maintain or increase revenues will depend upon our ability to increase unit sales volume of existing products and introduce and sell new products that compensate for the anticipated declines in the average selling prices of our existing products.
If we are unable to obtain an adequate supply of wafers, our business will be harmed.
If we are unable to obtain an adequate supply of wafers from our current suppliers or any alternative sources in a timely manner, our business will be harmed. Our principal manufacturing relationships are with Nanya, Powerchip Semiconductor, SMIC, TSMC, ProMOS, IBM, Hynix and GlobalFoundries. Each of our wafer foundries also supplies wafers to other semiconductor companies, including certain of our competitors or for their own account. Although we are allocated wafer capacity from our key suppliers, we may not be able to obtain such capacity in periods of tight supply. If any of our suppliers experience manufacturing failures or yield shortfalls, severe financial or operational difficulties, choose to prioritize capacity for other uses, or reduce or eliminate deliveries to us for any other reason, we may not be able to obtain enough wafers to meet the market demand for our products which would adversely affect our revenues. From time to time, certain of our wafer foundries announce that they will no longer produce a specific type of wafer we may need. In such event, we have had to and may in the future have to place large last time buy orders which expose us to the risk of inventory obsolescence. Once a product is in production at a particular foundry, it is time consuming and costly to have such product manufactured at a different foundry. In addition, we may not be able to qualify additional manufacturing sources for existing or new products in a timely manner and we cannot be certain that other manufacturing sources would be able to deliver an adequate supply of wafers to us or at the same cost.
Foundry capacity has been limited resulting in higher wafer prices, and we may be required to pay even higher prices for wafers or to enter into costly arrangements to secure foundry capacity in the future.
In response to improving semiconductor industry conditions over the last several quarters, foundry capacity has been limited in recent periods. If we are not able to obtain additional foundry capacity as required, our relationships with our customers would be harmed and our future sales would be adversely impacted. In order to secure foundry capacity, we have entered into in the past, and may enter into in the future, various arrangements with suppliers, which could include:
| • | option payments or other prepayments to foundries; |
| • | increased prices for wafers; |
12
Table of Contents
| • | purchases of equity or debt securities in foundries; |
| • | joint ventures; |
| • | process development relationships with foundries; |
| • | contracts that commit us to purchase specified quantities of wafers over extended periods; and |
| • | nonrefundable deposits with, or loans to, foundries in exchange for capacity commitments. |
We may not be able to make any such arrangements in a timely fashion or at all, and such arrangements, if any, may not be on terms favorable to us. Once we make commitments to secure foundry capacity, we may incur significant financial penalties if we subsequently determine that we are not able to utilize all of that capacity. Such penalties may be substantial and could harm our financial results.
We rely on third-party contractors to fabricate, assemble and test our products. Our business is highly dependent on the continued operations of such contractors and our failure to successfully manage our relationships with these contractors could damage our relationships with our customers, decrease our sales and limit our growth.
We rely on third-party contractors located in Asia to fabricate, assemble and test our products. Any continued uncertain economic conditions or continued uncertainty in the U.S. and global credit markets could materially impact the financial condition or operations of our third-party contractors such as our wafer foundries, test contractors and assembly contractors. Our business is highly dependent on the continued operations of such contractors. Any deterioration in the financial condition of our contractors or any disruption in the operations of our contactors could adversely impact the flow of our products to our end customers and materially adversely impact our business and results of operation. There are significant risks associated with our reliance on these third-party contractors, including:
| • | potential price increases; |
| • | possible capacity shortages; |
| • | financial viability of our contractors; |
| • | reduced control over product quality; |
| • | reduced control over delivery schedules; |
| • | their inability to increase production and achieve acceptable yields on a timely basis; |
| • | absence of long-term agreements; |
| • | limited warranties on products supplied to us; and |
| • | general risks related to conducting business internationally. |
If any of these risks are realized, our business and results of operations could be adversely affected until our subcontractor is able to remedy the problem or until we are able to secure an alternative subcontractor.
Our foundries may experience lower than expected yields which could adversely affect our business.
The manufacture of integrated circuits is a highly complex and technically demanding process. Production yields and device reliability can be affected by a large number of factors. As is typical in the semiconductor industry, our outside foundries have from time to time experienced lower than anticipated manufacturing yields and device reliability problems, particularly in connection with the introduction of new products and changes in such foundry’s processing steps. There can be no assurance that our foundries will not experience lower than expected manufacturing yields or device reliability problems in the future, which could materially and adversely affect our business and operating results.
13
Table of Contents
Our operating results are expected to continue to fluctuate and may not meet our financial guidance or published analyst forecasts. This may cause the price of our common stock to decline significantly.
Our future quarterly and annual operating results are subject to fluctuations due to a wide variety of factors, including:
| • | changes in the global economy; |
| • | the cyclicality of the semiconductor industry; |
| • | declines in average selling prices of our products; |
| • | shortages in foundry, assembly or test capacity; |
| • | disruption in the supply of wafers, assembly or test services; |
| • | changes in the pricing for wafers or assembly or test services; |
| • | oversupply of memory products in the market; |
| • | inventory write-downs for lower of cost or market or excess and obsolete; |
| • | cancellation of existing orders or the failure to secure new orders; |
| • | excess inventory levels at our customers; |
| • | decreases in the demand for our products; |
| • | our ability to control or reduce our operating expenses; |
| • | increased expenses associated with new product introductions, masks or process changes; |
| • | the ability of customers to make payments to us; |
| • | changes in our product mix which could reduce our gross margins; |
| • | a failure to introduce new products and to implement technologies on a timely basis; |
| • | market acceptance of ours and our customers’ products; |
| • | a failure to anticipate changing customer product requirements; |
| • | fluctuations in manufacturing yields at our suppliers; |
| • | fluctuations in product quality resulting in rework, replacement, or loss due to damages; |
| • | a failure to deliver products to customers on a timely basis; |
| • | the timing of significant orders; |
| • | the outcome of any pending or future litigation; and |
| • | the commencement of any future litigation or antidumping proceedings. |
We have incurred significant losses in certain recent periods, and there can be no assurance that we will be able to sustain profitability in the future.
We were profitable in fiscal 2010 and though we were also profitable in the September 2009 quarter, we incurred a loss of $5.1 million in fiscal 2009, which included a $0.7 million charge for acquired in-process technology. Though we were profitable in each of the first three quarters of fiscal 2008, we incurred a loss of $17.8 million in fiscal 2008, which included charges for the impairment of goodwill of $25.3 million. There can be no assurance that we will maintain profitability in future periods. Our ability to maintain profitability on a quarterly or fiscal year basis in the future will depend on a variety of factors, including the need for future inventory write-downs, our ability to increase net sales, maintain or expand gross margins, introduce new products on a timely basis, secure sufficient wafer fabrication and assembly and test capacity and control operating expenses, including stock-based compensation. Adverse developments with respect to these or other factors could result in quarterly or annual operating losses in the future.
14
Table of Contents
Shifts in industry-wide capacity may cause our results to fluctuate. These shifts may occur quickly with little or no advance notice. Such shifts have historically resulted in significant inventory write-downs.
The semiconductor industry is highly cyclical and is subject to significant downturns resulting from excess capacity, overproduction, reduced demand or technological obsolescence. Shifts in industry-wide capacity from shortages to oversupply or from oversupply to shortages may result in significant fluctuations in our quarterly or annual operating results. These shifts in industry conditions can occur quickly with little or no advance notice to us. Adverse changes in industry conditions are likely to result in a decline in average selling prices and the stated value of our inventory. In fiscal 2010, in fiscal 2009 and in fiscal 2008, we recorded inventory write-downs of $2.9 million, $10.8 million, and $11.3 million, respectively. The inventory write-downs related to valuing our inventory at the lower-of-cost-or-market, and adjusting our inventory valuation for certain excess and obsolete products.
Differences in forecasted average selling prices used in calculating lower of cost or market adjustments can result in significant changes in the estimated net realizable value of inventory and accordingly the amount of write-down recorded. If the estimated market value of products in inventory at quarter-end is below the manufacturing cost of these products, we will recognize charges to write down the carrying value of our inventories to market value. In addition, we write down to zero dollars the carrying value of inventory on hand that has aged over one year to cover estimated excess and obsolete exposures, unless adjustments are made based on management’s judgments for newer products, end of life products, planned inventory increases or strategic customer supply. In making such judgments to write down inventory, management takes into account the product life cycles which can range from six to 30 months, the stage in the life cycle of the product, the impact of competitors’ announcements and product introductions on our products. Future additional inventory write-downs may occur due to lower of cost or market accounting, excess inventory or inventory obsolescence.
Strong competition in the semiconductor memory market may harm our business.
The semiconductor memory market is intensely competitive and has been characterized by an oversupply of product, price erosion, rapid technological change, short product life cycles, cyclical market patterns, and heightened foreign and domestic competition. Many of our competitors offer broader product lines and have greater financial, technical, marketing, distribution and other resources than us. We may not be able to compete successfully against any of these competitors. Our ability to compete successfully in the memory market depends on factors both within and outside of our control, including:
| • | the pricing of our products; |
| • | the supply and cost of wafers; |
| • | product design, functionality, performance and reliability; |
| • | successful and timely product development; |
| • | the performance of our competitors and their pricing policies; |
| • | wafer manufacturing over or under capacity; |
| • | real or perceived imbalances in supply and demand for our products; |
| • | the rate at which OEM customers incorporate our products into their systems; |
| • | the success of our customers’ products and end-user demand; |
| • | access to advanced process technologies at competitive prices; |
| • | achievement of acceptable yields of functional die; |
| • | the capacity of our third-party contractors to assemble and test our products; |
| • | the gain or loss of significant customers; |
15
Table of Contents
| • | the nature of our competitors; |
| • | our financial strength and the financial strength of our competitors; and |
| • | general economic conditions. |
In addition, we are vulnerable to technology advances utilized by competitors to manufacture higher performance or lower cost products. We may not be able to compete successfully in the future as to any of these factors. Our failure to compete successfully in these or other areas could harm our business and financial results.
We may encounter difficulties in effectively integrating newly acquired businesses.
From time to time, we have acquired and expect in the future to acquire other companies or assets that we believe to be complementary to our business. In this regard, in April 2009, we announced the acquisition of Enable Semiconductor Corporation, a private Taiwan and Korea based company. Acquisitions may result in the use of our cash resources, potentially dilutive issuances of equity securities, incurrence of debt and contingent liabilities, amortization expenses related to intangible assets, and the possible impairment of goodwill, which could harm our profitability. In addition, acquisitions involve numerous risks, including:
| • | higher than estimated acquisition expenses; |
| • | difficulties in successfully assimilating the operations, technologies and personnel of the acquired company; |
| • | difficulties in continuing to develop new technologies and deliver products to market on time; |
| • | diversion of management’s attention from other business concerns; |
| • | risks of entering markets in which we have no, or limited, direct prior experience; |
| • | lower than expected sales of any acquired products; |
| • | the risk that the markets for acquired products do not develop as expected; and |
| • | the potential loss of key employees and customers as a result of the acquisition. |
There is no assurance that any of our recent or future acquisitions will contribute positively to our business or operating results.
The loss of a significant customer or a reduction in orders from one or more large customers could adversely affect our operating results.
As sales to our customers are executed pursuant to purchase orders and no purchasing contracts typically exist, our customers can cease doing business with us at any time. We may not be able to retain our key customers, such customers may cancel or reschedule orders, and in the event of canceled orders, such orders may not be replaced by other sales. In addition, sales to any particular customer may fluctuate significantly from quarter to quarter, and such fluctuating sales could harm our business and financial results.
We have significant international sales and operations and risks related to our international activities could harm our operating results.
In fiscal 2010, approximately 15% of our net sales was attributable to customers located in the U.S., 18% was attributable to customers located in Europe and 66% was attributable to customers located in Asia. In fiscal 2009, approximately 15% of our net sales was attributable to customers located in the U.S., 14% was attributable to customers located in Europe and 70% was attributable to customers located in Asia. In fiscal 2008, approximately 16% of our net sales was attributable to customers located in the U.S., 17% was attributable to customers located in Europe and 66% was attributable to customers located in Asia. We anticipate that sales to international sites will continue to represent a significant percentage of our net sales. Although our international
16
Table of Contents
sales are largely denominated in U.S. dollars, we do have sales transactions in New Taiwan dollars, in Hong Kong dollars and in Chinese renminbi. In addition, our wafer foundries and assembly and test subcontractors are primarily located in Taiwan and China. A substantial majority of our employees are located outside of the U.S and the expenses for our foreign operations are generally denominated in local currency. As a result, a devaluation of the New Taiwan dollar or Chinese renminbi could substantially increase the cost of our operations in Taiwan or China.
We are subject to the risks of conducting business internationally, including:
| • | global economic conditions, particularly in Taiwan and China; |
| • | duties, tariffs and other trade barriers and restrictions; |
| • | foreign currency fluctuations; |
| • | changes in trade policy and regulatory requirements; |
| • | transportation delays; |
| • | the burdens of complying with foreign laws; |
| • | imposition of foreign currency controls; |
| • | language barriers; |
| • | difficulties in hiring and retaining experienced engineers in countries such as China and Taiwan; |
| • | difficulties in collecting foreign accounts receivable; |
| • | difficulties in protecting our intellectual property rights; |
| • | political instability, including any changes in relations between China and Taiwan; |
| • | public health outbreaks such as SARS or avian flu; and |
| • | earthquakes and other natural disasters. |
Our revenues and business would be harmed if we are not able to successfully develop, introduce and sell new products and develop and implement new manufacturing technologies in a timely manner. Our research and development expenses could increase and our business could be harmed if the implementation of these new manufacturing technologies is unsuccessful.
We operate in highly competitive, quickly changing markets which are characterized by rapid obsolescence of existing products. As a result, our future success depends on our ability to develop and introduce new products that our customers choose to buy in significant quantities. If we fail to introduce new products in a timely manner or if our customers’ products do not achieve commercial success, our business and results of operations could be seriously harmed. The design and introduction of new products is challenging as such products typically incorporate more functions and operate at faster speeds than prior products. Increasing complexity generally requires smaller features on a chip. This makes developing new generations of products substantially more difficult than prior generations. The cost to develop products utilizing these new technologies is expensive and requires significant research and development spending and, as a result, our research and development expenses could increase in the future. Further, new products may not work properly in our customers’ applications. If we are unable to design, introduce, manufacture, market and sell new products successfully, our business and financial results would be seriously harmed.
Our products are complex and could contain defects, which could reduce sales of those products or result in claims against us.
We develop complex and evolving products. Despite testing by us and our customers, errors may be found in existing or new products. This could result in a delay in recognition or loss of revenues, loss of market share or
17
Table of Contents
failure to achieve market acceptance. The occurrence of defects could also cause us to incur significant warranty, support and repair costs, could divert the attention of our engineering personnel from our product development efforts, and could harm our relationships with our customers. The occurrence of these problems could also result in the delay or loss of market acceptance of our products and would likely harm our business. Defects, integration issues or other performance problems in our products could result in financial or other damages to our customers. Our customers could also seek and obtain damages from us for their losses. From time to time, we have been involved in disputes regarding product warranty issues. Although we seek to limit our liability, a product liability claim brought against us, even if unsuccessful, would likely be time consuming and could be costly to defend.
Potential intellectual property claims and litigation could subject us to significant liability for damages and could invalidate our proprietary rights.
In the semiconductor industry, it is not unusual for companies to receive notices alleging infringement of patents or other intellectual property rights. We have been, and from time-to-time expect to be, notified of claims that we may be infringing patents, maskwork rights or copyrights owned by third-parties. If it appears necessary or desirable, we may seek licenses under patents that we are alleged to be infringing. However, licenses may not be offered and the terms of any offered licenses may not be acceptable to us.
The failure to obtain a license under a key patent or intellectual property right from a third party for technology used by us could cause us to incur substantial liabilities and to suspend the manufacture of the products utilizing the invention or to attempt to develop non-infringing products, any of which could harm our business. Furthermore, we may become involved in protracted litigation regarding the alleged infringement by us of third-party intellectual property rights or litigation to assert and protect our patents or other intellectual property rights. Any litigation relating to patent infringement or other intellectual property matters could result in substantial cost and diversion of our resources, which could harm our business.
We may be unable to effectively protect our intellectual property, which would negatively impact our ability to compete.
We believe that the protection of our intellectual proprietary rights will continue to be important to the success of our business. We rely on a combination of patent, copyright, trademark and trade secret laws and restrictions on disclosure to protect our intellectual property rights. We also enter into confidentiality or license agreements with our employees, consultants and business partners, and control access to and distribution of our documentation and other proprietary information. Despite these efforts, unauthorized parties may attempt to copy or otherwise obtain and use our proprietary technology. Monitoring unauthorized use of our technology is difficult, and we cannot be certain that the steps we have taken will prevent unauthorized use of our technology, particularly in foreign countries where the laws may not protect our proprietary rights as fully as do the laws of the U.S. Many U.S. companies have encountered substantial infringement problems in foreign countries, including countries in which we design and sell our products. We cannot be certain that patents will be issued as a result of our pending applications nor can we be certain that any issued patents would protect or benefit us or give us adequate protection from competing products. For example, issued patents may be circumvented or challenged and declared invalid or unenforceable. We also cannot be certain that others will not develop our unpatented proprietary technology or develop competing technologies on their own.
We may experience difficulties in complying with Sarbanes-Oxley Section 404 in future periods.
We concluded that our internal control over financial reporting was effective at September 30, 2010. We are in the process of implementing a major revision to our current worldwide MIS system and we are continuing to use our current system until the revision is fully implemented. If in the future, we are unable to conclude that our internal control over financial reporting is effective or we are unable to conclude that our disclosure controls and procedures are effective, we could lose investor confidence in the accuracy and completeness of our financial reports, which could have an adverse effect on our stock price.
18
Table of Contents
Our results of operations could vary as a result of the methods, estimates, and judgments we use in applying our accounting policies.
The methods, estimates, and judgments we use in applying our accounting policies have a significant impact on our results of operations (see “Critical Accounting Policies” in Part II, Item 7 of this Form 10-K). Such methods, estimates, and judgments are, by their nature, subject to substantial risks, uncertainties, and assumptions, and factors may arise over time that lead us to change our methods, estimates, and judgments. Changes in those methods, estimates, and judgments could significantly affect our results of operations. In particular, the calculation of share-based compensation expense requires us to use valuation methodologies (which were not developed for use in valuing employee stock options) and a number of assumptions, estimates, and conclusions regarding matters such as expected forfeitures, expected volatility of our share price, the expected dividend rate with respect to our common stock, and the option exercise behavior of our employees. Furthermore, there are no means, under applicable accounting principles, to compare and adjust our expense if and when we learn about additional information that may affect the estimates that we previously made, with the exception of changes in expected forfeitures of share-based awards. In the future, factors may arise that lead us to change our estimates and assumptions with respect to future share-based compensation arrangements, resulting in variability in our share-based compensation expense over time. Changes in forecasted share-based compensation expense could impact our gross margin percentage, research and development expenses, and selling, general and administrative expenses.
We depend on our ability to attract and retain our key technical and management personnel.
Our success depends upon the continued service of our key technical and management personnel. Several of our important manufacturing and other subcontractor relationships are based on personal relationships between our senior executive officers and such parties. In particular, our Executive Chairman has long-term relationships with our key foundries. If we were to lose the services of any key executives, it may negatively impact the related business relationships since we have no long-term contractual agreements with such parties. Our success also depends on our ability to continue to attract, retain and motivate qualified technical personnel, particularly experienced circuit designers and process engineers. The competition for such employees depends on general economic and industry conditions but such competition has been intense in prior periods of industry growth. We have no employment contracts or key person life insurance policies with or for any of our employees. The loss of the service of one or more of our key personnel could harm our business.
Our stock price is expected to continue to be volatile.
The trading price of our common stock has been and is expected to be subject to wide fluctuations in response to:
| • | quarter-to-quarter variations in our operating results; |
| • | general conditions or cyclicality in the semiconductor industry or the end markets that we serve; |
| • | new or revised earnings estimates or guidance by us or industry analysts; |
| • | comments or recommendations issued by analysts who follow us, our competitors or the semiconductor industry; |
| • | aggregate valuations and movement of stocks in the broader semiconductor industry; |
| • | announcements of new products, strategic relationships or acquisitions by us or our competitors; |
| • | increases or decreases in available wafer capacity; |
| • | governmental regulations, trade laws and import duties; |
| • | announcements related to future or existing litigation involving us or any of our competitors; |
| • | announcements of technological innovations by us or our competitors; |
19
Table of Contents
| • | announcements regarding our share repurchase program and the timing and amount of shares we purchase under such program; |
| • | additions or departures of senior management; and |
| • | other events or factors, many of which are beyond our control. |
In addition, stock markets have from time to time experienced extreme price and trading volume volatility. This volatility has had a substantial effect on the market prices of securities of many companies for reasons frequently unrelated to the operating performance of the specific companies. These broad market fluctuations have adversely affected the market price of our common stock and may continue to do so in the future.
We have used and may in the future use a significant amount of our cash resources to repurchase shares of our common stock and such repurchases present potential risks and disadvantages to us and our continuing stockholders.
From September 2007 through December 2009, we repurchased shares of our common stock in the open market under Rule 10b-18 and pursuant to our tender offers. While we did not repurchase any shares in the nine month period ended September 30, 2010, in the three months ended December 31, 2009, we repurchased 244,941 shares of our common stock in the open market at an aggregate price of approximately $1.1 million. In addition, in fiscal 2009, we repurchased 2,050,340 shares of our common stock in the open market at an aggregate price of approximately $4.9 million, in fiscal 2008 we repurchased 10,203,282 shares for an aggregate price of $71.1 million which included 10,000,000 shares we repurchased in January 2008 for an aggregate price of $70 million pursuant to a tender offer and in fiscal 2007, we repurchased 1,181,148 shares for an aggregate price of $7.4 million. At September 30, 2010, we had outstanding authorization from our Board to purchase up to an additional $3.8 million of our common stock from time to time. In October 2010, our Board authorized an additional $20.0 million for the repurchase of shares of our common stock from time to time. Although our Board of Directors has determined that these repurchase programs are in the best interests of our stockholders, these repurchases expose us to a number of risks including:
| • | the use of a substantial portion of our cash reserves, which may reduce our ability to engage in significant cash acquisitions or to pursue other business opportunities that could create significant value to our stockholders; |
| • | the risk that we would not be able to replenish our cash reserves by raising debt or equity financing in the future on terms acceptable to us, or at all; |
| • | the risk that these repurchases have reduced our “public float,” which is the number of our shares owned by non-affiliate stockholders and available for trading in the securities markets, and likely reduced the number of our stockholders, which may reduce the volume of trading in our shares and may result in lower stock prices and reduced liquidity in the trading of our shares; and |
| • | the risk that our stock price could decline and that we would be able to repurchase shares of our common stock at a lower price per share than the prices we pay in our repurchase programs. |
Business disruptions could seriously harm our future revenue and financial condition and increase our costs and expenses.
Our worldwide operations, including the operations of our foundries and other suppliers, could be subject to natural disasters and other business disruptions, which could seriously harm our revenue and financial condition and increase our costs and expenses. Our corporate headquarters, and a portion of our research and development activities, are located in San Jose, California, and our other critical business operations and many of our suppliers are located in Asia, near major earthquake faults. The ultimate impact on us, our significant suppliers and our general infrastructure of being located near major earthquake faults is unknown, but our revenue, profitability and financial condition could suffer in the event of a major earthquake or other natural disaster. Losses and interruptions could also be caused by earthquakes, power shortages, telecommunications failures, water
20
Table of Contents
shortages, tsunamis, floods, typhoons, volcanic eruptions, fires, extreme weather conditions, medical epidemics such as a flu outbreak and other natural or manmade disasters.
Our operations involve the use of hazardous and toxic materials, and we must comply with environmental laws and regulations, which can be expensive, and may adversely affect our business and operating results.
We are subject to federal, state and local regulations relating to the use, handling, storage, disposal and human exposure to hazardous and toxic materials. If we were to violate or become liable under environmental laws in the future as a result of our inability to obtain permits, human error, accident, equipment failure or other causes, we could be subject to fines, costs, or civil or criminal sanctions, face property damage or personal injury claims or be required to incur substantial investigation or remediation costs or experience disruptions in our operations, any of which could have a material adverse effect on our business. In addition, environmental laws could become more stringent over time imposing greater compliance costs and increasing the risks and penalties associated with violations, which could harm our business.
We also face increasing complexity in our product design as we adjust to new and future requirements relating to the materials composition of our products, including the restrictions on lead and other hazardous substances applicable to specified electronic products placed on the market in the European Union (Restriction on the Use of Hazardous Substances Directive 2002/95/EC, also known as the RoHS Directive). We also expect that our operations will be affected by other new environmental laws and regulations on an ongoing basis. Although we cannot predict the ultimate impact of any such new laws and regulations, they will likely result in additional costs, and could require that we change the design and/or manufacturing of our products, any of which could have a material adverse effect on our business.
Changes in our effective tax rate may harm our results of operations.
A number of factors may increase our future effective tax rates, including:
| • | the jurisdictions in which profits are determined to be earned and taxed; |
| • | limitations on the utilization of federal net operating loss carryforwards and credits; |
| • | exhaustion of our existing federal and foreign net operating loss carryforwards and credits; |
| • | the resolution of issues arising from tax audits with various tax authorities; |
| • | changes in the valuation of our deferred tax assets and liabilities, and changes in deferred tax valuation allowances; |
| • | adjustments to income taxes upon finalization of various tax returns; |
| • | increases in expenses not deductible for tax purposes, included write-offs of acquired in-process research and development and impairments of goodwill in connection with acquisitions; |
| • | changes in available tax credits; |
| • | changes in tax laws or the interpretation of such tax laws, and changes in U.S. generally accepted accounting principles; and |
| • | our decision to repatriate non-U.S. earnings for which we have not previously provided for U.S. taxes. |
Any significant increase in our future effective tax rates could reduce net income for future periods.
21
Table of Contents
Item 1B. Unresolved Staff Matters
None.
Our headquarters consists of approximately 30,000 square feet of office space located in San Jose, California. Our lease on this facility expires in June 2013. Our China subsidiary occupies approximately 14,000 square feet under a lease that expires in February 2012. In Taiwan, we own and occupy our building in Hsinchu, which consists of approximately 375,000 square feet, a portion of which is leased to other companies. The land upon which our building in Hsinchu is situated is leased under an operating lease that expires in March 2016. We also lease field sales offices in the U.S., Asia and Europe. We believe our existing facilities are adequate to meet our current needs and that we can renew our existing leases or obtain alternative space on terms that would not have a material impact on our financial results.
DRAM Technologies LLC v. Integrated Silicon Solution, Inc., et al.
On February 5, 2010, a patent infringement suit was filed against us and several other semiconductor companies in the United States District Court for the Eastern District of Texas by DRAM Technologies LLC, for the alleged infringement of various patents by our products (Case No. 2:10-CV-45). The complaint also alleged willful infringement of the patents by us and sought a permanent injunction of the alleged infringing acts by us, as well as up to the trebling of unspecified damages. On or about February 23, 2010, we were purportedly served with the complaint. On August 24, 2010, the complaint against us was voluntarily dismissed, with prejudice, ending our involvement in the litigation.
Goodman v. Integrated Silicon Solution, Inc., et al.
On August 23, 2010, a patent infringement suit was filed against us and several other semiconductor companies in the United States District Court for the Northern District of California by James B. Goodman (“Goodman”), for the alleged infringement of U.S. Patent No. 6,243,315 by our products (Case No. 5:10-CV-03738). The complaint seeks unspecified damages, interest and costs, but does not allege willful infringement or seek a permanent injunction. We have not been served with the complaint. We will file an answer to the complaint as prescribed by the Federal Rules of Civil Procedure.
Other Legal Proceedings
In the ordinary course of our business, as is common in the semiconductor industry, we have been involved in a limited number of other legal actions, both as plaintiff and defendant, and could incur uninsured liability in any one or more of them. Although the outcome of these actions is not presently determinable, we believe that the ultimate resolution of these matters will not have a material adverse effect on our financial position, cash flows or results of operations. However, no assurances can be given with respect to the extent or outcome of any such litigation in the future.
Item 4. [Removed and reserved]
22
Table of Contents
Item 5. Market for Registrant’s Common Equity, Related Stockholder Matters and Issuer Purchases of Equity Securities
Market for Common Stock
Our common stock has been quoted on the Nasdaq Global Market under the symbol ISSI since our initial public offering in February 1995. Prior to such date, there was no public market for our common stock. The following table sets forth, for the fiscal quarters indicated, the high and low sale prices per share for our common stock as reported on the Nasdaq Global Market. These prices are over-the-counter market quotations which reflect inter-dealer prices, without retail mark-up, mark-down or commission and may not necessarily represent actual transactions.
| High | Low | |||||||
| Fiscal Year 2009 |
||||||||
| First Quarter |
$ | 2.45 | $ | 1.36 | ||||
| Second Quarter |
$ | 1.85 | $ | 1.31 | ||||
| Third Quarter |
$ | 2.92 | $ | 1.51 | ||||
| Fourth Quarter |
$ | 3.85 | $ | 2.20 | ||||
| Fiscal Year 2010 |
||||||||
| First Quarter |
$ | 5.75 | $ | 3.25 | ||||
| Second Quarter |
$ | 10.85 | $ | 4.86 | ||||
| Third Quarter |
$ | 13.93 | $ | 7.40 | ||||
| Fourth Quarter |
$ | 10.09 | $ | 6.60 | ||||
Holders of Record
As of December 3, 2010, there were approximately 148 stockholders of record of our common stock.
Dividends
We have never declared or paid cash dividends. We currently intend to retain any earnings for use in our business and do not anticipate paying any cash dividends on our capital stock in the foreseeable future.
Recent Sales of Unregistered Securities
None.
23
Table of Contents
Stock Performance Graph
The following graph sets forth our total cumulative stockholder return compared to the Standard & Poor’s 500 Index and the Philadelphia Semiconductor Index (“SOX”), for the period September 30, 2005 through September 30, 2010. Total stockholder return assumes $100 invested at the beginning of the period in our common stock, the stocks represented in the Standard & Poor’s 500 Index and the stocks represented in the Philadelphia Semiconductor Index, respectively. Total return also assumes reinvestment of dividends; we have paid no dividends on our common stock.
Comparison of Five-Year Cumulative Return
September 30, 2005 to September 30, 2010
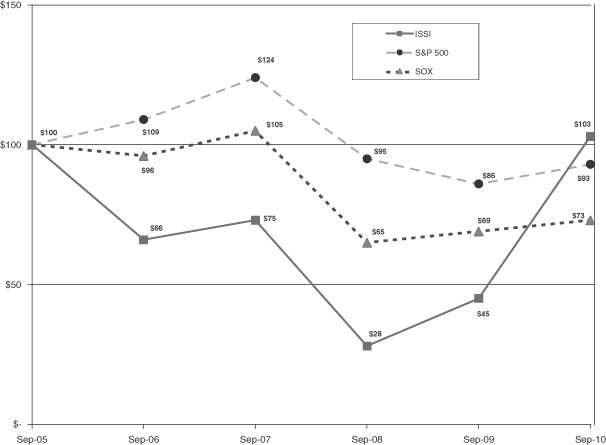
24
Table of Contents
Item 6. Selected Consolidated Financial Data
The selected consolidated financial data set forth below should be read in conjunction with Management’s Discussion and Analysis of Financial Condition and Results of Operations and our Consolidated Financial Statements and the Notes thereto included elsewhere in this report. The consolidated statement of operations data set forth below for the three year period ended September 30, 2010 and the consolidated balance sheet data set forth below at September 30, 2010 and 2009 have been derived from our audited financial statements included elsewhere in this report. The consolidated statement of operations data set for below for the fiscal years ended September 30, 2007 and September 30, 2006 and the consolidated balance sheet data set forth below at September 30, 2008, September 30, 2007 and September 30, 2006 have been derived from our audited financial statements not included in this report. Our historical results are not necessarily indicative of the results to be expected for any future period.
| Fiscal Years Ended September 30, | ||||||||||||||||||||
| 2010 | 2009 | 2008 | 2007 | 2006 | ||||||||||||||||
| (In thousands, except per share data) | ||||||||||||||||||||
| Consolidated Statement of Operations Data: |
||||||||||||||||||||
| Net sales |
$ | 252,458 | $ | 154,251 | $ | 235,229 | $ | 245,395 | $ | 217,492 | ||||||||||
| Cost of sales |
155,927 | 113,373 | 182,033 | 196,959 | 188,386 | |||||||||||||||
| Gross profit |
96,531 | 40,878 | 53,196 | 48,436 | 29,106 | |||||||||||||||
| Operating expenses |
||||||||||||||||||||
| Research and development |
24,066 | 20,020 | 20,848 | 20,174 | 21,617 | |||||||||||||||
| Selling, general and administrative |
32,509 | 26,221 | 31,429 | 32,660 | 28,328 | |||||||||||||||
| Acquired in-process technology |
— | 710 | — | — | 499 | |||||||||||||||
| Impairment of goodwill |
— | — | 25,338 | — | — | |||||||||||||||
| Total operating expenses |
56,575 | 46,951 | 77,615 | 52,834 | 50,444 | |||||||||||||||
| Operating income (loss) |
39,956 | (6,073 | ) | (24,419 | ) | (4,398 | ) | (21,338 | ) | |||||||||||
| Other income, net |
3,953 | 961 | 6,916 | 20,025 | 7,057 | |||||||||||||||
| Provision (benefit) for income taxes |
1,154 | (18 | ) | 197 | 4 | (33 | ) | |||||||||||||
| Equity in net income (loss) of affiliates/noncontrolling interest |
(559 | ) | 44 | (63 | ) | (262 | ) | 6 | ||||||||||||
| Net income (loss) |
$ | 42,196 | $ | (5,050 | ) | $ | (17,763 | ) | $ | 15,361 | $ | (14,242 | ) | |||||||
| Basic net income (loss) per share (1) |
$ | 1.65 | $ | (0.20 | ) | $ | (0.60 | ) | $ | 0.41 | $ | (0.38 | ) | |||||||
| Diluted net income (loss) per share (1) |
$ | 1.56 | $ | (0.20 | ) | $ | (0.60 | ) | $ | 0.40 | $ | (0.38 | ) | |||||||
| Consolidated Balance Sheet Data: |
||||||||||||||||||||
| Cash, cash equivalents, restricted cash and short-term investments |
$ | 91,609 | $ | 83,486 | $ | 50,015 | $ | 133,815 | $ | 113,333 | ||||||||||
| Total assets |
234,031 | 161,930 | 175,951 | 262,715 | 260,278 | |||||||||||||||
| Total ISSI stockholders’ equity (2) |
172,205 | 122,826 | 127,390 | 213,751 | 203,192 | |||||||||||||||
| Noncontrolling interests in subsidiaries (2) |
5,616 | 1,750 | 789 | 726 | 690 | |||||||||||||||
| Total stockholders’ equity (2) |
177,821 | 124,576 | 128,179 | 214,477 | 203,882 | |||||||||||||||
| (1) | See Note 1 of Notes to Consolidated Financial Statements for an explanation of the basis used to calculate net income (loss) per share. |
| (2) | Balances in the table above have been adjusted to reflect the retrospective application of new accounting standards for noncontrolling interests. |
25
Table of Contents
Item 7. Management’s Discussion and Analysis of Financial Condition and Results of Operations
Overview
We are a fabless semiconductor company that designs and markets high performance integrated circuits for the following key markets: (i) digital consumer electronics, (ii) networking and telecommunications, (iii) mobile communications, (iv) automotive electronics and (v) industrial applications. We were founded in October 1988. Our primary products are low and medium density DRAM in both package and Known Good Die (KGD) form and high speed and low power SRAM. In fiscal 2010, approximately 90% of our revenue was derived from our DRAM and SRAM products. Sales of our low and medium density DRAM products have represented a majority of our net sales in each year since fiscal 2003.
In January 2010, we formed a separate business unit, Giantec Semiconductor, Inc. (Giantec). As part of this formation, Shanghai Zhang Jiang Science & Technology Investment Corporation invested approximately $3.8 million in Giantec. We still own more than 50% of Giantec and, as such, continue to consolidate the financial results of Giantec. Giantec is actively seeking additional equity investment from outside investors and in the event such investment is obtained, our ownership could be diluted to be less than 50%, in which case we would no longer consolidate Giantec. Through our Giantec business unit, we design and market application specific standard products (ASSP) primarily EEPROMs and SmartCards focused on our key markets.
In order to control our operating expenses, for the past several years we limited our headcount in the U.S. and transferred various functions to Taiwan and China. We believe this strategy has enabled us to limit our operating expenses while simultaneously locating these functions closer to our manufacturing partners and our customers. As a result of these efforts, we currently have significantly more employees in Asia than we do in the U.S. We intend to continue these strategies going forward.
As a fabless semiconductor company, our business model is less capital intensive because we rely on third parties to manufacture, assemble and test our products. Because of our dependence on third-party wafer foundries, our ability to increase our unit sales volumes depends on our ability to increase our wafer capacity allocation from current foundries, add additional foundries and improve yields of good die per wafer.
The average selling prices of our DRAM and SRAM products are sensitive to supply and demand conditions in our target markets and have generally declined over time. We experienced declines in the average selling prices for many of our products in fiscal 2010, in fiscal 2009 and in fiscal 2008. However, the average selling prices for certain of our DRAM products have increased since the latter part of our September 2009 quarter and these average selling price increases have continued into the September 2010 quarter. We expect average selling prices for our products to decline in the future, principally due to market demand, market competition and the supply of competitive products in the market. Any future decreases in our average selling prices could have an adverse impact on our revenue growth rate, gross margins and operating margins. Our ability to maintain or increase revenues will be highly dependent upon our ability to increase unit sales volumes of existing products and to introduce and sell new products in quantities sufficient to compensate for the anticipated declines in average selling prices of existing products. Declining average selling prices will adversely affect our gross margins unless we are able to offset such declines with commensurate reductions in per unit costs or changes in product mix in favor of higher margin products.
Revenue from product sales to our direct customers is recognized upon shipment provided that persuasive evidence of a sales arrangement exists, the price is fixed or determinable, title has transferred, collection of resulting receivables is reasonably assured, there are no customer acceptance requirements and there are no remaining significant obligations. A portion of our sales is made to distributors under agreements that provide for the possibility of certain sales price rebates and limited product return privileges. Given the uncertainties associated with credits that will be issued to these distributors, we defer recognition of such sales until our products are sold by the distributors to their end customers. Revenue from sales to distributors who do not have sales price rebates or product return privileges is recognized at the time our products are sold by us to the distributors.
26
Table of Contents
We market and sell our products in Asia, the U.S. and Europe and other locations through our direct sales force, distributors and sales representatives. The percentage of our sales shipped outside the U.S. was approximately 85%, 85% and 84% in fiscal 2010, fiscal 2009 and fiscal 2008, respectively. We measure sales location by the shipping destination, even if the customer is headquartered in the U.S. We anticipate that sales to international customers will continue to represent a significant percentage of our net sales. The percentages of our net sales by region are set forth in the following table:
| Fiscal Years Ended September 30, |
||||||||||||
| 2010 | 2009 | 2008 | ||||||||||
| Asia |
66 | % | 70 | % | 66 | % | ||||||
| Europe |
18 | 14 | 17 | |||||||||
| U.S. |
15 | 15 | 16 | |||||||||
| Other |
1 | 1 | 1 | |||||||||
| Total |
100 | % | 100 | % | 100 | % | ||||||
Our sales are generally made by purchase orders. Because industry practice allows customers to reschedule or cancel orders on relatively short notice, backlog may not be a good indicator of our future sales. Cancellations of customer orders or changes in product specifications could result in the loss of anticipated sales without allowing us sufficient time to reduce our inventory and operating expenses.
Since a significant portion of our revenue is from the digital consumer electronics market, our business may be subject to seasonality, with increased revenues in the third and fourth calendar quarters of each year, when customers place orders to meet year-end holiday demand. However, due to the complex nature of the markets we serve and the broad fluctuations in economic conditions in the U.S. and other countries, it is difficult for us to assess the impact of seasonal factors on our business.
We are subject to the risks of conducting business internationally, including economic conditions in Asia, particularly Taiwan and China, changes in trade policy and regulatory requirements, duties, tariffs and other trade barriers and restrictions, the burdens of complying with foreign laws and, possibly, political instability. Most of our foundries and all of our assembly and test subcontractors are located in Asia. Although our international sales are largely denominated in U.S. dollars, we do have sales transactions in New Taiwan dollars, in Hong Kong dollars and in Chinese renminbi. In addition, we have foreign operations where expenses are generally denominated in the local currency. Such transactions expose us to the risk of exchange rate fluctuations. We monitor our exposure to foreign currency fluctuations, but have not adopted any hedging strategies to date. There can be no assurance that exchange rate fluctuations will not harm our business and operating results in the future.
Due to the continued uncertain economic conditions, our current or potential customers may delay or reduce purchases of our products, which would adversely affect our revenues and harm our business and financial results. In addition, the continued uncertainty in the financial markets may have an adverse effect on the U.S. and world economies, which may negatively impact the spending patterns of businesses including our current and potential customers. We expect our business to be adversely impacted by any future downturn in the U.S. or global economies. In the past, industry downturns have resulted in reduced demand and declining average selling prices for our products which adversely affected our business. We expect to continue to experience these adverse business conditions in the event of further downturns.
Fiscal Year Ended September 30, 2010 Compared to Fiscal Year Ended September 30, 2009
Net Sales. Net sales consist principally of total product sales less estimated sales returns. Net sales increased by 64% to $252.5 million in fiscal 2010 from $154.3 million in fiscal 2009. The increase in net sales of $98.2 million was principally due to a significant increase in unit shipments and an increase in average selling prices for certain of our DRAM products in fiscal 2010 compared to fiscal 2009. In addition, unit shipments of
27
Table of Contents
both our SRAM products and our application specific standard products (ASSP) which include our EEPROM, Smart Card and logic products increased in fiscal 2010 compared to fiscal 2009. We anticipate that the average selling prices of our existing products will generally decline over time, although the rate of decline may fluctuate for certain products. There can be no assurance that any future price declines will be offset by higher volumes or by higher prices on newer products.
In fiscal 2010, revenue from our largest distributor accounted for 15% of net sales and revenue from our second largest distributor accounted for 10% of our net sales. In fiscal 2009, revenue from our largest distributor accounted for 13% of net sales.
Gross profit. Cost of sales includes die cost from the wafers acquired from foundries, subcontracted package, assembly and test costs, costs associated with in-house product testing, quality assurance and import duties. Gross profit increased by $55.6 million to $96.5 million in fiscal 2010 from $40.9 million in fiscal 2009. Our gross margin was 38.2% in fiscal 2010 compared to 26.5% in fiscal 2009. The increase in gross margin in fiscal 2010 compared to fiscal 2009 can be attributed to an improvement in product mix, the effect of better pricing in certain target markets, cost reductions for certain products and the favorable impact in fiscal 2010 from the sales of items previously written down to lower of cost or market combined with a decrease in inventory write-downs. Our gross margin for fiscal 2010 included inventory write-downs of $2.9 million while our gross margin for fiscal 2009 included inventory write-downs of $10.8 million. The inventory write-downs were for excess and obsolescence issues and lower of cost or market accounting on certain of our products. Our gross margin for fiscal 2010 and fiscal 2009 benefited from the sale of $3.4 million and $3.2 million, respectively, of products previously written down to zero carrying value. The increase in our gross profit in fiscal 2010 compared to fiscal 2009 was primarily a result of an increase in unit shipments across all our products but more significantly for our DRAM products. We believe that the average selling prices of our products will decline over time and, unless we are able to reduce our cost per unit or improve our product mix to higher gross margin products to the extent necessary to offset such declines, the decline in average selling prices will result in a material decline in our gross margin. In addition, our product costs could increase if our suppliers raise prices, which could result in a material decline in our gross margin. When demand for end products have increased, such as in fiscal 2010, foundries have raised wafer prices. Although we have product cost reduction programs in place that involve efforts to reduce internal costs and supplier costs, there can be no assurance that product costs will be reduced or that such reductions will be sufficient to offset the expected declines in average selling prices. We do not believe that such cost reduction efforts are likely to have a material adverse impact on the quality of our products or the level of service provided by us.
Research and development. Research and development expenses increased by 20% to $24.1 million in fiscal 2010 from $20.0 million in fiscal 2009. As a percentage of net sales, research and development expenses decreased to 9.5% in fiscal 2010 from 13.0% in fiscal 2009. The increase in research and development expenses of $4.1 million can be attributed to an increase in expenditures for masks, other product development costs and an increase in headcount related expenses associated with our acquisition of Enable. In addition, fiscal 2010 reflects expense for our employee profit sharing program which was implemented at the beginning of fiscal 2010.
Selling, general and administrative. Selling, general and administrative expenses increased by 24% to $32.5 million in fiscal 2010 from $26.2 million in fiscal 2009. As a percentage of net sales, selling, general and administrative expenses decreased to 12.9% in fiscal 2010 from 17.0% in fiscal 2009. The increase in selling, general and administrative expenses of $6.3 million can be attributed to an increase in sales commissions in fiscal 2010 as a result of our higher revenue and an increase in payroll related expenses. In addition, fiscal 2010 reflects expense for our employee profit sharing program which was implemented at the beginning of fiscal 2010.
Acquired in-process technology charge. In fiscal 2009, we incurred a $0.7 million IPR&D charge in connection with our acquisition of Enable. The $0.7 million allocated to IPR&D was expensed in fiscal 2009 as it was deemed to have no future alternative use.
28
Table of Contents
Interest and other income, net. Interest and other income, net was $1.2 million in fiscal 2010 compared to $1.1 million in fiscal 2009. The $1.2 million of interest and other income in fiscal 2010 was comprised of $1.1 million in rental income from the lease of excess space in our Taiwan facility, foreign exchange gains of approximately $0.1 million and interest income of $0.3 million offset in part by other items. The $1.1 million of interest and other income in fiscal 2009 was comprised of interest income of $0.6 million and $1.2 million in rental income from the lease of excess space in our Taiwan facility offset in part by other items including foreign exchange losses of $0.3 million.
Gain on sale of investments. The gain on the sale of investments was $2.8 million in fiscal 2010 as we sold all of our shares of Ralink for approximately $3.2 million and recorded a pre-tax gain of approximately $2.8 million. In fiscal 2009, there were no gains on the sale of investments.
Provision (benefit) for income taxes. We recorded an income tax expense of $1.2 million for fiscal 2010. The income tax expense of $1.2 million is principally comprised of foreign taxes on certain income earned by our foreign entities, state income taxes reduced by a refund of previously paid Federal alternative minimum taxes and a reversal of previously recorded unrecognized tax benefits. On November 6, 2009, the Worker, Homeownership, and Business Assistance Act of 2009 was signed into law. One of the provisions in such Act allows a taxpayer, at the taxpayer’s election, to carryback either its 2008, 2009 or 2010 net operating losses 3, 4, or 5 years whereas, generally, net operating losses can only be carried back up to 2 years. These net operating loss carryback provisions allow for the recovery of previously paid federal alternative minimum taxes.
For fiscal 2009, we recorded an income tax benefit of $18,000 consisting of a federal refundable credit, offset by state minimum taxes and foreign income taxes.
We have recorded a valuation allowance against our deferred tax assets due to our operating loss history and our uncertain expectation of future taxable income. We review the realization of these deferred tax assets on an ongoing basis. Any release of the valuation allowance would have a favorable impact on the provision for income taxes within our statement of operations.
Net (income) loss attributable to noncontrolling interests. The net (income) loss attributable to noncontrolling interests was income of $559,000 in fiscal 2010 compared to a loss of $44,000 in fiscal 2009.
Fiscal Year Ended September 30, 2009 Compared to Fiscal Year Ended September 30, 2008
Net Sales. Net sales decreased by 34% to $154.3 million in fiscal 2009 from $235.2 million in fiscal 2008 as a result of the global economic slowdown. The decrease in net sales of $81.0 million in fiscal 2009 compared to fiscal 2008 was principally due to a significant decrease in DRAM revenue which was primarily the result of a decrease in unit shipments of our DRAM products and to a lesser extent a decline in average selling prices of such products. In addition, unit shipments of our SRAM products decreased in fiscal 2009 compared to fiscal 2008 which contributed to the decline in our SRAM sales. A change in product mix for our application specific standard products (ASSP) resulted in a decrease in revenue in fiscal 2009 compared to fiscal 2008 for such products.
In fiscal 2009, revenue recognized for one distributor accounted for 13% of our net sales. In fiscal 2008, no single customer accounted for over 10% of our net sales.
Gross profit. Gross profit decreased by $12.3 million to $40.9 million in fiscal 2009 from $53.2 million in fiscal 2008. Our gross margin was 26.5% in fiscal 2009 compared to 22.6% in fiscal 2008. Our gross margin for fiscal 2009 included inventory write-downs of $10.8 million while our gross margin for fiscal 2008 included inventory write-downs of $11.3 million. The inventory write-downs were for excess and obsolescence issues and lower of cost or market accounting on certain of our products. Our gross margin for fiscal 2009 and fiscal 2008 benefited from the sale of $3.2 million and $3.1 million, respectively, of products previously written down to zero carrying value. Our gross margin increased in fiscal 2009 compared to fiscal 2008 primarily as a result of a
29
Table of Contents
shift in our product mix to higher margin SRAM and focus DRAM products from lower margin commodity DRAM products. In addition, our gross margins in fiscal 2009 were positively affected by a higher proportion of total revenue from products that were previously written down to lower of cost or market. The decrease in our gross profit in fiscal 2009 compared to fiscal 2008 was primarily a result of a decrease in unit shipments for our DRAM products and SRAM products. In addition, our gross profit for fiscal 2008 benefited from approximately $0.8 million of revenue for a DRAM development project.
Research and development. Research and development expenses decreased by 4% to $20.0 million in fiscal 2009 from $20.8 million in fiscal 2008. As a percentage of net sales, research and development expenses increased to 13.0% in fiscal 2009 from 8.9% in fiscal 2008. The decrease in research and development expenses of $0.8 million can be attributed to a decrease in testing fees and other product development costs partially offset by an increase in headcount related expenses associated with our acquisition of Enable and the addition of a new design team in Taiwan.
Selling, general and administrative. Selling, general and administrative expenses decreased by 17% to $26.2 million in fiscal 2009 from $31.4 million in fiscal 2008. As a percentage of net sales, selling, general and administrative expenses increased to 17.0% in fiscal 2009 from 13.4% in fiscal 2008. The decrease in selling, general and administrative expenses of $5.2 million was attributable to a reduction in sales commission in fiscal 2009 as a result of our lower revenue, decreases in payroll and other expenses as a result of our cost reduction measures, and expenses incurred in fiscal 2008 related to our $70 million stock repurchase.
Acquired in-process technology charge (IPR&D). In fiscal 2009, we incurred a $0.7 million IPR&D charge in connection with our acquisition of Enable. The $0.7 million allocated to IPR&D was expensed in fiscal 2009 as it was deemed to have no future alternative use.
Impairment of goodwill. In fiscal 2009, we recorded no impairments of goodwill. In fiscal 2008, we wrote off all $25.3 million of goodwill on our books at that time as our analysis indicated that there would be no remaining implied value attributable to the goodwill.
Interest and other income, net. Interest and other income, net was $1.1 million in fiscal 2009 compared to $5.2 million in fiscal 2008. The $1.1 million of interest and other income in fiscal 2009 was comprised of interest income of $0.6 million and $1.2 million in rental income from the lease of excess space in our Taiwan facility offset in part by other items including foreign exchange losses of $0.3 million. The $5.2 million of interest and other income in fiscal 2008 was comprised primarily of interest income of $3.0 million, $1.7 million in rental income from the lease of excess space in our Taiwan facility and $0.5 million in exchange gains. The decrease in interest income in fiscal 2009 compared to fiscal 2008 is a result of a decline in interest rates.
Gain on sale of investments. In fiscal 2009, there were no gains on the sale of investments. The gain on the sale of investments was $1.8 million in fiscal 2008 as we sold approximately 0.3 million shares of Ralink for approximately $1.8 million and recorded a pre-tax gain of approximately $1.6 million. In addition, in fiscal 2008, we sold 22.0 million shares of SMIC for approximately $2.7 million which resulted in a pre-tax gain of approximately $0.2 million.
Provision (benefit) for income taxes. For fiscal 2009, we recorded an income tax benefit of $18,000 consisting of a federal refundable credit, offset by state minimum taxes and foreign income taxes. For fiscal 2008, we recorded an income tax provision of $197,000 consisting of federal and state minimum taxes and foreign withholding taxes.
Net (income) loss attributable to noncontrolling interests. The net (income) loss attributable to noncontrolling interests was a loss of $44,000 in fiscal 2009 compared to a income of $63,000 in fiscal 2008.
30
Table of Contents
Liquidity and Capital Resources
As of September 30, 2010, our principal sources of liquidity included cash, cash equivalents and short-term investments of approximately $91.6 million. During fiscal 2010, operating activities provided cash of approximately $3.7 million compared to $22.6 million provided in fiscal 2009. The cash provided by operations in fiscal 2010 was primarily due to our net income of $42.8 million adjusted for non-cash items of $4.4 million, increases in accounts payable of $13.9 million and increases in accrued liabilities of $2.1 million. This was offset by increases in inventory of $34.0 million, increases in accounts receivable of $14.4 million, $10.0 million for long-term deposits to secure foundry capacity and increases in other assets of $1.1 million. The cash provided by operations in fiscal 2009 was primarily due to decreases in inventories of $20.1 million, decreases in accounts receivable of $9.4 million, decreases in other assets of $2.1 million and our net loss of $5.1 million adjusted for non-cash items of $9.0 million. These items were offset by decreases in accounts payable of $10.3 million and decreases in accrued liabilities of $2.6 million.
In fiscal 2010, we generated $17.6 million from investing activities compared to $5.6 million used for investing activities in fiscal 2009. In fiscal 2010, we generated $20.0 million from the sale of trading securities, $3.8 million from the net sales of available-for-sale securities and generated approximately $3.2 million from the sale of shares of Ralink. We also received approximately $3.8 million from the third-party investors in our consolidated subsidiary Giantec. In the fiscal 2010, we used $5.1 million to collateralize accounts payable to a supplier. In fiscal 2009, we used approximately $2.7 million for our acquisition of Enable which was comprised of cash used for the purchase of Enable shares less cash acquired as a result of our consolidation of Enable and $0.9 million for net purchases of available-for-sale securities. In fiscal 2009, we received proceeds of approximately $0.8 million from the third-party investors in our consolidated subsidiary Wintram Inc.
In fiscal 2010, we made capital expenditures of approximately $8.1 million for test equipment, engineering tools, and computer software and hardware compared to $2.8 million in fiscal 2009. We expect to spend approximately $5.0 million to $8.0 million to purchase capital equipment during the next twelve months, principally for the purchase of additional test equipment, design and engineering tools, and computer hardware. We expect to fund our capital expenditures from our existing cash and cash equivalent balances.
We generated $4.9 million from financing activities during fiscal 2010 compared to $4.2 million used in fiscal 2009. Our source of financing for fiscal 2010 was proceeds from the issuance of common stock of $6.0 million from stock option exercises and sales under our employee stock purchase plan. In fiscal 2010, we used $1.1 million for the repurchase and retirement of our common stock. In fiscal 2009, we used $4.9 million for the repurchase and retirement of our common stock and $12.2 million for the repayment of short-term borrowings. Our sources of financing in fiscal 2009 were borrowings of $12.2 million under lines of credit and proceeds from the issuance of common stock of $0.7 million from stock option exercises and sales under our employee stock purchase plan.
We have $13.9 million available through a number of short-term lines of credit with various financial institutions in Taiwan. These lines of credit expire at various times through April 2011. As of September 30, 2010, we had no outstanding borrowings under these short-term lines of credit.
We lease approximately 30,000 square feet of office space in San Jose for our headquarters and the lease on this building expires in June 2013. Outside of the U.S., we have operations in leased sites in China and Hong Kong. In addition to these sites, we lease sales offices in the U.S., Europe and Asia. These leases expire at various dates through 2014. In Taiwan, we own and occupy our building and the land upon which our building is situated is leased under an operating lease that expires in March 2016. Our outstanding commitments under these leases were approximately $4.0 million at September 30, 2010.
We generally warrant our products against defects in materials and workmanship for a period of 12 months. Liability for a stated warranty period is usually limited to the replacement of defective items or return of amounts paid. Warranty expense has historically been immaterial to our financial statements.
31
Table of Contents
Our contractual cash obligations at September 30, 2010 are outlined in the table below:
| Payments Due by Period | ||||||||||||||||||||
| Contractual Obligations |
Total | Less than 1 year |
1-3 years |
3-5 years |
More than 5 years |
|||||||||||||||
| (In thousands) | ||||||||||||||||||||
| Operating leases |
$ | 4,035 | $ | 1,420 | $ | 1,997 | $ | 507 | $ | 111 | ||||||||||
| Purchase obligations with wafer foundries |
29,218 | 29,218 | — | — | — | |||||||||||||||
| Total contractual cash obligations |
$ | 33,253 | $ | 30,638 | $ | 1,997 | $ | 507 | $ | 111 | ||||||||||
At September 30, 2010, we had outstanding authorization from our Board to purchase up to $3.8 million of our common stock from time to time. In October 2010, our Board authorized an additional $20.0 million for the repurchase of our common stock from time to time.
We believe our existing funds will satisfy our anticipated working capital and other cash requirements through at least the next 12 months. We may from time to time take actions to further increase our cash position through equity or debt financings, sales of shares of investments, bank borrowings, or the disposition of certain assets. From time to time, we may also commit to acquisitions or equity investments, including strategic investments in or prepayments to wafer fabrication foundries or assembly and test subcontractors. To the extent we enter into such transactions, any such transaction could require us to seek additional equity or debt financing to fund such activities. There can be no assurance that any such additional financing could be obtained on terms acceptable to us, if at all.
Off-Balance Sheet Arrangements
As of September 30, 2010, we did not have any off-balance sheet arrangements, as defined in Item 303 (a)(4)(ii) of SEC Regulation S-K.
Critical Accounting Policies
The preparation of financial statements in conformity with accounting principles generally accepted in the U.S. requires management to make difficult and subjective estimates, judgments and assumptions. These estimates, judgments and assumptions affect the reported amounts of assets and liabilities, the disclosure of contingent assets and liabilities at the date of the financial statements, as well as the reported amounts of revenue and expenses during the reporting period. The estimates and judgments that we use in applying our accounting policies have a significant impact on the results we report in our financial statements. We base our estimates and judgments on our historical experience combined with knowledge of current conditions and our beliefs of what could occur in the future, considering the information available at the time. Actual results could differ from those estimates and such differences may be material to our financial statements. We reevaluate our estimates and judgments on an ongoing basis.
Our critical accounting policies which are impacted by our estimates are: (i) the valuation of our inventory, which impacts cost of goods sold and gross profit; (ii) the valuation of our allowance for sales returns and allowances, which impacts net sales; (iii) the valuation of our allowance for doubtful accounts, which impacts general and administrative expense; (iv) accounting for acquisitions and goodwill, which impacts operating expense when we record impairments and (v) accounting for stock-based compensation which impacts costs of goods sold, research and development expense and selling, general and administrative expense. Each of these policies is described in more detail below. We also have other key accounting policies that may not require us to make estimates and judgments that are as subjective or difficult. For instance, our policies with regard to revenue recognition, including the deferral of revenues on sales to distributors with sales price rebates and product return privileges. These policies are described in the notes to our financial statements contained elsewhere in this Report on Form 10-K.
32
Table of Contents
Valuation of inventory. Our inventories are stated at the lower of cost or market value. Determining the market value of inventories on hand and at distributors as of the balance sheet date involves numerous judgments, including projecting average selling prices and sales volumes for future periods and costs to complete products in work in process inventories. When market values are below our costs, we record a charge to cost of goods sold to write down our inventories to their estimated market value in advance of when the inventories are actually sold. If actual market conditions are less favorable than those projected by management, additional inventory write-downs may be required that may adversely affect our operating results. If actual market conditions are more favorable, we may have higher gross margins when products are sold. In addition to lower of cost or market write-downs, we also analyze inventory to determine whether any of it is excess, obsolete or defective. We write down to zero dollars (which is a charge to cost of goods sold) the carrying value of inventory on hand that has aged over one year to cover estimated excess and obsolete exposures, unless adjustments are made based on management’s judgments for newer products, end of life products, planned inventory increases or strategic customer supply. In making such judgments to write down inventory, we take into account the product life cycles which can range from six to 30 months, the stage in the life cycle of the product, and the impact of competitors’ announcements and product introductions on our products. Once established, these write-downs are considered permanent.
Valuation of allowance for sales returns and allowances. Net sales consist principally of total product sales less estimated sales returns and allowances. To estimate sales returns and allowances, we analyze potential customer specific product application issues, potential quality and reliability issues and historical returns. We evaluate quarterly the adequacy of the allowance for sales returns and allowances. This allowance is reflected as a reduction to accounts receivable in our consolidated balance sheets. Increases to the allowance are recorded as a reduction to net sales. Because the allowance for sales returns and allowances is based on our judgments and estimates, particularly as to product application, quality and reliability issues, our allowances may not be adequate to cover actual sales returns and other allowances. If our allowances are not adequate, our net sales could be adversely affected.
Valuation of allowance for doubtful accounts. We maintain an allowance for doubtful accounts for losses that we estimate will arise from our customers’ inability to make required payments for goods and services purchased from us. We make our estimates of the uncollectibility of our accounts receivable by analyzing historical bad debts, specific customer creditworthiness and current economic trends. Once an account is deemed unlikely to be fully collected, we write down the carrying value of the receivable to the estimated recoverable value, which results in a charge to general and administrative expense, which decreases our profitability.
Accounting for acquisitions and goodwill. We account for acquisitions using the purchase accounting method. Under this method, the total consideration paid is allocated over the fair value of the net assets acquired, including in-process research and development, with any excess allocated to goodwill. Goodwill is defined as the excess of the purchase price over the fair value allocated to the net assets. Our judgments as to fair value of the assets will, therefore, affect the amount of goodwill that we record. Management is responsible for the valuation of tangible and intangible assets. For tangible assets acquired in any acquisition, such as plant and equipment, the useful lives are estimated by considering comparable lives of similar assets, past history, the intended use of the assets and their condition. In estimating the useful life of the acquired intangible assets with definite lives, we consider the industry environment and unique factors relating to each product relative to our business strategy and the likelihood of technological obsolescence. Acquired intangible assets primarily include core and current technology, customer relationships and customer contracts. We are currently amortizing our acquired intangible assets with definite lives over periods generally ranging from six months to six years.
We perform goodwill impairment tests on an annual basis and between annual tests in certain circumstances where indicators of impairment may exist. For instance, in response to changes in industry and market conditions, we could be required to strategically realign our resources and consider restructuring, disposing of, or otherwise exiting businesses, which could result in an impairment of tangible and intangible assets, including goodwill.
33
Table of Contents
Accounting for stock-based compensation. Stock option fair value is calculated on the date of grant using the Black-Scholes valuation model. The compensation cost is then recognized on a straight-line basis over the requisite service period of the option, which is generally the option vesting term of four years. We use the Black-Scholes valuation model to determine the fair value of our stock options at the date of grant. The Black-Scholes valuation model requires us to estimate key assumptions such as expected term, volatility, dividend yield and risk free interest rates that determine the stock option fair value. In addition, we estimate forfeitures at the time of grant. In subsequent periods, if actual forfeitures differ from the estimate, the forfeiture rate may be revised. We estimate our expected forfeitures rate based on our historical activity and judgment regarding trends. We estimate the expected term for option grants based upon historical exercise data. If we determined that another method used to estimate expected life was more reasonable than our current method, or if another method for calculating these input assumptions was prescribed by authoritative guidance, the fair value calculated could change materially.
Impact of Recently Issued Accounting Standards
During fiscal 2010, we adopted the following accounting standards, none of which had a material effect on our consolidated results of operations during such period or financial condition at the end of such period:
Business Combinations
In December 2007, the Financial Accounting Standards Board (FASB) issued guidance that establishes principles and requirements for determining how a company recognizes and measures the fair value of certain assets and liabilities acquired in a business combination, including noncontrolling interests, contingent consideration, and certain acquired contingencies. The guidance on business combinations also requires acquisition-related transaction expenses and restructuring costs be expensed as incurred rather than capitalized.
Noncontrolling Interest (Minority Interest)
In December 2007 and January 2010, the FASB issued guidance on the accounting and reporting for a noncontrolling interest in a subsidiary. We are required to report our noncontrolling interests as a separate component of stockholders’ equity. We are also required to present net income attributable to the noncontrolling interests and net income attributable to our stockholders separately in our consolidated statements of operations.
Fair Value Disclosure
In January 2010, the FASB amended the disclosure requirements for the fair value measurements for recurring and nonrecurring non-financial assets and liabilities. These disclosure requirements are effective in two phases. In the second quarter of fiscal year 2010, we adopted the requirements for disclosures about inputs and valuation techniques used to measure fair value as well as disclosures about significant transfers. Beginning in the first quarter of fiscal year 2012, these amended accounting standards will require presentation of disaggregated activity within the reconciliation for fair value measurements using significant unobservable inputs relating to Level 3 measurements. We do not anticipate that the additional disclosure requirements will have a material impact on our consolidated financial statements.
34
Table of Contents
Item 7A. Quantitative and Qualitative Disclosures about Market Risk
Foreign Currency Exchange Risk. We anticipate that international sales will continue to account for a significant portion of our consolidated revenue. Our international sales are largely denominated in U.S. dollars and therefore are not subject to material foreign currency exchange risk. However, we have operations in China, Europe, Taiwan, Hong Kong, India, Japan, Korea and Singapore where our expenses are denominated in each country’s local currency and are subject to foreign currency exchange risk. In fiscal 2010, we recorded exchange gains of approximately $0.1 million. In fiscal 2009, we recorded exchange losses of approximately $0.3 million. We could be negatively impacted by exchange rate fluctuations in the future. We do not currently engage in any hedging activities. In the future, if we feel our foreign currency exposure has increased, we may consider entering into hedging transactions to help mitigate that risk.
Interest Rate Risk. We had cash, cash equivalents, restricted cash and short-term investments of $91.6 million at September 30, 2010. These funds were primarily invested in money market funds and certificates of deposit. Due to the relatively short-term nature of our investment portfolio, we believe that we do not have any material exposure to changes in the fair value of our investment portfolio as a result of changes in interest rates. We believe a hypothetical 100 basis point increase in interest rates would not materially affect the fair value of our interest-sensitive financial instruments. Since we believe we have the ability to liquidate this portfolio, we do not expect our operating results or cash flows to be materially affected to any significant degree by a sudden change in market interest rates on our investment portfolio.
Investments in Publicly Traded Companies. We own ordinary shares in SMIC which has been a publicly traded company since March 2004. Our investment in SMIC is classified as an available-for-sale investment and is recorded at fair value with the unrealized gain or loss reported as a component in “Accumulated other comprehensive loss” in the Consolidated Balance Sheets. The cost basis of our shares in SMIC is approximately $3.4 million and the market value at September 30, 2010 was approximately $2.2 million and is included in short-term investments. The market value of SMIC shares is subject to fluctuations and our carrying value will be subject to adjustments to reflect changes in SMIC’s market value in future periods. The fair value of our SMIC stock would be approximately $2.4 million or $1.9 million, respectively, based on a hypothetical 10 percent increase or 10 percent decrease in SMIC’s stock price. In the event the decline in the market value of our SMIC shares below our cost basis is determined to be other-than-temporary, we would be required to recognize a loss on our investment through operating results.
35
Table of Contents
Item 8. Financial Statements and Supplementary Data
INTEGRATED SILICON SOLUTION, INC.
INDEX TO CONSOLIDATED FINANCIAL STATEMENTS
36
Table of Contents
REPORT OF INDEPENDENT REGISTERED PUBLIC ACCOUNTING FIRM
The Board of Directors and Stockholders
Integrated Silicon Solution, Inc.
We have audited the accompanying consolidated balance sheets of Integrated Silicon Solution, Inc. (a Delaware corporation) and subsidiaries as of September 30, 2010 and 2009, and the related consolidated statements of operations, stockholders’ equity, and cash flows for each of the three years in the period ended September 30, 2010. These financial statements are the responsibility of the Company’s management. Our responsibility is to express an opinion on these financial statements based on our audits.
We conducted our audits in accordance with the standards of the Public Company Accounting Oversight Board (United States). Those standards require that we plan and perform the audit to obtain reasonable assurance about whether the financial statements are free of material misstatement. An audit includes examining, on a test basis, evidence supporting the amounts and disclosures in the financial statements. An audit also includes assessing the accounting principles used and significant estimates made by management, as well as evaluating the overall financial statement presentation. We believe that our audits provide a reasonable basis for our opinion.
In our opinion, the consolidated financial statements referred to above present fairly, in all material respects, the financial position of Integrated Silicon Solution, Inc. and subsidiaries as of September 30, 2010 and 2009 and the results of their operations and their cash flows for each of the three years in the period ended September 30, 2010 in conformity with accounting principles generally accepted in the United States of America.
We also have audited, in accordance with the standards of the Public Company Accounting Oversight Board (United States), Integrated Silicon Solution, Inc. and subsidiaries’ internal control over financial reporting as of September 30, 2010, based on criteria established in Internal Control—Integrated Framework issued by the Committee of Sponsoring Organizations of the Treadway Commission (COSO) and our report dated December 13, 2010 expressed an unqualified opinion on the effectiveness of the Company’s internal control over financial reporting.
/s/ GRANT THORNTON LLP
San Jose, California
December 13, 2010
37
Table of Contents
REPORT OF INDEPENDENT REGISTERED PUBLIC ACCOUNTING FIRM
The Board of Directors and Stockholders,
Integrated Silicon Solution, Inc.
We have audited Integrated Silicon Solution, Inc.’s (a Delaware Corporation) internal control over financial reporting as of September 30, 2010, based on criteria established in Internal Control—Integrated Framework issued by the Committee of Sponsoring Organizations of the Treadway Commission (COSO). Integrated Silicon Solution, Inc.’s management is responsible for maintaining effective internal control over financial reporting and for its assessment of the effectiveness of internal control over financial reporting, included in the accompanying Management’s Report on Internal Control over Financial Reporting. Our responsibility is to express an opinion on Integrated Silicon Solution, Inc.’s internal control over financial reporting based on our audit.
We conducted our audit in accordance with the standards of the Public Company Accounting Oversight Board (United States). Those standards require that we plan and perform the audit to obtain reasonable assurance about whether effective internal control over financial reporting was maintained in all material respects. Our audit included obtaining an understanding of internal control over financial reporting, assessing the risk that a material weakness exists, testing and evaluating the design and operating effectiveness of internal control based on the assessed risk, and performing such other procedures as we considered necessary in the circumstances. We believe that our audit provides a reasonable basis for our opinion.
A company’s internal control over financial reporting is a process designed to provide reasonable assurance regarding the reliability of financial reporting and the preparation of financial statements for external purposes in accordance with generally accepted accounting principles. A company’s internal control over financial reporting includes those policies and procedures that (1) pertain to the maintenance of records that, in reasonable detail, accurately and fairly reflect the transactions and dispositions of the assets of the company; (2) provide reasonable assurance that transactions are recorded as necessary to permit preparation of financial statements in accordance with generally accepted accounting principles, and that receipts and expenditures of the company are being made only in accordance with authorizations of management and directors of the company; and (3) provide reasonable assurance regarding prevention or timely detection of unauthorized acquisition, use, or disposition of the company’s assets that could have a material effect on the financial statements.
Because of its inherent limitations, internal control over financial reporting may not prevent or detect misstatements. Also, projections of any evaluation of effectiveness to future periods are subject to the risk that controls may become inadequate because of changes in conditions, or that the degree of compliance with the policies or procedures may deteriorate.
In our opinion, Integrated Silicon Solution, Inc. maintained, in all material respects, effective internal control over financial reporting as of September 30, 2010, based on criteria established in Internal Control—Integrated Framework issued by COSO. We also have audited, in accordance with the standards of the Public Company Accounting Oversight Board (United States), the accompanying consolidated balance sheets of Integrated Silicon Solution, Inc. as of September 30, 2010 and 2009, and the related consolidated statements of operations, stockholders’ equity, and cash flows for each of the three years in the period ended September 30, 2010, and our report dated December 13, 2010 expressed an unqualified opinion on those consolidated financial statements.
/s/ GRANT THORNTON LLP
San Jose, California
December 13, 2010
38
Table of Contents
INTEGRATED SILICON SOLUTION, INC.
CONSOLIDATED STATEMENTS OF OPERATIONS
| Years Ended September 30, | ||||||||||||
| 2010 | 2009 | 2008 | ||||||||||
| (in thousands, except per share data) | ||||||||||||
| Net sales |
$ | 252,458 | $ | 154,251 | $ | 235,229 | ||||||
| Cost of sales |
155,927 | 113,373 | 182,033 | |||||||||
| Gross profit |
96,531 | 40,878 | 53,196 | |||||||||
| Operating expenses |
||||||||||||
| Research and development |
24,066 | 20,020 | 20,848 | |||||||||
| Selling, general and administrative |
32,509 | 26,221 | 31,429 | |||||||||
| Acquired in-process technology charge |
— | 710 | — | |||||||||
| Impairment of goodwill |
— | — | 25,338 | |||||||||
| Total operating expenses |
56,575 | 46,951 | 77,615 | |||||||||
| Operating income (loss) |
39,956 | (6,073 | ) | (24,419 | ) | |||||||
| Interest and other income, net |
1,249 | 1,053 | 5,198 | |||||||||
| Interest expense |
(57 | ) | (92 | ) | (96 | ) | ||||||
| Gain on sales of investments, net |
2,761 | — | 1,814 | |||||||||
| Income (loss) before income taxes |
43,909 | (5,112 | ) | (17,503 | ) | |||||||
| Provision (benefit) for income taxes |
1,154 | (18 | ) | 197 | ||||||||
| Consolidated net income (loss) |
42,755 | (5,094 | ) | (17,700 | ) | |||||||
| Less net (income) loss attributable to noncontrolling interests |
(559 | ) | 44 | (63 | ) | |||||||
| Net income (loss) attributable to ISSI |
$ | 42,196 | $ | (5,050 | ) | $ | (17,763 | ) | ||||
| Basic net income (loss) per share |
$ | 1.65 | $ | (0.20 | ) | $ | (0.60 | ) | ||||
| Shares used in basic per share calculation |
25,603 | 25,441 | 29,541 | |||||||||
| Diluted net income (loss) per share |
$ | 1.56 | $ | (0.20 | ) | $ | (0.60 | ) | ||||
| Shares used in diluted per share calculation |
27,041 | 25,441 | 29,541 | |||||||||
See the accompanying notes to consolidated financial statements
39
Table of Contents
INTEGRATED SILICON SOLUTION, INC.
CONSOLIDATED BALANCE SHEETS
| As of September 30, | ||||||||
| 2010 | 2009 | |||||||
| (in thousands, except Par value) |
||||||||
| ASSETS |
||||||||
| Current assets: |
||||||||
| Cash and cash equivalents |
$ | 81,665 | $ | 54,944 | ||||
| Restricted cash |
5,107 | — | ||||||
| Short-term investments |
4,837 | 28,542 | ||||||
| Accounts receivable, net of allowance for doubtful accounts of $154 in 2010 and $1,338 in 2009 |
41,148 | 26,501 | ||||||
| Inventories |
54,560 | 19,275 | ||||||
| Other current assets |
4,479 | 2,922 | ||||||
| Total current assets |
191,796 | 132,184 | ||||||
| Property, equipment and leasehold improvements, net |
28,078 | 23,218 | ||||||
| Long-term investments |
— | 1,408 | ||||||
| Goodwill |
1,301 | 1,251 | ||||||
| Purchased intangible assets, net |
1,294 | 2,313 | ||||||
| Other assets |
11,562 | 1,556 | ||||||
| Total assets |
$ | 234,031 | $ | 161,930 | ||||
| LIABILITIES AND STOCKHOLDERS’ EQUITY |
||||||||
| Current liabilities: |
||||||||
| Accounts payable |
$ | 41,586 | $ | 26,825 | ||||
| Accrued compensation and benefits |
6,406 | 4,364 | ||||||
| Accrued expenses |
5,930 | 5,368 | ||||||
| Total current liabilities |
53,922 | 36,557 | ||||||
| Other long-term liabilities |
2,288 | 797 | ||||||
| Total liabilities |
56,210 | 37,354 | ||||||
| Commitments and contingencies (See Note 15) |
||||||||
| Stockholders’ equity: |
||||||||
| Preferred stock, $0.0001 par value: Authorized shares—5,000 in 2010 and 2009. No shares outstanding |
— | — | ||||||
| Common stock, $0.0001 par value: Authorized shares—70,000 in 2010 and 2009. Issued and outstanding shares—26,217 in 2010 and 25,116 in 2009 |
3 | 2 | ||||||
| Additional paid-in capital |
317,773 | 309,649 | ||||||
| Accumulated deficit |
(143,285 | ) | (185,481 | ) | ||||
| Accumulated other comprehensive loss |
(2,286 | ) | (1,344 | ) | ||||
| Total ISSI stockholders’ equity |
172,205 | 122,826 | ||||||
| Noncontrolling interest |
5,616 | 1,750 | ||||||
| Total stockholders’ equity |
177,821 | 124,576 | ||||||
| Total liabilities and stockholders’ equity |
$ | 234,031 | $ | 161,930 | ||||
See the accompanying notes to consolidated financial statements
40
Table of Contents
INTEGRATED SILICON SOLUTION, INC.
CONSOLIDATED STATEMENTS OF STOCKHOLDERS’ EQUITY
| Common Stock | Additional Paid-In Capital |
Accumulated Deficit |
Accumulated Other Comprehensive Income (Loss) |
Total ISSI Stockholders’ Equity |
Non-controlling Interest |
Total Stockholders’ Equity |
||||||||||||||||||||||||||
| Shares | Amount | |||||||||||||||||||||||||||||||
| (in thousands) | ||||||||||||||||||||||||||||||||
| Balance at September 30, 2007 |
36,655 | $ | 4 | $ | 376,998 | $ | (162,668 | ) | $ | (583 | ) | $ | 213,751 | $ | 726 | $ | 214,477 | |||||||||||||||
| Components of comprehensive loss: |
||||||||||||||||||||||||||||||||
| Net loss |
— | — | — | (17,763 | ) | — | (17,763 | ) | 63 | (17,700 | ) | |||||||||||||||||||||
| Change in cumulative translation adjustment, net of tax |
— | — | — | — | 296 | 296 | — | 296 | ||||||||||||||||||||||||
| Change in unrealized gain on investments, net of tax |
— | — | — | — | (2,472 | ) | (2,472 | ) | — | (2,472 | ) | |||||||||||||||||||||
| Change in retirement plan obligations, net of tax |
— | — | — | — | (135 | ) | (135 | ) | — | (135 | ) | |||||||||||||||||||||
| Total comprehensive loss |
(20,074 | ) | 63 | (20,011 | ) | |||||||||||||||||||||||||||
| Stock options exercised |
105 | — | 415 | — | — | 415 | — | 415 | ||||||||||||||||||||||||
| Shares issued under stock purchase plan |
170 | — | 734 | — | — | 734 | — | 734 | ||||||||||||||||||||||||
| Stock-based compensation |
— | — | 3,646 | — | — | 3,646 | — | 3,646 | ||||||||||||||||||||||||
| Shares repurchased and retired |
(10,203 | ) | (1 | ) | (71,081 | ) | — | — | (71,082 | ) | — | (71,082 | ) | |||||||||||||||||||
| Balance at September 30, 2008 |
26,727 | 3 | 310,712 | (180,431 | ) | (2,894 | ) | 127,390 | 789 | 128,179 | ||||||||||||||||||||||
| Components of comprehensive loss: |
||||||||||||||||||||||||||||||||
| Net loss |
— | — | — | (5,050 | ) | — | (5,050 | ) | (44 | ) | (5,094 | ) | ||||||||||||||||||||
| Change in cumulative translation adjustment, net of tax |
— | — | — | — | (137 | ) | (137 | ) | — | (137 | ) | |||||||||||||||||||||
| Change in unrealized gain on investments, net of tax |
— | — | — | — | 1,937 | 1,937 | — | 1,937 | ||||||||||||||||||||||||
| Change in retirement plan obligations, net of tax |
— | — | — | — | (250 | ) | (250 | ) | — | (250 | ) | |||||||||||||||||||||
| Total comprehensive loss |
(3,500 | ) | (44 | ) | (3,544 | ) | ||||||||||||||||||||||||||
| Stock options exercised and shares issued upon vesting of restricted stock units (RSUs) |
72 | — | 81 | — | — | 81 | — | 81 | ||||||||||||||||||||||||
| Shares issued under stock purchase plan |
369 | — | 657 | — | — | 657 | — | 657 | ||||||||||||||||||||||||
| Stock-based compensation |
— | — | 3,096 | — | — | 3,096 | — | 3,096 | ||||||||||||||||||||||||
| Shares repurchased and retired |
(2,052 | ) | (1 | ) | (4,897 | ) | — | — | (4,898 | ) | — | (4,898 | ) | |||||||||||||||||||
| Noncontrolling interest in Wintram |
— | — | — | — | — | — | 795 | 795 | ||||||||||||||||||||||||
| Change in noncontrolling interest in Wintram |
— | — | — | — | — | — | 210 | 210 | ||||||||||||||||||||||||
| Balance at September 30, 2009 |
25,116 | 2 | 309,649 | (185,481 | ) | (1,344 | ) | 122,826 | 1,750 | 124,576 | ||||||||||||||||||||||
| Components of comprehensive income: |
||||||||||||||||||||||||||||||||
| Net income |
— | — | — | 42,196 | — | 42,196 | 559 | 42,755 | ||||||||||||||||||||||||
| Change in cumulative translation adjustment, net of tax |
— | — | — | — | 1,839 | 1,839 | — | 1,839 | ||||||||||||||||||||||||
| Change in unrealized gain on investments, net of tax |
— | — | — | — | (927 | ) | (927 | ) | — | (927 | ) | |||||||||||||||||||||
| Change in retirement plan obligations, net of tax |
— | — | — | — | (1,854 | ) | (1,854 | ) | — | (1,854 | ) | |||||||||||||||||||||
| Total comprehensive income |
41,254 | 559 | 41,813 | |||||||||||||||||||||||||||||
| Stock options exercised and shares issued upon vesting of restricted stock units (RSUs) |
1,231 | 1 | 5,279 | — | — | 5,280 | — | 5,280 | ||||||||||||||||||||||||
| Shares issued under stock purchase plan |
116 | — | 687 | — | — | 687 | — | 687 | ||||||||||||||||||||||||
| Stock-based compensation |
— | — | 2,497 | — | — | 2,497 | — | 2,497 | ||||||||||||||||||||||||
| Shares repurchased and retired |
(246 | ) | — | (1,108 | ) | — | — | (1,108 | ) | — | (1,108 | ) | ||||||||||||||||||||
| Noncontrolling interest in Giantec |
— | — | 740 | — | — | 740 | 3,045 | 3,785 | ||||||||||||||||||||||||
| Change in noncontrolling interest in Wintram |
— | — | 29 | — | — | 29 | 262 | 291 | ||||||||||||||||||||||||
| Balance at September 30, 2010 |
26,217 | $ | 3 | $ | 317,773 | $ | (143,285 | ) | $ | (2,286 | ) | $ | 172,205 | $ | 5,616 | $ | 177,821 | |||||||||||||||
See the accompanying notes to consolidated financial statements
41
Table of Contents
INTEGRATED SILICON SOLUTION, INC.
CONSOLIDATED STATEMENTS OF CASH FLOWS
| Years Ended September 30, | ||||||||||||
| 2010 | 2009 | 2008 | ||||||||||
| (in thousands) | ||||||||||||
| Cash flows from operating activities: |
||||||||||||
| Consolidated net income (loss) |
$ | 42,755 | $ | (5,094 | ) | $ | (17,700 | ) | ||||
| Adjustments to reconcile net income (loss) to net cash provided by operating activities: |
||||||||||||
| Stock-based compensation |
2,497 | 3,096 | 3,646 | |||||||||
| Depreciation and amortization |
3,530 | 3,987 | 3,487 | |||||||||
| Amortization of intangibles |
1,018 | 927 | 1,538 | |||||||||
| Acquired in-process technology charge |
— | 710 | — | |||||||||
| Net gain on sale of investments |
(2,761 | ) | — | (1,814 | ) | |||||||
| Impairment of goodwill |
— | — | 25,338 | |||||||||
| Provision for (recovery of) bad debts |
13 | (179 | ) | 59 | ||||||||
| Net foreign currency transaction (gains) losses |
(87 | ) | 303 | (509 | ) | |||||||
| Other non-cash items |
260 | 135 | — | |||||||||
| Changes in operating assets and liabilities: |
||||||||||||
| Accounts receivable |
(14,415 | ) | 9,357 | 2,326 | ||||||||
| Inventories |
(34,044 | ) | 20,123 | (6,454 | ) | |||||||
| Other assets |
(1,040 | ) | 2,115 | 995 | ||||||||
| Deposit to foundry for capacity |
(10,000 | ) | — | — | ||||||||
| Accounts payable |
13,909 | (10,260 | ) | (1,667 | ) | |||||||
| Accrued expenses and other liabilities |
2,113 | (2,616 | ) | 1,271 | ||||||||
| Net cash provided by operating activities |
3,748 | 22,604 | 10,516 | |||||||||
| Cash flows from investing activities: |
||||||||||||
| Acquisition of property, equipment and leasehold improvements |
(8,084 | ) | (2,820 | ) | (4,597 | ) | ||||||
| Proceeds from sale of assets |
— | 3 | — | |||||||||
| Proceed from sales of trading securities |
19,950 | — | — | |||||||||
| Purchases of available-for-sale securities |
(911 | ) | (11,816 | ) | (68,559 | ) | ||||||
| Sales of available-for-sale securities |
4,752 | 10,901 | 116,928 | |||||||||
| Investment in consolidated subsidiaries, net of cash and cash equivalents |
(50 | ) | (2,682 | ) | — | |||||||
| Proceeds from noncontrolling interest of consolidated subsidiary |
3,785 | 795 | — | |||||||||
| Proceeds from sale of Ralink equity securities |
3,216 | — | 1,809 | |||||||||
| Proceeds from sale of Semiconductor Manufacturing International Corp. (SMIC) equity securities |
— | — | 2,713 | |||||||||
| Increase in restricted cash |
(5,107 | ) | — | — | ||||||||
| Net cash provided by (used in) investing activities |
17,551 | (5,619 | ) | 48,294 | ||||||||
| Cash flows from financing activities: |
||||||||||||
| Repurchases and retirements of common stock |
(1,108 | ) | (4,898 | ) | (71,082 | ) | ||||||
| Proceeds from issuance of stock through compensation plans |
5,967 | 738 | 1,149 | |||||||||
| Proceeds from borrowings under short-term lines of credit |
— | 12,216 | 11,955 | |||||||||
| Principal payments of notes payable, equipment financing and long-term obligations |
— | (12,216 | ) | (12,569 | ) | |||||||
| Net cash provided by (used in) financing activities |
4,859 | (4,160 | ) | (70,547 | ) | |||||||
| Effect of exchange rate changes on cash and cash equivalents |
563 | (56 | ) | 190 | ||||||||
| Net increase (decrease) in cash and cash equivalents |
26,721 | 12,769 | (11,547 | ) | ||||||||
| Cash and cash equivalents at beginning of year |
54,944 | 42,175 | 53,722 | |||||||||
| Cash and cash equivalents at end of year |
$ | 81,665 | $ | 54,944 | $ | 42,175 | ||||||
| Supplemental disclosures of cash flow information: |
||||||||||||
| Cash paid (refunded) for income taxes |
$ | 865 | $ | (16 | ) | $ | 257 | |||||
| Cash paid for interest expense |
$ | — | $ | 14 | $ | 27 | ||||||
See the accompanying notes to consolidated financial statements
42
Table of Contents
INTEGRATED SILICON SOLUTION, INC.
NOTES TO CONSOLIDATED FINANCIAL STATEMENTS
Note 1. Organization and Significant Accounting Policies
Organization
Integrated Silicon Solution, Inc. (the “Company”) was incorporated in California on October 27, 1988 and reincorporated in Delaware on August 9, 1993. The Company is a fabless semiconductor company that designs and markets high performance integrated circuits for the following key markets: (i) digital consumer electronics, (ii) networking and telecommunications, (iii) mobile communications, (iv) automotive electronics and (v) industrial. The Company’s primary products are high speed and low power SRAM and low and medium density DRAM.
In January 2010, the Company formed a separate business unit, Giantec Semiconductor, Inc. (Giantec). As part of this formation, Shanghai Zhang Jiang Science & Technology Investment Corporation invested approximately $3.8 million in Giantec. The Company still owns more than 50% of Giantec and, as such, continues to consolidate the financial results of Giantec. Through its Giantec business unit, the Company designs and markets application specific standard products (ASSP) primarily EEPROMs and SmartCards focused on our key markets. Giantec is actively seeking additional equity investment from outside investors and in the event such investment is obtained, the Company’s ownership could be diluted to be less than 50%, in which case the Company would no longer consolidate Giantec.
Basis of Presentation
The accompanying consolidated financial statements include the accounts of Integrated Silicon Solution, Inc. and its wholly and majority owned subsidiaries, after elimination of all significant intercompany accounts and transactions.
Cash and Cash Equivalents
The Company considers all highly liquid investments with an original maturity of 90 days or less at the date of purchase to be cash equivalents. Cash and cash equivalents are maintained at various financial institutions.
Investments
Debt securities and marketable equity securities are classified as either “trading” or “available-for-sale”. Trading and available-for-sale securities are recorded at fair value with unrealized gains and losses included in earnings or accumulated other comprehensive income/(loss), respectively. Realized gains and losses and declines in value judged to be other-than-temporary on available-for-sale securities are included in loss on investments. The cost of fixed income securities sold is based on the specific identification method and the weighted-average method is used to determine the cost basis of publicly traded equity securities disposed of. Interest and dividends on securities classified as available-for-sale are included in interest and other income, (net).
The Company regularly reviews its investments to determine whether a decline in fair value below the cost basis is other than temporary. If the decline in fair value is determined to be other than temporary, the cost basis of the investment is written down to fair value, and the amount of the write-down is included in the Consolidated Statements of Operations.
Inventories
Inventories are stated at the lower of cost (first-in, first-out) or market. The Company’s inventory valuation process is done on a part-by-part basis. Lower of cost or market adjustments, specifically identified on a part-by-part basis, reduce the carrying value of the related inventory and takes into consideration reductions in
43
Table of Contents
INTEGRATED SILICON SOLUTION, INC.
NOTES TO CONSOLIDATED FINANCIAL STATEMENTS—(Continued)
sales prices. Determining the market value of inventories on hand and at distributors as of the balance sheet date involves numerous judgments, including projecting average selling prices and sales volumes for future periods and costs to complete products in work in process inventories. When market values are below the Company’s costs, the Company records a charge to cost of goods sold to write down inventories to estimated market value in advance of when the inventories are actually sold. If actual market conditions are less favorable than those projected by management, additional inventory write-downs may be required that may adversely affect the Company’s operating results. If actual market conditions are more favorable, the Company may have higher gross margins when products are sold. The Company writes down to zero dollars the carrying value of inventory on hand that has aged over one year to cover estimated excess and obsolete exposures, unless adjustments are made based on management’s judgments for newer products, end of life products, planned inventory increases or strategic customer supply. Once established, these write-downs are considered permanent.
Property, Equipment and Leasehold Improvements
Property, equipment, and leasehold improvements are stated at cost. Depreciation and amortization are computed using the straight-line method, based upon the shorter of the estimated useful lives ranging from two to ten years for property and equipment and fifty years for buildings or the lease term for leasehold improvements to leased properties.
Goodwill and Purchased Intangible Assets
The Company is required to test goodwill and other indefinite-lived intangible assets for impairment on an annual basis and between annual tests if current events or circumstances require an interim impairment assessment. For goodwill, the Company performs a two-step impairment test. In the first step, the Company compares the fair value of the reporting unit to its carrying value, including goodwill. The Company determines the fair value of the reporting unit based on a weighting of income and market approaches. If the fair value of the reporting unit exceeds the carrying value of the net assets assigned to that unit, goodwill is not impaired and no further testing is performed. If the carrying value of the net assets assigned to the reporting unit exceeds the fair value of the reporting unit, then the Company performs the second step of the impairment test in order to determine the implied fair value of the reporting unit’s goodwill. If the carrying value of a reporting unit’s goodwill exceeds its implied fair value, the Company records an impairment loss equal to the difference. Based on the impairment tests performed, the Company recorded impairment charges for goodwill of $25.3 million in fiscal 2008.
Purchased intangible assets other than goodwill are amortized over their useful lives unless these lives are determined to be indefinite. Purchased intangible assets with definite lives are carried at cost less accumulated amortization. Amortization is computed over the estimated useful lives of the respective assets, generally six months to six years.
Valuation of Long-Lived Assets and Certain Identifiable Intangibles
The Company evaluates the recoverability of property, plant and equipment and identifiable intangible assets through the performance of periodic reviews to determine whether facts and circumstances exist that would indicate that the carrying amounts of property, plant and equipment and identifiable intangible assets exceed their fair values. If facts and circumstances indicate that the carrying amount of property, plant and equipment might not be fully recoverable, projected undiscounted net cash flows associated with the related asset or group of assets over their estimated remaining useful life is compared to their respective carrying amounts. In the event that the projected undiscounted cash flows are not sufficient to recover the carrying value of the assets, the assets are written down to their estimated fair values based on the expected discounted future cash flows attributable to the assets.
44
Table of Contents
INTEGRATED SILICON SOLUTION, INC.
NOTES TO CONSOLIDATED FINANCIAL STATEMENTS—(Continued)
Comprehensive Income (Loss)
Comprehensive income (loss) includes net income (loss) as well as other comprehensive income (loss). The Company’s other comprehensive income (loss) consists of changes in cumulative translation adjustment, unrealized gains and losses on investments and retirement plan transition and actuarial gains and losses.
Comprehensive income (loss), net of taxes (which were immaterial for all periods presented), was as follows:
| Years Ended September 30, | ||||||||||||
| 2010 | 2009 | 2008 | ||||||||||
| (in thousands) | ||||||||||||
| Consolidated net income (loss) |
$ | 42,755 | $ | (5,094 | ) | $ | (17,700 | ) | ||||
| Other comprehensive income (loss), net of tax: |
||||||||||||
| Change in cumulative translation adjustment: |
||||||||||||
| Changes arising during current period |
1,839 | (137 | ) | 461 | ||||||||
| Reclassification for gain included in net income (loss) |
— | — | (165 | ) | ||||||||
| Change in unrealized gain (loss) on investments: |
||||||||||||
| Changes arising during current period |
746 | 390 | (2,388 | ) | ||||||||
| Reclassification for gain (loss) included in net income (loss) |
(1,673 | ) | 1,547 | (84 | ) | |||||||
| Change in retirement plan transition obligation |
(47 | ) | (553 | ) | (65 | ) | ||||||
| Change in retirement plan actuarial losses |
(1,807 | ) | 303 | (70 | ) | |||||||
| Comprehensive income (loss) |
$ | 41,813 | $ | (3,544 | ) | $ | (20,011 | ) | ||||
| Comprehensive income (loss) attributable to noncontrolling interests |
(559 | ) | 44 | (63 | ) | |||||||
| Comprehensive income (loss) attributable to ISSI |
$ | 41,254 | $ | (3,500 | ) | $ | (20,074 | ) | ||||
The components of accumulated other comprehensive income (loss), net of tax, were as follows at September 30:
| 2010 | 2009 | |||||||
| (In thousands) | ||||||||
| Accumulated foreign currency translation adjustments |
$ | 266 | $ | (1,573 | ) | |||
| Accumulated net unrealized gain on Ralink |
— | 1,673 | ||||||
| Accumulated net unrealized loss on SMIC |
(1,270 | ) | (2,018 | ) | ||||
| Accumulated net unrealized gain (loss) on other available-for-sale investments |
— | 2 | ||||||
| Accumulated net retirement plan transition obligation |
361 | 408 | ||||||
| Accumulated net retirement plan actuarial gains (losses) |
(1,643 | ) | 164 | |||||
| Total accumulated other comprehensive loss |
$ | (2,286 | ) | $ | (1,344 | ) | ||
The estimated net prior service cost, actuarial loss, and transition obligation for the defined benefit plan that will be amortized from accumulated other comprehensive income (loss) into net periodic benefit cost during fiscal year 2011 is $0, $60,000, and $(58,000), respectively.
Revenue Recognition and Accounts Receivable Allowances
Revenue from product sales to the Company’s direct customers is recognized upon shipment provided that persuasive evidence of a sales arrangement exists, the price is fixed or determinable, title has transferred, collection of resulting receivables is reasonably assured, there are no customer acceptance requirements and there
45
Table of Contents
INTEGRATED SILICON SOLUTION, INC.
NOTES TO CONSOLIDATED FINANCIAL STATEMENTS—(Continued)
are no remaining significant obligations. The Company makes estimates of potential future product returns and sales allowances related to current period product revenue. Management analyzes historical returns, changes in customer demand, and acceptance of products when evaluating the adequacy of sales returns and allowances. Estimates made by the Company may differ from actual product returns and sales allowances. These differences may materially impact reported revenue and amounts ultimately collected on accounts receivable.
A portion of the Company’s sales is made to distributors under agreements that provide the possibility of certain price adjustment credits, as discussed below, and to return qualifying products for credit, as determined by us, in order to reduce the amounts of slow-moving, discontinued or obsolete product from their inventory. These agreements limit such returns to a certain percentage of the value of our shipments to that distributor during the prior quarter. In addition, distributors are allowed to return unsold products if the Company terminates the relationship with the distributor.
Distributors are granted price adjustment credits related to many of their sales to their customers. Price adjustment credits are granted when a distributor’s standard cost (i.e., the Company’s sales price to the distributor) does not provide the distributor with an appropriate margin on its sales to its customers. As a result, the distributor may request and receive a price adjustment credit from the Company to allow the distributor to earn an appropriate margin on the transaction. Distributors are also granted price adjustment credits in the event of a price decrease subsequent to the date the product was shipped and billed to the distributor. Generally, the Company will provide a credit equal to the difference between the price paid by the distributor (less any prior credits on such products) and the new price for the product multiplied by the quantity of such product in the distributor’s inventory at the time of the price decrease. Certain of the Company’s distributor arrangements may allow or require the granting of price concessions below the Company’s cost for a product.
Given the uncertainties associated with the levels of returns and other price adjustment credits that will be issued to these distributors, the sales price to distributors is not fixed or determinable until the distributors resell the products to their customers. Therefore, the Company defers revenue recognition from sales to these distributors until the distributors have sold the products to their end customers.
Title to the inventory transfers to a distributor at the time of shipment or delivery to the distributor, and payment from the distributor is due in accordance with our standard payment terms. These payment terms are not contingent upon the distributors’ sale of the products to their customers. Upon title transfer to distributors, inventory is reduced for the cost of goods shipped, the deferred distributor margin (sales less cost of sales) is recorded as a liability and an account receivable is recorded.
The deferred costs of sales to distributors may be subject to impairment. The Company monitors the level and nature of product returns from distributors as well as the levels of inventory held at distributors. On a quarterly basis, the Company reviews the inventory held at distributors in terms of the Company’s inventory valuation policy and records a charge to cost of goods sold for all known lower of cost or market and excess and obsolescence issues.
In addition, the Company monitors collectibility of accounts receivable primarily through review of its accounts receivable aging. When facts and circumstances indicate the collection of specific amounts or from specific customers is at risk, the Company assesses the impact on amounts recorded for bad debts and, if necessary, will record a charge in the period such determination is made.
46
Table of Contents
INTEGRATED SILICON SOLUTION, INC.
NOTES TO CONSOLIDATED FINANCIAL STATEMENTS—(Continued)
The following describes activity in the accounts receivable allowance for doubtful accounts for the years ended September 30, 2010, 2009 and 2008.
| Description |
Balance at Beginning of Period |
Adjustments to Costs and Expenses(1) |
Deductions(2) | Balance at End of Period |
||||||||||||
| (in thousands) | ||||||||||||||||
| Accounts receivable—Allowance for doubtful accounts: |
||||||||||||||||
| 2008 |
$ | 1,465 | $ | 59 | $ | (5 | ) | $ | 1,519 | |||||||
| 2009 |
$ | 1,519 | $ | (179 | ) | $ | (2 | ) | $ | 1,338 | ||||||
| 2010 |
$ | 1,338 | $ | 13 | $ | (1,197 | ) | $ | 154 | |||||||
| (1) | Includes increases/(decreases) charged or credited to costs and expenses. |
| (2) | Uncollectible accounts written off, net of recoveries |
Research and Development
Research and development expenditures are charged to operations as incurred.
Foreign Currency Translation
The Company uses the local currency as its functional currency for all foreign subsidiaries. Translation adjustments, which result from the process of translating foreign currency financial statements into U.S. dollars, are included in the accumulated other comprehensive income component of stockholders’ equity.
Advertising Costs
The Company expenses advertising costs as incurred and includes these costs in selling, general and administrative expenses in the Consolidated Statement of Operations. Advertising costs totaled $35,000, $62,000 and $72,000 for the fiscal years ended September 30, 2010, 2009 and 2008, respectively.
Income Taxes
The Company accounts for current and deferred income taxes and, when appropriate, deferred tax assets and liabilities are recorded with respect to temporary differences in the accounting treatment of items for financial reporting purposes and for income tax purposes. The Company records a valuation allowance against deferred tax assets when it is more likely than not that such assets will not be realized.
In July 2006, the Financial Accounting Standards Board (FASB) issued guidance which clarifies the accounting for income taxes by prescribing a comprehensive model for the financial statement recognition, measurement, presentation and disclosure of uncertain tax positions taken or expected to be taken in income tax returns. The Company adopted this guidance on its income tax positions on October 1, 2007. See “Note 11: Income Taxes” for additional information.
Stock-Based Compensation
Stock-based compensation is measured at the grant date, based on the fair value of the award. The Company amortizes the compensation costs on a straight-line basis over the requisite service period of the option, which is generally the option vesting term of four years. The Company estimates the fair value of stock options using the Black-Scholes valuation model. The Black-Scholes valuation model requires the Company to estimate key assumptions such as expected term, volatility and forfeiture rates to determine the fair value of a stock option.
47
Table of Contents
INTEGRATED SILICON SOLUTION, INC.
NOTES TO CONSOLIDATED FINANCIAL STATEMENTS—(Continued)
The estimates of these key assumptions are based on historical information and judgment regarding market factors and trends.
Use of Estimates
The preparation of financial statements in conformity with U.S. generally accepted accounting principles requires management to make estimates and assumptions that affect the reported amounts of assets, liabilities and the disclosure of contingent assets and liabilities at the date of the financial statements as well as the reported amounts of revenues and expenses during the reporting period. Such estimates relate to the useful lives and fair value of fixed assets, the fair value of investments, allowances for doubtful accounts and customer returns, inventory write-downs, potential reserves relating to litigation matters, accrued liabilities, and other reserves. The Company bases its estimates and judgments on its historical experience, knowledge of current conditions and its beliefs of what could occur in the future, given available information. Actual results may differ from those estimates, and such difference, may be material to the financial statements.
Fair Value of Financial Instruments
The Company’s financial instruments consist primarily of cash and cash equivalents, marketable securities, accounts receivable and accounts payable. The Company believes that the carrying amounts of the financial instruments approximate their respective fair values. When there is no readily available market data, the Company may make fair value estimates, which may not necessarily represent the amounts that will be realized in a current or future sale of these assets.
Concentration of Credit Risk
The Company operates in one business segment, which is to design, develop, and market high performance SRAM, DRAM, and other memory and non-memory semiconductor products. The Company markets and distributes its products on a worldwide basis, primarily to original equipment manufacturers, contract manufacturers, and distributors. The Company performs ongoing credit evaluations of its customers’ financial condition and generally requires no collateral. In fiscal 2010, revenue from the Company’s largest and second largest distributor accounted for approximately 15% and 10%, respectively, of our total net sales. In fiscal 2009, revenue recognized for one distributor, accounted for approximately 13% of our total net sales. In fiscal 2008, no single customer accounted for over 10% of our total net sales.
The Company maintains cash, cash equivalents, and short-term investments with various high credit quality financial institutions. The Company’s investment policy is designed to limit exposure to any one institution. The Company performs periodic evaluations of the relative credit standing of those financial institutions that are considered in its investment strategy. The Company is exposed to credit risk in the event of default by the financial institutions or issuers of investments to the extent of the amount recorded on the balance sheet. To date, the Company has not incurred losses related to these investments.
Product Warranty and Indemnifications
The Company generally warrants its products against defects in materials and workmanship for a period of 12 months. Liability for a stated warranty period is usually limited to replacement of defective items or return of amounts paid. If there is a material increase in the rate of customer claims or the Company’s estimates of probable losses relating to specifically identified warranty exposures are inaccurate, the Company may record a charge against future cost of sales. Warranty expense has historically been immaterial to the Company’s financial statements.
48
Table of Contents
INTEGRATED SILICON SOLUTION, INC.
NOTES TO CONSOLIDATED FINANCIAL STATEMENTS—(Continued)
The Company may be obligated to indemnify certain customers, distributors, suppliers, and subcontractors for attorney fees and damages and costs awarded against these parties in certain circumstances in which its products are alleged to infringe third party intellectual property rights, including patents, registered trademarks, or copyrights. The terms of the Company’s indemnification obligations are generally perpetual from the effective date of the agreement. In certain cases, there are limits on and exceptions to the Company’s potential liability for indemnification relating to intellectual property infringement claims. In addition, the Company has entered into indemnification agreements with its officers and directors, and the Company’s bylaws provide that indemnification may be provided to the Company’s agents. The Company has directors’ and officers’ insurance pursuant to which the Company may be reimbursed for certain indemnity expenses, subject to the insurers’ reservation of rights. The Company cannot estimate the amount of potential future indemnity expenses that it may be required to make. The amount of available directors’ and officers’ insurance may not be sufficient to cover the Company’s indemnity obligations, which may have a material adverse effect on the Company’s results of operations in future periods.
Net Income (Loss) Per Share
Basic and diluted net loss per share and basic net income per share is computed using the weighted number of common shares outstanding during the period. Diluted net income per share is computed using the weighted average number of common and dilutive common equivalent shares outstanding, if applicable, during the period. Common equivalent shares consist of the shares issuable upon the assumed exercise of stock options under the treasury stock method.
Accounting Pronouncements
The FASB is the authoritative body for financial accounting and reporting in the United States. On July 31, 2009, the FASB Accounting Standards Codification (the “ASC”) became the authoritative source of accounting principles to be applied to the financial statements of nongovernmental entities prepared in accordance with GAAP.
Impact of Recently Issued Accounting Standards
During fiscal 2010, the Company adopted the following accounting standards, none of which had a material effect on its consolidated results of operations during such period or financial condition at the end of such period:
Business Combinations
In December 2007, the Financial Accounting Standards Board (FASB) issued guidance that establishes principles and requirements for determining how a company recognizes and measures the fair value of certain assets and liabilities acquired in a business combination, including noncontrolling interests, contingent consideration, and certain acquired contingencies. The guidance on business combinations also requires acquisition-related transaction expenses and restructuring costs be expensed as incurred rather than capitalized.
Noncontrolling Interest (Minority Interest)
In December 2007 and January 2010, the FASB issued guidance on the accounting and reporting for a noncontrolling interest in a subsidiary. The Company is required to report its noncontrolling interests as a separate component of stockholders’ equity. The Company is also required to present net income attributable to the noncontrolling interests and net income attributable to the stockholders of the Company separately in its consolidated statements of operations.
49
Table of Contents
INTEGRATED SILICON SOLUTION, INC.
NOTES TO CONSOLIDATED FINANCIAL STATEMENTS—(Continued)
Fair Value Disclosure
In January 2010, the FASB amended the disclosure requirements for the fair value measurements for recurring and nonrecurring non-financial assets and liabilities. These disclosure requirements are effective in two phases. In the second quarter of fiscal year 2010, the Company adopted the requirements for disclosures about inputs and valuation techniques used to measure fair value as well as disclosures about significant transfers. Beginning in the first quarter of fiscal year 2012, these amended accounting standards will require presentation of disaggregated activity within the reconciliation for fair value measurements using significant unobservable inputs relating to Level 3 measurements. The Company does not anticipate that the additional disclosure requirements will have a material impact on its consolidated financial statements.
Reclassifications
Certain reclassifications have been made to prior year balances in order to conform to the current year’s presentation for the adoption of accounting guidance for noncontrolling interests.
Note 2. Fair Value Measurements
Fair value is defined as the price expected to be received from the sale of an asset or paid to transfer a liability in a transaction between market participants at the measurement date. In determining fair value, the Company uses various valuation approaches, including quoted market prices and discounted cash flows. The FASB guidance also establishes a hierarchy for inputs used in measuring fair value that maximizes the use of observable inputs and minimizes the use of unobservable inputs by requiring that the most observable inputs be used when available. Observable inputs are inputs that the market participants would use in pricing the asset or liability developed based on market data obtained from independent sources. Unobservable inputs are inputs that reflect a company’s judgment concerning the assumptions that market participants would use in pricing the asset or liability developed based on the best information available at that time. The fair value hierarchy is broken down into the following three levels based on the reliability of inputs:
| • | Level 1—Valuations based on quoted prices in active markets for identical instruments that the Company is able to access. Since valuations are based on quoted prices which are readily and regularly available in an active market, valuation of these products can be done without a significant degree of judgment. |
| • | Level 2—Valuations based on quoted prices in active markets for instruments that are similar, or quoted prices in markets that are not active for identical or similar instruments and model-derived valuations in which all significant inputs and significant value drives are observable in active markets. |
| • | Level 3—Valuations based on inputs that are unobservable and significant to the overall fair value measurement. These values are generally determined using pricing models for which the assumptions utilize management’s estimates of market participant assumptions. |
As of September 30, 2010, the Company’s financial assets utilizing Level 1 inputs included short-term investment securities traded on active securities exchanges. The Company did not have any financial assets utilizing Level 2 or Level 3 inputs at September 30, 2010.
50
Table of Contents
INTEGRATED SILICON SOLUTION, INC.
NOTES TO CONSOLIDATED FINANCIAL STATEMENTS—(Continued)
The following tables represent the Company’s fair value hierarchy for financial assets measured at fair value on a recurring basis:
| Quoted Prices in Active Markets for Identical Assets (Level 1) |
Significant Unobservable Inputs (Level 3) |
Total | ||||||||||
| (in thousands) | ||||||||||||
| September 30, 2010 |
||||||||||||
| Money market instruments (1) |
$ | 44,239 | $ | — | $ | 44,239 | ||||||
| Certificates of deposit (1)(2)(3) |
9,352 | — | 9,352 | |||||||||
| Semiconductor Manufacturing International Corp. |
||||||||||||
| (SMIC) common stock (3) |
2,156 | — | 2,156 | |||||||||
| Total |
$ | 55,747 | $ | — | $ | 55,747 | ||||||
| September 30, 2009 |
||||||||||||
| Money market instruments (1) |
$ | 16,041 | $ | — | $ | 16,041 | ||||||
| Auction rate securities (3)(5) |
— | 18,042 | 18,042 | |||||||||
| Auction rate securities Put Option (3)(5) |
— | 1,908 | 1,908 | |||||||||
| Certificates of deposit (1)(3) |
9,938 | — | 9,938 | |||||||||
| Mutual funds (3) |
2,797 | — | 2,797 | |||||||||
| Ralink common stock (3) |
2,130 | — | 2,130 | |||||||||
| Semiconductor Manufacturing International Corp. |
||||||||||||
| (SMIC) common stock (4) |
1,408 | — | 1,408 | |||||||||
| Total |
$ | 32,314 | $ | 19,950 | $ | 52,264 | ||||||
| (1) | Included in cash and cash equivalents |
| (2) | Included in restricted cash |
| (3) | Included in short-term investments |
| (4) | Included in long-term investments |
| (5) | Classified as trading securities |
The following table provides a summary of changes in the fair value of the Company’s Level 3 financial assets during fiscal 2010:
| Auction Rate Securities |
Put Option |
|||||||
| (in thousands) | ||||||||
| Balance as of September 30, 2009 |
$ | 18,042 | $ | 1,908 | ||||
| Sale of ARS to UBS |
(18,042 | ) | — | |||||
| Exercise of put option |
— | (1,908 | ) | |||||
| Balance as of September 30, 2010 |
$ | — | $ | — | ||||
Financial assets utilizing Level 3 inputs included long-term investments in auction rate securities (ARS) consisting of securities collateralized by student loans. Due to adverse events in the credit markets, the ARS held by the Company experienced failed auctions since February 2008. As such, quoted prices in active markets were not readily available. In November 2008, the Company entered into an agreement (the “Agreement”) with UBS AG (UBS), the investment firm that sold the ARS to the Company. The Agreement covered all of the Company’s ARS as of September 30, 2009. By entering into the Agreement, the Company (1) received the right (“Put
51
Table of Contents
INTEGRATED SILICON SOLUTION, INC.
NOTES TO CONSOLIDATED FINANCIAL STATEMENTS—(Continued)
Option”) to sell these ARS back to UBS at par, at its sole discretion, anytime during the period from June 30, 2010 through July 2, 2012, and (2) gave UBS the right to purchase these ARS securities or sell them on the Company’s behalf at par anytime after the execution of the Agreement through July 2, 2012. The Company elected to measure the Put Option at fair value with gains and losses recognized as a component of net income. At the same time, the Company transferred these ARS from available-for-sale to trading investment securities. The Company valued the Put Option using the Black-Scholes model. During fiscal 2010, the Company sold all the ARS at par under the Agreement. The Company received $20.0 million plus accrued interest in cash from UBS for the ARS sale. Upon the sale of the ARS, the Company recognized a gain of $1.9 million with an equivalent loss on the exercises of the Put Option.
As of September 30, 3010, the Company did not have any liabilities or non-financial assets that are measured on a fair value basis on a recurring basis.
Available-for-sale marketable securities consisted of the following:
| Amortized Cost |
Gross Unrealized Holding Gains |
Gross Unrealized Holding Losses |
Fair Value |
|||||||||||||
| (in thousands) | ||||||||||||||||
| September 30, 2010 |
||||||||||||||||
| Money market instruments |
$ | 44,239 | $ | — | $ | — | $ | 44,239 | ||||||||
| Certificates of deposit |
9,352 | — | — | 9,352 | ||||||||||||
| SMIC common stock |
3,426 | — | (1,270 | ) | 2,156 | |||||||||||
| Total |
57,017 | — | (1,270 | ) | 55,747 | |||||||||||
| Less: Amounts included in cash, cash equivalents and restricted cash |
(50,910 | ) | — | — | (50,910 | ) | ||||||||||
| $ | 6,107 | $ | — | $ | (1,270 | ) | $ | 4,837 | ||||||||
| Amortized Cost |
Gross Unrealized Holding Gains |
Gross Unrealized Holding Losses |
Fair Value |
|||||||||||||
| (in thousands) | ||||||||||||||||
| September 30, 2009 |
||||||||||||||||
| Money market instruments |
$ | 16,041 | $ | — | $ | — | $ | 16,041 | ||||||||
| Certificates of deposit |
9,938 | — | — | 9,938 | ||||||||||||
| Mutual funds |
2,795 | 2 | — | 2,797 | ||||||||||||
| SMIC common stock |
3,426 | — | (2,018 | ) | 1,408 | |||||||||||
| Ralink common stock |
457 | 1,673 | — | 2,130 | ||||||||||||
| Total |
32,657 | 1,675 | (2,018 | ) | 32,314 | |||||||||||
| Less: Amounts included in cash and cash equivalents |
(22,314 | ) | — | — | (22,314 | ) | ||||||||||
| $ | 10,343 | $ | 1,675 | $ | (2,018 | ) | $ | 10,000 | ||||||||
In fiscal 2010, the Company sold all of its remaining shares of Ralink for approximately $3.2 million and recorded a pre-tax gain of approximately $2.8 million. In fiscal 2008, the Company sold approximately 0.3 million shares of its Ralink stock and recorded gross proceeds of approximately $1.8 million and a pre-tax gain of approximately $1.6 million.
In fiscal 2008, the Company sold 22.0 million shares of Semiconductor Manufacturing International Corp. (SMIC) and recorded gross proceeds of approximately $2.7 million and a pre-tax gain of approximately
52
Table of Contents
INTEGRATED SILICON SOLUTION, INC.
NOTES TO CONSOLIDATED FINANCIAL STATEMENTS—(Continued)
$0.2 million. The Company uses the weighted-average cost method to determine the cost basis of shares of SMIC. During the December 2009 quarter, the Company reclassified its shares in SMIC to short-term investments from long-term investments.
The Company had no debt securities at September 30, 2010. All debt securities held at September 30, 2009 were due in more than five years. As of September 30, 2010 and 2009, the Company had cash, cash equivalents and short-term investments of $34.3 million and $37.6 million, respectively, in foreign institutions.
Note 3. Inventories
Inventories consisted of the following at September 30:
| 2010 | 2009 | |||||||
| (in thousands) | ||||||||
| Purchased components |
$ | 16,598 | $ | 5,667 | ||||
| Work-in-process |
11,043 | 1,106 | ||||||
| Finished goods |
26,919 | 12,502 | ||||||
| $ | 54,560 | $ | 19,275 | |||||
In fiscal 2010, 2009 and 2008, the Company recorded inventory write-downs of $2.9 million, $10.8 million and $11.3 million, respectively. The inventory write-downs were predominately for lower of cost or market and excess and obsolescence issues on certain of its products.
Note 4. Other Assets
Other assets consisted of the following at September 30:
| 2010 | 2009 | |||||||
| (in thousands) | ||||||||
| Restricted assets |
$ | 223 | $ | 320 | ||||
| Deposits to foundry for capacity |
10,000 | — | ||||||
| Other |
1,339 | 1,236 | ||||||
| $ | 11,562 | $ | 1,556 | |||||
The Company has various deposits including deposits with suppliers for purchase guarantees and for customs clearance. These deposits are included in restricted assets.
Note 5. Property, Equipment, and Leasehold Improvements, net
Property, equipment, and leasehold improvements, net consisted of the following at September 30:
| 2010 | 2009 | |||||||
| (in thousands) | ||||||||
| Machinery and equipment |
$ | 36,583 | $ | 33,792 | ||||
| Furniture and fixtures |
2,663 | 2,540 | ||||||
| Land, buildings and improvements |
29,049 | 28,326 | ||||||
| 68,295 | 64,658 | |||||||
| Less accumulated depreciation and amortization |
(40,217 | ) | (41,440 | ) | ||||
| $ | 28,078 | $ | 23,218 | |||||
53
Table of Contents
INTEGRATED SILICON SOLUTION, INC.
NOTES TO CONSOLIDATED FINANCIAL STATEMENTS—(Continued)
The Company rents out certain floors in its office building in Hsinchu, Taiwan. These leases are cancelable with either two months or three months notice. The value of the assets leased to others is included in Property, Equipment, and Leasehold Improvements, net in the Company’s balance sheet. Rental income and the depreciation of the assets are included in other income (expense), net and amounted to approximately $1.1 million and $0.1 million, $1.2 million and $0.5 million, and $1.7 million and $0.6 million, in fiscal 2010, fiscal 2009 and fiscal 2008, respectively.
The assets leased consisted of the following at September 30:
| 2010 | 2009 | |||||||
| (in thousands) | ||||||||
| Buildings and improvements |
$ | 11,126 | $ | 10,825 | ||||
| Less accumulated depreciation |
(6,637 | ) | (6,324 | ) | ||||
| $ | 4,489 | $ | 4,501 | |||||
Note 6. Purchased Intangible Assets
No additions to purchased intangible assets were recorded during fiscal 2010. During fiscal 2009, in connection with its acquisition of Enable Semiconductor Corporation (Enable), the Company recorded $1.2 million of developed technology with a useful life of 5 years.
The following tables present details of the Company’s total purchased intangible assets:
| Gross | Accumulated Amortization |
Net | ||||||||||
| (in thousands) | ||||||||||||
| September 30, 2010 |
||||||||||||
| Technology |
$ | 5,173 | $ | 3,879 | $ | 1,294 | ||||||
| September 30, 2009 |
||||||||||||
| Technology |
$ | 5,173 | $ | 2,935 | $ | 2,238 | ||||||
| Customer relationships |
615 | 540 | 75 | |||||||||
| Total |
$ | 5,788 | $ | 3,475 | $ | 2,313 | ||||||
The following table presents details of the amortization expense of purchased intangible assets as reported in the Consolidated Statements of Operations:
| Years Ended September 30, | ||||||||||||
| 2010 | 2009 | 2008 | ||||||||||
| (in thousands) | ||||||||||||
| Reported as: |
||||||||||||
| Cost of sales |
$ | 944 | $ | 798 | $ | 1,409 | ||||||
| Operating expenses |
75 | 129 | 129 | |||||||||
| Total |
$ | 1,019 | $ | 927 | $ | 1,538 | ||||||
54
Table of Contents
INTEGRATED SILICON SOLUTION, INC.
NOTES TO CONSOLIDATED FINANCIAL STATEMENTS—(Continued)
The estimated future amortization expense of purchased intangible assets as of September 30, 2010 is as follows (in thousands):
| Fiscal year |
||||
| 2011 |
$ | 653 | ||
| 2012 |
248 | |||
| 2013 |
248 | |||
| 2014 |
145 | |||
| 2015 |
— | |||
| Thereafter |
— | |||
| Total |
$ | 1,294 | ||
Goodwill
In fiscal 2009, in connection with its acquisition of Enable, the Company recorded approximately $1.3 million of goodwill. In fiscal 2010, the Company recorded an additional $50,000 to goodwill for contingent payments under the Enable purchase agreement.
In September 2008, the Company performed an assessment of impairment for its goodwill. In the fourth quarter of fiscal 2008, the Company experienced a significant decline in its stock price. As a result of the decline in its stock price, the Company’s market capitalization fell significantly below the recorded value of its consolidated net assets. Based on the results of its assessment of goodwill for impairment, the Company determined that the fair value of its equity was less than the book value of its equity and an impairment existed. Therefore, the Company performed the second step of the impairment test to determine the implied fair value of goodwill. Specifically, the Company hypothetically allocated the estimated fair value of its equity as determined in the first step to recognized and unrecognized net assets, including allocations to intangible assets. The analysis indicated that there would be no remaining implied value attributable to goodwill and accordingly, the Company wrote off all $25.3 million of its goodwill.
Note 7. Borrowings
The Company had no borrowings at September 30, 2010 and September 30, 2009.
At September 30, 2010, the Company had short-term lines of credit with various financial institutions in Taiwan whereby it could borrow in aggregate up to approximately $13.9 million denominated in a combination of U.S. and New Taiwan dollars. As of September 30, 2010, the Company had no borrowings outstanding under these lines of credit. These lines of credit expire at various times through April 2011. There were no assets pledged as collateral for short-term debt or notes. Commitment fees relating to these lines are not material.
Note 8. Accrued Expenses
Accrued expenses consisted of the following at September 30:
| 2010 | 2009 | |||||||
| (in thousands) | ||||||||
| Deferred distributor margin |
$ | 2,567 | $ | 1,853 | ||||
| Other |
3,363 | 3,515 | ||||||
| $ | 5,930 | $ | 5,368 | |||||
55
Table of Contents
INTEGRATED SILICON SOLUTION, INC.
NOTES TO CONSOLIDATED FINANCIAL STATEMENTS—(Continued)
Note 9. Capital Stock
The Company’s Restated Certificate of Incorporation provides for 70,000,000 authorized shares of common stock and 5,000,000 authorized shares of preferred stock. The terms of the preferred stock may be fixed by the board of directors, who have the right to determine the price, rights, preferences, privileges and restrictions, including voting rights, of those shares without any further vote or action by the stockholders. The rights of the holders of common stock are subject to, and may be adversely affected by, the rights of the holders of any preferred stock that may be issued in the future.
As of September 30, 2010, shares of common stock were reserved for future issuance as follows:
| Common shares reserved under Employee Stock Purchase Plan |
1,166,000 | |||
| Common shares reserved under stock option plans |
6,464,000 |
Common Stock Repurchases
The Company paid approximately $1.1 million and $4.9 million in connection with the repurchase of 244,941 shares and 2,050,340 shares of its common stock during fiscal 2010 and fiscal 2009, respectively. As of September 30, 2010, the Company had repurchased and retired an aggregate of 13,679,711 shares of common stock at a cost of approximately $84.5 million since September 2007. As of September 30, 2010, $3.8 million remained available under the existing share repurchase authorization. In October 2010, the Company’s Board authorized an additional $20.0 million for the repurchase of shares of our common stock from time to time.
The Company issues RSUs as part of its equity incentive plans. For a small portion of RSUs granted, the number of shares issued on the date the RSUs vest is net of the statutory withholding requirements that the Company pays on behalf of its employees. During fiscal 2010, the Company withheld 1,529 shares to satisfy approximately $11,000 of employees’ tax obligations. During fiscal 2009, the Company withheld 1,680 shares to satisfy approximately $3,000 of employees’ tax obligations. Although the shares withheld are not issued, they are treated as common stock repurchases for accounting purposes, as they reduce the number of shares that would have been issued upon vesting.
Note 10. Stock-Based Compensation
Stock-Based Benefit Plans
The Company grants stock-based compensation awards under its 2007 Incentive Compensation Plan (the “2007 Plan”). The Company has outstanding grants under prior plans, though no further grants can be made under these prior plans. At September 30, 2010, the total number of shares subject to options and awards outstanding under all plans was 4,345,000. At September 30, 2010, 2,120,000 shares were available for future grant under the 2007 Plan. Options generally vest ratably over a four-year period with a 6-month or 1-year cliff vest and then vesting ratably over the remaining period. Options granted prior to October 1, 2005 expire ten years after the date of grant; options granted after October 1, 2005 expire seven years after the date of the grant. RSUs generally vest annually over a two-year or three-year period based upon continued employment with the Company.
2007 Incentive Compensation Plan
At the 2007 annual meeting of stockholders held on July 30, 2007 (the “Annual Meeting”), the Company’s stockholders approved, upon recommendation of the Company’s board of directors, the adoption of the 2007 Plan. The 2007 Plan is the successor to each of the 1998 Stock Plan, 1996 Nonstatutory Stock Plan and 1995 Director Stock Option Plan (the “Predecessor Plans”), and no further grants are made under the Predecessor Plans.
56
Table of Contents
INTEGRATED SILICON SOLUTION, INC.
NOTES TO CONSOLIDATED FINANCIAL STATEMENTS—(Continued)
The 2007 Plan permits the grant of stock options, stock appreciation rights, restricted stock awards, RSU’s, performance shares and performance units. The Compensation Committee of the Company’s board of directors has the authority to determine the type of incentive award, as well as the terms and conditions of the award, under the 2007 Plan.
3,000,000 shares of the Company’s common stock were initially reserved for issuance under the 2007 Plan. To the extent any options outstanding under the Predecessor Plans on the date of the Annual Meeting subsequently terminate unexercised or any unvested shares outstanding under the Predecessor Plans at such time are subsequently forfeited or repurchased by ISSI, the number of shares of common stock subject to those terminated options, together with the forfeited shares, are added to the share reserve available for issuance under the 2007 Plan, up to an additional 4,000,000 shares.
Other Stock Plans
The Company has outstanding grants under its 1998 Stock Plan, 1996 Nonstatutory Stock Plan and 1995 Director Stock Option Plan. Options generally vest ratably over a four-year period with a 6-month or 1-year cliff vest and then vesting ratably over the remaining period, except for options granted under the 1995 Director Stock Option Plan, which generally vest over 12 months. Options granted prior to October 1, 2005 expire ten years after the date of grant; options granted after October 1, 2005 expire seven years after the date of the grant.
The Company has shares of common stock reserved for future issuance under its 1995 Employee Stock Purchase Plan (ESPP). Offering periods prior to August 1, 2010 under the ESPP had a duration of six months and the purchase price was equal to 85% of the fair value of the common stock on the purchase date. As approved by the Board of Directors, effective August 1, 2010, shares under the ESPP will be purchased at a price equal to 85% of the lesser of the fair market value of the Company’s common stock as of the first day or the last day of each six-month purchase period. The offering periods under the 1995 Employee Stock Purchase Plan commence on approximately February 1 and August 1 of each year. During fiscal 2010, fiscal 2009 and fiscal 2008, 116,000, 369,000, and 170,000 shares were issued under the plan, respectively. As of September 30, 2010, 1,166,000 shares were available under the plan for future issuance.
Non-Plan Option Agreements
On February 21, 2006, the Company entered into a Stand-Alone Stock Option Agreement (the “Option”) with Scott Howarth, at the time the Company’s Chief Financial Officer. The Option is a non-qualified stock option to purchase 100,000 shares of the Company’s common stock and has the following terms: (i) an exercise price equal to $6.33 per share which was the fair market value of the Company’s common stock on the grant date of February 21, 2006, (ii) a term of 7 years from the date of grant, and (iii) vesting as to 12.5% of the shares on the six (6) month anniversary of his employment start date, and as to 1/48th of the total shares each month thereafter until the option is fully vested.
Stock Option Exchange Program
The Company’s stockholders approved a stock option exchange program at the Company’s annual meeting held on February 6, 2009. On March 2, 2009, the Company commenced the stock option exchange program whereby eligible employees (which excluded executive officers and directors) were given the opportunity to exchange some or all of their outstanding options with exercise prices of $6.00 per share or higher for a lesser number of new options with an exercise price per share equal to the fair market value on the exchange date. Pursuant to the stock option exchange program, which expired on April 1, 2009, a total of 208 eligible employees elected to exchange some or all of their eligible options. The Company accepted for cancellation eligible options to purchase 2,138,314 shares of the Company’s common stock, which were cancelled as of April 2, 2009. The
57
Table of Contents
INTEGRATED SILICON SOLUTION, INC.
NOTES TO CONSOLIDATED FINANCIAL STATEMENTS—(Continued)
Company issued new options to purchase up to 355,822 shares of the Company’s common stock under the Company’s 2007 Plan in exchange for the options surrendered. The new options have an exercise price of $1.65 per share, the closing price of the Company’s common stock on April 2, 2009. The incremental expense associated with the exchange of $37,000 is being amortized over the vesting period of one to two years.
Accounting for Stock-Based Compensation
Stock-based compensation cost is calculated by the Company on the date of grant using the fair value of the option as determined using the Black-Scholes option pricing model. The compensation cost is then amortized ratably over the vesting period of the individual option grants. The Black-Scholes valuation calculation requires the Company to estimate key assumptions such as expected term, volatility and interest rates to determine the fair value of the stock options. The estimate of these key assumptions is based on the Company’s historical stock price volatility, employees’ historical exercise patterns and judgment regarding market factors and trends. FASB guidance requires that forfeitures be estimated at the time of grant and revised, if necessary, in subsequent periods if actual forfeitures differ from those estimates. The Company estimates forfeitures based on its historical forfeiture rates as it believes these rates to be the most indicative of the Company’s expected forfeiture rate.
As of September 30, 2010, there was approximately $3.3 million of total unrecognized stock-based compensation expense under the Company’s stock option plans that will be recognized over a weighted-average period of approximately 2.33 years. Future stock option grants will add to this total whereas quarterly amortization and the vesting of the existing stock option grants will reduce this total. In addition, as of September 30, 2010, there was approximately $0.2 million of total unrecognized stock-based compensation expense under the Company’s ESPP that will be recognized over a weighted-average period of approximately 4 months.
FASB guidance requires that cash flows from tax benefits resulting from the exercise of stock options be classified as financing cash flows in the statement of cash flows. As the Company has a valuation allowance for all of its deferred tax assets, a tax benefit associated with stock option exercises has not been realized or recognized.
The Company issues new shares of common stock upon exercise of stock options and upon vesting of RSUs. The total intrinsic value (market value on date of exercise less exercise price) of options exercised and RSU’s vested during the fiscal years ended September 30, 2010, 2009 and 2008, was $5,318,000, $96,000 and $211,000, respectively.
The table below outlines the effects of total stock-based compensation.
| Years Ended September 30, | ||||||||||||
| 2010 | 2009 | 2008 | ||||||||||
| (in thousands) | ||||||||||||
| Stock-based compensation |
||||||||||||
| Cost of sales |
$ | 134 | $ | 180 | $ | 219 | ||||||
| Research and development |
849 | 1,252 | 1,470 | |||||||||
| Selling, general and administrative |
1,514 | 1,664 | 1,957 | |||||||||
| Total stock-based compensation |
2,497 | 3,096 | 3,646 | |||||||||
| Tax effect on stock-based compensation |
— | — | — | |||||||||
| Net effect on net income (loss) |
$ | 2,497 | $ | 3,096 | $ | 3,646 | ||||||
58
Table of Contents
INTEGRATED SILICON SOLUTION, INC.
NOTES TO CONSOLIDATED FINANCIAL STATEMENTS—(Continued)
Valuation Assumptions
The Company uses the Black-Scholes option pricing model to estimate the fair value of the options granted. The Company estimates the expected term of options granted based upon historical exercise data. Estimated volatilities are based on historical stock price volatilities of the period immediately preceding the option grant that is equal in length to the option’s expected term. The Company believes that historical volatility is the best estimate of future volatility. The Company bases the risk- free interest rate on the implied yield currently available on U.S. Treasury zero-coupon issues with an equivalent remaining term. The Company has never paid dividends and does not anticipate doing so over the expected life of the options and therefore used 0% for dividend yield. For offering periods prior to August 1, 2010 under the ESPP the Company recorded compensation expense for the difference between the purchase price and the fair market value on the day of purchase. For offering periods subsequent to August 1, 2010, as a result of the establishment of a look-back period, the Company uses the Black-Scholes option pricing model to estimate the fair value of stock purchase rights under its ESPP.
The estimated values of stock option grants and stock purchase rights, as well as the weighted average assumptions used in calculating these values during the fiscal years ended September 30, 2010, 2009 and 2008, were based on estimates at the date of grant as follows:
| Stock Options | ESPP | |||||||||||||||
| 2010 | 2009 | 2008 | 2010 | |||||||||||||
| Expected life (years) |
4.54 | 4.54 | 4.54 | 0.50 | ||||||||||||
| Expected volatility |
48.00 | % | 42.00 | % | 46.00 | % | 83.00 | % | ||||||||
| Risk-free interest rate |
2.23 | % | 2.28 | % | 3.19 | % | 0.20 | % | ||||||||
| Dividend yield |
0.00 | % | 0.00 | % | 0.00 | % | 0.00 | % | ||||||||
| Weighted-average fair value of grants |
$ | 1.94 | $ | 0.83 | $ | 2.51 | $ | 3.28 | ||||||||
The Company issues RSUs from time to time. The estimated fair value of RSU awards was calculated based on the market price of the Company’s common stock on the date of grant. The weighted average grant date fair value of RSUs granted in fiscal 2010 was $8.31 per share. The weighted average grant date fair value of RSUs granted in fiscal 2008 was $5.60 per share.
59
Table of Contents
INTEGRATED SILICON SOLUTION, INC.
NOTES TO CONSOLIDATED FINANCIAL STATEMENTS—(Continued)
A summary of the Company’s stock option activity and related information for the last three fiscal years under the 1989 Stock Plan, 1996 Nonstatutory Stock Plan, 1998 Stock Plan, 1995 Director Stock Option Plan and the 2007 Plan follows (stock option amounts and aggregate intrinsic value are presented in thousands):
| Outstanding Options | ||||||||||||||||
| Number of Shares |
Weighted- Average Exercise Price |
Weighted- Average Remaining Contractual Term (in years) |
Aggregate Intrinsic Value |
|||||||||||||
| Balance at September 30, 2007 |
5,153 | $ | 7.22 | |||||||||||||
| Options Granted |
986 | $ | 5.90 | |||||||||||||
| Options Exercised |
(105 | ) | $ | 3.95 | ||||||||||||
| Options Cancelled/Expired |
(279 | ) | $ | 7.01 | ||||||||||||
| Balance at September 30, 2008 |
5,755 | $ | 7.07 | |||||||||||||
| Options Granted |
1,767 | $ | 2.07 | |||||||||||||
| Options Exercised |
(36 | ) | $ | 2.25 | ||||||||||||
| Options Cancelled/Expired |
(2,685 | ) | $ | 7.59 | ||||||||||||
| Balance at September 30, 2009 |
4,801 | $ | 4.97 | |||||||||||||
| Options Granted |
1,032 | $ | 4.57 | |||||||||||||
| Options Exercised |
(1,203 | ) | $ | 4.39 | ||||||||||||
| Options Cancelled/Expired |
(355 | ) | $ | 8.17 | ||||||||||||
| Balance at September 30, 2010 |
4,275 | $ | 4.77 | 4.57 | $ | 17,051 | ||||||||||
| Exercisable at September 30, 2010 |
2,348 | $ | 5.60 | 3.81 | $ | 7,689 | ||||||||||
| Vested and expected to vest after September 30, 2010 |
4,193 | $ | 4.79 | 4.55 | $ | 16,664 | ||||||||||
| Options exercisable at: |
||||||||||||||||
| September 30, 2008 |
4,104 | $ | 7.49 | 4.59 | ||||||||||||
| September 30, 2009 |
2,715 | $ | 6.26 | 3.99 | ||||||||||||
| September 30, 2010 |
2,348 | $ | 5.60 | 3.81 | ||||||||||||
The following table summarizes information about options outstanding and exercisable at September 30, 2010:
| Options Outstanding | Options Exercisable | |||||||||||||||||||
| Range of Exercise |
Number of Options Outstanding (in thousands) |
Wtd. Average Remaining Contractual Life (in years) |
Wtd. Average Exercise Price |
Number of Options Exercisable (in thousands) |
Wtd. Average Exercise Price |
|||||||||||||||
| $1.50-$ 1.95 | 933 | 4.85 | $ | 1.88 | 406 | $ | 1.85 | |||||||||||||
| $2.35- 4.13 | 504 | 4.52 | $ | 3.01 | 252 | $ | 3.13 | |||||||||||||
| $4.34- 4.34 | 930 | 6.12 | $ | 4.34 | 92 | $ | 4.34 | |||||||||||||
| $4.41- 6.37 | 857 | 3.68 | $ | 5.70 | 647 | $ | 5.75 | |||||||||||||
| $6.42- 16.69 | 1,051 | 3.71 | $ | 7.79 | 951 | $ | 7.87 | |||||||||||||
| $1.50-$16.69 | 4,275 | 4.57 | $ | 4.77 | 2,348 | $ | 5.60 | |||||||||||||
60
Table of Contents
INTEGRATED SILICON SOLUTION, INC.
NOTES TO CONSOLIDATED FINANCIAL STATEMENTS—(Continued)
A summary of the Company’s RSU activity and related information under the 2007 Plan follows (RSU amounts and aggregate intrinsic value are presented in thousands):
| Number of Shares |
Weighted- Average Grant-Date Fair Value |
Aggregate Intrinsic Value |
||||||||||
| Outstanding awards at September 30, 2007 |
— | $ | — | |||||||||
| Granted |
114 | $ | 5.60 | |||||||||
| Vested |
— | $ | — | |||||||||
| Forfeited |
(2 | ) | $ | 5.60 | ||||||||
| Outstanding awards at September 30, 2008 |
112 | $ | 5.60 | |||||||||
| Granted |
— | $ | — | |||||||||
| Vested |
(36 | ) | $ | 5.60 | ||||||||
| Forfeited |
(10 | ) | $ | 5.60 | ||||||||
| Outstanding awards at September 30, 2009 |
66 | $ | 5.60 | |||||||||
| Granted |
41 | $ | 8.31 | |||||||||
| Vested |
(29 | ) | $ | 5.60 | $ | 207 | ||||||
| Forfeited |
(9 | ) | $ | 5.60 | ||||||||
| Outstanding awards at September 30, 2010 |
69 | $ | 7.21 | $ | 599 | |||||||
Note 11. Income Taxes
Income (loss) before provision for income taxes consisted of the following:
| 2010 | 2009 | 2008 | ||||||||||
| (in thousands) | ||||||||||||
| United States |
$ | 25,675 | $ | (4,262 | ) | $ | 4,965 | |||||
| International |
18,234 | (850 | ) | (22,468 | ) | |||||||
| Total pre-tax income (loss) |
$ | 43,909 | $ | (5,112 | ) | $ | (17,503 | ) | ||||
The provision (benefit) for income taxes consisted of the following for the years ended September 30:
| 2010 | 2009 | 2008 | ||||||||||
| (in thousands) | ||||||||||||
| Current: |
||||||||||||
| Federal |
$ | (207 | ) | $ | (27 | ) | $ | 154 | ||||
| State |
318 | 3 | 20 | |||||||||
| Foreign |
1,043 | 6 | 23 | |||||||||
| Total current |
$ | 1,154 | $ | (18 | ) | $ | 197 | |||||
| Deferred: |
||||||||||||
| Federal |
— | — | — | |||||||||
| State |
— | — | — | |||||||||
| Foreign |
— | — | — | |||||||||
| Total deferred |
— | — | — | |||||||||
| Total provision (benefit) |
$ | 1,154 | $ | (18 | ) | $ | 197 | |||||
61
Table of Contents
INTEGRATED SILICON SOLUTION, INC.
NOTES TO CONSOLIDATED FINANCIAL STATEMENTS—(Continued)
The Company’s provision (benefit) for income taxes differs from the amount computed by applying the U.S. federal statutory rate (35%) to income before taxes and minority interest as follows for the years ended September 30:
| 2010 | 2009 | 2008 | ||||||||||
| (in thousands) | ||||||||||||
| Income taxes computed at the U.S. federal statutory rate |
$ | 15,368 | $ | (1,789 | ) | $ | (6,126 | ) | ||||
| Federal refundable credit |
(207 | ) | (40 | ) | — | |||||||
| State income taxes |
207 | 2 | 20 | |||||||||
| Foreign losses not benefited (benefited) |
(6,382 | ) | 298 | (997 | ) | |||||||
| Non-deductible stock compensation |
375 | 525 | 693 | |||||||||
| Non-deductible impairment charge |
— | — | 8,868 | |||||||||
| U.S. operating loss not benefited (benefited) |
(9,286 | ) | 773 | (2,440 | ) | |||||||
| Reversal of previously provided taxes |
(140 | ) | — | (22 | ) | |||||||
| Foreign taxes |
1,183 | — | — | |||||||||
| Other individually immaterial items |
36 | 213 | 201 | |||||||||
| Total provision (benefit) |
$ | 1,154 | $ | (18 | ) | $ | 197 | |||||
As of September 30, 2010, the Company had net operating loss carryforwards for federal, state and foreign income tax purposes of approximately $83.8 million, $80.6 million and $20.0 million, respectively. The federal, state and foreign net operating loss carryforwards will expire at various dates beginning in 2011, if not utilized. The Company has federal research and development tax credits and foreign tax and minimum tax credit carryforwards of approximately $3.9 million, $1.0 million and $0.4 million, respectively. The Company also has state research and development tax credit carryforwards of approximately $2.6 million. The Company has foreign investment tax credit carryforwards of approximately $9.3 million. The federal tax credits will expire at various dates beginning in 2011 through 2024, if not utilized. The California state research and development tax credit can be carried forward indefinitely. The foreign investment tax credit carryforwards will expire beginning 2011 through 2012, if not utilized.
Utilization of the federal net operating loss carryforwards and credits may be subject to a substantial annual limitation due to the ownership change limitations provided by the Internal Revenue Code of 1986, as amended, and similar state provisions. The annual limitation, should it become effective, may result in the expiration of federal or state net operating losses and credits before utilization.
The Company’s China operation is under a tax holiday program which began on January 1, 2008 and will expire on December 31, 2012. The tax benefit resulting from the holiday was $307,000, $113,000 and $177,000 for fiscal 2010, fiscal 2009 and fiscal 2008, respectively.
62
Table of Contents
INTEGRATED SILICON SOLUTION, INC.
NOTES TO CONSOLIDATED FINANCIAL STATEMENTS—(Continued)
Deferred income taxes reflect the net tax effects of temporary differences between the carrying amounts of assets and liabilities for financial reporting purposes and the amounts used for income tax purposes. Significant components of deferred taxes consisted of the following at September 30:
| 2010 | 2009 | |||||||
| (in thousands) | ||||||||
| Deferred tax assets: |
||||||||
| Depreciation |
$ | 140 | $ | 480 | ||||
| Inventory and other valuation reserves |
4,580 | 6,190 | ||||||
| Accrued expenses |
2,110 | 2,730 | ||||||
| Federal, state and foreign credit carryforwards |
13,450 | 14,710 | ||||||
| Federal, state and foreign net operating loss carryforwards |
36,150 | 47,440 | ||||||
| Non-deductible stock options |
3,700 | 4,360 | ||||||
| Other, net |
2,610 | 2,880 | ||||||
| Subtotal |
62,740 | 78,790 | ||||||
| Valuation allowance |
(62,740 | ) | (78,790 | ) | ||||
| Total deferred tax assets |
$ | — | $ | — | ||||
Management has established a valuation allowance for all of the gross deferred tax assets based on management’s expectations of future taxable income and the actual taxable income during the three years ended September 30, 2010. The valuation allowance for deferred tax assets decreased by $16.1 million in fiscal 2010, decreased by $2.8 million in fiscal 2009 and decreased by $6.4 million in fiscal 2008. Approximately $12.2 million of the valuation allowance is attributable to tax benefits of stock option deductions which will be credited to paid-in capital when recognized.
A reconciliation of the beginning and ending amount of the consolidated liability for unrecognized income tax benefits during the tax year ended September 30 is as follows:
| 2010 | 2009 | 2008 | ||||||||||
| (in thousands) | ||||||||||||
| Balance at the beginning of the year |
$ | 3,790 | $ | 3,800 | $ | 3,000 | ||||||
| Decreases related to current year positions |
(330 | ) | (50 | ) | — | |||||||
| Increases related to prior year positions |
— | 40 | 800 | |||||||||
| Balance at the end of the year |
$ | 3,460 | $ | 3,790 | $ | 3,800 | ||||||
The unrecognized tax benefit as of September 30, 2010 is offset by a full valuation allowance. The Company does not anticipate a significant change in unrecognized tax benefits within the next twelve months except for any adjustments related to the expiration of the statute of limitations.
The Company anticipates the unrecognized tax benefits may increase during the year for items that arise in the ordinary course of business. Such amounts will be reflected as an increase in the amount of unrecognized tax benefits and an increase to the current period tax expense. These increases will be considered in the determination of the Company’s annual effective tax rate. The amount of the unrecognized tax benefit classified as a long term tax payable, if recognized, would reduce the annual income tax provision.
The Company’s policy to include interest and penalties related to unrecognized tax benefits within the Company’s provision for (benefit from) income taxes did not change. As of September 30, 2010, the Company has not accrued any potential penalties and interest related to these unrecognized tax benefits.
63
Table of Contents
INTEGRATED SILICON SOLUTION, INC.
NOTES TO CONSOLIDATED FINANCIAL STATEMENTS—(Continued)
The Company files U.S., state and foreign income tax returns in jurisdictions with varying statutes of limitations during which such tax returns may be audited and adjusted by the relevant tax authorities. The 2006 through 2010 tax years generally remain subject to examination by federal and most state tax authorities, and tax years 2004 through 2010 generally remain subject to examination by foreign tax authorities. In addition, U.S. tax returns are open from the 2000 tax year through the 2003 tax year to the extent that net operating losses generated during these periods are being utilized in open tax periods. Also, U.S. tax returns are open for the tax years from 1995 through 2003 and from 2007 through 2009 to the extent research and development credits were generated during these periods and are being utilized in open years. In significant foreign jurisdictions, the 2004 through 2010 tax years generally remain subject to examination by their respective tax authorities.
Note 12. Retirement Plan
The Company has pension plans covering substantially all of its Taiwan based employees. The pension plans are based on the Labor Standards Law, a defined benefit plan (Benefit Plan) and the Labor Pension Act, a defined contribution plan (Contribution Plan).
Under the Labor Standards Law, the Benefit Plan provides for a lump sum payment upon retirement based on years of service and the employee’s compensation during the last six months of employment. In accordance with the Labor Standards Law of the R.O.C., the Company makes monthly contributions equal to 2% of its wages and salaries. The fund is administered by the Employees’ Retirement Fund Committee and is registered in this committee’s name. Accordingly, the pension fund assets are not included in the financial statements of the Company.
Under the Labor Pension Act effective July 1, 2005, employees may choose the requirements under the Labor Standards Law or the new statute. For employees subject to the new statute, the Company shall contribute no less than 6% of the employees’ wages and salaries to the Contribution Plan.
Benefit Obligation and Plan Assets
As of September 30, 2010 and 2009, the Company’s Benefit Plan had projected benefit obligations in excess of plan assets. The changes in the benefit obligation and plan assets for the Benefit Plan described above were as follows:
| 2010 | 2009 | |||||||
| (in thousands) | ||||||||
| Change in projected benefit obligation: |
||||||||
| Beginning benefit obligation |
$ | 2,246 | $ | 2,093 | ||||
| Service cost |
94 | 16 | ||||||
| Interest cost |
46 | 58 | ||||||
| Actuarial loss (gain) |
1,805 | (312 | ) | |||||
| Currency exchange rate changes |
62 | (4 | ) | |||||
| Benefits paid to plan participants |
(251 | ) | (139 | ) | ||||
| Assumed liability in business combination |
— | 534 | ||||||
| Ending projected benefit obligation |
$ | 4,002 | $ | 2,246 | ||||
64
Table of Contents
INTEGRATED SILICON SOLUTION, INC.
NOTES TO CONSOLIDATED FINANCIAL STATEMENTS—(Continued)
| 2010 | 2009 | |||||||
| (in thousands) | ||||||||
| Change in fair value plan assets: |
||||||||
| Beginning fair value of plan assets |
$ | 1,839 | $ | 1,851 | ||||
| Actual return on plan assets |
31 | 42 | ||||||
| Employer contributions |
285 | 89 | ||||||
| Currency exchange rate changes |
51 | (4 | ) | |||||
| Benefits paid to plan participants |
(251 | ) | (139 | ) | ||||
| Ending fair value of plan assets |
$ | 1,955 | $ | 1,839 | ||||
The following table summarizes the amounts recognized on the consolidated balance sheet as of September 30:
| 2010 | 2009 | |||||||
| (in thousands) | ||||||||
| Other long-term liabilities |
$ | 2,047 | $ | 407 | ||||
| Accumulated other comprehensive income |
1,282 | 572 | ||||||
| Amount recognized |
$ | 3,329 | $ | 979 | ||||
The following table summarizes the amounts recorded to accumulated other comprehensive income (loss) before taxes, as of September 30:
| 2010 | ||||
| (in thousands) | ||||
| Net transition obligation |
$ | (47 | ) | |
| Net actuarial loss |
(1,807 | ) | ||
| Net prior service cost |
— | |||
| Defined benefit plan, net |
$ | (1,854 | ) | |
The following table summarizes the accumulated benefit obligation as of September 30:
| 2010 | 2009 | |||||||
| (in thousands) | ||||||||
| Accumulated benefit obligation |
$ | 2,149 | $ | 1,834 | ||||
Weighted-average actuarial assumptions used to determine benefit obligations and plan assets for the Benefit Plan at September 30 were as follows:
| 2010 | 2009 | |||||||
| Discount rate |
2.00 | % | 2.00 | % | ||||
| Expected return on plan assets |
2.00 | % | 2.00 | % | ||||
| Rate of compensation increase |
3.00 | % | 1.00 | % | ||||
The assumptions used in the expected long-term rate of return on plan assets are determined by the Bureau of Labor Insurance in Taiwan.
65
Table of Contents
INTEGRATED SILICON SOLUTION, INC.
NOTES TO CONSOLIDATED FINANCIAL STATEMENTS—(Continued)
The net periodic benefit cost for the Benefit Plan included the following components at September 30:
| 2010 | 2009 | 2008 | ||||||||||
| (in thousands) | ||||||||||||
| Service cost |
$ | 94 | $ | 16 | $ | 19 | ||||||
| Interest cost |
46 | 58 | 58 | |||||||||
| Expected return on plan assets |
(38 | ) | (51 | ) | (51 | ) | ||||||
| Amortization and deferred amount |
(58 | ) | (56 | ) | (80 | ) | ||||||
| Net periodic benefit cost |
$ | 44 | $ | (33 | ) | $ | (54 | ) | ||||
The balance of vested benefits was zero as of September 30, 2010 and September 30, 2009.
Non-U.S. Plan Assets
For the Benefit Plan, the Company deposits funds into government-managed accounts, and accrues for the unfunded portion of its obligation.
Estimated Future Benefit Payments
The following table reflects the benefit payments, which include the amount that will be funded from retiree contributions that the Company expects to pay in the periods noted (in thousands):
| Fiscal year ending: |
||||
| 2011 |
$ | — | ||
| 2012 |
$ | — | ||
| 2013 |
$ | 357 | ||
| 2014 |
$ | 16 | ||
| 2015 |
$ | 105 | ||
| 2016-2020 |
$ | 1,364 |
Estimated Future Contributions
The Company’s expected contributions to be paid to the Benefit Plan during fiscal 2011 is $34,000.
66
Table of Contents
INTEGRATED SILICON SOLUTION, INC.
NOTES TO CONSOLIDATED FINANCIAL STATEMENTS—(Continued)
Note 13. Per Share Data
The calculations of basic and diluted net income (loss) per share for each of the three years ended September 30, 2010, 2009 and 2008 are as follows:
| Years Ended September 30, | ||||||||||||
| 2010 | 2009 | 2008 | ||||||||||
| (in thousands, except per share data) | ||||||||||||
| Numerator for basic and diluted net income (loss) per share: |
||||||||||||
| Net income (loss) |
$ | 42,196 | $ | (5,050 | ) | $ | (17,763 | ) | ||||
| Denominator for basic net income (loss) per share: |
||||||||||||
| Weighted average common shares outstanding |
25,603 | 25,441 | 29,541 | |||||||||
| Dilutive effect of stock options and awards |
1,438 | — | — | |||||||||
| Denominator for diluted net income (loss) per share |
27,041 | 25,441 | 29,541 | |||||||||
| Basic net income (loss) per share |
$ | 1.65 | $ | (0.20 | ) | $ | (0.60 | ) | ||||
| Diluted net income (loss) per share |
$ | 1.56 | $ | (0.20 | ) | $ | (0.60 | ) | ||||
The diluted earnings per share calculations for the years ended September 30, 2009 and 2008 do not include approximately 16,000 and 255,000 potential common shares from outstanding stock options because their inclusion would be anti-dilutive. For the years ended September 30, 2010, 2009 and 2008, an additional 589,000, 5,565,000 and 4,961,000 stock options were excluded from diluted earnings per share by the application of the treasury stock method.
Note 14. Geographic and Segment Information
The Company has one operating segment, which is to design, develop, and market high-performance SRAM, DRAM, and other memory and non-memory semiconductor products. The following table summarizes the Company’s operations in different geographic areas:
| Years Ended September 30, | ||||||||||||
| 2010 | 2009 | 2008 | ||||||||||
| (in thousands) | ||||||||||||
| Net Sales |
||||||||||||
| United States |
$ | 38,333 | $ | 22,933 | $ | 37,941 | ||||||
| China |
14,287 | 8,633 | 8,240 | |||||||||
| Hong Kong |
68,959 | 44,720 | 67,438 | |||||||||
| Taiwan |
32,075 | 25,274 | 37,181 | |||||||||
| Japan |
15,851 | 7,265 | 12,144 | |||||||||
| Other Asia Pacific countries |
35,220 | 22,147 | 31,154 | |||||||||
| Europe |
46,386 | 22,197 | 39,775 | |||||||||
| Other |
1,347 | 1,082 | 1,356 | |||||||||
| Total net sales |
$ | 252,458 | $ | 154,251 | $ | 235,229 | ||||||
| Long-lived assets |
||||||||||||
| United States |
$ | 1,827 | $ | 2,857 | $ | 3,569 | ||||||
| Hong Kong |
16 | 30 | 53 | |||||||||
| China |
1,575 | 865 | 1,029 | |||||||||
| Taiwan |
24,660 | 19,466 | 19,904 | |||||||||
| Total long-lived assets |
$ | 28,078 | $ | 23,218 | $ | 24,555 | ||||||
67
Table of Contents
INTEGRATED SILICON SOLUTION, INC.
NOTES TO CONSOLIDATED FINANCIAL STATEMENTS—(Continued)
Revenues are attributed to countries based on the shipping location of customers.
Long-lived assets by geographic area are those assets used in the Company’s operations in each area.
Net foreign currency transaction gains (losses) of approximately $87,000, $(303,000), and $509,000 for the years ended September 30, 2010, 2009, and 2008, respectively, are included in the determination of net income (loss).
Note 15. Commitments and Contingencies
Patents and Licenses
In the semiconductor industry, it is not unusual for companies to receive notices alleging infringement of patents or other intellectual property rights of others. The Company has been, and from time-to-time expects to be, notified of claims that it may be infringing patents, maskwork rights or copyrights owned by third parties. If it appears necessary or desirable, the Company may seek licenses under patents that it is alleged to be infringing. Although patent holders commonly offer such licenses, licenses may not be offered and the terms of any offered licenses may not be acceptable to the Company. The failure to obtain a license under a key patent or intellectual property right from a third party for technology used by the Company could cause it to incur substantial liabilities and to suspend the manufacture of the products utilizing the invention or to attempt to develop non-infringing products, any of which could materially and adversely affect the Company’s business and operating results. Furthermore, there can be no assurance that the Company will not become involved in protracted litigation regarding its alleged infringement of third party intellectual property rights or litigation to assert and protect its patents or other intellectual property rights. Any litigation relating to patent infringement or other intellectual property matters could result in substantial cost and diversion of the Company’s resources that could materially and adversely affect the Company’s business and operating results.
Litigation
DRAM Technologies LLC v. Integrated Silicon Solution, Inc., et al.
On February 5, 2010, a patent infringement suit was filed against the Company and several other semiconductor companies in the United States District Court for the Eastern District of Texas by DRAM Technologies LLC, for the alleged infringement of various patents by the Company’s products (Case No. 2:10-CV-45) (“the Complaint”). The Complaint also alleged willful infringement of the patents by the Company and sought a permanent injunction of the alleged infringing acts by it, as well as up to the trebling of unspecified damages. On or about February 23, 2010, the Company was purportedly served with the Complaint. On August 24, 2010, the Complaint against the Company was voluntarily dismissed, with prejudice, ending the Company’s involvement in the litigation.
Goodman v. Integrated Silicon Solution, Inc., et al.
On August 23, 2010, a patent infringement suit was filed against the Company and several other semiconductor companies in the United States District Court for the Northern District of California by James B. Goodman (“Goodman”), for the alleged infringement of U.S. Patent No. 6,243,315 by the Company’s products (Case No. 5:10-CV-03738) (“the Complaint”). The Complaint seeks unspecified damages, interest and costs, but does not allege willful infringement or seek a permanent injunction. The Company has not been served with the Complaint. The Company will file an answer to the Complaint as prescribed by the Federal Rules of Civil Procedure.
68
Table of Contents
INTEGRATED SILICON SOLUTION, INC.
NOTES TO CONSOLIDATED FINANCIAL STATEMENTS—(Continued)
Other Legal Proceedings
In the ordinary course of its business, as is common in the semiconductor industry, the Company has been involved in a limited number of other legal actions, both as plaintiff and defendant, and could incur uninsured liability in any one or more of them. Although the outcome of these actions is not presently determinable, the Company believes that the ultimate resolution of these matters will not have a material adverse effect on its financial position, cash flows or results of operations. However, no assurances can be given with respect to the extent or outcome of any such litigation in the future.
Operating Leases
The Company leases its facilities and the land upon which its building in Taiwan is situated under operating lease agreements that expire at various dates through 2016. The Company entered into a six year lease effective February 2007 for its headquarters facility in San Jose, California. Minimum rental commitments under these leases are as follows (in thousands):
| Fiscal year ending: |
||||
| 2011 |
$ | 1,420 | ||
| 2012 |
1,144 | |||
| 2013 |
853 | |||
| 2014 |
285 | |||
| 2015 |
222 | |||
| Thereafter |
111 | |||
| Total minimum rental commitments |
$ | 4,035 | ||
Total rental expense, recorded on a straight-line basis, for the years ended September 30, 2010, 2009 and 2008 was approximately $1.3 million, $1.1 million and $1.2 million, respectively.
Commitments to Wafer Fabrication Facilities
The Company issues purchase orders for wafers to various wafer foundries. These purchase orders are generally considered to be cancelable. However, to the degree that the wafers have entered into work-in-process, as a matter of practice it becomes increasingly difficult to cancel the purchase order. As of September 30, 2010, the Company had approximately $29.2 million of purchase orders for which the related wafers had been entered into wafer work-in-process (i.e., manufacturing had begun).
Note 16. Employee 401(k) Plan
In August 1992, the Company established a defined contribution retirement plan with 401(k) plan features to provide retirement benefits to its eligible U.S. employees. Employees may make contributions through payroll withholdings of up to the lesser of $16,500 ($22,000 for participants older than 50) or 60% of their annual compensation for 2010. The Company elected to make no matching contributions during the years ended September 30, 2010, 2009 and 2008. Administrative expenses relating to the plan are insignificant.
69
Table of Contents
INTEGRATED SILICON SOLUTION, INC.
NOTES TO CONSOLIDATED FINANCIAL STATEMENTS—(Continued)
Note 17. Related Party Transactions
The Company sells semiconductor products to Chrontel International Ltd. (Chrontel). Jimmy S.M. Lee, the Company’s Executive Chairman, has been a director of Chrontel since July 1995. Sales to Chrontel were $585,000, $622,000 and $284,000 during the fiscal years ended September 30, 2010, 2009 and 2008, respectively. Accounts receivable from Chrontel was approximately $78,000 and $0 at September 30, 2010 and September 30, 2009, respectively.
Note 18. Acquisition of Enable Semiconductor Corporation
On April 27, 2009, the Company announced its acquisition of Enable, a private Taiwan and Korea based company, formerly a subsidiary of Nanoamp Solutions, Inc. The Company acquired 100% of the equity of Enable and effective April 27, 2009 began consolidating the results of Enable. The Enable acquisition provided the Company with both ultra low power Single Data Rate (SDR) and Double Data Rate (DDR) SDRAMs, and ultra low power Pseudo SRAMs in Known Good Die (KGD) and package format targeted at the portable consumer products market. The total purchase price was $2.7 million with the potential for additional contingent payments based on future operating results. In fiscal 2010, the Company recorded an additional $50,000 to goodwill for contingent payments under the purchase agreement.
The allocation of the purchase price of Enable includes both tangible assets and acquired intangibles including both developed technology as well as in-process technology (IPR&D). The excess of the purchase price over the fair value allocated to the net assets is goodwill. The Company currently does not expect to receive a tax benefit for goodwill. The amounts allocated to IPR&D were expensed in the Company’s quarter ending June 30, 2009 as it was deemed to have no future alternative use.
The purchase price allocation is as follows (in thousands):
| Tangible assets acquired |
$ | 1,643 | ||
| Liabilities assumed |
(2,162 | ) | ||
| In-process technology |
710 | |||
| Goodwill |
1,301 | |||
| Intangible assets acquired: |
||||
| Developed technology |
1,240 | |||
| Total estimated purchase price allocation |
$ | 2,732 | ||
The developed technology is being amortized over five years.
70
Table of Contents
INTEGRATED SILICON SOLUTION, INC.
NOTES TO CONSOLIDATED FINANCIAL STATEMENTS—(Continued)
Note 19. Quarterly Financial Information (unaudited)
The following tables show the quarterly results of operations for each of the years ended September 30, 2010 and 2009.
| Fiscal 2010 |
Fourth Quarter |
Third Quarter |
Second Quarter |
First Quarter |
||||||||||||
| (in thousands, except per share data) | ||||||||||||||||
| Net sales |
$ | 73,632 | $ | 71,228 | $ | 57,043 | $ | 50,555 | ||||||||
| Gross profit |
$ | 27,870 | $ | 27,324 | $ | 21,216 | $ | 20,121 | ||||||||
| Operating income |
$ | 12,380 | $ | 13,303 | $ | 6,767 | $ | 7,506 | ||||||||
| Consolidated net income |
$ | 12,225 | $ | 16,177 | $ | 7,155 | $ | 7,198 | ||||||||
| Net income attributable to ISSI |
$ | 11,805 | $ | 16,041 | $ | 7,154 | $ | 7,196 | ||||||||
| Basic net income per share |
$ | 0.45 | $ | 0.62 | $ | 0.28 | $ | 0.29 | ||||||||
| Diluted net income per share |
$ | 0.43 | $ | 0.57 | $ | 0.27 | $ | 0.28 | ||||||||
| Market price range common stock: |
||||||||||||||||
| High |
$ | 10.09 | $ | 13.93 | $ | 10.85 | $ | 5.75 | ||||||||
| Low |
$ | 6.60 | $ | 7.40 | $ | 4.86 | $ | 3.25 | ||||||||
| Fiscal 2009 |
||||||||||||||||
| Net sales |
$ | 46,432 | $ | 38,901 | $ | 31,253 | $ | 37,665 | ||||||||
| Gross profit |
$ | 16,929 | $ | 9,749 | $ | 6,467 | $ | 7,733 | ||||||||
| Operating income (loss) |
$ | 4,729 | $ | (1,899 | )(1) | $ | (4,127 | ) | $ | (4,776 | ) | |||||
| Consolidated net income (loss) |
$ | 4,860 | $ | (2,017 | )(1) | $ | (3,803 | ) | $ | (4,134 | ) | |||||
| Net income (loss) attributable to ISSI |
$ | 4,772 | $ | (1,926 | )(1) | $ | (3,826 | ) | $ | (4,070 | ) | |||||
| Basic and diluted net income (loss) per share |
$ | 0.19 | $ | (0.08 | ) | $ | (0.15 | ) | $ | (0.16 | ) | |||||
| Market price range common stock: |
||||||||||||||||
| High |
$ | 3.85 | $ | 2.92 | $ | 1.85 | $ | 2.45 | ||||||||
| Low |
$ | 2.20 | $ | 1.51 | $ | 1.31 | $ | 1.36 | ||||||||
| (1) | In the June 2009 quarter, the Company recorded a charge of approximately $0.7 million for acquired in-process technology related to the acquisition of Enable. |
71
Table of Contents
Item 9. Changes in and Disagreements with Accountants on Accounting and Financial Disclosure
Not applicable.
Item 9A. Controls and Procedures
Disclosure Controls and Procedures
As of the end of the period covered by this Annual Report on Form 10-K, as required by paragraph (b) of Rule 13a-15 or Rule 15d-15 under the Securities Exchange Act of 1934, as amended, we evaluated under the supervision of our Chief Executive Officer and our Chief Financial Officer, the effectiveness of our disclosure controls and procedures (as defined in Rules 13a-15(e) or 15d-15(e) of the Securities Exchange Act of 1934, as amended). Based on this evaluation, our Chief Executive Officer and our Chief Financial Officer have concluded that our disclosure controls and procedures were effective at September 30, 2010 to ensure that information we are required to disclose in reports that we file or submit under the Securities Exchange Act of 1934 (i) is recorded, processed, summarized and reported within the time periods specified in Securities and Exchange Commission rules and forms, and (ii) is accumulated and communicated to our management, including our Chief Executive Officer and our Chief Financial Officer, as appropriate to allow timely decisions regarding required disclosure. Our disclosure controls and procedures are designed to provide reasonable assurance that such information is accumulated and communicated to our management. Our disclosure controls and procedures include components of our internal control over financial reporting. Management’s assessment of the effectiveness of our internal control over financial reporting is expressed at the level of reasonable assurance because a control system, no matter how well designed and operated, can provide only reasonable, but not absolute, assurance that the control system’s objectives will be met.
Management’s Report on Internal Control over Financial Reporting
Our management is responsible for establishing and maintaining adequate internal control over financial reporting to provide reasonable assurance regarding the reliability of our financial reporting and the preparation of financial statements for external purposes in accordance with generally accepted accounting principles. Internal control over financial reporting includes those policies and procedures that (i) pertain to the maintenance of records that in reasonable detail accurately and fairly reflect the transactions and dispositions of our assets, (ii) provide reasonable assurance that transactions are recorded as necessary to permit preparation of financial statements in accordance with generally accepted accounting principles, and that our receipts and expenditures are being made only in accordance with authorizations of our management and directors, and (iii) provide reasonable assurance regarding prevention or timely detection of the unauthorized acquisition, use or disposition of our assets that could have a material effect on the financial statements.
Management assessed our internal control over financial reporting as of September 30, 2010, the end of our fiscal year. Management based its assessment on criteria established in Internal Control—Integrated Framework issued by the Committee of Sponsoring Organizations of the Treadway Commission (COSO). Management’s assessment included an evaluation of such elements as the design and operating effectiveness of key financial reporting controls, process documentation, accounting policies, and our overall control environment. This assessment is supported by testing and monitoring performed by our finance organization.
Based on its assessment, management has concluded that our internal control over financial reporting was effective as of the end of the fiscal year to provide reasonable assurance regarding the reliability of financial reporting and the preparation of financial statements for external reporting purposes in accordance with generally accepted accounting principles. We reviewed the results of management’s assessment with the Audit Committee of our Board of Directors.
Our independent registered accounting firm, Grant Thornton LLP, who also audited our consolidated financial statements, audited the effectiveness of our internal control over financial reporting. Grant Thornton
72
Table of Contents
LLP has issued its attestation report on our internal control over financial reporting, which is included in Part II, Item 8 of this Annual Report on Form 10-K.
Changes in Internal Control over Financial Reporting
During the three months ended September 30, 2010, there were no changes in our internal control over financial reporting identified in connection with the evaluation required by paragraph (d) of Exchange Act Rules 13a-15 or 15d-15 that was conducted during the last fiscal quarter that have materially affected, or are reasonably likely to materially affect, our internal control over financial reporting.
Not applicable.
73
Table of Contents
Item 10. Directors, Executive Officers and Corporate Governance
Executive Officers—See the section entitled “Executive Officers” in Part I, Item 1 hereof.
Directors—The information required by this Item is incorporated by reference from the section entitled “Election of Directors” in our 2011 Proxy Statement for our annual meeting of stockholders to be held on February 4, 2011 which proxy statement will be filed no later than 120 days following the end of our 2010 fiscal year (the “2011 Proxy Statement”).
The disclosure required by Item 405 of Regulation S-K is incorporated by reference from the section entitled “Section 16(a) Beneficial Ownership Reporting Compliance” in our 2011 Proxy Statement.
We have adopted a Code of Business Conduct and Ethics that applies to all directors and employees, including our principal executive officer, principal financial officer, principal accounting officer or controller, or persons performing similar functions. Our Code of Business Conduct and Ethics is posted on our website at http://www.issi.com/. We intend to disclose future amendments to certain provisions of the Code of Business Conduct and Ethics, or waivers of such provisions granted to executive officers and directors, on our website within four business days following the date of such amendment or waiver.
The disclosure required by Items 407 (c)(3), (d)(4), and (d)(5) of Regulation S-K is incorporated by reference from the section entitled “Election of Directors” in our 2011 Proxy Statement.
Item 11. Executive Compensation
The information required by Items 402 and 407 (e)(4) and (e)(5) of Regulation S-K is incorporated by reference from the sections entitled “Compensation of Executive Officers,” “Compensation of Directors,” “Compensation Committee Interlocks and Insider Participation,” and “Report of the Compensation Committee of the Board of Directors,” in our 2011 Proxy Statement.
Item 12. Security Ownership of Certain Beneficial Owners and Management and Related Stockholder Matters
The disclosure required by Item 403 of Regulation S-K is incorporated by reference from the sections entitled “Security Ownership of Principal Stockholders, Directors and Executive Officers—Beneficial Owners” and “Security Ownership of Principal Stockholders, Directors and Executive Officers—Security Ownership of Management” in our 2011 Proxy Statement.
The information required by Item 201(d) of Regulation S-K regarding securities authorized for issuance under equity compensation plans is incorporated by reference from the section entitled “Equity Compensation Plan Information” in our 2011 Proxy Statement.
Item 13. Certain Relationships and Related Transactions and Director Independence
The information required by this Item is incorporated by reference from the sections entitled “Certain Transactions” and “Election of Directors” in our 2011 Proxy Statement.
Item 14. Principal Accountant Fees and Services
The information required by this Item appears under “Fees Paid to Accountants” and “Audit Committee Pre-Approval of Audit and Permissible Non-Audit Services of Independent Auditors” in our 2011 Proxy Statement. Those portions of the Proxy Statement are incorporated by reference to this report.
74
Table of Contents
Item 15. Exhibits and Financial Statement Schedules
(a) List of documents filed as part of this Report.
| 1. | Financial Statements: See “Index to Consolidated Financial Statements” under Item 8 on page 37 of this Form 10-K. |
The following consolidated financial statements of Integrated Silicon Solution, Inc. are contained in Part II, Item 8 of this Report on Form 10-K:
Report of Independent Registered Public Accounting Firm
Consolidated Statements of Operations
Consolidated Balance Sheets
Consolidated Statements of Cash Flows
Consolidated Statements of Stockholders’ Equity
Notes to Consolidated Financial Statements
| 2. | Financial Statement Schedules |
All other schedules for which provision is made in the Applicable Accounting Regulations of the Securities and Exchange Commission are not required under the related instructions or are inapplicable, and therefore have been omitted, as the information is contained in Part II, Item 8 of this Report on Form 10-K.
| 3. | Exhibits |
| Exhibit |
Description of Document | |||
| 3.1 | (2) | Restated Certificate of Incorporation of Registrant. | ||
| 3.2 | (5) | Amendment to Restated Certificate of Incorporation of Registrant. | ||
| 3.3 | (10) | Amended and Restated Bylaws of Registrant. | ||
| 4.2 | (1) | Form of Common Stock Certificate. | ||
| 10.1 | (1) | Form of Indemnification Agreement. | ||
| 10.2 | (6)* | Form of 1993 Employee Stock Purchase Plan, as amended, and form of Subscription Agreement. | ||
| 10.3 | (7)* | 1995 Director Stock Option Plan, as amended. | ||
| 10.4 | (4)* | Nonstatutory Stock Plan, as amended. | ||
| 10.5 | (3)* | 1998 Stock Plan, as amended. | ||
| 10.6 | (8)* | 2007 Incentive Compensation Plan. | ||
| 10.7 | (9)* | Executive Bonus Plan. | ||
| 21.1 | Subsidiaries of the Registrant. | |||
| 23.1 | Consent of Independent Registered Public Accounting Firm (Grant Thornton LLP). | |||
| 24.1 | Power of Attorney (see page 77). | |||
| 31.1 | Certification Pursuant to SEC Release No. 33-8238, as Adopted Pursuant to Section 302 of the Sarbanes-Oxley Act of 2002. | |||
| 31.2 | Certification Pursuant to SEC Release No. 33-8238, as Adopted Pursuant to Section 302 of the Sarbanes-Oxley Act of 2002. | |||
| 32.1 | Certification Pursuant to 18 U.S.C. Section 1350, as Adopted Pursuant to Section 906 of the Sarbanes-Oxley Act of 2002. | |||
75
Table of Contents
| * | Management contract or compensatory plan or arrangement required to be filed as an exhibit to this Report on Form 10-K pursuant to item 15(b) of this report. |
| (1) | Incorporated by reference to the Company’s Registration Statement on Form S-1, as amended (file no. 33-72960). |
| (2) | Incorporated by reference to the Company’s Registration Statement on Form S-1, as amended (file no. 33-91520). |
| (3) | Incorporated by reference to the Company’s Registration Statement on Form S-8 filed March 9, 2001. |
| (4) | Incorporated by reference to the Company’s Registration Statement on Form S-8 filed November 21, 2002. |
| (5) | Incorporated by reference to the Company’s Annual Report on Form 10-K for the period ended September 30, 2003. |
| (6) | Incorporated by reference to the Company’s Quarterly Report on Form 10-Q for the period ended March 31, 2009. |
| (7) | Incorporated by reference to the Company’s Report on Form 8-K filed September 12, 2006. |
| (8) | Incorporated by reference to the Company’s Report on Form 8-K filed August 14, 2007. |
| (9) | Incorporated by reference to the Company’s Report on Form 8-K filed November 12, 2008. |
| (10) | Incorporated by reference to the Company’s Report on Form 8-K filed June 16, 2009. |
| (b) | Exhibits |
See (3) above
| (c) | Financial statement schedules |
See (2) above
76
Table of Contents
Pursuant to the requirements of Section 13 or 15(d) of the Securities Exchange Act of 1934, the Registrant has duly caused this report to be signed on its behalf by the undersigned, thereunto duly authorized.
| INTEGRATED SILICON SOLUTION, INC. | ||
| By |
/S/ SCOTT D. HOWARTH | |
| Scott D. Howarth President and Chief Executive Officer | ||
| Date: December 13, 2010 | ||
POWER OF ATTORNEY
KNOW ALL PERSONS BY THESE PRESENTS, that each person whose signature appears below hereby constitutes and appoints Scott D. Howarth and John M. Cobb, and each of them acting individually, as his attorney-in-fact, each with full power of substitution, for him in any and all capacities, to sign any and all amendments to this Report on Form 10-K, and to file the same, with exhibits thereto and other documents in connection therewith, with the Securities and Exchange Commission, hereby ratifying and confirming our signatures as they may be signed by our said attorney to any and all amendments to said Report.
Pursuant to the requirements of the Securities Exchange Act of 1934, this report has been signed below by the following persons on behalf of the Registrant and in the capacities indicated.
| Signature |
Title | |
| /S/ JIMMY S.M. LEE (Jimmy S.M. Lee) |
Executive Chairman of the Board | |
| /S/ SCOTT D. HOWARTH (Scott D. Howarth) |
Director, President and Chief Executive Officer (Principal Executive Officer) | |
| /S/ JOHN M. COBB (John M. Cobb) |
Vice President and Chief Financial Officer (Principal Financial and Principal Accounting Officer) | |
| /S/ KONG-YEU HAN (Kong-Yeu Han) |
Director and Vice Chairman | |
| /S/ PAUL CHIEN (Paul Chien) |
Director | |
| /S/ JONATHAN KHAZAM (Jonathan Khazam) |
Director | |
| /S/ KEITH MCDONALD (Keith McDonald) |
Director | |
| /S/ STEPHEN PLETCHER (Stephen Pletcher) |
Director | |
| /S/ BRUCE A. WOOLEY (Bruce A. Wooley) |
Director | |
| /S/ JOHN ZIMMERMAN (John Zimmerman) |
Director | |
Date: December 13, 2010
77
Table of Contents
EXHIBIT INDEX
| Exhibit |
Description of Document | |
| 3.1(2) | Restated Certificate of Incorporation of Registrant. | |
| 3.2(5) | Amendment to Restated Certificate of Incorporation of Registrant. | |
| 3.3(10) | Amended and Restated Bylaws of Registrant. | |
| 4.2(1) | Form of Common Stock Certificate. | |
| 10.1(1) | Form of Indemnification Agreement. | |
| 10.2(6)* | Form of 1993 Employee Stock Purchase Plan, as amended, and form of Subscription Agreement. | |
| 10.3(7)* | 1995 Director Stock Option Plan, as amended. | |
| 10.4(4)* | Nonstatutory Stock Plan, as amended. | |
| 10.5(3)* | 1998 Stock Plan, as amended. | |
| 10.6(8)* | 2007 Incentive Compensation Plan. | |
| 10.7(9)* | Executive Bonus Plan. | |
| 21.1 | Subsidiaries of the Registrant. | |
| 23.1 | Consent of Independent Registered Public Accounting Firm (Grant Thornton LLP). | |
| 24.1 | Power of Attorney (see page 77). | |
| 31.1 | Certification Pursuant to SEC Release No. 33-8238, as Adopted Pursuant to Section 302 of the Sarbanes-Oxley Act of 2002. | |
| 31.2 | Certification Pursuant to SEC Release No. 33-8238, as Adopted Pursuant to Section 302 of the Sarbanes-Oxley Act of 2002. | |
| 32.1 | Certification Pursuant to 18 U.S.C. Section 1350, as Adopted Pursuant to Section 906 of the Sarbanes-Oxley Act of 2002. | |
| * | Management contract or compensatory plan or arrangement required to be filed as an exhibit to this Report on Form 10-K pursuant to item 15(b) of this report. |
| (1) | Incorporated by reference to the Company’s Registration Statement on Form S-1, as amended (file no. 33-72960). |
| (2) | Incorporated by reference to the Company’s Registration Statement on Form S-1, as amended (file no. 33-91520). |
| (3) | Incorporated by reference to the Company’s Registration Statement on Form S-8 filed March 9, 2001. |
| (4) | Incorporated by reference to the Company’s Registration Statement on Form S-8 filed November 21, 2002. |
| (5) | Incorporated by reference to the Company’s Annual Report on Form 10-K for the period ended September 30, 2003. |
| (6) | Incorporated by reference to the Company’s Quarterly Report on Form 10-Q for the period ended March 31, 2009. |
| (7) | Incorporated by reference to the Company’s Report on Form 8-K filed September 12, 2006. |
| (8) | Incorporated by reference to the Company’s Report on Form 8-K filed August 14, 2007. |
| (9) | Incorporated by reference to the Company’s Report on Form 8-K filed November 12, 2008. |
| (10) | Incorporated by reference to the Company’s Report on Form 8-K filed June 16, 2009. |
78