Attached files
| file | filename |
|---|---|
| EX-31.2 - Colfax CORP | v204671_ex31-2.htm |
| EX-23.1 - Colfax CORP | v204671_ex23-1.htm |
| EX-32.2 - Colfax CORP | v204671_ex32-2.htm |
| EX-32.1 - Colfax CORP | v204671_ex32-1.htm |
| EX-31.1 - Colfax CORP | v204671_ex31-1.htm |
SECURITIES
AND EXCHANGE COMMISSION
Washington,
D.C. 20549
FORM
10-K/A
Amendment No.
1
(Mark
One)
|
x
|
ANNUAL
REPORT PURSUANT TO SECTION 13 OR 15(d) OF THE SECURITIES EXCHANGE ACT OF
1934
|
For
the fiscal year ended December 31, 2009
OR
|
¨
|
TRANSITION
REPORT PURSUANT TO SECTION 13 OR 15(d) OF THE SECURITIES EXCHANGE ACT OF
1934
|
For
the transition period from
to
Commission
File Number: 001-34045
Colfax
Corporation
(Exact
name of registrant as specified in its charter)
|
Delaware
|
54-1887631
|
|
|
(State or other jurisdiction of incorporation or organization)
|
(I.R.S. Employer Identification No.)
|
|
|
8730 Stony Point Parkway, Suite 150
Richmond, Virginia
|
23235
|
|
|
(Address of principal executive offices)
|
(Zip Code)
|
|
Registrant's
telephone number, including area code: 804-560-4070
Securities
Registered Pursuant to Section 12(b) of the Act:
|
Title of Each Class
|
Name of Each Exchange On Which Registered
|
|
|
Common Stock, $.001 par value
|
New York Stock Exchange
|
Securities
registered pursuant to Section 12(g) of the Act:
NONE
(Title
of Class)
Indicate
by check mark if the registrant is a well-known seasoned issuer, as defined in
Rule 405 of the Securities Act. Yes ¨ No
x
Indicate
by check mark if the registrant is not required to file reports pursuant to
Section 13 or Section 15(d) of the Act. Yes ¨ No
x
Indicate
by check mark whether the Registrant (1) has filed all reports required to
be filed by Section 13 or 15(d) of the Securities Exchange Act of 1934
during the preceding 12 months (or for such shorter period that the registrant
was required to file such reports), and (2) has been subject to such filing
requirements for the past 90 days. Yes x
No
Indicate
by check mark whether the registrant has submitted electronically and posted on
its corporate Web site, if any, every Interactive Data File required to be
submitted and posted pursuant to Rule 405 of Regulation S-T (§ 232.405 of this
chapter) during the preceding 12 months (or for such shorter period that the
registrant was required to submit and post such
files). Yes ¨
No ¨
Indicate
by check mark if disclosure of delinquent filers pursuant to Item 405 of
Regulation S-K is not contained herein, and will not be contained, to the best
of registrant's knowledge, in definitive proxy or information statements
incorporated by reference in Part III of this Form 10-K or any amendment to this
Form 10-K. ¨
Indicate
by check mark whether the registrant is a large accelerated filer, an
accelerated filer, a non-accelerated filer or a smaller reporting company. See
definitions of “large accelerated filer,” “accelerated filer” and “smaller
reporting company” in Rule 12b-2 of the Exchange Act. (Check one):
|
Large accelerated filer ¨
|
Accelerated filer x
|
Non-accelerated filer ¨
|
Smaller reporting company ¨
|
|||
|
(Do not check if a smaller reporting company)
|
||||||
Indicate
by check mark whether the registrant is a shell company (as defined in Rule
12b-2 of the Exchange Act) Yes ¨
No x
The
aggregate market value of common shares held by non-affiliates of the Registrant
on July 3, 2009 was $178,598,119 based upon the closing price of the
registrant's common shares as quoted on the New York Stock Exchange composite
tape on such date.
As of
January 31, 2010, the number of shares of registrant’s common stock outstanding
was 43,243,554.
EXHIBIT
INDEX APPEARS ON PAGE 88
DOCUMENTS
INCORPORATED BY REFERENCE
Part III
incorporates certain information by reference from the registrant’s definitive
proxy statement for its 2010 annual meeting of stockholders to be filed pursuant
to Regulation 14A within 120 days after the end of the registrant’s fiscal year
covered by this report. With the exception of the sections of the 2010 proxy
statement specifically incorporated herein by reference, the 2010 proxy
statement is not deemed to be filed as part of this Form
10-K/A.
EXPLANATORY
NOTE
Overview
Colfax
Corporation (the “Company”) is filing this Amendment No. 1 on Form 10-K/A
to our annual report on Form 10-K for the year ended December 31, 2009,
originally filed on February 25, 2010 (the “Original Form 10-K”), to restate our
financial statements and corresponding financial information for the year ended
December 31, 2009 for the effect of an overstatement of our pension
liability. The amendment also restates the quarterly financial
information included in Note 20 to the consolidated financial statements with
respect to each fiscal quarter in the years ended December 31, 2008 and
2009. The Company does not intend to amend its Quarterly Reports on
Form 10-Q for these fiscal quarters.
Restatement
While
preparing the 2010 census data for our defined benefit pension plan actuarial
valuations, the Company determined that previous actuarial valuations for the
plans of a U.S. subsidiary contained errors in participant data. The errors
largely originated in census data compiled by the subsidiary’s former actuaries
prior to our acquisition of the subsidiary in 1997. Because these
errors affected the valuation of pension liabilities at the date of the
acquisition, goodwill was also overstated.
As a
result of the errors, the pension liability was overstated by $21.7 million as
of December 31, 2009 and $20.0 million as of December 31,
2008. Additionally, goodwill was overstated by $3.8 million as of
December 31, 2009 and 2008 and shareholder’s equity was understated by $18.0
million as of December 31, 2009 and $14.4 million as of December 31,
2008. Net income was understated by $2.1 million for the year ended
December 31, 2009, $1.1 million for the year ended December 31, 2008, and $0.8
million for the year ended December 31, 2007. There is no cash flow
impact from these errors. The errors increased other comprehensive
income by $1.5 million for the year ended December 31, 2009, had a less than
$0.1 million impact on the year ended December 31, 2008, and decreased other
comprehensive income by $0.5 million for the year ended December 31,
2007.
This
amendment also contains balance sheet reclassifications at December 31, 2009 to
reclassify a portion of the asbestos insurance asset from long term to current
and to reflect certain property previously recorded in other assets as property,
plant and equipment.
The
Company is filing amended Quarterly Reports on Form 10-Q/A for the quarter ended
April 2, 2010 and the quarter ended July 2, 2010, to correct the errors
described above. Please refer to those amended reports for further
discussion of the restatement of those respective periods.
All of
the information in this Form 10-K/A is as of February 25, 2010, the date the
Company filed the Original Form 10-K with the Securities and Exchange
Commission. This Form 10-K/A continues to speak as of the date of the
Original Form 10-K and does not reflect any subsequent information or events
other than the restatement discussed in Note 2 to the Consolidated Financial
Statements appearing in this Form 10-K/A. Accordingly, this Form 10-K/A should
be read in conjunction with our filings made with the Securities and Exchange
Commission subsequent to the filing of the Original Form 10-K, including any
amendments to those filings. Among other things, forward-looking
statements made in the Original Form 10-K have not been revised to reflect
events, results or developments that occurred or facts that became known to us
after the date of the Original Form 10-K, other than the
restatement.
For the
convenience of the reader, this Form 10-K/A sets forth the Original Form 10-K in
its entirety. No attempt has been made in this Form 10-K/A to modify
or update the disclosures in the Original Form 10-K except as required to
reflect the effects of the restatement discussed in Note 2 to the Consolidated
Financial Statements. However, changes have been made to the following items
solely as a result of, and to reflect, the restatement, and no other information
in the Form 10-K/A is amended hereby as a result of the
restatement:
|
|
·
|
Part
I, Item 1A - Risk Factors
|
|
|
·
|
Part
II, Item 6 - Selected Financial
Data
|
|
|
·
|
Part
II, Item 7 - Management’s Discussion and Analysis of Financial Condition
and Results of Operations
|
|
|
·
|
Part
II, Item 8 - Financial Statements and Supplementary
Data
|
|
|
·
|
Part
II, Item 9A - Controls and
Procedures
|
|
|
·
|
Part
IV, Item 15 - Exhibits and Financial Statement
Schedules
|
In the
Original Form 10-K, the Company reported under Item 9A “Controls and
Procedures,” that its disclosure controls and procedures were
effective. Management, in consultation with the Audit Committee, has
concluded that the errors set forth herein constituted a material weakness
in the Company’s internal controls over financial reporting as of the date of
the Original Form 10-K. The revised assessment is included under Part
II, Item 9A in this document.
The
Company is including currently dated Sarbanes-Oxley Act Section 302 and Section
906 certifications of the Chief Executive Officer and Chief Financial Officer
that are attached to this Form 10-K/A as Exhibits 31.1, 31.2, 32.1 and
32.2.
TABLE
OF CONTENTS
|
|
|
|
PAGE
|
|||
|
PART I
|
||||||
|
|
Item
1.
|
|
Business
|
|
2
|
|
|
|
Item 1A.
|
|
Risk
Factors
|
|
10
|
|
|
|
Item 1B.
|
|
Unresolved
Staff Comments
|
|
19
|
|
|
|
Item
2.
|
|
Properties
|
|
19
|
|
|
|
Item
3.
|
|
Legal
Proceedings
|
|
19
|
|
|
|
Item
4.
|
|
Submission
of Matters to a Vote of Security Holders
|
|
19
|
|
|
|
|
Executive
Officers of the Registrant
|
|
19
|
||
|
PART II
|
|
|
|
|||
|
|
Item
5.
|
|
Market
for Registrant’s Common Equity, Related Stockholder Matters and Issuer
Purchases of Equity Securities
|
|
20
|
|
|
|
Item
6.
|
|
Selected
Financial Data
|
|
22
|
|
|
|
Item
7.
|
|
Management’s
Discussion and Analysis of Financial Condition and Results of
Operations
|
|
23
|
|
|
|
Item 7A.
|
|
Quantitative
and Qualitative Disclosures About Market Risk
|
|
41
|
|
|
|
Item
8.
|
|
Financial
Statements and Supplementary Data
|
|
42
|
|
|
|
Item
9.
|
|
Changes
in and Disagreements with Accountants on Accounting and Financial
Disclosure
|
|
83
|
|
|
|
Item 9A.
|
|
Controls
and Procedures
|
|
83
|
|
|
|
Item 9B.
|
|
Other
Information
|
|
84
|
|
|
PART III
|
|
|
|
|||
|
|
Item
10.
|
|
Directors,
Executive Officers and Corporate Governance
|
|
84
|
|
|
|
Item
11.
|
|
Executive
Compensation
|
|
84
|
|
|
|
Item
12.
|
|
Security
Ownership of Certain Beneficial Owners and Management and Related
Stockholder Matters
|
|
84
|
|
|
|
Item
13.
|
|
Certain
Relationships and Related Transactions, and Director
Independence
|
|
85
|
|
|
|
Item
14.
|
|
Principal
Accountant Fees and Services
|
|
85
|
|
|
PART IV
|
|
|
|
|||
|
|
Item 15.
|
|
Exhibits
and Financial Statement Schedules
|
|
85
|
|
Unless
otherwise indicated, references in this Form 10-K/A to “Colfax”, “the Company”,
“we”, “our” and “us” refer to Colfax Corporation and its
subsidiaries.
SPECIAL
NOTE REGARDING FORWARD-LOOKING STATEMENTS
Some of
the statements contained in this Annual Report that are not historical facts are
forward-looking statements within the meaning of Section 21E of the
Securities Exchange Act of 1934 (the “Exchange Act”). We intend such
forward-looking statements to be covered by the safe harbor provisions for
forward-looking statements contained in Section 21E of the Exchange Act.
Readers are cautioned not to place undue reliance on these forward-looking
statements, which speak only as of the date this Annual Report is filed with the
SEC. All statements other than statements of historical fact are statements that
could be deemed forward-looking statements, including statements regarding:
projections of revenue, profit margins, expenses, tax provisions and tax rates,
earnings or losses from operations, impact of foreign exchange rates, cash
flows, pension and benefit obligations and funding requirements, synergies or
other financial items; plans, strategies and objectives of management for future
operations including statements relating to potential acquisitions, compensation
plans, purchase commitments; developments, performance or industry or market
rankings relating to products or services; future economic conditions or
performance; the outcome of outstanding claims or legal proceedings including
asbestos-related liabilities and insurance coverage litigation; potential gains
and recoveries of costs; assumptions underlying any of the foregoing; and any
other statements that address activities, events or developments that we intend,
expect, project, believe or anticipate will or may occur in the future.
Forward-looking statements may be characterized by terminology such as
“believe,” “anticipate,” “should,” “would,” “intend,” “plan,” “will,” “expect,”
“estimate,” “project,” “positioned,” “strategy,” and similar expressions. These
statements are based on assumptions and assessments made by our management in
light of their experience and perception of historical trends, current
conditions, expected future developments and other factors we believe to be
appropriate. These forward-looking statements are subject to a number of risks
and uncertainties, including but not limited to the following:
|
|
•
|
risks
associated with our international
operations;
|
|
|
•
|
significant
movements in foreign currency exchange
rates;
|
|
|
•
|
changes
in the general economy, including the current global economic downturn, as
well as the cyclical nature of our
markets;
|
|
|
•
|
our
ability to accurately estimate the cost of or realize savings from our
restructuring programs;
|
|
|
•
|
availability
and cost of raw materials, parts and components used in our
products;
|
|
|
•
|
the
competitive environment in our
industry;
|
|
|
•
|
our
ability to identify, finance, acquire and successfully integrate
attractive acquisition targets;
|
|
|
•
|
the
amount of and our ability to estimate our asbestos-related
liabilities;
|
|
|
•
|
material
disruption at any of our significant manufacturing
facilities;
|
|
|
•
|
the
solvency of our insurers and the likelihood of their payment for
asbestos-related claims;
|
|
|
•
|
our
ability to manage and grow our business and execution of our business and
growth strategies;
|
|
|
•
|
loss
of key management;
|
|
|
•
|
our
ability and the ability of customers to access required capital at a
reasonable cost;
|
|
|
•
|
our
ability to expand our business in our targeted
markets;
|
|
|
•
|
our
ability to cross-sell our product portfolio to existing
customers;
|
|
|
•
|
the
level of capital investment and expenditures by our customers in our
strategic markets;
|
|
|
•
|
our
financial performance;
|
1
|
|
•
|
our
ability to identify, address and remediate any material weaknesses in our
internal control over financial reporting;
and
|
|
|
•
|
others
risks and factors, listed in Item 1A. Risk Factors in Part I of this Form
10-K/A.
|
Any such
forward-looking statements are not guarantees of future performance and actual
results, developments and business decisions may differ materially from those
envisaged by such forward-looking statements. These forward-looking statements
speak only as of the date the Original Form 10-K was filed with the SEC. We do
not assume any obligation and do not intend to update any forward-looking
statement except as required by law. See Item IA. Risk Factors in Part I of this
Form 10-K/A for a further discussion regarding some of the reasons that actual
results may be materially different from those that we anticipate.
PART
I
|
ITEM 1.
|
BUSINESS
|
General
Colfax
Corporation is a global supplier of a broad range of fluid handling products,
including pumps, fluid handling systems and controls, and specialty valves. We
believe that we are a leading manufacturer of rotary positive displacement
pumps, which include screw pumps, gear pumps and progressive cavity pumps. We
design and engineer our products to high quality and reliability standards for
use in critical fluid handling applications where performance is paramount. We
also offer customized fluid handling solutions to meet individual customer needs
based on our in-depth technical knowledge of the applications in which our
products are used.
Our
products are marketed principally under the Allweiler, Fairmount, Houttuin, Imo,
LSC, Portland Valve, Tushaco, Warren and Zenith brand names. We believe
that our brands are widely known and have a premium position in our industry.
Allweiler, Houttuin, Imo and Warren are among the oldest and most recognized
brands in the markets in which we participate, with Allweiler dating back to
1860. We have a global manufacturing footprint, with production facilities in
Europe, North America and Asia, as well as worldwide sales and distribution
channels.
We employ
a comprehensive set of tools that we refer to as the Colfax Business System, or
CBS. CBS is a disciplined strategic planning and execution methodology designed
to achieve excellence and world-class financial performance in all aspects of
our business by focusing on the Voice of the Customer and
continuously improving quality, delivery and cost. Modeled on the Danaher
Business System, CBS focuses on conducting root-cause analysis, developing
process improvements and implementing sustainable systems. Our approach
addresses the entire business, not just manufacturing operations.
We
currently serve markets that have a need for highly engineered, critical fluid
handling solutions and are global in scope. Our strategic markets
include:
|
Strategic
Markets
|
|
Applications
|
|
Commercial
Marine
|
|
Fuel
oil transfer; oil transport; water and wastewater handling; cargo
handling
|
|
Oil
and Gas
|
|
Crude
oil gathering; pipeline services; unloading and loading; rotating
equipment lubrication; lube oil purification
|
|
Power
Generation
|
|
Fuel
unloading, transfer, burner and injection; rotating equipment
lubrication
|
|
Global
Navy
|
|
Fuel
oil transfer; oil transport; water and wastewater handling; firefighting;
fluid control
|
|
General
Industrial
|
|
Machinery
lubrication; hydraulic elevators; chemical processing; pulp and paper
processing; food and beverage processing;
distribution
|
We serve
a global customer base across multiple markets through a combination of direct
sales and marketing associates and third-party distribution channels. Our
customer base is highly diversified and includes commercial, industrial and
government customers such as Alfa Laval Group, General Dynamics Corporation,
General Electric Company, Northrup Grumman Corporation, Siemens AG, Rolls-Royce
Group plc, the U.S. Navy and various sovereign navies around the world. Our
business is not dependent on any single customer or a few customers. In 2009, no
single customer represented more than 4% of sales.
Our
business began with an initial investment by our founders in 1995 with the
intention to acquire, manage and create a world-class industrial manufacturing
company. We seek to acquire businesses with leading market positions and
brands that exhibit strong cash flow generation potential. With our management
expertise and the introduction of CBS into our acquired businesses, we pursue
growth in revenues and improvements in operating margins.
2
Since our
platform acquisitions of Imo and Allweiler in 1997 and 1998, respectively, we
have completed additional acquisitions that have broadened our fluid handling
product portfolio and geographic footprint. A summary of recent acquisition
activity follows:
|
|
·
|
In
June 2004, we acquired the net assets of Zenith, a leading manufacturer of
precision metering pumps for the general industrial
market.
|
|
|
·
|
In
August 2004, we acquired the net assets of Portland Valve, a manufacturer
of specialty valves used primarily for naval
applications.
|
|
|
·
|
In
August 2005, we acquired Tushaco, a leading manufacturer of rotary
positive displacement pumps in
India.
|
|
|
·
|
In
January 2007, we acquired LSC, a manufacturer of fluid handling systems.
LSC designs, manufactures, installs and maintains oil mist lubrication and
oil purification systems in refineries, petrochemical plants and other
processing facilities.
|
|
|
·
|
In
November 2007, we acquired Fairmount, an original equipment manufacturer
of mission critical programmable automation controllers in fluid handling
applications primarily for the U.S.
Navy.
|
|
|
·
|
In
August 2009, we acquired PD-Technik, a provider of marine aftermarket
related products and services.
|
In
addition to our acquisitions, in 2005 we opened a greenfield production facility
in Wuxi, China to manufacture and assemble complete products and systems for our
customers in China and other Asian markets and to supply low cost components and
parts for our existing operations.
Our
Industry
Based on
industry data supplied by The Freedonia Group and European Industrial
Forecasting, we estimate the worldwide fluid handling market, which we define as
industrial pumps, valves, and gaskets and seals, to have been $139 billion in
2008. Within this market, we primarily compete in the estimated $3 billion
global rotary positive displacement pump market, a sub-section of the estimated
$12 billion positive displacement pump market. We are also a competitor in
the estimated $19 billion centrifugal pump market and the estimated $68 billion
valve market.
We
believe that there are over 10,000 companies competing in the worldwide fluid
handling industry. The fluid handling industry’s customer base is broadly
diversified across many sectors of the economy, and we believe customers place a
premium on quality, reliability, availability, design and application
engineering support. Because products in the fluid handling industry often are
used as components in critical applications, we believe the most successful
industry participants are those that have the technical capabilities to meet
customer specifications, offer products with reputations for quality and
reliability, and can provide timely delivery and strong aftermarket
support.
Competitive
Strengths
Strong Market Positions, Broad
Product Portfolio and Leading Brands. We believe that we are
a leading manufacturer of rotary positive displacement pumps, which include
screw pumps, gear pumps and progressive cavity pumps. We offer a broad portfolio
of fluid handling products that fulfill critical needs of customers across
numerous industries. Our brands are among the oldest and most recognized in the
markets in which we participate.
Strong Application
Expertise. We believe that our reputation for quality
and technical expertise positions us as a premium supplier of fluid handling
products. With 150 years of experience, we have significant expertise in
designing and manufacturing fluid handling products that are used in critical
applications, such as lubricating power generation turbines, transporting crude
oil through pipelines, and transferring heavy fuel oil in commercial marine
vessels.
Extensive Global Sales, Distribution
and Manufacturing Network. We sell our products through more
than 300 direct sales and marketing associates and approximately 250 authorized
distributors in more than 100 countries. We believe that our global reach within
the highly fragmented, worldwide fluid handling industry provides us with an
ability to better serve our customers. Our European, North American and Asian
manufacturing capabilities provide us with the ability to optimize material
sourcing, transportation and production costs and reduce foreign currency
risk.
3
We Use CBS to Continuously Improve
Our Business. CBS is our business system designed to
encourage a culture of continuous improvement in all aspects of our operations
and strategic planning. Modeled on the Danaher Business System, CBS focuses
on conducting root-cause analysis, developing process improvements and
implementing sustainable systems. Our approach addresses the entire
business, not just manufacturing operations.
Large Installed Base Generating
Aftermarket Sales and Service. With a history dating
back to 1860, we have a significant installed base across numerous industries.
Because of the critical applications in which our products are used and the high
quality and reliability of our products, we believe there is a tendency to
replace “like for like” products. This tendency leads to significant aftermarket
demand for replacement products as well as for spare parts and service. In the
year ended December 31, 2009, approximately 24% of our revenues were derived
from aftermarket sales and services.
Broad and Diverse Customer
Base. Our customer base spans numerous industries and is
geographically diverse. Approximately 76% of our sales in 2009 were delivered to
customers outside of the U.S. In addition, no single customer represented more
than 4% of our sales during this period.
Management Team with Extensive
Industry Experience and Focus on Strategic
Development. We are led by a senior management team with
an average of over 20 years of experience in industrial manufacturing. Since
1995, we have acquired 13 companies and divested businesses that do not fit
within our long-term growth strategy. We believe that we have extensive
experience in acquiring and effectively integrating attractive acquisition
targets.
Growth
Strategy
We intend
to continue to increase our sales, expand our geographic reach, broaden our
product offerings, and improve our profitability through the following
strategies:
|
|
Ÿ
|
Apply CBS to Drive Profitable
Sales Growth and Increase Shareholder
Value. The core element of our management
philosophy is CBS, which we implement in each of our businesses. CBS
focuses our organization on continuous improvement and performance goals
by empowering our associates to develop innovative strategies to meet
customer needs. Rather than a static process, CBS continues to evolve as
we benchmark ourselves against best-in-class industrial
companies.
|
Beyond
the traditional application of cost control, overhead rationalization, global
process optimization, and implementation of lean manufacturing techniques, we
utilize CBS to identify strategic opportunities to enhance future sales growth.
The foremost principle of CBS is the Voice of the Customer, which
drives our activities to continuously improve customer service, product quality,
delivery and cost. The Voice
of the Customer is instrumental in the development of new products,
services and solutions by utilizing a formal interview process with the end
users of our products to identify “pain points” or customer needs. By engaging
end users in the discussion, rather than solely relying on salespeople or
channel partners for anecdotal input, we see the real issues and opportunities.
We then prioritize these opportunities with the intention of implementing novel
or breakthrough ideas that uniquely solve end-user needs. As we continue to
apply the methodology of CBS to our existing businesses as well as to future
acquisitions, we believe that we will be able to continue to introduce
innovative new products and solutions, improve operating margins and increase
the asset utilization of our businesses. As a result, we believe we can create
profitable sales growth, generate excess cash flow to fund future acquisitions
and increase shareholder value.
|
|
Ÿ
|
Execute Market Focused
Strategies. We have aligned our marketing
and sales organization into market focused teams designed to coordinate
global activity around five strategic markets: commercial marine, oil and
gas, power generation, global navy and general industrial. These markets
have a need for highly engineered, critical fluid handling solutions and
are attractive due to their ongoing capital expenditure requirements, long
term growth rates and global nature. We intend to continue to use our
application expertise, highly engineered and specialized products, broad
product portfolio and recognized product brands to generate high margin
incremental revenue.
|
4
Commercial Marine— We provide
complete fluid handling packages to shipbuilders throughout the world primarily
for use in engine room applications. Our products are widely recognized for
their superior reliability and lower total cost of ownership. The increased rate
of commercial marine vessel construction in recent years has expanded our
installed base of fluid handling products and has generated increased
aftermarket revenues. In addition to supplying our products for new vessels, we
intend to continue to grow our aftermarket sales and services by optimizing our
channels to improve market coverage. We are also addressing changing
environmental requirements with our products. We also intend to continue to
expand our global reach by utilizing our Chinese operations to offer locally
manufactured products, to reduce production costs and to provide local customer
service and support for the Asia Pacific region, an area where the majority of
the commercial marine vessels are constructed.
Oil and Gas— We provide a
broad portfolio of fluid handling products for many oil and gas applications
around the world. In particular, we have a strong presence in oil field tank
farms, pipelines and refineries and also in Floating Production Storage and
Offloading (FPSO) installations. We intend to continue to execute our strategy
in the global crude oil transport market by targeting applications where our
products can replace less efficient fluid handling alternatives. We also intend
to leverage our position as a leading supplier of 2-screw pumps by developing
complex turnkey systems to capture the growing need for fluid handling solutions
that can undertake the difficult task of handling varying mixtures of heavy
crude oil, natural gas and water at the same time. Additionally, we expect to
continue to extend LSC’s presence within the refinery market through increased
market coverage and intend to broaden LSC’s core lubrication offerings for new
applications. We are also adding resources to the growing oil and gas markets
around the world, including Asia, the Middle East and developing
nations.
Power Generation— We provide
fluid handling products used in critical lubrication and fuel injection services
for fossil fuel, hydro and nuclear power plants around the world. We believe
that we have in-depth knowledge of fuel injection and lubrication applications,
strong product brand names and a reputation for reliability in the power
generation industry. Within this market we intend to continue our growth as a
provider of turnkey systems by utilizing our expertise in power generation
applications to develop innovative solutions. We also plan to continue to
leverage our global presence to strengthen our relationships with large original
equipment manufacturers of power generation equipment to establish us as a
critical supplier.
Global Navy— For over 90 years
we have supplied our specialty centrifugal and screw pumps to sovereign navies
around the world, including the U.S. Navy and most of the major navies in
Europe. With the acquisitions of Portland Valve and Fairmount, we have broadened
our offering to include specialty valves and advanced control systems,
respectively. We intend to continue to design, manufacture and sell high value
fluid handling systems in order to meet the evolving requirements and standards
of the navies around the world. Our engineers are also working with the U.S.
Navy to incorporate electronics and advanced control algorithms into our
products. We are also focused on expanding our repair and service capabilities
as work is outsourced to private shipyards. As part of this strategy, we have
established a waterfront repair and service facility in San Diego, California to
complement our Portland, Maine facility in order to provide more responsive
aftermarket support to the U.S. Navy.
General Industrial— We provide
fluid handling solutions for a broad array of general industrial applications,
including machinery lubrication, commercial construction, chemical processing,
pulp and paper processing and food and beverage processing, among others. We
intend to continue to apply our application and engineering expertise to supply
our customers with a portfolio of products that can solve their most critical
fluid handling needs. We also intend to continue to expand our presence in the
general industrial market by targeting new applications for our existing
products, deploying regionally focused strategies and leveraging our global
presence and sales channels to sell our solutions worldwide.
|
|
Ÿ
|
Target Faster Growing Regions
by Leveraging Our Global Manufacturing, Sales and Distribution
Network. We intend to continue to leverage our
strong global presence and worldwide network of distributors to capitalize
on growth opportunities by selling regionally developed and marketed
products and solutions throughout the world. As our customers have become
increasingly global in scope, we have likewise increased our global reach
to serve our customers by maintaining a local presence in numerous markets
and investing in sales, marketing and manufacturing capabilities
globally.
|
5
To
further enhance our focus on serving our customers, we have developed and are in
the process of implementing the Colfax Sales Office (“CSO”), a web-based
selection, configuration, quotation, order entry and aftermarket tool to
streamline the quote-to-order process. We believe that CSO, when fully
installed, will significantly increase the speed of supplying quotes to our
customers and will reduce our selling costs and increase our manufacturing
efficiency. This is expected to be accomplished by eliminating many manual
front-end processes and establishing an integrated, automated platform across
brands to capture sales that otherwise would be lost due to increased response
times.
|
|
Ÿ
|
Develop New Products,
Applications and Technologies. We will continue to
engineer our key products to meet the needs of new and existing customers
and also to improve our existing product offerings to strengthen our
market position. We plan to continue to develop technological, or “SMART,”
solutions, which incorporate advanced electronics, sensors and controls,
through the use of our Voice of the Customer
process to solve specific customer needs. We believe our SMART solutions
will reduce our customers’ total cost of ownership by providing real-time
diagnostic capabilities to minimize downtime, increase operational
efficiency and avoid unnecessary costs. We also intend to leverage
Fairmount’s portfolio of advanced controls into our broader industrial
offerings to develop innovative SMART fluid handling
solutions.
|
To
further align our product innovation efforts across our operations, we have
established a global engineering center of excellence located at our office in
Mumbai, India, which collaborates with our global operations to design new
products, modify existing solutions, identify opportunities to reduce
manufacturing costs and increase the efficiency of our existing product lines.
We believe that we will be able to reallocate select engineering functions to
our engineering centers, thereby freeing resources to spend time on higher value
work.
|
|
Ÿ
|
Grow Our Offerings of Systems
and Solutions. We will continue to provide high
value added fluid handling solutions by utilizing our engineering and
application expertise and our brand recognition and sales channels to
drive incremental revenue. We intend to establish regional system
manufacturing capabilities to address our customers’ desire to purchase
turnkey modules and their preference for outsourced
assembly.
|
|
|
Ÿ
|
Continue to Pursue Strategic
Acquisitions that Complement our Platform. We
believe that the fragmented nature of the fluid handling industry presents
substantial consolidation and growth opportunities for companies with
access to capital and the management expertise to execute a disciplined
acquisition and integration program. We have successfully applied this
strategy since our inception and plan to continue to seek companies
that:
|
|
|
Ÿ
|
enhance
our position in our strategic
markets;
|
|
|
|
|
|
Ÿ
|
have
recognized, leading brands and strong industry
positions;
|
|
|
|
|
|
Ÿ
|
present
opportunities to expand our product lines and
services;
|
|
|
|
|
|
Ÿ
|
have
a reputation for high quality
products;
|
|
|
|
|
|
Ÿ
|
will
broaden our global manufacturing
footprint;
|
|
|
|
|
|
Ÿ
|
complement
or augment our existing worldwide sales and distribution networks;
or
|
|
|
|
|
|
Ÿ
|
present
opportunities to provide operational synergies and improve the combined
business operations by implementing
CBS.
|
We
believe that we can identify attractive acquisition candidates in the future and
that strategic acquisition growth will give us the opportunity to gain a
competitive advantage relative to smaller operators through greater purchasing
power, a larger international sales and distribution network, and a broader
portfolio of products and services.
6
Products
We
design, manufacture and distribute fluid handling products that transfer or
control liquids in a variety of applications. We also sell replacement parts and
perform repair services for our manufactured products.
Our
primary products, brands and their end uses include:
|
Fluid
Handling Products
|
Primary Brands
|
|
Primary End Uses
|
|
|
Pumps
|
|
Allweiler,
Houttuin, Imo, Warren, Tushaco and Zenith
|
|
Commercial
marine, oil and gas, machinery lubrication, power generation, global navy
and commercial construction
|
|
Fluid
Handling Systems
|
|
Allweiler,
Fairmount, Houttuin, Imo, LSC and Warren
|
|
Commercial
marine, oil and gas, power generation and global navy
|
|
Specialty
Valves
|
|
Portland
Valve
|
|
Global
navy
|
Pumps
Rotary Positive Displacement
Pumps —We believe that we are a leading manufacturer of rotary positive
displacement pumps with a broad product portfolio and globally recognized
brands. Rotary positive displacement pumps consist of a casing containing
screws, gears, vanes or similar components that are actuated by the relative
rotation of that component to the casing, which results in the physical movement
of the liquid from the inlet to the discharge at a constant rate. Positive
displacement pumps generally offer precise, quiet and highly efficient transport
of viscous fluids. The U.S. Hydraulic Institute accredits 11 basic types of
rotary positive displacement pumps, of which we manufacture five (3-screw,
2-screw, progressive cavity, gear and peristaltic).
Specialty Centrifugal Pumps—
Centrifugal pumps use the kinetic energy imparted by rotating an impeller inside
a configured casing to create pressure. While traditionally used to transport
large quantities of thin liquids, our centrifugal pumps use specialty designs
and materials to offer customers high quality, reliability and customized
solutions for a wide range of viscosities, temperatures and applications. We
position our specialty centrifugal pumps for applications where customers
clearly recognize our brand value or in markets where centrifugal and rotary
pumps are complimentary.
Fluid
Handling Systems
We
manufacture complete fluid handling systems used primarily in the oil and gas,
power generation, commercial marine and global navy markets. We offer turnkey
systems and support, including design, manufacture, installation, commission and
service. Our systems include:
|
|
Ÿ
|
oil
mist lubrication systems, which are used in rotating equipment in oil
refineries and other process
industries;
|
|
|
|
|
|
Ÿ
|
custom
designed packages used in crude oil pipeline
applications;
|
|
|
|
|
|
Ÿ
|
lubrication
and fuel forwarding systems used in power generation
turbines;
|
|
|
|
|
|
Ÿ
|
complete
packages for commercial marine engine rooms;
and
|
|
|
Ÿ
|
fire
suppression systems for navy
applications.
|
Specialty
Valves
Our
specialty valves are used primarily in naval applications. Our valve business
has specialized machining, welding and fabrication capabilities that enable it
to serve as a supplier to the U.S. Navy. In addition to designing and
manufacturing valves, we also offer repair and retrofit services for products
manufactured by other valve suppliers through our aftermarket support centers
located in Portland, Maine and San Diego, California.
7
Manufacturing
We
manufacture and assemble our products at 14 locations in Europe, North America
and Asia. This global manufacturing reach enables us to serve our customers
wherever they choose to do business. Each of our manufacturing sites offers
machining, fabrication and assembly capabilities that gives us the flexibility
to source some of our products from multiple facilities. We believe that this
flexibility enables us to minimize the impact of a manufacturing disruption if
one of our facilities was to be damaged as a result of a natural disaster or
otherwise. Our manufacturing facilities also benefit from the use of shared
technology and collaboration across production lines, enabling us to increase
operational efficiencies through the use of common suppliers and the duplication
of production processes.
Competition
Our
products and services are marketed on a worldwide basis. We believe that the
principal elements of competition in our markets are:
|
|
Ÿ
|
the
ability to meet customer
specifications;
|
|
|
|
|
|
Ÿ
|
application
expertise and design and engineering
capabilities;
|
|
|
Ÿ
|
product
quality and brand name;
|
|
|
|
|
|
Ÿ
|
timeliness
of delivery;
|
|
|
|
|
|
Ÿ
|
price;
and
|
|
|
|
|
|
Ÿ
|
quality
of aftermarket sales and support.
|
The
markets we serve are highly fragmented and competitive. Because we compete in
selected niches of the fluid handling industry, there is not any single company
that competes directly with us across all of our markets. As a result, we have
many different competitors in each of our strategic markets. In the commercial
marine market, we compete primarily with Naniwa Pump Manufacturing Co., Ltd.,
Shinko Industries, Ltd., Shin Shin Machinery Group Co., Ltd. and Taiko Kikai
Industries Co., Ltd. In the oil and gas market, we compete primarily with Joh.
Heinr. Bornemann GmbH and Leistritz Pumpen GmbH. In the power generation market,
we compete primarily with Buffalo Pumps, a subsidiary of Ampco-Pittsburgh
Corporation. In the global navy market, we compete primarily with Buffalo Pumps,
Carver Pump Company, Curtiss-Wright Corporation and Tyco International,
Inc.
Research
and Development
We
closely integrate research and development with marketing, manufacturing and
product engineering in meeting the needs of our customers. Our business product
engineering teams are continuously enhancing our existing products and
developing new product applications for our growing base of customers that
require custom solutions. We believe these capabilities provide a significant
competitive advantage in the development of high quality fluid handling systems.
Our product engineering teams focus on:
|
|
Ÿ
|
lowering
the cost of manufacturing our existing
products;
|
|
|
|
|
|
Ÿ
|
redesigning
existing product lines to increase their efficiency or enhance their
performance; and
|
|
|
|
|
|
Ÿ
|
developing
new product applications.
|
Expenditures
for research and development for the years ended December 31,
2009, 2008 and 2007 were $5.9 million, $5.9 million and $4.2 million,
respectively.
Intellectual
Property
We rely
on a combination of intellectual property rights, including patents, trademarks,
copyrights, trade secrets and contractual provisions to protect our intellectual
property. Although we highlight recent additions to our patent portfolio as part
of our marketing efforts, we do not consider any one patent or trademark or any
group thereof essential to our business as a whole or to any of our business
operations. We also rely on proprietary product knowledge and manufacturing
processes in our operations.
8
International
Operations
Our
products and services are available worldwide. We believe this geographic
diversity allows us to draw on the skills of a worldwide workforce, provides
stability to our operations, allows us to drive economies of scale, provides
revenue streams that may offset economic trends in individual economies, and
offers us an opportunity to access new markets for products. In addition, we
believe that future growth is dependent in part on our ability to develop
products and sales models that target developing countries. Our principal
markets outside the United States are in Europe, Asia, the Middle East and South
America.
The
manner in which our products and services are sold differs by region. Most of
our sales in non-U.S. markets are made by subsidiaries located outside the
United States, though we also sell into non-U.S. markets through various
representatives and distributors and directly from the U.S. In countries with
low sales volumes, we generally sell through representatives and
distributors.
Financial
information about our international operations is contained in Note 18 of the
Consolidated Financial Statements included in Item 8. Financial Statements and
Supplementary Data, and information about the possible effects of foreign
currency fluctuations on our business is set forth in Item 7. Management's
Discussion and Analysis of Financial Condition and Results of Operations. For a
discussion of risks related to our non-U.S. operations and foreign currency
exchange, please refer to Item 1A. Risk Factors.
Raw
Materials and Backlog
We obtain
raw materials, component parts and supplies from a variety of sources, generally
each from more than one supplier. Our principal raw materials are metals,
castings, motors, seals and bearings. Our suppliers and sources of raw materials
are based in both the United States and other countries, and we believe that our
sources of raw materials are adequate for our needs for the foreseeable future.
We believe that the loss of any one supplier would not have a material adverse
effect on our business or results of operations.
Manufacturing
turnaround time is generally sufficiently short to allow us to manufacture to
order for most of our products, which helps to limit inventory levels. Backlog
generally is a function of requested customer delivery dates and may range from
days to several years based on the actual requested delivery dates. Backlog of
orders as of December 31, 2009 was $290.9 million, compared with $349.0 million
as of December 31, 2008. We expect to ship approximately 70% of our December 31,
2009 backlog during 2010; however, orders are subject to postponement or
cancellation.
Seasonality
Our fluid
handling business is seasonal. As our customers seek to fully utilize capital
spending budgets before the end of the year, historically our shipments have
peaked during the fourth quarter; however, the global economic downturn has
disrupted this pattern. Also, our European operations typically experience a
slowdown during the July and August holiday season.
Working
Capital
We
maintain an adequate level of working capital to support our business needs.
There are no unusual industry practices or requirements related to working
capital items.
Associates
The
following table presents our worldwide associate base as of the periods
indicated:
|
December 31,
|
||||||||||||
|
2009
|
2008
|
2007
|
||||||||||
|
United
States
|
598 | 739 | 701 | |||||||||
|
Europe
|
1,189 | 1,276 | 1,219 | |||||||||
|
Asia
|
254 | 299 | 262 | |||||||||
|
Total
|
2,041 | 2,314 | 2,182 | |||||||||
9
There are
42 associates in the United States covered by a collective bargaining agreement
with the International Union of Electronic, Electrical, Salaried, Machine and
Furniture Workers-Communications Workers of America (IUE-CWA). The contract with
the union expires December 4, 2011 and provides for wage increases ranging from
3.5% to a maximum of 3.8% per year. In addition, approximately 48% of our
associates are represented by foreign trade unions, by law, in Germany, Sweden
and the Netherlands, which subjects us to arrangements very similar to
collective bargaining agreements. We have not experienced any work stoppages or
strikes that have had a material adverse impact on operations. We consider our
relations with our associates to be good.
Government
Contracts
Sales to
U.S. government defense agencies and government contractors constituted
approximately 4% of our revenue in 2009. We are subject to business and cost
accounting regulations associated with our U.S. government defense contracts.
Violations can result in civil, criminal or administrative proceedings involving
fines, compensatory and treble damages, restitution, forfeitures, and suspension
or debarment from U.S. government defense contracts.
Company
Information and Access to SEC Reports
We were
organized as a Delaware corporation in 1998. Our principal executive offices are
located at 8730 Stony Point Parkway, Suite 150, Richmond, Virginia 23235, and
our main telephone number at that address is (804) 560-4070. Our corporate
website address is www.colfaxcorp.com.
We make
available, free of charge through our website, our annual report on Form 10-K,
quarterly reports on Form 10-Q, current reports on Form 8-K and any amendments
to those reports as soon as practicable after filing or furnishing the material
to the SEC. You may also request a copy of these filings, at no cost, by writing
or telephoning us at: Investor Relations, Colfax Corporation, 8730 Stony Point
Parkway, Suite 150, Richmond, VA 23235, telephone (804) 560-4070. Information
contained on our website is not incorporated by reference in this
report.
|
ITEM 1A.
|
RISK
FACTORS
|
An
investment in our common stock involves a high degree of risk. You should
carefully consider the risks and uncertainties described below, together with
the information included elsewhere in this Annual Report on Form 10-K/A and
other documents we file with the SEC. If any of the following risks actually
occur, our business, financial condition or operating results could suffer. As a
result, the trading price of our common stock could decline and you could lose
all or part of your investment in our common stock. The risks and uncertainties
described below are those that we have identified as material, but are not the
only risks and uncertainties facing us and we caution that this list of risk
factors may not be exhaustive. Our business is also subject to general risks and
uncertainties that affect many other companies, such as overall U.S. and
non-U.S. economic and industry conditions, a global economic slowdown,
geopolitical events, changes in laws or accounting rules, fluctuations in
interest rates, terrorism, international conflicts, natural disasters or other
disruptions of expected economic or business conditions. We operate in a
continually changing business environment, and new risk factors emerge from time
to time which we cannot predict. Additional risks and uncertainties not
currently known to us or that we currently believe are immaterial also may
impair our business, including our results of operations, liquidity and
financial condition.
Risks
Related to Our Business
Changes
in the general economy, including the current global economic downturn, and the
cyclical nature of our markets could harm our operations and financial
performance.
Our
financial performance depends, in large part, on conditions in the markets we
serve and on the general condition of the global economy. Any sustained weakness
in demand, downturn or uncertainty in the global economy could continue to
reduce our sales and profitability, and result in restructuring efforts.
Restructuring efforts are inherently risky and we may not be able to predict the
cost and timing of such actions accurately or properly estimate the impact on
demand, if any. We also may not be able to realize the anticipated savings
we expected from restructuring activities. The current global economic
downturn may continue to materially affect demand for our products and we may
not be able to predict the effect on our results. In addition, our products are
sold in many industries, some of which are cyclical and may experience periodic
downturns. Cyclical weakness in the industries we serve could lead to reduced
demand for our products and affect our profitability and financial
performance.
10
We
believe that many of our customers and suppliers are reliant on liquidity from
global credit markets and in some cases, require external financing to purchase
products or finance operations. If the current conditions impacting the credit
markets and general economy continue, demand for our products may continue to be
negatively affected and orders may be canceled or delayed, which could
materially impact our financial position, results of operations and cash
flow. Further, lack of liquidity by our customers could impact our ability
to collect amounts owed to us and lack of liquidity by financial institutions
could impact our ability to fully access our existing credit
facility.
The
majority of our sales are derived from international operations. We are subject
to specific risks associated with international operations.
In the
year ended December 31, 2009, we derived approximately 66% of our sales from
operations outside of the U.S. and have manufacturing facilities in seven
countries. Sales from international operations, export sales and the use of
manufacturing facilities outside of the U.S. are subject to risks inherent in
doing business outside the U.S. These risks include:
|
|
Ÿ
|
economic
instability;
|
|
|
Ÿ
|
partial
or total expropriation of our international
assets;
|
|
|
Ÿ
|
trade
protection measures, including tariffs or import-export
restrictions;
|
|
|
Ÿ
|
currency
exchange rate fluctuations and restrictions on currency
repatriation;
|
|
|
Ÿ
|
significant
adverse changes in taxation policies or other laws or regulations;
and
|
|
|
Ÿ
|
the
disruption of operations from political disturbances, terrorist
activities, insurrection or war.
|
Significant
movements in foreign currency exchange rates may harm our financial
results.
We are
exposed to fluctuations in currency exchange rates. In the year ended December
31, 2009, approximately 66% of our sales were derived from operations outside
the U.S. A significant portion of our revenues and income are denominated in
Euros, Swedish Kronor and Norwegian Kroner. Consequently, depreciation of the
Euro, Krona or Krone against the U.S. dollar has a negative impact on the income
from operations of our European operations. Large fluctuations in the rate of
exchange between the Euro, the Krona, the Krone and the U.S. dollar could have a
material adverse effect on our results of operations and financial
condition.
In
addition, we do not engage to a material extent in hedging activities intended
to offset the risk of exchange rate fluctuations. Any significant change in the
value of the currencies of the countries in which we do business against the
U.S. dollar could affect our ability to sell products competitively and control
our cost structure, which, in turn, could adversely affect our results of
operations and financial condition.
We
are dependent on the availability of raw materials, as well as parts and
components used in our products.
While we
manufacture many of the parts and components used in our products, we require
substantial amounts of raw materials and purchase parts and components from
suppliers. The availability and prices for raw materials, parts and components
may be subject to curtailment or change due to, among other things, suppliers’
allocations to other purchasers, interruptions in production by suppliers,
changes in exchange rates and prevailing price levels. Any significant change in
the supply of, or price for, these raw materials or parts and components could
materially affect our business, financial condition, results of operations and
cash flow. In addition, delays in delivery of components or raw materials by our
suppliers could cause delays in our delivery of products to our
customers.
11
The
markets we serve are highly competitive and some of our competitors may have
resources superior to ours. Responding to this competition could reduce our
sales and operating margins.
We sell
most of our products in highly fragmented and competitive markets. We believe
that the principal elements of competition in our markets are:
|
|
Ÿ
|
the
ability to meet customer specifications;
|
|
|
Ÿ
|
application
expertise and design and engineering capabilities;
|
|
|
Ÿ
|
product
quality and brand name;
|
|
|
Ÿ
|
timeliness
of delivery;
|
|
|
Ÿ
|
price;
and
|
|
|
Ÿ
|
quality
of aftermarket sales and support.
|
In order
to maintain and enhance our competitive position, we intend to continue our
investment in manufacturing quality, marketing, customer service and support,
and distribution networks. We may not have sufficient resources to continue to
make these investments and we may not be able to maintain our competitive
position. Our competitors may develop products that are superior to our
products, develop methods of more efficiently and effectively providing products
and services, or adapt more quickly than we do to new technologies or evolving
customer requirements. Some of our competitors may have greater financial,
marketing and research and development resources than we have. As a result,
those competitors may be better able to withstand the effects of periodic
economic downturns. In addition, pricing pressures could cause us to lower the
prices of some of our products to stay competitive. We may not be able to
compete successfully with our existing competitors or with new competitors. If
we fail to compete successfully, the failure would have a material adverse
effect on our business and results of operations.
Acquisitions
have formed a significant part of our growth strategy in the past and are
expected to continue to do so. If we are unable to identify suitable acquisition
candidates or successfully integrate the businesses we acquire or realize the
intended benefits, our growth strategy may not succeed. Acquisitions involve
numerous risks, including risks related to integration and undisclosed or
underestimated liabilities.
Historically,
our business strategy has relied on acquisitions. We expect to derive a
significant portion of our growth by acquiring businesses and integrating those
businesses into our existing operations. We intend to seek acquisition
opportunities both to expand into new markets and to enhance our position in our
existing markets. However, our ability to do so will depend on a number of
steps, including our ability to:
|
|
Ÿ
|
identify
suitable acquisition candidates;
|
|
|
Ÿ
|
negotiate
appropriate acquisition terms;
|
|
|
Ÿ
|
obtain
debt or equity financing that we may need to complete proposed
acquisitions;
|
|
|
Ÿ
|
complete
the proposed acquisitions; and
|
|
|
Ÿ
|
integrate
the acquired business into our existing
operations.
|
If we
fail to achieve any of these steps, our growth strategy may not be
successful.
In
addition, acquisitions involve numerous risks, including difficulties in
the assimilation of the operations, technologies, services and products of the
acquired company, the potential loss of key employees of the acquired company
and the diversion of our management’s attention from other business
concerns. This is the case particularly in the fiscal quarters immediately
following the completion of an acquisition because the operations of the
acquired business are integrated into the acquiring businesses’ operations
during this period. We cannot be sure that we will accurately anticipate all of
the changing demands that any future acquisition may impose on our management,
our operational and management information systems and our financial
systems.
12
Once
integrated, acquired operations may not achieve levels of revenue, profitability
or productivity comparable with those that our existing operations achieve, or
may otherwise not perform as we expected.
We may
underestimate or fail to discover liabilities relating to a future acquisition
during the due diligence investigation and we, as the successor owner, might be
responsible for those liabilities. For example, two of our acquired subsidiaries
are each one of many defendants in a large number of lawsuits that claim
personal injury as a result of exposure to asbestos from products manufactured
with components that are alleged to have contained asbestos. Although our due
diligence investigations in connection with these acquisitions uncovered the
existence of potential asbestos-related liabilities, the scope of such
liabilities were greater than we had originally estimated. Although we seek to
minimize the impact of underestimated or potential undiscovered liabilities by
structuring acquisitions to minimize liabilities and obtaining indemnities and
warranties from the selling party, these methods may not fully protect us from
the impact of undiscovered liabilities. Indemnities or warranties are often
limited in scope, amount or duration, and may not fully cover the liabilities
for which they were intended. The liabilities that are not covered by the
limited indemnities or warranties could have a material adverse effect on our
business and financial condition.
We
may require additional capital to finance our operating needs and to finance our
growth. If the terms on which the additional capital is available are
unsatisfactory, if the additional capital is not available at all or we are not
able to fully access our existing credit facility, we may not be able to pursue
our growth strategy.
Our
growth strategy will require additional capital investment to complete
acquisitions, integrate the completed acquisitions into our existing operations,
and to expand into new markets.
We intend
to pay for future acquisitions using a combination of cash, capital stock, notes
and assumption of indebtedness. To the extent that we do not generate sufficient
cash internally to provide the capital we require to fund our growth strategy
and future operations, we will require additional debt or equity financing. We
cannot be sure that this additional financing will be available or, if
available, will be on terms acceptable to us. Further, high volatility in the
equity markets and in our stock price may make it difficult for us to access the
equity markets for additional capital at attractive prices, if at all. If we are
unable to obtain sufficient additional capital in the future, it will limit our
ability to implement our business strategy. Continued issues resulting from the
current global economic downturn involving liquidity and capital adequacy
affecting lenders could affect our ability to fully access our existing credit
facilities. In addition, even if future debt financing is available, it may
result in (1) increased interest expense, (2) increased term loan
payments, (3) increased leverage, and (4) decreased income available
to fund further acquisitions and expansion. It may also limit our ability to
withstand competitive pressures and make us more vulnerable to economic
downturns. If future equity financing is available, it may dilute the equity
interests of our existing stockholders.
In
addition, our credit facility agreement includes restrictive covenants which
could limit our financial flexibility. If we do not maintain compliance with
these covenants, our creditors could declare a default. Our ability to comply
with the provisions of our indebtedness may be affected by changes in economic
or business conditions beyond our control.
A
material disruption at any of our manufacturing facilities could adversely
affect our ability to generate sales and meet customer demand.
If
operations at our manufacturing facilities were to be disrupted as a result of
significant equipment failures, natural disasters, power outages, fires,
explosions, terrorism, adverse weather conditions, labor disputes or other
reasons, our financial performance could be adversely affected as a result of
our inability to meet customer demand for our products. Interruptions in
production could increase our costs and reduce our sales. Any interruption in
production capability could require us to make substantial capital expenditures
to remedy the situation, which could negatively affect our profitability and
financial condition. We maintain property damage insurance which we believe to
be adequate to provide for reconstruction of facilities and equipment, as well
as business interruption insurance to mitigate losses resulting from any
production interruption or shutdown caused by an insured loss. However, any
recovery under our insurance policies may not offset the lost sales or increased
costs that may be experienced during the disruption of operations, which could
adversely affect our financial performance.
13
The
loss of key management could have a material adverse effect on our ability to
run our business.
We may be
adversely affected if we lose members of our senior management. We are highly
dependent on our senior management team as a result of their extensive
experience. The loss of key management or the inability to attract, retain and
motivate sufficient numbers of qualified management personnel could have a
material adverse effect on us and our business.
Available
insurance coverage, the number of future asbestos-related claims and the average
settlement value of current and future asbestos-related claims of two of our
subsidiaries could be different than we have estimated, which could materially
and adversely affect our financial condition, results of operations and cash
flow.
Two of
our subsidiaries are each one of many defendants in a large number of lawsuits
that claim personal injury as a result of exposure to asbestos from products
manufactured with components that are alleged to have contained asbestos. Such
components were acquired from third-party suppliers and were not manufactured by
any of our subsidiaries nor were the subsidiaries producers or direct suppliers
of asbestos. For purposes of our financial statements, we have estimated the
future claims exposure and the amount of insurance available based upon certain
assumptions with respect to future claims and liability costs. We estimate the
liability costs to be incurred in resolving pending and forecasted claims for
the next 15-year period.
Our
decision to use a 15-year period is based on our belief that this is the extent
of our ability to forecast liability costs. We also estimate the amount of
insurance proceeds available for such claims based on the current financial
strength of the various insurers, our estimate of the likelihood of payment and
applicable current law. We reevaluate these estimates regularly. Although we
believe our current estimates are reasonable, a change in the time period used
for forecasting our liability costs, the actual number of future claims brought
against us, the cost of resolving these claims, the likelihood of payment by,
and the solvency of, insurers and the amount of remaining insurance available
could be substantially different than our estimates, and future revaluation of
our liabilities and insurance recoverables could result in material adjustments
to these estimates, any of which could materially and adversely affect our
financial condition, results of operations and cash flow. In addition, the
company incurs defense costs related to those claims, a portion of which has
historically been reimbursed by our insurers. We also incur litigation costs in
connection with actions against certain of the subsidiaries’ insurers relating
to insurance coverage. While these costs may be significant, we may not be able
to predict the amount or duration of such costs. Additionally, we may experience
delays in receiving reimbursement from insurers, during which time we may be
required to pay cash for settlement or legal defense costs. Any increase in the
actual number of future claims brought against us, the defense costs of
resolving these claims, the cost of pursuing claims against our insurers, the
likelihood and timing of payment by, and the solvency of, insurers and the
amount of remaining insurance available, could materially and adversely affect
our financial condition, results of operations and cash flow.
Our
international operations are subject to the laws and regulations of the United
States and many foreign countries. Failure to comply with these laws may affect
our ability to conduct business in certain countries and may affect our
financial performance.
We are
subject to a variety of laws regarding our international operations, including
the Foreign Corrupt Practices Act and regulations issued by U.S. Customs and
Border Protection, the Bureau of Industry and Security, and the regulations of
various foreign governmental agencies. We cannot predict the nature, scope or
effect of future regulatory requirements to which our international sales and
manufacturing operations might be subject or the manner in which existing laws
might be administered or interpreted. Future regulations could limit the
countries in which some of our products may be manufactured or sold, or could
restrict our access to, and increase the cost of obtaining, products from
foreign sources. In addition, actual or alleged violations of these laws could
result in enforcement actions and financial penalties that could result in
substantial costs.
14
Our
foreign subsidiaries have done and may continue to do business in countries
subject to U.S. sanctions and embargoes, including Iran and Syria, and we have
limited managerial oversight over those activities. Failure to comply with these
sanctions and embargoes may result in enforcement or other regulatory
actions.
From time
to time, certain of our foreign subsidiaries sell products to companies and
entities located in, or controlled by the governments of, certain countries that
are or have previously been subject to sanctions and embargoes imposed by the
U.S. government and/or the United Nations, such as Iran and Syria. With the
exception of the U.S. sanctions against Cuba, the applicable sanctions and
embargoes generally do not prohibit our foreign subsidiaries from selling
non-U.S.-origin products and services in those countries. However, Colfax
Corporation, its U.S. personnel and its domestic subsidiaries, as well as
employees of our foreign subsidiaries who are U.S. citizens, are prohibited from
participating in, approving or otherwise facilitating any aspect of the business
activities in those countries. These constraints may negatively affect the
financial or operating performance of such business activities. We cannot be
certain that our attempts to comply with U.S. sanction laws and embargoes will
be effective, and as a consequence we may face enforcement or other actions if
our compliance efforts are not effective. Actual or alleged violations of these
laws could result in substantial fines or other sanctions which could result in
substantial costs. In addition, Iran and Syria currently are identified by the
State Department as state sponsors of terrorism, and may be subject to
increasingly restrictive sanctions. Because certain of our foreign subsidiaries
have contact with and transact business in such countries, including sales to
enterprises controlled by agencies of the governments of such countries, our
reputation may suffer due to our association with these countries, which may
have a material adverse effect on the price of our common stock. Further,
certain U.S. states and municipalities have recently enacted legislation
regarding investments by pension funds and other retirement systems in companies
that have business activities or contacts with countries that have been
identified as state sponsors of terrorism and similar legislation may be pending
in other states. As a result, pension funds and other retirement systems may be
subject to reporting requirements with respect to investments in companies such
as ours or may be subject to limits or prohibitions with respect to those
investments that may have a material adverse effect on the price of our
shares.
In
addition, one of our foreign subsidiaries made a small number of sales from 2003
through 2007 totaling approximately $60,000 in the aggregate to two customers in
Cuba which may have been made in violation of regulations of the U.S. Treasury
Department’s Office of Foreign Assets Control, or OFAC. Cuba is also identified
by the U.S. State Department as a state sponsor of terrorism. We have submitted
a disclosure report to OFAC regarding these transactions. On December 5, 2008,
the Company executed a tolling agreement with the OFAC extending the statute of
limitations for the investigation until May 1, 2010. As a result of these sales,
we may be subject to fines or other sanctions.
If
we fail to comply with export control regulations, we could be subject to
substantial fines or other sanctions.
Some of
our products manufactured or assembled in the United States are subject to the
U.S. Export Administration Regulations, administered by the U.S. Department of
Commerce, Bureau of Industry and Security, which require that we obtain an
export license before we can export such products to specified countries.
Additionally, some of our products are subject to the
International Traffic in Arms Regulations, which restrict the export
of certain military or intelligence-related items, technologies
and services to non-U.S. persons. Failure to comply with these laws
could harm our business by subjecting us to sanctions by the U.S. government,
including substantial monetary penalties, denial of export privileges and
debarment from U.S. government contracts.
Approximately 48% of our employees
are represented by foreign trade unions. If the representation committees
responsible for negotiating with these unions on our behalf are unsuccessful in
negotiating new and acceptable agreements when the existing agreements with our
employees covered by the unions expire or if the foreign trade unions chose
not to support our restructuring programs, we could experience business
disruptions or increased costs.
As of
December 31, 2009, we had 1,365 employees in foreign locations. In certain
countries, labor and employment laws are more restrictive than in the U.S. and,
in many cases, grant significant job protection to employees, including rights
on termination of employment. In Germany, Sweden and the Netherlands, by law,
some of our employees are represented by trade unions in these jurisdictions,
which subjects us to employment arrangements very similar to collective
bargaining agreements. If our employees represented by foreign trade unions were
to engage in a strike, work stoppage or other slowdown in the future, we could
experience a significant disruption of our operations. Such disruption could
interfere with our business operations and could lead to decreased productivity,
increased labor costs and lost revenue.
Although
we have not experienced any material recent strikes or work stoppages, we cannot
offer any assurance that the representation committees that negotiate with the
foreign trade unions on our behalf will be successful in negotiating new
collective bargaining agreements or other employment arrangements when the
current ones expire. Furthermore, future labor negotiations could result in
significant increases in our labor costs.
15
Our
manufacturing business is subject to the possibility of product liability
lawsuits, which could harm our business.
In
addition to the asbestos-related liability claims described above, as the
manufacturer of equipment for use in industrial markets, we face an inherent
risk of exposure to other product liability claims. Although we maintain quality
controls and procedures, we cannot be sure that our products will be free from
defects. In addition, some of our products contain components manufactured by
third parties, which may also have defects. We maintain insurance coverage for
product liability claims. Our insurance policies have limits, however, that may
not be sufficient to cover claims made against us. In addition, this insurance
may not continue to be available to us at a reasonable cost. With respect to
components manufactured by third-party suppliers, the contractual
indemnification that we seek from our third-party suppliers may be limited and
thus insufficient to cover claims made against us. If our insurance coverage or
contractual indemnification is insufficient to satisfy product liability claims
made against us, the claims could have an adverse effect on our business and
financial condition. Even claims without merit could harm our reputation, reduce
demand for our products, cause us to incur substantial legal costs and distract
the attention of our management.
As
a manufacturer, we are subject to a variety of environmental and health and
safety laws for which compliance could be costly. In addition, if we fail to
comply with such laws, we could incur liability that could result in penalties
and costs to correct any non-compliance.
Our
business is subject to international, federal, state and local environmental and
safety laws and regulations, including laws and regulations governing emissions
of: regulated air pollutants; discharges of wastewater and storm water; storage
and handling of raw materials; generation, storage, transportation and disposal
of regulated wastes; and worker safety. These requirements impose on our
business certain responsibilities, including the obligation to obtain and
maintain various environmental permits. If we were to fail to comply with these
requirements or fail to obtain or maintain a required permit, we could be
subject to penalties and be required to undertake corrective action measures to
achieve compliance. In addition, if our noncompliance with such regulations were
to result in a release of hazardous materials to the environment, such as soil
or groundwater, we could be required to remediate such contamination, which
could be costly. Moreover, noncompliance could subject us to private claims for
property damage or personal injury based on exposure to hazardous materials or
unsafe working conditions. Changes in applicable requirements or stricter
interpretation of existing requirements may result in costly compliance
requirements or otherwise subject us to future liabilities.
As
the present or former owner or operator of real property, or generator of waste,
we could become subject to liability for environmental contamination, regardless
of whether we caused such contamination.
Under
various federal, state and local laws, regulations and ordinances, and, in some
instances, international laws, relating to the protection of the environment, a
current or former owner or operator of real property may be liable for the cost
to remove or remediate contamination on, under, or released from such property
and for any damage to natural resources resulting from such contamination.
Similarly, a generator of waste can be held responsible for contamination
resulting from the treatment or disposal of such waste at any off-site location
(such as a landfill), regardless of whether the generator arranged for the
treatment or disposal of the waste in compliance with applicable laws. Costs
associated with liability for removal or remediation of contamination or damage
to natural resources could be substantial and liability under these laws may
attach without regard to whether the responsible party knew of, or was
responsible for, the presence of the contaminants. In addition, the liability
may be joint and several. Moreover, the presence of contamination or the failure
to remediate contamination at our properties, or properties for which we are
deemed responsible, may expose us to liability for property damage or personal
injury, or materially adversely affect our ability to sell our real property
interests or to borrow using the real property as collateral. We cannot be sure
that we will not be subject to environmental liabilities in the future as a
result of historic or current operations that have resulted or will result in
contamination.
Failure
to maintain and protect our trademarks, trade names and technology may affect
our operations and financial performance.
The
market for many of our products is, in part, dependent upon the goodwill
engendered by our trademarks and trade names. Trademark protection is therefore
material to a portion of our business. The failure to protect our trademarks and
trade names may have a material adverse effect on our business, financial
condition and operating results. Litigation may be required to enforce our
intellectual property rights, protect our trade secrets or determine the
validity and scope of proprietary rights of others. Any action we take to
protect our intellectual property rights could be costly and could absorb
significant management time and attention. As a result of any such litigation,
we could lose any proprietary rights we have. In addition, it is possible that
others will independently develop technology that will compete with our patented
or unpatented technology. The development of new technologies by competitors
that may compete with our technologies could reduce demand for our products and
affect our financial performance.
16
Some
of our stockholders may exert significant influence over us.
Currently,
two of our stockholders, Mitchell P. Rales and Steven M. Rales, together, and
through an entity wholly owned by them, hold approximately 42% of our
outstanding common stock. The level of ownership of these stockholders, and the
service of Mitchell Rales as chairman of our board of directors, enables them to
exert significant influence over all matters involving us, including matters
presented to our stockholders for approval, such as election and removal of our
directors and change of control transactions. This concentration of ownership
and voting power may also have the effect of delaying or preventing a change in
control of our company and could prevent stockholders from receiving a premium
over the market price if a change in control is proposed. The interests of these
persons may not coincide with the interests of the other holders of our common
stock with respect to our operations or strategy.
The
market price of our common stock may experience a high level of
volatility.
The
market price for our common stock has experienced a high level of volatility and
may continue to do so in the future. During the period from our initial public
offering (IPO) to December 31, 2009, our common stock traded between $5.33 and
$28.35 per share. At any given time, you may not be able to sell your shares at
a price that you think is acceptable. The market liquidity for our stock is
relatively low. As of December 31, 2009, we had 43,229,104 shares of common
stock outstanding. The average daily trading volume in our common stock during
the period from January 1, 2009 to December 31, 2009 was approximately 210,000
shares. Although a more active trading market may develop in the future, the
limited market liquidity for our stock may affect your ability to sell at a
price that is satisfactory to you. Stock markets in general have experienced
extreme volatility that has often been unrelated to the operating performance of
a particular company. These broad fluctuations may adversely affect the trading
price of our common stock, regardless of our operating performance.
Provisions
in our charter documents and Delaware law may delay or prevent an acquisition of
our company, which could decrease the value of your shares.
Our
amended and restated certificate of incorporation, amended and restated bylaws,
and Delaware law contain provisions that may make it difficult for a third-party
to acquire us without the consent of our board of directors. These provisions
include prohibiting stockholders from taking action by written consent,
prohibiting special meetings of stockholders called by stockholders and
prohibiting stockholder nominations and approvals without complying with
specific advance notice requirements. In addition, our board of directors has
the right to issue preferred stock without stockholder approval, which our board
of directors could use to effect a rights plan or “poison pill” that could
dilute the stock ownership of a potential hostile acquirer and may have the
effect of delaying, discouraging or preventing an acquisition of our company.
Delaware law also imposes some restrictions on mergers and other business
combinations between us and any holder of 15% or more of our outstanding voting
stock. Although Mitchell Rales and Steven Rales, both individually and in the
aggregate, hold more than 15% of our outstanding voting stock, this provision of
Delaware law does not apply to them.
There
may be limitations on our ability to fully utilize our net operating loss
carryforwards and other U.S. deferred tax assets in future periods.
If the
recent global economic decline persists for a prolonged period of time, we may
not be able to generate sufficient future U.S. taxable income to utilize our
U.S. net operating loss carryforwards (NOLs) and/or other net U.S. deferred tax
assets. Our net U.S. deferred tax assets, including U.S. NOLs and net of
valuation allowances, are $54.4 million as of December 31, 2009. If sufficient
future taxable income and/or available tax planning strategies are not available
to utilize some or all of these deferred tax assets, additional valuation
allowances may be recorded which would negatively affect our results of
operations.
17
In
addition, we believe we experienced an “ownership change” within the meaning of
Section 382 of the Internal Revenue Code of 1986, as amended, as a result of our
May 2008 IPO. Our ability to use our NOLs existing at the time of the ownership
change to offset any taxable income generated in taxable periods after the
ownership change is subject to an annual limitation. The amount of NOLs that we
may utilize on an annual basis under Section 382 would generally be equal to the
product of the value of our outstanding stock immediately prior to the ownership
change (less certain capital contributions during the preceding two years) and
the “long term tax exempt rate” which was 4.71% for May 2008. The amount of NOLs
existing as of the time of the ownership change is estimated to be $65.3 million
and will begin to expire in 2021.
Our
results of operations could vary as a result of the methods, estimates and
judgments we use in applying our accounting policies.
The
methods, estimates and judgments we use in applying our accounting policies have
a significant impact on our results of operations (see “Critical Accounting
Policies and Estimates” in Part II, Item 7 of this Form 10-K). Such
methods, estimates and judgments are, by their nature, subject to substantial
risks, uncertainties and assumptions, and factors may arise over time that lead
us to change our methods, estimates and judgments. Changes in those methods,
estimates and judgments could significantly affect our results of
operations.
Any
impairment in the value of our intangible assets, including goodwill, would
negatively affect our operating results and total capitalization.
Our total
assets reflect substantial intangible assets, primarily goodwill. The goodwill
results from our acquisitions, representing the excess of cost over the fair
value of the net assets we have acquired. We assess at least annually whether
there has been impairment in the value of our intangible assets. If future
operating performance at one or more of our business units were to fall
significantly below current levels, if competing or alternative technologies
emerge, or if market conditions for businesses acquired declines, we could
incur, under current applicable accounting rules, a non-cash charge to operating
earnings for goodwill impairment. Any determination requiring the write-off of a
significant portion of unamortized intangible assets would negatively affect our
results of operations and total capitalization, the effect of which could be
material.
Our
defined benefit pension plans are subject to financial market risks that could
adversely affect our operating results, financial condition and cash
flow.
Our
defined benefit pension plan obligations are affected by changes in market
interest rates and the majority of plan assets are invested in publicly traded
debt and equity securities, which are affected by market risks. Significant
changes in market interest rates, decreases in the fair value of plan assets and
investment losses or lack of expected investment gains on plan assets may
adversely impact our future operating results, financial condition and cash
flow.
We have identified
a material weakness in our internal control over financial reporting. If our
internal controls are not effective, investors could lose confidence in our
financial reporting.
Our
management had previously concluded that our internal control over financial
reporting was effective as of December 31, 2009. In connection with the
restatement to correct our financial statements for the effects of an
overstatement of our pension liability, discussed in Note 2 to the
consolidated financial statements included in Part II of this report,
management determined a material weakness in internal control over financial
reporting existed as of December 31, 2009. Accordingly, management has now
concluded that our internal control over financial reporting was not effective
as of December 31, 2009. Also, as described in “Part II—Item 9A.
Controls and Procedures” of this report, our Chief Executive Officer and Chief
Financial Officer concluded that our disclosure controls and procedures were not
effective as of December 31, 2009.
Subsequent
to the period covered by this report, management has implemented measures to
remediate the material weakness set forth above. Specifically, we have
implemented procedures to enhance review of participant data for benefit plans.
As part of the Company’s 2010 assessment of internal control over financial
reporting, management will conduct sufficient testing and evaluation of the
implemented controls to ascertain whether they are designed and operating
effectively. We believe the implemented controls will remediate the above
identified material weakness.
Although
we believe we have taken appropriate actions to remediate the material weakness
discussed above, we cannot assure you that we will not discover other material
weaknesses in the future. Any failure to maintain or implement required new or
improved controls, or any difficulties we encounter in implementation, could
cause us to fail to meet our periodic reporting obligations or result in
material misstatements in our financial statements. In addition, substantial
costs and resources may be required to rectify any internal control
deficiencies. If we cannot produce reliable financial reports, investors could
lose confidence in our reported financial information, the market price of our
common stock could decline significantly, and our business and financial
condition could be harmed.
18
|
ITEM 1B.
|
UNRESOLVED
STAFF COMMENTS
|
None
|
ITEM 2.
|
PROPERTIES
|
We have
14 principal production facilities in seven countries. The following table lists
our primary facilities at December 31, 2009, indicating the location, square
footage, whether the facilities are owned or leased, and principal
use.
|
Location
|
Sq.
Footage
|
Owned/Leased
|
Principal
Use
|
|||
|
Richmond,
Virginia
|
|
10,200
|
|
Leased
|
|
Corporate headquarters
|
|
Hamilton,
New Jersey
|
|
2,200
|
|
Leased
|
|
Subsidiary headquarters
|
|
Columbia,
Kentucky
|
|
75,000
|
|
Owned
|
|
Production
|
|
Warren,
Massachusetts
|
|
147,000
|
|
Owned
|
|
Production
|
|
Monroe,
North Carolina
|
|
170,000
|
|
Owned
|
|
Production
|
|
Houston,
Texas
|
|
25,000
|
|
Leased
|
|
Production
|
|
Portland,
Maine
|
|
61,000
|
|
Leased
|
|
Production
|
|
Tours,
France
|
|
33,000
|
|
Leased
|
|
Production
|
|
Bottrop,
Germany
|
|
55,000
|
|
Owned
|
|
Production
|
|
Gottmadingen,
Germany
|
|
38,000
|
|
Leased
|
|
Production
|
|
Radolfzell,
Germany
|
|
350,000
|
|
Owned
|
|
Production
|
|
Utrecht,
Netherlands
|
|
50,000
|
|
Owned
|
|
Production
|
|
Stockholm,
Sweden
|
|
130,000
|
|
Owned
|
|
Production
|
|
Daman,
India
|
|
32,000
|
|
Owned
|
|
Production
|
|
Vapi,
India
|
|
16,000
|
|
Leased
|
|
Production
|
|
Wuxi,
China
|
|
60,000
|
|
Leased
|
|
Production
|
|
ITEM 3.
|
LEGAL
PROCEEDINGS
|
Discussion
of legal matters is incorporated by reference to Part II, Item 8, Note 19,
“Commitments and Contingencies,” in the Notes to the Consolidated Financial
Statements.
|
ITEM 4.
|
SUBMISSION
OF MATTERS TO A VOTE OF SECURITY
HOLDERS
|
No
matters were submitted to a vote of security holders during the fourth quarter
of 2009.
EXECUTIVE
OFFICERS OF THE REGISTRANT
Set forth
below are the names, ages, positions and experience of our executive officers.
All of our executive officers hold office at the pleasure of our Board of
Directors.
|
Name
|
|
Age
|
|
Position
|
|
Clay
H. Kiefaber
|
|
54
|
|
President
and Chief Executive Officer and Director
|
|
Mario
E. DiDomenico
|
|
58
|
|
Senior
Vice President, General Manager—Engineered Solutions
|
|
G.
Scott Faison
|
|
48
|
|
Senior
Vice President, Finance and Chief Financial Officer
|
|
Dr. Michael
Matros
|
|
44
|
|
Senior
Vice President, General Manager—Allweiler
|
|
Joseph
B. Niemann
|
|
48
|
|
Senior
Vice President, Marketing and Strategic Planning
|
|
Thomas
M. O’Brien
|
|
59
|
|
Senior
Vice President, General Counsel and Secretary
|
|
William
E. Roller
|
|
47
|
|
Senior
Vice President, General Manager—Americas
|
|
Steven
W. Weidenmuller
|
|
46
|
|
Senior
Vice President, Human
Resources
|
Clay H. Kiefaber became the
President and Chief Executive Officer in January 2010. Mr. Kiefaber has
served on the Colfax Board of Directors since the Company’s IPO in 2008.
Before joining Colfax in January 2010, he spent nearly 20 years in increasingly
senior executive positions at Masco Corporation (“Masco”). Most recently,
he was a Group President from 2006 to 2007, where he was responsible for a $2.8
billion group of building construction components. Prior to becoming a Group
President at Masco, Mr. Kiefaber was Group Vice President of Masco Builder
Cabinet Group. He previously spent 14 years in increasingly senior
positions in Masco’s Merillat Industries subsidiary.
19
Mario E. DiDomenico joined
our company in 1998 with the acquisition of Imo. Since that time he has served
as the Manager of Operations for Warren Pump, Vice President—2 Screw Pumps and
subsequently as Senior Vice President, General Manager—Engineered Solutions,
which also includes Portland Valve, Fairmount and Tushaco following the
acquisitions of those businesses.
G. Scott Faison has been the
Senior Vice President, Finance and Chief Financial Officer since January
2005.
Dr. Michael Matros
joined Allweiler in 1996 as a project manager in Research and Development.
From 1996 until 2006, Dr. Matros has held several positions at Allweiler
with increasing responsibilities, including Director of Research and
Development and the Plant Manager of our Allweiler facility in Radolfzell,
Germany. In April 2006, Dr. Matros was appointed to his current position as
Senior Vice President, General Manager—Allweiler. In November 2006, Dr. Matros
was appointed as a member of the management board at our German subsidiary,
Allweiler AG.
Joseph B. Niemann joined us
in 2006 as Senior Vice President of Marketing and Strategic Planning. Prior
to joining our company, Mr. Niemann was Vice President,
Marketing & eBusiness of Emerson Climate Technologies, a subsidiary of
Emerson Electric Company, where he was employed from 1990 to 2005.
Thomas M. O’Brien has served
as our Senior Vice President, General Counsel and Secretary since January
1998.
William E. Roller has served
as our Senior Vice President, General Manager—Americas since June 1999. Colfax
Americas includes Imo as well as Zenith and LSC following the acquisitions of
those businesses.
Steven W. Weidenmuller has
served as Senior Vice President, Human Resources since 2002.
PART
II
|
ITEM 5.
|
MARKET
FOR THE REGISTRANT'S COMMON EQUITY, RELATED STOCKHOLDER MATTERS AND ISSUER
PURCHASES OF EQUITY SECURITIES
|
Our
common stock began trading on the New York Stock Exchange under the symbol CFX
on May 8, 2008. As of January 31, 2010, there were approximately 7,300 holders
of record of our common stock. The high and low sales prices per share of our
common stock, as reported on the New York Stock Exchange, for the fiscal periods
presented are as follows:
|
2009
|
2008
|
|||||||||||||||
|
High
|
Low
|
High
|
Low
|
|||||||||||||
|
First
Quarter
|
$ | 13.22 | $ | 5.33 | N/A | N/A | ||||||||||
|
Second
Quarter
|
$ | 9.48 | $ | 6.05 | $ | 25.76 | $ | 20.01 | ||||||||
|
Third
Quarter
|
$ | 12.66 | $ | 7.21 | $ | 28.35 | $ | 14.73 | ||||||||
|
Fourth
Quarter
|
$ | 13.91 | $ | 10.22 | $ | 18.16 | $ | 5.58 | ||||||||
We have
not paid any dividends on our common stock since inception, and we do not
anticipate the declaration or payment of dividends at any time in the
foreseeable future. Our credit agreement limits the amount of cash dividends and
common stock repurchases the Company may make to a total of $10 million
annually.
20
Performance
Graph
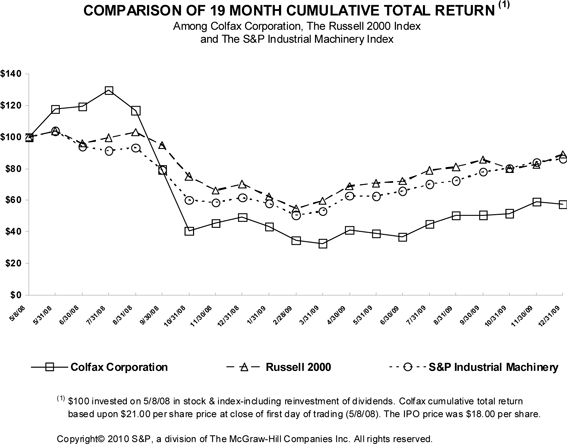
Issuer
Purchase of Equity Securities
On
November 4, 2008, the Company’s board of directors authorized the repurchase of
up to $20 million (up to $10 million per year in 2008 and 2009) of the Company’s
common stock on the open market or in privately negotiated transactions. The
repurchase program was to be conducted pursuant to SEC Rule 10b5-1. The timing
and amount of shares repurchased was determined by the Share Repurchase
Committee, constituting three members of the Company’s board of directors, based
on its evaluation of market conditions and other factors. There were no common
stock repurchases during 2009.
21
|
ITEM 6.
|
SELECTED
FINANCIAL DATA
|
(in
thousands, except per share information)
|
Year ended December 31,
|
||||||||||||||||||||
|
2009
Restated
|
2008
Restated
|
2007
Restated
|
2006
Restated
|
2005
Restated
|
||||||||||||||||
|
Statement
of Operations Data:
|
||||||||||||||||||||
|
Net
sales
|
$ | 525,024 | $ | 604,854 | $ | 506,305 | $ | 393,604 | $ | 345,478 | ||||||||||
|
Cost
of sales
|
339,237 | 387,667 | 330,714 | 256,806 | 222,353 | |||||||||||||||
|
Gross
profit
|
185,787 | 217,187 | 175,591 | 136,798 | 123,125 | |||||||||||||||
|
Initial
public offering-related costs
|
- | 57,017 | - | - | - | |||||||||||||||
|
Selling,
general and administrative expenses
|
112,503 | 124,105 | 97,426 | 78,964 | 73,542 | |||||||||||||||
|
Research
and development expenses
|
5,930 | 5,856 | 4,162 | 3,336 | 2,855 | |||||||||||||||
|
Restructuring
and other related charges
|
18,175 | - | - | - | - | |||||||||||||||
|
Asbestos
liability and defense (income) costs
|
(2,193 | ) | (4,771 | ) | (63,978 | ) | 21,783 | 14,272 | ||||||||||||
|
Asbestos
coverage litigation expenses
|
11,742 | 17,162 | 13,632 | 12,033 | 3,840 | |||||||||||||||
|
Operating
income
|
39,630 | 17,818 | 124,349 | 20,682 | 28,616 | |||||||||||||||
|
Interest
expense
|
7,212 | 11,822 | 19,246 | 14,186 | 9,026 | |||||||||||||||
|
Provision
for income taxes
|
8,621 | 5,465 | 39,457 | 4,298 | 6,666 | |||||||||||||||
|
Income
from continuing operations
|
23,797 | 531 | 65,646 | 2,198 | 12,924 | |||||||||||||||
|
Net
income
(1)
|
$ | 23,797 | $ | 531 | $ | 65,646 | $ | 801 | $ | 13,540 | ||||||||||
|
Net
income (loss) per share from continuing operations — basic and
diluted
|
$ | 0.55 | $ | (0.08 | ) | $ | 1.82 | $ | 0.10 | $ | (0.03 | ) | ||||||||
|
December 31,
|
||||||||||||||||||||
|
2009
Restated
|
2008
Restated
|
2007
Restated
|
2006
Restated
|
2005
Restated
|
||||||||||||||||
|
Balance
Sheet Data:
|
||||||||||||||||||||
|
Cash
and cash equivalents
|
$ | 49,963 | $ | 28,762 | $ | 48,093 | $ | 7,608 | $ | 7,821 | ||||||||||
|
Goodwill
and intangibles, net
|
175,370 | 175,210 | 181,517 | 150,395 | 145,957 | |||||||||||||||
|
Asbestos
insurance asset, including current portion
|
389,449 | 304,015 | 305,228 | 297,106 | 261,941 | |||||||||||||||
|
Total
assets
|
999,401 | 907,550 | 899,522 | 792,018 | 696,738 | |||||||||||||||
|
Asbestos
liability, including current portion
|
443,769 | 357,258 | 376,233 | 388,920 | 338,535 | |||||||||||||||
|
Total
debt, including current portion (2)
|
91,485 | 97,121 | 206,493 | 188,720 | 158,454 | |||||||||||||||
|
(1)
|
Includes
net (loss) income from discontinued operations of $(1.4) million and $0.6
million in the years ended December 31, 2006 and 2005,
respectively.
|
|
(2)
|
See
Note 13 to our Consolidated Financial Statements for information regarding
the refinancing of the Company’s debt in conjunction with the IPO in May
2008.
|
We
completed the acquisitions of PD-Technik in 2009, Fairmount and LSC in 2007 and
Tushaco in 2005. See Item 1. Business and Note 5 to our Consolidated Financial
Statements for further information.
22
|
ITEM 7.
|
MANAGEMENT’S
DISCUSSION AND ANALYSIS OF FINANCIAL CONDITION AND RESULTS OF
OPERATIONS
|
Management’s
Discussion and Analysis of Financial Condition and Results of Operations
(MD&A) is designed to provide a reader of the Company’s financial statements
with a narrative from the perspective of Company management. The Company’s
MD&A is divided into four main sections:
|
|
•
|
Overview
|
|
|
|
|
|
•
|
Results
of Operations
|
|
|
|
|
|
•
|
Liquidity
and Capital Resources
|
|
|
|
|
|
•
|
Critical
Accounting Policies
|
The
following discussion of our financial condition and results of operations should
be read together with “Selected Financial and Data,” “Risk Factors” and the
financial statements and related notes included elsewhere in this Form 10-K/A.
The following discussion includes forward-looking statements. For a discussion
of important factors that could cause actual results to differ materially from
the results referred to in the forward-looking statements, see “Special Note
Regarding Forward-Looking Statements.”
The
following discussion gives effect to the restatement of the Company's
consolidated financial statements as discussed in Note 2 to the Company's
consolidated financial statements in Part II, Item 8.
Overview
Colfax
Corporation is a global supplier of a broad range of fluid handling products,
including pumps, fluid handling systems and controls, and specialty valves. We
believe that we are a leading manufacturer of rotary positive displacement
pumps, which include screw pumps, gear pumps and progressive cavity pumps. We
design and engineer our products to high quality and reliability standards for
use in critical fluid handling applications where performance is paramount. We
also offer customized fluid handling solutions to meet individual customer needs
based on our in-depth technical knowledge of the applications in which our
products are used.
Our
products are marketed principally under the Allweiler, Fairmount, Houttuin, Imo,
LSC, Portland Valve, Tushaco, Warren and Zenith brand names. We believe
that our brands are widely known and have a premium position in our industry.
Allweiler, Houttuin, Imo and Warren are among the oldest and most recognized
brands in the markets in which we participate, with Allweiler dating back to
1860. We have a global manufacturing footprint, with production facilities in
Europe, North America and Asia, as well as worldwide sales and distribution
channels.
We employ
a comprehensive set of tools that we refer to as the Colfax Business System, or
CBS. CBS is a disciplined strategic planning and execution methodology designed
to achieve excellence and world-class financial performance in all aspects of
our business by focusing on the Voice of the Customer and
continuously improving quality, delivery and cost. Modeled on the Danaher
Business System, CBS focuses on conducting root-cause analysis, developing
process improvements and implementing sustainable systems. Our approach
addresses the entire business, not just manufacturing operations.
We
currently serve markets that have a need for highly engineered, critical fluid
handling solutions and are global in scope. Our strategic markets
include:
|
Strategic
Markets
|
|
Applications
|
|
Commercial
Marine
|
|
Fuel
oil transfer; oil transport; water and wastewater handling; cargo
handling
|
|
Oil
and Gas
|
|
Crude
oil gathering; pipeline services; unloading and loading; rotating
equipment lubrication; lube oil purification
|
|
Power
Generation
|
|
Fuel
unloading, transfer, burner and injection; rotating equipment
lubrication
|
|
Global
Navy
|
|
Fuel
oil transfer; oil transport; water and wastewater handling; firefighting;
fluid control
|
|
General
Industrial
|
|
Machinery
lubrication; hydraulic elevators; chemical processing; pulp and paper
processing; food and beverage
processing
|
We serve
a global customer base across multiple markets through a combination of direct
sales and marketing associates and third-party distribution channels. Our
customer base is highly diversified and includes commercial, industrial and
government customers.
23
Our
business began in 1995 with the intention to acquire, manage and create a
world-class industrial manufacturing company. We seek to acquire businesses
with leading market positions and brands that exhibit strong cash flow
generation potential. With our management expertise and the introduction of CBS
into our acquired businesses, we pursue growth in revenues and improvements in
operating margins.
Outlook
We
believe that we are well positioned to grow our business organically over the
long term by enhancing our product offerings and expanding our customer base in
our strategic markets. The current global economic downturn had a significant
impact on our sales and operating profit in 2009 when compared to 2008. Our
order rates declined significantly in 2009 and if current economic conditions
continue, our business results will continue to be negatively affected. In
addition, we have had project delivery push-outs as well as order cancellations
that may continue in 2010. We will continue to monitor general global economic
conditions and expect the following market conditions:
|
|
•
|
In
the commercial marine industry, we expect international trade and demand
for crude oil and other commodities as well as the age of the global
merchant fleet to continue to create demand for new ship construction over
the long term. We also believe the increase in the size of the global
fleet will create an opportunity to supply aftermarket parts and service.
In addition, we believe pending and future environmental regulations will
enhance the demand for our products. Based on the decline in orders in
2009 and our current backlog, we expect sales to decline in 2010 from 2009
levels. We are also likely to have additional order cancellations as well
as delivery date extensions in the near
term.
|
|
|
•
|
In
the crude oil industry, we expect long term activity to remain favorable
as capacity constraints and global demand drive further development of
heavy oil fields. In pipeline applications, we expect demand for our
highly efficient products to remain strong as our customers continue to
focus on total cost of ownership. In refinery applications, a reduction in
capital investment by our customers due to recent weak economic conditions
and volatile oil prices has been negatively impacting sales and orders.
Projects that were delayed in 2009 are being restarted and we expect sales
to be at levels in 2010, while we expect growth in
orders.
|
|
|
•
|
In
the power generation industry, we expect activity in Asia and the Middle
East to remain solid as economic growth and fundamental undersupply of
power generation capacity continue to drive investment in energy
infrastructure projects. In the world’s developed economies, we expect
efficiency improvements will continue to drive demand. In 2010, we expect
both sales and orders to be at similar levels versus
2009.
|
|
|
•
|
In
the U.S., we expect Congress to continue to appropriate funds for new ship
construction as older naval vessels are decommissioned. We also
expect increased demand for integrated fluid handling systems for both new
ship platforms and existing ship classes that reduce operating costs and
improve efficiency as the U.S. Navy seeks to man vessels with fewer
personnel. Outside of the U.S., we expect other sovereign nations will
continue to expand their fleets as they address national security
concerns. We expect modest growth in sales during 2010 and expect orders
to decline as a result of the significant growth in orders in 2009 and the
timing of projects.
|
|
|
•
|
In
the general industrial market, we expect long-term demand to be driven by
capital investment. While this market is very diverse, orders in 2009
declined compared to 2008 in all submarkets and most significantly in the
chemical, distribution, machinery support and building products markets
and in portions of the general industrial market, primarily in Europe and
North America. We expect growth in both orders and sales in
2010.
|
Our
global manufacturing sales and distribution network allows us to target fast
growing regions throughout the world. We have production and distribution
facilities in India and China and opened a Middle East sales and engineering
office in Bahrain in 2009. We intend to leverage these investments to grow our
market share in these emerging markets and plan to continue to invest in sales
and marketing resources to increase our overall coverage.
We will
also continue to target aftermarket opportunities in our strategic markets as we
generally are able to generate higher margins on aftermarket parts and service
than on foremarket opportunities. For the year ended December 31, 2009,
aftermarket sales and services represented approximately 24% of our
revenues.
24
We also
expect to continue to grow as a result of strategic acquisitions. We believe
that the extensive experience of our management team in acquiring and
effectively integrating acquisition targets should enable us to capitalize on
opportunities in the future.
Based on
declining orders and our culture of continuous improvement, we initiated a
series of restructuring actions during 2009 to better position the Company’s
cost structure for future periods. We continue to monitor order rates and will
adjust our manufacturing capacity and cost structure as demand
warrants.
Results
of Operations
Key
Performance Measures
The
discussion of our results of operations that follows focuses on some of the key
financial measures that we use to evaluate our business. We evaluate our
business using several measures, including net sales, orders and order backlog.
Our sales, orders and backlog are affected by many factors, particularly the
impact of acquisitions, the impact of fluctuating foreign exchange rates and
change from our existing businesses which may be driven by market conditions and
other factors. To facilitate the comparison between reporting periods, we
describe the impact of each of these three factors, to the extent they impact
the periods presented, on our sales, orders and backlog in tabular format under
the heading “Sales and Orders.”
Orders
and order backlog are highly indicative of our future revenue and thus are key
measures of anticipated performance. Orders consist of contracts for products or
services from our customers, net of cancellations. Order backlog consists of
unfilled orders.
Items
Affecting the Comparability of Our Reported Results
Our
financial performance and growth are driven by many factors, principally our
ability to serve increasingly global markets, fluctuations in the relationship
of foreign currencies to the U.S. dollar, the general economic conditions within
our five strategic markets, the global economy and capital spending levels, the
availability of capital, our estimates concerning the availability of insurance
proceeds to cover asbestos litigation expenses and liabilities, the amounts of
asbestos litigation expenses and liabilities, the impact of restructuring
initiatives, our ability to pass through cost increases through pricing, the
impact of sales mix, and our ability to continue to grow through acquisitions.
These key factors have impacted our results of operations in the past and are
likely to affect them in the future.
Global
Operations
Our
products and services are available worldwide. The manner in which our products
and services are sold differs by region. Most of our sales in non-U.S. markets
are made by subsidiaries located outside the United States, though we also sell
into non-U.S. markets through various representatives and distributors and
directly from the U.S. In countries with low sales volumes, we generally sell
through representatives and distributors. For the year ended December 31, 2009,
approximately 76% of our sales were shipped to locations outside of the U.S.
Accordingly, we are affected by levels of industrial activity and economic and
political factors in countries throughout the world. Our ability to grow and our
financial performance will be affected by our ability to address a variety of
challenges and opportunities that are a consequence of our global operations,
including efficiently utilizing our global sales, manufacturing and distribution
capabilities, the expansion of market opportunities in Asia, successfully
completing global strategic acquisitions, and engineering innovative new product
applications for end users in a variety of geographic markets. However, we
believe that our geographic, end market and product diversification may limit
the impact that any one country or economy could have on our consolidated
results.
Foreign Currency
Fluctuations
A
significant portion of our sales, approximately 66% for the year ended December
31, 2009, are derived from operations outside the U.S., with the majority of
those sales denominated in currencies other than the U.S. dollar, especially the
Euro and the Swedish Krona. Because much of our manufacturing and employee costs
are outside the U.S., a significant portion of our costs are also denominated in
currencies other than the U.S. dollar. Changes in foreign exchange rates can
impact our results and are quantified when significant in our discussion of our
operations.
25
Economic Conditions in
Strategic Markets
Our
organic growth and profitability strategy focuses on five strategic markets:
commercial marine, oil and gas, power generation, global navy and general
industrial. Demand for our products depends on the level of new capital
investment and planned maintenance by our customers. The level of capital
expenditures depends, in turn, on the general economic conditions within that
market as well as access to capital at reasonable cost. While demand within each
of these strategic markets can be cyclical, the diversity of these markets may
limit the impact of a downturn in any one of these markets on our consolidated
results.
Pricing
We
believe our customers place a premium on quality, reliability, availability,
design and application engineering support. Our highly engineered fluid handling
products typically have higher margins than products with commodity-like
qualities. However, we are sensitive to price movements in our raw materials
supply base. Our largest material purchases are for components and raw materials
consisting of steel, iron, copper and aluminum. Historically, we have been
generally successful in passing raw material price increases on to our
customers. While we seek to take actions to manage this risk, including
commodity hedging where appropriate, such increased costs may adversely impact
earnings.
Sales and Cost
Mix
Our
profit margins vary in relation to the relative mix of many factors, including
the type of product, the geographic location in which the product is
manufactured, the end market for which the product is designed, and the
percentage of total revenue represented by aftermarket sales and services.
Aftermarket business, including spare parts and other value added services, is
generally a higher margin business and is a significant component of our
profitability.
Strategic
Acquisitions
We
complement our organic growth with strategic acquisitions. Acquisitions can
significantly affect our reported results and can complicate period to period
comparisons of results. As a consequence, we report the change in our sales
between periods both from existing and acquired businesses. We intend to
continue to pursue acquisitions of complementary businesses that will broaden
our product portfolio, expand our geographic footprint or enhance our position
within our strategic markets.
On
January 31, 2007, we completed the acquisition of Lubrication Systems
Company of Texas (“LSC”), a manufacturer of fluid handling systems, including
oil mist lubrication and oil purification systems. LSC strengthens our presence
in the oil and gas end market, particularly in the downstream refinery segment,
broadens our overall lubrication portfolio, and presents the opportunity to
expand its product application to other markets.
On
November 29, 2007, we acquired Fairmount Automation, Inc. (“Fairmount”), an
original equipment manufacturer of mission critical programmable automation
controllers in fluid handling applications primarily for the U.S. Navy. In
addition to strengthening our existing position with the U.S. Navy, we intend to
leverage Fairmount’s experienced engineering talent and technology expertise to
develop a portfolio of fluid handling solutions with diagnostic and prognostic
capabilities for industrial applications.
On August
31, 2009, we completed the acquisition of PD-Technik Ingenieurbüro GmbH
(“PD-Technik”), a provider of marine aftermarket related products and services
located in Hamburg, Germany. The acquisition of PD-Technik supports our marine
aftermarket growth initiatives, broadening our served market as well as service
capabilities.
Restructuring and Other
Related Charges
We
initiated a series of restructuring actions during 2009 to better position the
Company’s cost structure for future periods. As a result, the Company recorded
pre-tax restructuring and other related costs of $18.2 million for the year
ended December 31, 2009. As of December 31, 2009, we have reduced our
company-wide workforce by 328 associates from December 31, 2008. Additionally,
during 2009, approximately 630 associates participated in a German
government-sponsored furlough program in which the government pays the
wage-related costs for the portion of the work week the associate is not
working. Our agreement with the German works council allowing participation in
the furlough program ends in February 2011. During 2009, we closed a repair
facility in Aberdeen, NC and a production facility in Sanford, NC and moved the
operations to two of our other facilities. We realized savings of approximately
$17 million in 2009 from our restructuring activities implemented in 2009 and
expect annualized savings of approximately $29 million in 2010. We continue to
monitor our order rates and will adjust our manufacturing capacity and cost
structure as demand warrants.
26
IPO-related
Costs
Results
for the year ended December 31, 2008 include $57.0 million of nonrecurring costs
associated with our IPO during the second quarter. This amount includes $10.0
million of share-based compensation and $27.8 million of special cash bonuses
paid under previously adopted executive compensation plans as well as $2.8
million of employer payroll taxes and other related costs. It also includes
$11.8 million to reimburse the selling stockholders for the underwriting
discount on the shares sold by them as well as the write-off of $4.6 million of
deferred loan costs associated with the early termination of a credit
facility.
Legacy Legal
Adjustment
Selling,
general and administrative expenses for the year ended December 31, 2008 include
a $4.1 million increase to legal reserves related to a non-asbestos
legal matter that arose from the sale and subsequent repair of
a product by a division of a subsidiary that was divested prior to our
acquisition of the subsidiary. This legacy legal case was settled during
the third quarter of 2008.
Asbestos Liability and
Defense Income
Our
financial results have been, and will likely in the future be, affected by our
asbestos liabilities and the availability of insurance to cover these
liabilities and defense costs related to asbestos personal injury litigation
against two of our subsidiaries, as well as costs arising from our legal action
against our insurers. Assessing asbestos liabilities and insurance assets
requires judgments concerning matters such as the uncertainty of litigation,
anticipated outcome of settlements, the number and cost of pending and future
claims, the outcome of legal action against our insurance carriers, and their
continued solvency. For a further discussion of these estimates and how they may
affect our future results, see “—Critical Accounting Estimates—Asbestos
Liabilities and Insurance Assets.”
Asbestos
liability and defense income is comprised of projected indemnity cost, changes
in the projected asbestos liability, changes in the probable insurance recovery
of the projected asbestos-related liability, changes in the probable recovery of
asbestos liability and defense costs paid in prior periods, and actual defense
costs expensed in the period.
The table
below presents asbestos liability and defense income for the periods
indicated:
|
Year
ended December 31,
|
||||||||||||
|
(Amounts
in millions)
|
2009
|
2008
|
2007
|
|||||||||
|
Asbestos
liability and defense (income)
|
$ | (2.2 | ) | $ | (4.8 | ) | $ | (63.9 | ) | |||
Asbestos
liability and defense income was $2.2 million for the year ended December 31,
2009 compared to $4.8 million for the year ended December 31, 2008. The decrease
in asbestos liability and defense income relates primarily to the favorable
effect of one-time items in 2008 exceeding the favorable net effect of one-time
items in 2009. One-time items in 2008 included a $7.0 million gain resulting
from resolution of a coverage dispute with a primary insurer concerning certain
pre-1966 insurance policies, as well as a $2.3 million gain from a change in
estimate of our future asset recovery percentage for one subsidiary. One-time
adjustments in 2009 include a $19.4 million gain as a result of favorable court
rulings in October and December 2009 concerning allocation methodology offset by
an $11.6 million charge to increase the Company’s asbestos-related liabilities
as a result of an analysis of claims data.
Asbestos
liability and defense income was $4.8 million for the year ended December 31,
2008 compared to $63.9 million for the year ended December 31, 2007. The
decrease in asbestos liability and defense income relates primarily to income
recognized in the year ended December 31, 2007 based upon a reevaluation of our
insurance asset from an expected recovery percentage of 75% to 87.5% for one of
our subsidiaries and from recording a receivable from insurers for past costs
paid by us. We were able to reevaluate the insurance asset in 2007 because of a
series of favorable court rulings which determined the proper insurance
allocation methodology, interpreted policy provisions related to deductibles and
number of occurrences, and that New Jersey state law applied.
27
Asbestos Coverage Litigation
Expense
Asbestos
coverage litigation expenses include legal costs related to the actions against
two of our subsidiaries respective insurers and a former parent company of one
of the subsidiaries.
The table
below presents coverage litigation expenses for the periods
indicated:
|
Year
ended December 31,
|
||||||||||||
|
(Amounts
in millions)
|
2009
|
2008
|
2007
|
|||||||||
|
Asbestos
coverage litigation expenses
|
$ | 11.7 | $ | 17.2 | $ | 13.6 | ||||||
Legal
costs related to the subsidiaries’ action against their asbestos insurers were
$11.7 million for the year ended December 31, 2009 compared to $17.2 million for
the year ended December 31, 2008. Legal costs for the year ended December 31,
2008 were higher than 2009 and 2007 primarily due to trial preparation in the
fourth quarter of 2008 by one of our subsidiaries against a number of its
insurers and former parent. The trial had been expected to commence in the
first half of 2009, but did not begin until January 19, 2010.
Seasonality
We
experience seasonality in our fluid handling business. As our customers seek to
fully utilize capital spending budgets before the end of the year, historically
our shipments have peaked during the fourth quarter; however, the global
economic downturn has disrupted this pattern. Also, our European operations
typically experience a slowdown during the July and August holiday
season.
Sales
and Orders
Our
sales, orders and backlog are affected by many factors including but not limited
to acquisitions, fluctuating foreign exchange rates, and growth (decline) in our
existing businesses which may be driven by market conditions and other factors.
To facilitate the comparison between reporting periods, we disclose the impact
of each of these three factors to the extent they impact the periods presented.
The impact of foreign currency translation is the difference between sales from
existing businesses valued at current year foreign exchange rates and the same
sales valued at prior year foreign exchange rates. Growth due to acquisitions
includes incremental sales due to an acquisition during the period or
incremental sales due to reporting a full year’s sales for an acquisition that
occurred in the prior year. Sales growth (decline) from existing businesses
excludes both the impact of foreign exchange rate fluctuations and acquisitions,
thus providing a measure of growth (decline) due to factors such as price, mix
and volume.
Orders
and order backlog are highly indicative of our future revenue and thus key
measures of anticipated performance. Orders consist of contracts for products or
services from our customers, net of cancellations, during a period. Order
backlog consists of unfilled orders at the end of a period. The components of
order and backlog growth (decline) are presented on the same basis as sales
growth (decline).
28
The
following tables present components of our sales and order growth (decline), as
well as, sales by fluid handling product for the periods indicated:
|
Backlog
at
|
||||||||||||||||||||||||
|
(Amounts
in millions)
|
Sales
|
Orders
(1)
|
Period
End
(1)
|
|||||||||||||||||||||
|
$
|
%
|
$
|
%
|
$
|
%
|
|||||||||||||||||||
|
Year
ended December 31, 2007
|
$ | 506.3 | $ | 589.0 | $ | 302.8 | ||||||||||||||||||
|
Components
of Change:
|
||||||||||||||||||||||||
|
Existing
Businesses
|
70.2 | 13.9 | % | 46.8 | 7.9 | % | 57.9 | 19.1 | % | |||||||||||||||
|
Acquisitions
|
5.5 | 1.1 | % | 11.7 | 2.0 | % | 15.2 | 5.0 | % | |||||||||||||||
|
Foreign
Currency Translation
|
22.9 | 4.5 | % | 34.6 | 5.9 | % | (26.9 | ) | (8.9 | )% | ||||||||||||||
|
Total
|
98.6 | 19.5 | % | 93.1 | 15.8 | % | 46.2 | 15.3 | % | |||||||||||||||
|
Year
ended December 31, 2008
|
$ | 604.9 | $ | 682.1 | $ | 349.0 | ||||||||||||||||||
|
Components
of Change:
|
||||||||||||||||||||||||
|
Existing
Businesses
|
(48.8 | ) | (8.1 | )% | (198.0 | ) | (29.0 | )% | (66.8 | ) | (19.1 | )% | ||||||||||||
|
Acquisitions
|
1.0 | 0.2 | % | 1.4 | 0.2 | % | 0.7 | 0.2 | % | |||||||||||||||
|
Foreign
Currency Translation
|
(32.1 | ) | (5.3 | )% | (23.1 | ) | (3.4 | )% | 8.0 | 2.3 | % | |||||||||||||
|
Total
|
(79.9 | ) | (13.2 | )% | (219.7 | ) | (32.2 | )% | (58.1 | ) | (16.6 | )% | ||||||||||||
|
Year
ended December 31, 2009
|
$ | 525.0 | $ | 462.4 | $ | 290.9 | ||||||||||||||||||
|
(1)
|
At
December 31, 2009, the Company standardized its definition of an order
among its businesses, as well as, the methodology for calculating the
currency impact on backlog. Orders and backlog are presented in accordance
with the revised methodology for all periods presented. As a result,
orders for the years ended December 31, 2008 and 2007 increased by $12.9
million, or 1.9% and $7.5 million, or 1.3%, respectively. Backlog for the
years ended December 31, 2008 and 2007 increased by $11.6 million, or 3.4%
and $10.0 million, or 3.4%, respectively. Applying the revised
methodology, orders and backlog for 2009 increased by $7.7 million, or
1.7% and $21.7 million, or 8.1%, respectively, compared to the previous
methodology.
|
|
Year
ended December 31,
|
||||||||||||
|
(Amounts
in millions)
|
2009
|
2008
|
2007
|
|||||||||
|
Net
Sales by Product:
|
||||||||||||
|
Pumps,
including aftermarket parts and service
|
$ | 443.1 | $ | 529.3 | $ | 441.7 | ||||||
|
Systems,
including installation service
|
69.3 | 58.2 | 48.4 | |||||||||
|
Valves
|
10.1 | 10.1 | 9.5 | |||||||||
|
Other
|
2.5 | 7.3 | 6.7 | |||||||||
|
Total
net sales
|
$ | 525.0 | $ | 604.9 | $ | 506.3 | ||||||
As
detailed above, sales from existing businesses declined 8.1% for the year ended
December 31, 2009 over the year ended December 31, 2008. This decrease was
primarily due to a significant decline in sales volume in the general industrial
end market resulting from the global economic downturn, partially offset by a
sales volume increase in the global navy end market. Foreign currency
translation negatively impacted sales and orders for the year ended December 31,
2009, primarily due to the strengthening of the U.S. dollar against the
Euro.
Orders,
net of cancellations, from existing businesses for the year ended December 31,
2009 were down 29.0% from the prior year, primarily due to a significant decline
in demand in the commercial marine, oil and gas, general industrial and power
generation end markets. We experienced commercial marine order cancellations of
approximately $22 million during the year ended December 31, 2009, as a result
of the economic downturn. Backlog as of December 31, 2009, of $290.9 million
decreased $58.1 million, or 16.6%, reflecting the decline in orders during the
year.
29
Sales
growth from existing business increased 13.9% for the year ended December 31,
2008 over the year ended December 31, 2007. This increase was
primarily attributable to increased volume and demand in the power generation,
commercial marine, and general industrial end markets. Acquisition growth of
1.1% for the year was due to the acquisitions of LSC on January 31, 2007
and Fairmount on November 29, 2007. Foreign currency translation increased
sales and orders by 4.5% and 5.9%, respectively. These increases were primarily
due to the weakening of the U.S. dollar against the Euro throughout most of
2008. During the fourth quarter of 2008, the U.S. dollar appreciated
sharply against both the Euro and the Swedish Krona, which had a negative effect
on our sales and order growth.
Order
growth from existing businesses was strong in most of our strategic end markets
(most notably in the oil and gas and global navy end markets), up 7.9% in
2008. Commercial marine orders increased approximately 1%, net of
cancellations of approximately $19 million. Our backlog of orders at December
31, 2008 was $349.0 million compared to $302.8 million at December 31,
2007. During 2008, backlog from existing businesses increased $57.9
million or 19.1%, on a currency-adjusted basis.
Gross
Profit
The
following table presents our gross profit and gross profit margin figures for
the periods indicated:
|
Year
ended December 31,
|
||||||||||||
|
(Amounts
in millions)
|
2009
|
2008
|
2007
|
|||||||||
|
Gross
profit
|
$ | 185.8 | $ | 217.2 | $ | 175.6 | ||||||
|
Gross
profit margin
|
35.4 | % | 35.9 | % | 34.7 | % | ||||||
Gross
profit decreased $31.4 million for the year ended December 31,
2009. Gross profit from existing businesses decreased $19.8 million,
with an additional $11.7 million negative impact of foreign exchange
rates. Gross profit margin declined a modest 50 basis points in 2009
despite a substantial decrease in production volume which caused lower
absorption of fixed manufacturing costs. Significant restructuring program cost
savings as well as favorable pricing and product mix in the commercial marine
and general industrial end markets for the most part successfully mitigated the
negative effect of volume on our gross margin.
Gross
profit of $217.2 million for the year ended December 31, 2008 increased
$41.6 million, or 23.7%, from $175.6 million in 2007. Of the $41.6 million
increase, $31.6 million was attributable to growth from existing
businesses, $2.4 million was due to the acquisitions of LSC on January 31,
2007 and Fairmount on November 29, 2007 and $7.6 million was due to
the positive impact of foreign exchange rates. Gross profit margin increased to
35.9% for the year ended December 31, 2008 from 34.7% for the year ended
December 31, 2007. The margin improvement for the year ended December 31, 2008
was primarily driven by favorable pricing and cost control in the commercial
marine and oil and gas markets.
Selling,
General and Administrative Expenses
The
following table presents our selling, general and administrative (SG&A)
expenses for the periods indicated:
|
Year
ended December 31,
|
||||||||||||
|
(Amounts
in millions)
|
2009
Restated
|
2008
Restated
|
2007
Restated
|
|||||||||
|
SG&A
expenses
|
$ | 112.5 | $ | 124.1 | $ | 97.4 | ||||||
|
SG&A
expenses as a percentage of sales
|
21.4 | % | 20.5 | % | 19.2 | % | ||||||
Selling,
general and administrative expenses decreased $11.6 million to $112.5 million
for the year ended December 31, 2009. Excluding the $6.1 million favorable
impact of foreign exchange rates, SG&A declined $5.5 million from 2008,
primarily due to reductions in selling and
commission expenses of $2.2 million and restructuring savings of $2.5 million.
An additional $2.0 million of professional fees and other costs associated with
becoming a public company and $2.6 million of pension and other postretirement
benefit costs were incurred in 2009, but were offset by lower legacy legal
expenses and favorable changes in the fair value of commodity and foreign
currency derivatives.
Selling,
general and administrative expenses increased $26.7 million to $124.1 million
for the year ended December 31, 2008 from $97.4 million for the year ended
December 31, 2007. The increase was primarily related to $3.8 million negative
impact of foreign exchange rates, $4.1 million reserve increase for a legacy
legal matter, $4.2 million for audit and professional fees and other costs
associated with becoming a public company, and $2.1 million from the
acquisitions of Fairmount and LSC. The remaining increase was
primarily due to higher selling expenses, insurance proceeds recognized in 2007
of $2.2 million related to a product liability matter, and a gain recognized in
2007 of $1.1 million from the sale of investment securities.
30
Operating
Income
The table
below presents operating income data for the periods indicated:
|
Year
ended December 31,
|
||||||||||||
|
(Amounts
in millions)
|
2009 Restated
|
2008 Restated
|
2007 Restated
|
|||||||||
|
Operating
income
|
$ | 39.6 | $ | 17.8 | $ | 124.3 | ||||||
|
Operating
margin
|
7.5 | % | 2.9 | % | 24.6 | % | ||||||
Operating
income for the year ended December 31, 2009 increased $21.8 million from the
prior year. The increase was primarily due to the absence of $57.0
million of initial public offering-related costs incurred in 2008, partially
offset by $18.2 million of restructuring costs incurred in 2009 as well as a
$5.5 million negative impact of foreign exchange rates. Excluding
these impacts, operating income was $11.5 million lower than the prior year,
primarily due to lower sales volume from existing businesses, partially offset
by lower asbestos-related expenses and selling, general and administrative
expenses.
Operating
income for the year ended December 31, 2008 decreased $106.5 million from the
year ended December 31, 2007. This decrease was primarily due to a $62.7 million
decrease in asbestos-related income, IPO-related costs of $57.0 million, $4.2
million of professional and other costs associated with becoming a public
company, $4.1 million related to a reserve increase for a legacy legal matter,
and the absence of $2.2 million of income recognized in the prior year period
related to a product liability matter, partially offset by $23.4 million of
increased operational performance in our existing business units primarily
caused by increased sales volume and a $3.3 million favorable impact from
foreign exchange rates.
Interest
Expense
For a
description of our outstanding indebtedness, please refer to “—Liquidity and
Capital Resources” below.
Interest
expense of $7.2 million for the year ended December 31, 2009 declined $4.6
million from the prior year, primarily due to lower debt levels during 2009
compared to 2008 as a result of debt repayments of $105.4 million from a portion
of the IPO proceeds in the second quarter of 2008. A decrease in the
weighted-average effective interest rate on our variable rate borrowings that
are not hedged, from 6.3% in 2008 to 5.6% in 2009 contributed approximately $0.7
million to the reduction in interest expense.
Interest
expense of $11.8 million for the year ended December 31, 2008 declined $7.4
million from the prior year, primarily due to lower debt levels resulting from
the debt repayments of $105.4 million with a portion of the IPO proceeds on May
13, 2008. A decrease in the weighted-average interest rate on our
variable rate borrowings from 7.4% in 2007 to 6.3% in 2008 contributed
approximately $1.5 million to the reduction in interest expense.
Provision
for Income Taxes
The
effective income tax rate for the year ended December 31, 2009 was 26.6% as
compared to an effective tax rate of 91.1% for the year ended December 31,
2008. Our effective tax rate for the year ended December 31, 2009 was
lower than the U.S. federal statutory rate primarily due to international tax
rates which are lower than the U.S. tax rate, including the impact of the
reduction in 2009 of the Swedish tax rate from 28% to 26.3 % that is applied to
our Swedish operations and a net decrease to our valuation allowance and
unrecognized tax benefit liability.
The
effective income tax rate for the year ended December 31, 2008 was 91.1% as
compared to an effective tax rate of 37.5% for the year ended December 31, 2007.
Our effective tax rate for the year ended December 31, 2008 was higher than the
U.S. federal statutory rate primarily due to an $11.8 million payment to
reimburse certain selling shareholders for underwriters discounts that are not
deductible for tax purposes and a $3.0 million net increase in valuation
allowance, offset in part by an expected lower overall rate on normal operations
due to reductions in German corporate tax rates in 2008, other international tax
rates that are lower than the U.S. tax rate, changes in overall profitability
and state tax benefits.
31
Liquidity
and Capital Resources
Overview
Historically,
we have financed our capital and working capital requirements through a
combination of cash flows from operating activities and borrowings under our
credit facility. We expect that our primary ongoing requirements for cash will
be for working capital, funding for potential acquisitions, capital
expenditures, asbestos-related outflows and pension plan funding. If additional
funds are needed for strategic acquisitions or other corporate purposes, we
believe we could raise additional funds in the form of debt or
equity.
Borrowings
On
May 13, 2008, coinciding with the closing of the IPO, we terminated our
existing credit facility. There were no material early termination penalties
incurred as a result of the termination. Deferred loan costs of $4.6 million
were written off in connection with this termination. On the same
day, we entered into a new credit agreement (the “Credit
Agreement”). The Credit Agreement, led by Banc of America Securities
LLC and administered by Bank of America, is a senior secured structure with a
$150.0 million revolver and a Term A Note of $100.0 million.
The Term
A Note bears interest at LIBOR plus a margin ranging from 2.25% to 2.75%
determined by the total leverage ratio calculated at quarter end. At
December 31, 2009, the interest rate was 2.48% inclusive of a 2.25% margin. The
Term A Note, as entered into on May 13, 2008, has $1.25 million due on a
quarterly basis on the last day of each March, June, September and December
beginning June 30, 2008 and ending March 31, 2010, $2.5 million due on a
quarterly basis on the last day of each March, June, September and December
beginning June 30, 2010 and ending March 31, 2013, and one installment of $60.0
million payable on May 13, 2013. On December 31, 2009, there was
$91.3 million outstanding on the Term A Note.
The
$150.0 million revolver contains a $50.0 million letter of credit sub-facility,
a $25.0 million swing line loan sub-facility and a €100.0 million
sub-facility. At December 31, 2009, the annual commitment fee on the
revolver was 0.4% and there was $14.4 million outstanding on the letter of
credit sub-facility, leaving approximately $136 million available under our
revolver loan.
On June
24, 2008, we entered into an interest rate swap with an aggregate notional value
of $75.0 million whereby we exchanged our LIBOR-based variable rate interest for
a fixed rate of 4.1375%. The notional value decreases to $50.0
million and then $25.0 million on June 30, 2010 and June 30, 2011, respectively
and expires on June 29, 2012. The fair value of the swap agreement, based on
third-party quotes, was a liability of $3.0 million at December 31,
2009. The swap agreement has been designated as a cash flow hedge,
and therefore changes in its fair value are recorded as an adjustment to other
comprehensive income.
Substantially
all assets and stock of the Company’s domestic subsidiaries and 65% of the
shares of certain European subsidiaries are pledged as collateral against
borrowings under the Credit Agreement. Certain European assets are pledged
against borrowings directly made to our European subsidiary. The Credit
Agreement contains customary covenants limiting the Company’s ability to, among
other things, pay cash dividends, incur debt or liens, redeem or repurchase
Company stock, enter into transactions with affiliates, make investments, merge
or consolidate with others or dispose of assets. In addition, the Credit
Agreement contains financial covenants requiring the Company to maintain a total
leverage ratio of not more than 3.25 to 1.0 and a fixed charge coverage ratio of
not less than 1.50 to 1.0, measured at the end of each quarter. If the Company
does not comply with the various covenants under the Credit Agreement and
related agreements, the lenders may, subject to various customary cure rights,
require the immediate payment of all amounts outstanding under the Term A Note
and revolver. The Company believes it is in compliance with all such covenants
as of December 31, 2009 and expects to be in compliance for the next 12
months.
32
As of
December 31, 2009, we had approximately $136 million available on our $150
million revolving credit line. Present drawings under the credit line are
letters of credit securing various obligations related to our business. The
revolving credit line is provided by a consortium of financial institutions with
varying commitment levels as show below (in millions):
|
Amount
|
||||
|
Bank
of America
|
$ | 32.4 | ||
|
RBS
Citizens
|
14.4 | |||
|
TD
BankNorth
|
14.4 | |||
|
Wells
Fargo
|
14.4 | |||
|
SunTrust
Bank
|
14.4 | |||
|
Landesbank
Baden-Wuerttemberg
|
10.5 | |||
|
DnB
Nor Bank
|
10.5 | |||
|
HSBC
|
10.5 | |||
|
KeyBank
|
10.5 | |||
|
Carolina
First Corp
|
6.0 | |||
|
UBS
|
6.0 | |||
|
Lehman
Brothers(1)
|
6.0 | |||
|
Total
|
$ | 150.0 | ||
|
(1)
|
The
bankruptcy of Lehman Brothers resulted in their default under the terms of
the revolver and it is doubtful that we would be able to draw on Lehman
Brothers’ commitment of $6.0
million.
|
Comparative
Cash Flows
The table
below presents selected cash flow data for the periods indicated:
|
Year
ended December 31,
|
||||||||||||
|
(Amounts
in millions)
|
2009
|
2008
|
2007
|
|||||||||
|
Net
cash provided by (used in) operating activities
|
$ | 38.3 | $ | (33.0 | ) | $ | 74.5 | |||||
|
Purchases
of fixed assets
|
(11.0 | ) | (18.6 | ) | (13.7 | ) | ||||||
|
Net
cash paid for acquisitions
|
(1.3 | ) | (0.4 | ) | (33.0 | ) | ||||||
|
Other
sources, net
|
0.3 | (0.1 | ) | 0.2 | ||||||||
|
Net
cash used in investing activities
|
$ | (12.0 | ) | $ | (19.1 | ) | $ | (46.5 | ) | |||
|
Proceeds
and repayments of borrowings, net
|
(5.0 | ) | (110.3 | ) | 14.7 | |||||||
|
Net
proceeds from IPO
|
- | 193.0 | - | |||||||||
|
Dividends
paid to preferred shareholders
|
- | (38.5 | ) | - | ||||||||
|
Repurchases
of common stock
|
- | (5.7 | ) | - | ||||||||
|
Payments
made for loan costs
|
- | (3.3 | ) | (1.4 | ) | |||||||
|
Payment
of deferred stock issuance costs
|
- | - | (1.2 | ) | ||||||||
|
Other
uses, net
|
(0.4 | ) | (0.4 | ) | (0.4 | ) | ||||||
|
Net
cash (used in) provided by financing activities
|
$ | (5.4 | ) | $ | 34.8 | $ | 11.7 | |||||
Cash
flows from operating activities can fluctuate significantly from period to
period as working capital needs, the timing of payments for items such as
asbestos-related cash flows, pension funding decisions and other items impact
reported cash flows.
Net cash
provided by (used in) operating activities was $38.3 million, $(33.0) million
and $74.5 million for the years ended December 31, 2009, 2008 and 2007,
respectively. The two most significant items causing the variability
in these reported amounts were asbestos-related cash flows (including the
disposition of claims, defense costs, insurer reimbursements and settlements and
legal expenses related to litigation against our insurers) and IPO-related costs
in 2008. For the years ended December 31, 2009, 2008 and 2007, net cash
paid (received) for asbestos liabilities, net of insurance settlements received,
was $19.7 million, $21.8 million and $(22.5) million, respectively.
For the year ended December 31, 2008, cash paid for IPO-related costs were $42.4
million. Additionally, in the year ended December 31, 2008, cash paid for legacy
legal settlements were $11.7 million. Excluding the effect of asbestos-related
cash flows, IPO-related costs, and legacy legal settlements, net cash provided
by operating activities would have been $57.9 million, $42.9 million and $52.0
million for the years ended December 31, 2009, 2008 and 2007,
respectively.
33
Other
changes in operating cash flow items are discussed below.
|
|
Ÿ
|
Funding
requirements of our defined benefit plans, including both pensions and
other post-employment benefits, can vary significantly among periods due
to changes in the fair value of plan assets and actuarial assumptions. For
the years ended December 31, 2009, 2008 and 2007, cash contributions
for defined benefit plans were $8.3 million, $6.4 million, and $8.7
million, respectively.
|
|
|
Ÿ
|
In
2009, $7.9 million of cash payments were made related to the Company’s
restructuring initiatives.
|
|
|
Ÿ
|
Changes
in working capital also affected the operating cash flows for the years
presented. We define working capital as trade receivables plus inventories
less accounts payable.
|
|
|
Ÿ
|
Working
capital, excluding the effects of acquisitions and foreign currency
translation, decreased $10.3 million from December 31, 2008 to December
31, 2009 and increased $30.5 million from December 31, 2007 to
December 31, 2008. These changes were primarily due to changes in
inventory levels and trade receivables due to variations in sales
volume.
|
Investing
activities consist primarily of purchases of fixed assets and cash paid for
acquisitions.
|
|
Ÿ
|
In all years presented, capital
expenditures were invested in new and replacement machinery, equipment and
information technology. We generally target capital expenditures at
approximately 2.0% to 2.5% of
revenues.
|
|
|
Ÿ
|
In August 2009, we acquired
PD-Technik for $1.3 million, net of cash acquired in the
transaction.
|
|
|
Ÿ
|
In November 2007, we acquired
Fairmount for a purchase price of $3.3 million, net of cash acquired.
Purchase price adjustments of $0.4 million each in 2009 and 2008 increased
the purchase price to $4.1 million, net of cash
acquired.
|
|
|
Ÿ
|
In January 2007, we acquired LSC
for a purchase price of $29.7 million, net of cash
acquired.
|
Financing
cash flows consist primarily of borrowings and repayments of indebtedness,
payment of dividends to shareholders and redemptions of stock.
|
|
Ÿ
|
During
2009, we repaid $5.0 million of long-term
borrowings.
|
|
|
Ÿ
|
In
the fourth quarter of 2008, we purchased 795,000 shares of our common
stock for approximately $5.7 million. We did not purchase any
shares in 2009.
|
|
|
Ÿ
|
Our
IPO proceeds in May 2008 were $193.0 million after deducting estimated
accounting, legal and other expenses of $5.9 million. We used
these proceeds to: (i) repay approximately $105.4 million of indebtedness
outstanding under our credit facility, (ii) pay dividends to existing
preferred stockholders of record immediately prior to the consummation of
the IPO in the amount of $38.5 million, (iii) pay $11.8 million to the
selling stockholders in the IPO as reimbursement for the underwriting
discount incurred on the shares sold by them, and (iv) pay special bonuses
of approximately $27.8 million to certain of our executives under
previously adopted executive compensation plans. The remainder
of the net proceeds was applied to working
capital.
|
|
|
Ÿ
|
We
paid approximately $3.3 million in deferred loan costs related to our new
credit facility entered into May 13,
2008.
|
|
|
Ÿ
|
In November 2007, $10.0 million
cash received from settlements with our asbestos insurers was used to pay
down the revolver. In addition, the Term C was paid down by €7.0
million.
|
|
|
Ÿ
|
During 2007, we paid deferred
stock issuance costs of $1.2 million for costs incurred related to our IPO
in May 2008.
|
34
|
|
Ÿ
|
On
January 3, 2007, we amended the credit facility to increase
borrowings under the Term B loan by $55.0 million. Approximately $28.5
million of the proceeds were subsequently used to fund the acquisition of
LSC, $24.5 million of the proceeds were used to pay down our revolver
debt, and the remaining proceeds were used for other general corporate
purposes.
|
Contractual
Obligations
We are
party to numerous contracts and arrangements that obligate us to make cash
payments in future years. These contracts include financing
arrangements such as debt agreements and leases, as well as contracts for the
purchase of goods and services. The following table is a summary of
our contractual obligations as of December 31, 2009 (in
millions):
|
Total
|
Less than
One Year
|
1-3 Years
|
3-5 Years
|
More Than
5 Years
|
||||||||||||||||
|
Debt &
Leases:
|
||||||||||||||||||||
|
Term
Loan A
|
$ | 91.3 | $ | 8.8 | $ | 20.0 | $ | 62.5 | - | |||||||||||
|
Interest
Payments on Long-Term Debt (1)
|
10.9 | 4.7 | 5.6 | 0.6 | - | |||||||||||||||
|
Capital
Leases & Other Debt
|
0.2 | 0.2 | - | - | - | |||||||||||||||
|
Operating
Leases
|
9.8 | 3.9 | 4.1 | 1.6 | 0.2 | |||||||||||||||
|
Purchase
Obligations (2)
|
25.3 | 24.6 | 0.6 | - | 0.1 | |||||||||||||||
|
Total
|
$ | 137.5 | $ | 42.2 | $ | 30.3 | $ | 64.7 | $ | 0.3 | ||||||||||
|
(1)
|
Includes
estimated interest rate swap payments. Variable interest payments are
estimated using a static rate of
3.7%.
|
|
(2)
|
Amounts
exclude open purchase orders for goods or services that are provided on
demand, the timing of which is not
certain.
|
We have
cash funding requirements associated with our pension and other post-retirement
benefit plans, which are estimated to be approximately $6.9 million for the year
ending December 31, 2010. Other long-term liabilities, such as those for
asbestos and other legal claims, employee benefit plan obligations, and deferred
income taxes, are excluded from the above table since they are not contractually
fixed as to timing and amount.
Off-Balance
Sheet Arrangements
We do not
have any off-balance sheet arrangements that provide liquidity, capital
resources, market or credit risk support that expose us to any liability that is
not reflected in our consolidated financial statements other than outstanding
letters of credit of $14.4 million at December 31, 2009 and future
operating lease payments of $9.8 million.
On
November 29, 2007, we acquired Fairmount, an original equipment
manufacturer of mission critical programmable automation controllers in fluid
handling applications primarily for the U.S. Navy, for $4.5 million plus
contingent payments based on achievement of future revenue and earnings targets
over the period ending December 31, 2010. Remaining contingent payments, if any,
of up to $1.3 million could result if targets are achieved.
The
Company and its subsidiaries have in the past divested certain of its businesses
and assets. In connection with these divestitures, certain
representations, warranties and indemnities were made to purchasers to cover
various risks or unknown liabilities. We cannot estimate the potential
liability, if any, that may result from such representations, warranties and
indemnities because they relate to unknown and unexpected contingencies;
however, the Company does not believe that any such liabilities will have a
material adverse effect on our financial condition, results of operations or
liquidity.
Critical
Accounting Policies
The
methods, estimates and judgments we use in applying our critical accounting
policies have a significant impact on the results we report in our financial
statements. We evaluate our estimates and judgments on an ongoing basis. Our
estimates are based upon our historical experience, our evaluation of business
and macroeconomic trends, and information from other outside sources as
appropriate. Our experience and assumptions form the basis for our judgments
about the carrying value of assets and liabilities that are not readily apparent
from other sources. Actual results may vary from what our management anticipates
and different assumptions or estimates about the future could change our
reported results.
35
We
believe the following accounting policies are the most critical in that they are
important to the financial statements and they require the most difficult,
subjective or complex judgments in the preparation of the financial statements.
For a detailed discussion on the application of these and other accounting
policies, see Note 3 to the Consolidated Financial Statements.
Asbestos
Liabilities and Insurance Assets
Two of
our subsidiaries are each one of many defendants in a large number of lawsuits
that claim personal injury as a result of exposure to asbestos from products
manufactured with components that are alleged to have contained asbestos. Such
components were acquired from third-party suppliers, and were not manufactured
by any of our subsidiaries nor were the subsidiaries producers or direct
suppliers of asbestos. The manufactured products that are alleged to have
contained asbestos generally were provided to meet the specifications of the
subsidiaries’ customers, including the U.S. Navy.
The
subsidiaries settle asbestos claims for amounts management considers reasonable
given the facts and circumstances of each claim. The annual average settlement
payment per asbestos claimant has fluctuated during the past several years.
Management expects such fluctuations to continue in the future based upon, among
other things, the number and type of claims settled in a particular period and
the jurisdictions in which such claims arise. To date, the majority of settled
claims have been dismissed for no payment.
Claims
activity related to asbestos is as follows (1):
|
Year ended December 31,
|
||||||||||||
|
2009
|
2008
|
2007
|
||||||||||
|
Claims
unresolved at the beginning of the period
|
35,357 | 37,554 | 50,020 | |||||||||
|
Claims
filed (2)
|
3,323 | 4,729 | 6,861 | |||||||||
|
Claims
resolved (3)
|
(13,385 | ) | (6,926 | ) | (19,327 | ) | ||||||
|
Claims
unresolved at the end of the period
|
25,295 | 35,357 | 37,554 | |||||||||
|
Average
cost of resolved claims (4)
|
$ | 11,106 | $ | 5,378 | $ | 5,232 | ||||||
|
(1)
|
Excludes
claims filed by one legal firm that have been “administratively
dismissed.”
|
|
(2)
|
Claims
filed include all asbestos claims for which notification has been received
or a file has been opened.
|
|
(3)
|
Claims
resolved include asbestos claims that have been settled or dismissed or
that are in the process of being settled or dismissed based upon
agreements or understandings in place with counsel for the
claimants.
|
|
(4)
|
Average
cost of settlement to resolve claims in whole dollars. These amounts
exclude claims in Mississippi for which the majority of claims have
historically been without merit and have been resolved for no payment.
These amounts exclude any potential insurance
recoveries.
|
We
have projected each subsidiary’s future asbestos-related liability costs with
regard to pending and future unasserted claims based upon the Nicholson
methodology. The Nicholson methodology is the standard approach used by most
experts and has been accepted by numerous courts. This methodology is based upon
risk equations, exposed population estimates, mortality rates, and other
demographic statistics. In applying the Nicholson methodology for each
subsidiary we performed: 1) an analysis of the estimated population likely to
have been exposed or claim to have been exposed to products manufactured by the
subsidiaries based upon national studies undertaken of the population of workers
believed to have been exposed to asbestos; 2) the use of epidemiological and
demographic studies to estimate the number of potentially exposed people that
would be likely to develop asbestos-related diseases in each year; 3) an
analysis of the subsidiaries’ recent claims history to estimate likely filing
rates for these diseases; and 4) an analysis of the historical asbestos
liability costs to develop average values, which vary by disease type,
jurisdiction and the nature of claim, to determine an estimate of costs likely
to be associated with currently pending and projected asbestos claims. Our
projections, based upon the Nicholson methodology, estimate both claims and the
estimated cash outflows related to the resolution of such claims for periods up
to and including the endpoint of asbestos studies referred to in item 2) above.
It is our policy to record a liability for asbestos-related liability costs for
the longest period of time that we can reasonably estimate.
36
Projecting
future asbestos-related liability costs is subject to numerous variables that
are difficult to predict, including the number of claims that might be received,
the type and severity of the disease alleged by each claimant, the latency
period associated with asbestos exposure, dismissal rates, costs of medical
treatment, the financial resources of other companies that are co-defendants in
the claims, funds available in post-bankruptcy trusts, uncertainties surrounding
the litigation process from jurisdiction to jurisdiction and from case to case,
and the impact of potential changes in legislative or judicial standards,
including potential tort reform. Furthermore, any projections with respect to
these variables are subject to even greater uncertainty as the projection period
lengthens. These trend factors have both positive and negative effects on the
dynamics of asbestos litigation in the tort system and the related best estimate
of our asbestos liability, and these effects do not move in linear fashion but
rather change over multiple year periods. Accordingly, we monitor these trend
factors over time and periodically assesses whether an alternative forecast
period is appropriate. Taking these factors into account and the inherent
uncertainties, we believe that we can reasonably estimate the asbestos-related
liability for pending and future claims that will be resolved in the next 15
years and has recorded that liability as our best estimate. While it is
reasonably possible that the subsidiaries will incur costs after this period, we
do not believe the reasonably possible loss or range of reasonably possible loss
is estimable at the current time. Accordingly, no accrual has been recorded for
any costs which may be paid after the next 15 years. Defense costs associated
with asbestos-related liabilities as well as costs incurred related to
litigation against the subsidiaries’ insurers are expensed as
incurred.
We
assessed the subsidiaries’ existing insurance arrangements and agreements,
determined the applicability of insurance coverage for existing and expected
future claims, analyzed publicly available information bearing on the current
creditworthiness and solvency of the various insurers, and employed such
insurance allocation methodologies as we believed appropriate to ascertain the
probable insurance recoveries for asbestos liabilities. The analysis took into
account self-insurance reserves, policy exclusions, pending litigation,
liability caps and gaps in coverage, allocation agreements, indemnity
arrangements with third-parties, existing and potential insolvencies of insurers
as well as how legal and defense costs will be covered under the insurance
policies.
During
the third quarter of 2009, an analysis of claims data including filing and
dismissal rates, alleged disease mix, filing jurisdiction, as well as settlement
values resulted in the determination that the Company should revise its rolling
15-year estimate of asbestos-related liability for pending and future
claims. As a result, the Company recorded an $11.6 million pretax
charge in the third quarter of 2009, which was comprised of an increase to its
asbestos-related liabilities of $111.3 million offset by expected insurance
recoveries of $99.7 million.
Each
subsidiary has separate insurance coverage resulting from the independent
corporate history of each entity. In our evaluation of the insurance asset, we
used differing insurance allocation methodologies for each subsidiary based upon
the state law that will or is likely to apply for that subsidiary.
For one
of the subsidiaries, the Delaware Court of Chancery ruled on October 14, 2009,
that asbestos-related costs should be allocated among excess insurers using an
“all sums” allocation (which allows an insured to collect all sums paid in
connection with a claim from any insurer whose policy is triggered, up to the
policy’s applicable limits) and that the subsidiary has rights to excess
insurance policies purchased by a former owner of the business. Based
upon this ruling mandating an “all sums” allocation, as well as the language of
the underlying insurance policies and the determination that defense costs are
outside policy limits, the Company, as of October 2, 2009, increased its future
expected recovery percentage from 67% to 90% of asbestos-related costs following
the exhaustion in the future of its primary and umbrella layers of insurance and
recorded a pretax gain of $17.3 million. The subsidiary expects to be
responsible for approximately 10% of all future asbestos-related
costs.
In
November 2008, the subsidiary entered into a settlement agreement with the
primary and umbrella carrier governing all aspects of the carrier’s past and
future handling of the asbestos related bodily injury claims against the
subsidiary. As a result of this agreement, during the third quarter of
2008, the Company increased its insurance asset by $7.0 million attributable to
resolution of a dispute concerning certain pre-1966 insurance policies and
recorded a corresponding pretax gain. The additional insurance will be allocated
by the carrier to cover any gaps in coverage up to $7.0 million resulting from
exhaustion of umbrella policies and/or the failure of any excess carrier to pay
amounts incurred in connection with asbestos claims. The Company reimbursed the
primary insurer for $7.6 million in deductibles and retrospective premiums in
the fourth quarter of 2008 and has no further liability to the insurer under
these provisions of the primary policies.
This
subsidiary’s primary and umbrella insurance coverage was exhausted in the first
quarter of 2010. No cost sharing or allocation agreement is
currently in place with the Company’s excess insurers; however, certain
excess insurers have stated that they will abide by the Delaware Chancery
Court's recent coverage rulings, including its ruling that the subsidiary
may seek insurance coverage from the Company's excess insurers on and “all
sums” basis and that they will defend and/or indemnify the subsidiary
against asbestos claims, subject to their reservation of
rights.
37
In 2003,
the other subsidiary brought legal action against a large number of its insurers
and its former parent to resolve a variety of disputes concerning insurance for
asbestos-related bodily injury claims asserted against it. Although
none of these insurance companies contested coverage, they disputed the timing,
reasonableness and allocation of payments. For this subsidiary it was
determined by court ruling in the fourth quarter of 2007, that the allocation
methodology mandated by the New Jersey courts will apply. Further court rulings
in December of 2009, clarified the allocation calculation related to
amounts currently due from insurers as well as amounts the Company expects to be
reimbursed for asbestos-related costs incurred in future periods. As
a result, in the fourth quarter of 2009, the Company increased its receivable
for past costs by $11.9 million and decreased its insurance asset for future
costs by $9.8 million and recorded a pretax gain of $2.1 million. The
subsidiary expects to responsible for approximately 14% of all future
asbestos-related costs.
The
Company has established reserves of $443.8 million and $357.3 million as of
December 31, 2009 and December 31, 2008, respectively, for the probable and
reasonably estimable asbestos-related liability cost it believes the
subsidiaries will pay through the next 15 years. It has also
established recoverables of $389.4 million and $304.0 million as of
December 31, 2009 and December 31, 2008, respectively, for the insurance
recoveries that are deemed probable during the same time period. Net of these
recoverables, the expected cash outlay on a non-discounted basis for
asbestos-related bodily injury claims over the next 15 years was
$54.3 million and $53.3 million as of December 31, 2009 and
December 31, 2008, respectively. In addition, the Company has recorded a
receivable for liability and defense costs previously paid in the amount of
$45.9 million and $36.4 million as of December 31, 2009 and December 31,
2008, respectively, for which insurance recovery is deemed
probable. The Company has recorded the reserves for the asbestos
liabilities as “Accrued asbestos liability” and “Long-term asbestos liability”
and the related insurance recoveries as “Asbestos insurance asset” and
“Long-term asbestos insurance asset”. The receivable for previously
paid liability and defense costs is recorded in “Asbestos insurance receivable”
and “Long-term asbestos insurance receivable” in the accompanying consolidated
balance sheets.
The
income related to these liabilities and legal defense was $2.2 million, net of
estimated insurance recoveries, for the year ended December 31, 2009 compared to
$4.8 million and $63.9 million for the years ended December 31, 2008 and 2007,
respectively. Legal costs related to the subsidiaries’ action against
their asbestos insurers were $11.7 million for the year ended December 31, 2009
compared to $17.2 million and $13.6 million for the years ended December 31,
2008 and 2007, respectively.
Management’s
analyses are based on currently known facts and a number of assumptions.
However, projecting future events, such as new claims to be filed each year, the
average cost of resolving each claim, coverage issues among layers of insurers,
the method in which losses will be allocated to the various insurance policies,
interpretation of the effect on coverage of various policy terms and limits and
their interrelationships, the continuing solvency of various insurance
companies, the amount of remaining insurance available, as well as the numerous
uncertainties inherent in asbestos litigation could cause the actual liabilities
and insurance recoveries to be higher or lower than those projected or recorded
which could materially affect our financial condition, results of operations or
cash flow.
Retirement
Benefits
Pension
obligations and other post-retirement benefits are actuarially determined and
are affected by several assumptions, including the discount rate, assumed annual
rates of return on plan assets, and per capita cost of covered health care
benefits. Changes in discount rate and differences from actual results for each
assumption will affect the amounts of pension expense and other post-retirement
expense recognized in future periods. These assumptions may also have an effect
on the amount and timing of future cash contributions.
Impairment
of Goodwill and Indefinite-Lived Intangible Assets
Goodwill
represents the costs in excess of the fair value of net assets acquired
associated with our acquisitions.
We
evaluate the recoverability of goodwill and indefinite-lived intangible assets
annually on December 31 or more frequently if an event occurs or
circumstances change in the interim that would more likely than not reduce the
fair value of the asset below its carrying amount. Goodwill is considered to be
impaired when the net book value of a reporting unit exceeds its estimated fair
value.
38
In the
evaluation of goodwill for impairment, we first compare the fair value of the
reporting unit to its carrying value. If the carrying value of a reporting unit
exceeds its fair value, the goodwill of that reporting unit is potentially
impaired and step two of the impairment analysis is performed. In step two of
the analysis, an impairment loss is recorded equal to the excess of the carrying
value of the reporting unit’s goodwill over its implied fair value should such a
circumstance arise.
We
measure fair value of reporting units based on a present value of future
discounted cash flows or a market valuation approach. The discounted cash flows
model indicates the fair value of the reporting units based on the present value
of the cash flows that the reporting units are expected to generate in the
future. Significant estimates in the discounted cash flows model include: the
weighted average cost of capital; long-term rate of growth and profitability of
our business; and working capital effects. The market valuation approach
indicates the fair value of the business based on a comparison of the Company
against certain market information. Significant estimates in the market approach
model include identifying appropriate market multiples and assessing earnings
before interest, income taxes, depreciation and amortization (EBITDA) in
estimating the fair value of the reporting units.
The
analysis performed for each of the years ended December 31, 2009, 2008 and 2007
indicated no impairment to be present. However, actual results could
differ from our estimates and projections, which would affect the assessment of
impairment. As of December 31, 2009, we have goodwill of $163.4 million that is
subject to at least annual review of impairment.
Income
Taxes
We
account for income taxes under the asset and liability method, which requires
that deferred tax assets and liabilities be recognized using enacted tax rates
for the effect of temporary differences between the book and tax bases of
recorded assets and liabilities. Deferred tax assets are reduced by a valuation
allowance if it is more likely than not that some portion of the deferred tax
asset will not be realized. In evaluating the need for a valuation allowance, we
take into account various factors, including the expected level of future
taxable income and available tax planning strategies. If actual results differ
from the assumptions made in the evaluation of our valuation allowance, we
record a change in valuation allowance through income tax expense in the period
such determination is made.
During
the year ending December 31, 2009, the valuation allowance decreased from $45.2
million to $45.1 million with the decrease recognized in income tax expense. The
$0.1 million net decrease in 2009 was primarily attributable to a corresponding
reduction in deferred tax assets due to the pension restatement, offset in part
by an increase attributable to certain separate company losses we believe may
not be realized. Consideration was given to U.S. tax planning strategies and
future U.S. taxable income as to how much of the total U.S. deferred tax asset
could be realized on a more likely than not basis. If economic
conditions adversely affect our ability to generate future U.S. taxable income,
additional valuation allowances may be needed.
The
determination of our provision for income tax requires significant judgment, the
use of estimates, and the interpretation and application of complex tax laws.
Significant judgment is required in assessing the timing and amounts of
deductible and taxable items. We establish reserves when, despite the belief
that the tax return positions are fully supportable, we believe that certain
positions may be successfully challenged. When facts and circumstances change,
the reserves are adjusted through the provision for income taxes. Tax benefits
are not recognized until minimum recognition thresholds are met as prescribed by
applicable accounting standards.
Revenue
Recognition
We
recognize revenues and costs from product sales when all of the following
criteria are met: persuasive evidence of an arrangement exists, the price is
fixed or determinable, product delivery has occurred or services have been
rendered, there are no further obligations to customers, and collectibility is
probable. Product delivery occurs when title and risk of loss transfer to the
customer. Our shipping terms vary based on the contract. If any significant
obligations to the customer with respect to such sale remain to be fulfilled
following shipment, typically involving obligations relating to installation and
acceptance by the buyer, revenue recognition is deferred until such obligations
have been fulfilled. Any customer allowances and discounts are recorded as a
reduction in reported revenues at the time of sale because these allowances
reflect a reduction in the purchase price for the products purchased. These
allowances and discounts are estimated based on historical experience and known
trends. Revenue related to service agreements is recognized as revenue over the
term of the agreement.
39
For
long-term contracts, revenue is generally recognized based on the
percentage-of-completion method calculated on the units of delivery basis or the
cost-to-cost basis. The percentage of completion method requires estimates of
total expected contract revenue and costs. We follow this method when we can
make reasonably dependable estimates of the revenue and cost applicable to
various stages of the contract. Revisions in profit estimates are reflected in
the period in which the facts that gave rise to the revision become known and
have historically been insignificant. Percentage of completion revenue was
approximately 2.2%, 0.9%, and 2.9% of consolidated revenues for the years ended
December 31, 2009, 2008 and 2007, respectively. Service revenues are recognized
as services are performed.
We
maintain allowances for doubtful accounts for estimated losses resulting from
the inability of our customers to make required payments. These allowances are
based on recent trends of certain customers estimated to be a greater credit
risk as well as general trends of the entire pool of customers. The allowance
for doubtful accounts was $2.8 million and $2.5 million as of December 31, 2009
and 2008, respectively. If the financial condition of our customers were to
deteriorate, resulting in an impairment of their ability to make payments,
additional allowances may be required.
The
foregoing criteria are used for all classes of customers including original
equipment manufacturers, distributors, government contractors and other end
users.
Stock-Based
Compensation
Pursuant
to our 2008 omnibus incentive plan, our board of directors may make awards in
the form of shares of restricted stock, stock options and restricted stock units
(“RSUs”) and other stock-based awards. We measure and recognize the cost of
employee services received in exchange for an award of equity instruments based
on the grant-date fair value of the award, with limited exceptions. That cost is
recognized over the period during which an employee is required to provide
service in exchange for the award—the requisite service period or vesting
period. No compensation cost is recognized for equity instruments for which
employees do not render the requisite service. We have equity incentive plans to
encourage employees and non-employee directors to remain with us and to more
closely align their interests with those of our shareholders.
For
purposes of calculating stock-based compensation, the fair value of restricted
stock or restricted stock units granted is equal to the market value of a share
of common stock on the date of the grant. For grants that were awarded on May 7,
2008 in conjunction with our initial public offering, we used the initial public
offering price as the fair value of the restricted stock and restricted stock
units granted. For stock options, we estimate the fair value on the date of
grant using the Black-Scholes option-pricing model. The determination of fair
value using the Black-Scholes model requires a number of complex and subjective
variables. One key input into the model is the fair value of our common stock on
the date of grant, the initial public offering price in the case of stock
options issued on May 7, 2008. Other key variables in the Black-Scholes
option-pricing model include the expected volatility of our common stock price,
the expected term of the award and the risk-free interest rate. In addition, we
are required to estimate forfeitures of unvested awards when recognizing
compensation expense. Significant assumptions used to calculate stock-based
compensation during the years ended December 31, 2009 and 2008 were a stock
price volatility of 32.5% and 32.4%, respectively, an expected option life of
4.5 years, a risk-free interest rate based on the 5-year treasury note yield on
the date of grant ranging from 1.9% to 2.5% in 2009 and 2.5 % to 3.1% in 2008
and a 0% expected dividend yield.
Stock-based
compensation expense recognized for the years ended December 31, 2009 and 2008
was $2.6 million and $11.3 million, respectively. No stock-based compensation
expense was recognized for the year ended December 31, 2007. We cannot predict
with certainty the impact of stock-compensation expense to be recognized in the
future because the actual amount of stock-based compensation expense we record
in any fiscal period will be dependent on a number of factors, including the
number of shares subject to the stock awards issued, the fair value of our
common stock at the time of issuance and the expected volatility of our stock
price over time. However, based on awards we currently expect to make in 2010,
stock-based compensation for the year ended December 31, 2010 is projected to be
approximately $3.4 million.
Recent
Pronouncements
See Note
4 to our Consolidated Financial Statements for a discussion of recently issued
accounting pronouncements.
40
|
ITEM 7A.
|
QUANTITATIVE
AND QUALITATIVE DISCLOSURES ABOUT MARKET
RISK
|
We are
exposed to market risk from changes in interest rates, foreign currency exchange
rates and commodity prices that could impact our results of operations and
financial condition. We address our exposure to these risks through our normal
operating and financing activities.
Information
concerning market risk for the year ended December 31, 2009 is discussed
below.
Interest
Rate Risk
We are
subject to exposure from changes in interest rates based on our financing
activities. Under our credit facility, all of our borrowings at
December 31, 2009 are variable rate facilities based on LIBOR or EURIBOR.
In order to mitigate our interest rate risk, we periodically enter into interest
rate swap or collar agreements. A hypothetical increase in the interest rate of
1.00% during 2009 on our variable rate debt that is not hedged would have
increased our interest cost by approximately $0.2 million.
On June
24, 2008, we entered into an interest rate swap with an aggregate notional value
of $75.0 million whereby we exchanged our LIBOR-based variable rate interest for
a fixed rate of 4.1375%. The notional value decreases to $50.0
million and then $25.0 million on June 30, 2010 and June 30, 2011, respectively
and expires on June 29, 2012. The fair value of the swap agreement, based on
third-party quotes, was a liability of $3.0 million at December 31,
2009. The swap agreement has been designated as a cash flow hedge,
and therefore changes in its fair value are recorded as an adjustment to other
comprehensive income.
Exchange
Rate Risk
We have
manufacturing sites throughout the world and sell our products globally. As
a result, we are exposed to movements in the exchange rates of various
currencies against the U.S. dollar and against the currencies of other
countries in which we manufacture and sell products and services. During
2009, approximately 66% of our sales were derived from operations outside the
U.S., with approximately 63% generated from our European operations. In
particular, we have more sales in European currencies than we have expenses in
those currencies. Therefore, when European currencies strengthen or weaken
against the U.S. dollar, operating profits are increased or decreased,
respectively. To assist with the matching of revenues and expenses and assets
and liabilities in foreign currencies, we may periodically enter into derivative
instruments such as cross currency swaps or forward contracts. To illustrate the
potential impact of changes in foreign currency exchange rates, assuming a 10%
increase in average foreign exchange rates compared to the U.S. dollar, 2009
income before income taxes would have increased by $3.1 million.
Commodity
Price Risk
We are
exposed to changes in the prices of raw materials used in our production
processes. Commodity futures contracts are periodically used to manage such
exposure. As of December 31, 2009, we had no open commodity futures
contracts.
41
|
ITEM 8.
|
FINANCIAL
STATEMENTS AND SUPPLEMENTARY DATA
|
INDEX
TO FINANCIAL STATEMENTS
|
Page
|
||
|
Audited
Financial Statements for the Years Ended December 31, 2009, 2008 and
2007:
|
||
|
Report
of Ernst & Young LLP, Independent Registered Public Accounting Firm,
on Internal Control Over Financial Reporting
|
43
|
|
|
Report
of Ernst & Young LLP, Independent Registered Public Accounting
Firm
|
45
|
|
|
Consolidated
Statements of Operations
|
46
|
|
|
Consolidated
Balance Sheets
|
47
|
|
|
Consolidated
Statements of Shareholders’ Equity and Comprehensive Income
(Loss)
|
48
|
|
|
Consolidated
Statements of Cash Flows
|
49
|
|
|
Notes
to Consolidated Financial Statements
|
50
|
42
Report
of Ernst & Young LLP, Independent Registered Public Accounting
Firm,
on
Internal Control Over Financial Reporting
The Board
of Directors and Shareholders of Colfax Corporation
We have
audited Colfax Corporation’s internal control over financial
reporting as of December 31, 2009, based on criteria established in Internal
Control—Integrated Framework issued by the Committee of Sponsoring Organizations
of the Treadway Commission (the COSO criteria). Colfax Corporation’s management
is responsible for maintaining effective internal control over financial
reporting, and for its assessment of the effectiveness of internal control over
financial reporting included in the accompanying Management’s Report on Internal
Control over Financial Reporting. Our responsibility is to express an opinion on
the company’s internal control over financial reporting based on our
audit.
We
conducted our audit in accordance with the standards of the Public Company
Accounting Oversight Board (United States). Those standards require that we plan
and perform the audit to obtain reasonable assurance about whether effective
internal control over financial reporting was maintained in all material
respects. Our audit included obtaining an understanding of internal control over
financial reporting, assessing the risk that a material weakness exists, testing
and evaluating the design and operating effectiveness of internal control based
on the assessed risk, and performing such other procedures as we considered
necessary in the circumstances. We believe that our audit provides a reasonable
basis for our opinion.
A
company’s internal control over financial reporting is a process designed to
provide reasonable assurance regarding the reliability of financial reporting
and the preparation of financial statements for external purposes in accordance
with generally accepted accounting principles. A company’s internal control over
financial reporting includes those policies and procedures that (1) pertain to
the maintenance of records that, in reasonable detail, accurately and fairly
reflect the transactions and dispositions of the assets of the company; (2)
provide reasonable assurance that transactions are recorded as necessary to
permit preparation of financial statements in accordance with generally accepted
accounting principles, and that receipts and expenditures of the company are
being made only in accordance with authorizations of management and directors of
the company; and (3) provide reasonable assurance regarding prevention or timely
detection of unauthorized acquisition, use, or disposition of the company’s
assets that could have a material effect on the financial
statements.
Because
of its inherent limitations, internal control over financial reporting may not
prevent or detect misstatements. Also, projections of any evaluation of
effectiveness to future periods are subject to the risk that controls may become
inadequate because of changes in conditions, or that the degree of compliance
with the policies or procedures may deteriorate.
In our
report dated February 25, 2010, we expressed an unqualified opinion that the
Company maintained, in all material respects, effective internal control over
financial reporting as of December 31, 2009, based on the COSO criteria.
Management has subsequently determined that a deficiency in controls relating to
the maintenance and review of pension plan participant data existed as of the
previous assessment date, and has further concluded that such deficiency
represented a material weakness as of December 31, 2009. As a
result, management has revised its assessment, as presented in the accompanying
Management’s Report on Internal Control over Financial Reporting, to conclude
that the Company’s internal control over financial reporting was not effective
as of December 31, 2009. Accordingly, our present opinion on the
effectiveness of the Company’s internal control over financial reporting as of
December 31, 2009, as expressed herein, is different from that expressed in
our previous report.
A
material weakness is a deficiency, or combination of deficiencies, in internal
control over financial reporting, such that there is a reasonable possibility
that a material misstatement of the company’s annual or interim financial
statements will not be prevented or detected on a timely basis. The
following material weakness has been identified and included in management’s
assessment. Management has identified a material weakness in its
internal controls related to the maintenance and review of pension plan
participant data. This material weakness resulted in the restatement
of the Company’s consolidated financial statements as of and for the years ended
December 31, 2007, 2008 and 2009. We have also audited, in accordance
with the standards of the Public Accounting Oversight Board (United States), the
consolidated balance sheets of Colfax Corporation as of December 31, 2009 and
2008 and the related consolidated statements of income, shareholder’s equity
(deficit) and cash flows for each of the three years in the period ending
December 31, 2009. This material weakness was considered in
determining the nature, timing, and extent of audit tests applied in our audit
of the 2009 financial statements and this report does not affect our report
dated February 25, 2010, except for the effects of the matters described in Note
2, as to which the date is December 13, 2010, on those financial statements (as
restated).
43
In our
opinion, because of the effect of the material weakness described above on the
achievement of the objectives of the control criteria, Colfax Corporation has
not maintained effective internal control over financial reporting as of
December 31, 2009, based on the COSO criteria.
/s/ Ernst
& Young LLP
Richmond,
Virginia
February
25, 2010
except for the effects of the material weakness described in the
sixth paragraph above, as to which the date is
December 13, 2010
44
Report
of Ernst & Young LLP, Independent Registered Public Accounting
Firm
The Board
of Directors and Shareholders of Colfax Corporation
We have
audited the accompanying consolidated balance sheets of Colfax Corporation as of
December 31, 2009 and 2008, and the related consolidated statements of income,
shareholders’ equity (deficit), and cash flows for each of the three years in
the period ended December 31, 2009. Our audits also included the financial
statement schedule listed in the Index at Item 15(a). These financial
statements and schedule are the responsibility of the Company’s management. Our
responsibility is to express an opinion on these financial statements and
schedule based on our audits.
We
conducted our audits in accordance with the standards of the Public Company
Accounting Oversight Board (United States). Those standards require
that we plan and perform the audit to obtain reasonable assurance about whether
the financial statements are free of material misstatement. An audit includes
examining, on a test basis, evidence supporting the amounts and disclosures in
the financial statements. An audit also includes assessing the accounting
principles used and significant estimates made by management, as well as
evaluating the overall financial statement presentation. We believe that our
audits provide a reasonable basis for our opinion.
In our
opinion, the financial statements referred to above present fairly, in all
material respects, the consolidated financial position of Colfax Corporation at
December 31, 2009 and 2008, and the consolidated results of its operations and
its cash flows for each of the three years in the period ended December 31,
2009, in conformity with U.S. generally accepted accounting
principles. Also, in our opinion, the related financial statement
schedule, when considered in relation to the basic financial statements taken as
a whole, presents fairly in all material respects the information set forth
therein.
As more
fully discussed in Note 2, the Company has restated the accompanying
consolidated financial statements and financial statement schedule for all
periods presented to correct an error in accounting for certain of its defined
benefit pension plans.
We also
have audited, in accordance with the standards of the Public Company Accounting
Oversight Board (United States), Colfax Corporation’s internal control over
financial reporting as of December 31, 2009, based on criteria established in
Internal Control—Integrated Framework issued by the Committee of Sponsoring
Organizations of the Treadway Commission and our report dated February 25, 2010,
except for the effects of the material weakness described in the sixth paragraph
of that report, as to which the date is December 13, 2010, expressed an adverse
opinion thereon.
/s/ Ernst
& Young LLP
Richmond,
Virginia
February
25, 2010
except for the effects of the matters described in Note 2, as to
which the date is
December 13, 2010
45
COLFAX
CORPORATION
CONSOLIDATED
STATEMENTS OF OPERATIONS
Dollars
in thousands, except per share amounts
|
Year ended
December 31,
|
||||||||||||
|
2009
|
2008
|
2007
|
||||||||||
|
Restated
|
Restated
|
Restated
|
||||||||||
|
Net
sales
|
$ | 525,024 | $ | 604,854 | $ | 506,305 | ||||||
|
Cost
of sales
|
339,237 | 387,667 | 330,714 | |||||||||
|
Gross
profit
|
185,787 | 217,187 | 175,591 | |||||||||
|
Selling,
general and administrative expenses
|
112,503 | 124,105 | 97,426 | |||||||||
|
Restructuring
and other related charges
|
18,175 | - | - | |||||||||
|
Initial
public offering related costs
|
- | 57,017 | - | |||||||||
|
Research
and development expenses
|
5,930 | 5,856 | 4,162 | |||||||||
|
Asbestos
liability and defense income
|
(2,193 | ) | (4,771 | ) | (63,978 | ) | ||||||
|
Asbestos
coverage litigation expenses
|
11,742 | 17,162 | 13,632 | |||||||||
|
Operating
income
|
39,630 | 17,818 | 124,349 | |||||||||
|
Interest
expense
|
7,212 | 11,822 | 19,246 | |||||||||
|
Income
before income taxes
|
32,418 | 5,996 | 105,103 | |||||||||
|
Provision
for income taxes
|
8,621 | 5,465 | 39,457 | |||||||||
|
Net
income
|
23,797 | 531 | 65,646 | |||||||||
|
Dividends
on preferred stock
|
- | (3,492 | ) | (25,816 | ) | |||||||
|
Net
income (loss) available to common shareholders
|
$ | 23,797 | $ | (2,961 | ) | $ | 39,830 | |||||
|
Net
income (loss) per share—basic and diluted
|
$ | 0.55 | $ | (0.08 | ) | $ | 1.82 | |||||
See
accompanying notes to consolidated financial statements.
46
COLFAX
CORPORATION
CONSOLIDATED
BALANCE SHEETS
Dollars
in thousands, except per share amounts
|
December 31,
|
||||||||
|
2009
|
2008
|
|||||||
|
Restated
|
Restated
|
|||||||
|
ASSETS
|
||||||||
|
CURRENT
ASSETS:
|
||||||||
|
Cash
and cash equivalents
|
$ | 49,963 | $ | 28,762 | ||||
|
Trade
receivables, less allowance for doubtful accounts of $2,837 and
$2,486
|
88,493 | 101,064 | ||||||
|
Inventories,
net
|
71,150 | 80,327 | ||||||
|
Deferred
income taxes, net
|
7,114 | 6,489 | ||||||
|
Asbestos
insurance asset
|
31,502 | 26,473 | ||||||
|
Asbestos
insurance receivable
|
28,991 | 36,371 | ||||||
|
Prepaid
expenses
|
11,109 | 9,632 | ||||||
|
Other
current assets
|
2,426 | 5,901 | ||||||
|
Total
current assets
|
290,748 | 295,019 | ||||||
|
Deferred
income taxes, net
|
51,838 | 53,372 | ||||||
|
Property,
plant and equipment, net
|
92,090 | 92,090 | ||||||
|
Goodwill
|
163,418 | 161,694 | ||||||
|
Intangible
assets, net
|
11,952 | 13,516 | ||||||
|
Long-term
asbestos insurance asset
|
357,947 | 277,542 | ||||||
|
Long-term
asbestos insurance receivable
|
16,876 | - | ||||||
|
Deferred
loan costs, pension and other assets
|
14,532 | 14,317 | ||||||
|
Total
assets
|
$ | 999,401 | $ | 907,550 | ||||
|
LIABILITIES
AND SHAREHOLDERS’ EQUITY
|
||||||||
|
CURRENT
LIABILITIES:
|
||||||||
|
Current
portion of long-term debt and capital leases
|
$ | 8,969 | $ | 5,420 | ||||
|
Accounts
payable
|
36,579 | 52,138 | ||||||
|
Accrued
asbestos liability
|
34,866 | 28,574 | ||||||
|
Accrued
payroll
|
17,756 | 19,162 | ||||||
|
Accrued
taxes
|
2,154 | 11,457 | ||||||
|
Accrued
termination benefits
|
9,473 | - | ||||||
|
Other
accrued liabilities
|
34,402 | 37,535 | ||||||
|
Total
current liabilities
|
144,199 | 154,286 | ||||||
|
Long-term
debt, less current portion
|
82,516 | 91,701 | ||||||
|
Long-term
asbestos liability
|
408,903 | 328,684 | ||||||
|
Pension
and accrued post-retirement benefits
|
105,230 | 110,218 | ||||||
|
Deferred
income tax liability
|
10,375 | 7,685 | ||||||
|
Other
liabilities
|
31,353 | 33,601 | ||||||
|
Total
liabilities
|
782,576 | 726,175 | ||||||
|
Shareholders’
equity:
|
||||||||
|
Common
stock: $0.001 par value; authorized 200,000,000; issued and outstanding
43,229,104 and 43,211,026
|
43 | 43 | ||||||
|
Additional
paid-in capital
|
402,852 | 400,259 | ||||||
|
Retained
deficit
|
(76,273 | ) | (100,070 | ) | ||||
|
Accumulated
other comprehensive loss
|
(109,797 | ) | (118,857 | ) | ||||
|
Total
shareholders’ equity
|
216,825 | 181,375 | ||||||
|
Total
liabilities and shareholders' equity
|
$ | 999,401 | $ | 907,550 | ||||
See
accompanying notes to consolidated financial statements.
47
COLFAX
CORPORATION
CONSOLIDATED
STATEMENTS OF SHAREHOLDERS’ EQUITY AND
COMPREHENSIVE
INCOME (LOSS)
Years
ended December 31, 2009, 2008 and 2007
Dollars
in thousands
|
Preferred
Stock
|
Common
Stock
|
Additional
Paid-In
Capital
|
Retained
Deficit
(Restated)
|
Accumulated
Other
Comprehensive
Loss (Restated)
|
Total
(Restated)
|
|||||||||||||||||||
|
Balance
as previously reported at December 31, 2006
|
$ | 1 | $ | 22 | $ | 201,660 | $ | (141,561 | ) | $ | (54,223 | ) | $ | 5,899 | ||||||||||
|
Cumulative
adjustment for restatement (see Note 2)
|
11,365 | 1,751 | 13,116 | |||||||||||||||||||||
|
Restated
Balance at December 31, 2006
|
1 | 22 | 201,660 | (130,196 | ) | (52,472 | ) | 19,015 | ||||||||||||||||
|
Comprehensive
income:
|
||||||||||||||||||||||||
|
Net
income
|
- | - | - | 65,646 | - | 65,646 | ||||||||||||||||||
|
Foreign
currency translation, net of $265 tax expense
|
- | - | - | - | 8,952 | 8,952 | ||||||||||||||||||
|
Changes
in unrecognized pension and postretirement benefit costs, net of $4,158
tax expense
|
- | - | - | - | 3,900 | 3,900 | ||||||||||||||||||
|
Amounts
reclassified to net income:
|
||||||||||||||||||||||||
|
Net
realized investment gains, net of $409 tax benefit
|
- | - | - | - | (667 | ) | (667 | ) | ||||||||||||||||
|
Net
pension and other postretirement benefit costs, net of $1,590 tax
expense
|
- | - | - | - | 2,149 | 2,149 | ||||||||||||||||||
|
Total
comprehensive income
|
- | - | - | 65,646 | 14,334 | 79,980 | ||||||||||||||||||
|
Adoption
of new accounting standard (see Note 6)
|
- | - | - | (6,743 | ) | - | (6,743 | ) | ||||||||||||||||
|
Preferred
dividends declared
|
- | - | - | (25,816 | ) | - | (25,816 | ) | ||||||||||||||||
|
Balance
at December 31, 2007
|
1 | 22 | 201,660 | (97,109 | ) | (38,138 | ) | 66,436 | ||||||||||||||||
|
Comprehensive
income (loss):
|
||||||||||||||||||||||||
|
Net
income
|
- | - | - | 531 | - | 531 | ||||||||||||||||||
|
Foreign
currency translation, net of $-0- tax
|
- | - | - | - | (10,662 | ) | (10,662 | ) | ||||||||||||||||
|
Unrealized
losses on hedging activities, net of $-0- tax
|
- | - | - | - | (5,815 | ) | (5,815 | ) | ||||||||||||||||
|
Changes
in unrecognized pension and postretirement benefit costs, net of $1,731
tax benefit
|
- | - | - | - | (67,630 | ) | (67,630 | ) | ||||||||||||||||
|
Amounts
reclassified to net income:
|
||||||||||||||||||||||||
|
Losses
on hedging activities, net of $-0- tax
|
- | - | - | - | 766 | 766 | ||||||||||||||||||
|
Net
pension and other postretirement benefit costs, net of $128 tax
expense
|
- | - | - | - | 2,622 | 2,622 | ||||||||||||||||||
|
Total
comprehensive loss
|
- | - | - | 531 | (80,719 | ) | (80,188 | ) | ||||||||||||||||
|
Net
proceeds from initial public offering and conversion of preferred
stock
|
(1 | ) | 22 | 192,999 | - | - | 193,020 | |||||||||||||||||
|
Stock
repurchase
|
- | (1 | ) | (5,730 | ) | - | - | (5,731 | ) | |||||||||||||||
|
Stock-based
compensation
|
- | - | 11,330 | - | - | 11,330 | ||||||||||||||||||
|
Preferred
dividends declared
|
- | - | - | (3,492 | ) | - | (3,492 | ) | ||||||||||||||||
|
Balance
at December 31, 2008
|
- | 43 | 400,259 | (100,070 | ) | (118,857 | ) | 181,375 | ||||||||||||||||
|
Comprehensive
income:
|
||||||||||||||||||||||||
|
Net
income
|
- | - | - | 23,797 | - | 23,797 | ||||||||||||||||||
|
Foreign
currency translation, net of $7 tax benefit
|
- | - | - | - | 5,401 | 5,401 | ||||||||||||||||||
|
Unrealized
gains on hedging activities, net of $-0- tax
|
- | - | - | - | (866 | ) | (866 | ) | ||||||||||||||||
|
Changes
in unrecognized pension and postretirement benefit costs, net of $572 tax
benefit
|
- | - | - | - | (910 | ) | (910 | ) | ||||||||||||||||
|
Amounts
reclassified to net income:
|
||||||||||||||||||||||||
|
Losses
on hedging activities, net of $-0- tax
|
- | - | - | - | 2,881 | 2,881 | ||||||||||||||||||
|
Net
pension and other postretirement benefit costs, net of $1,438 tax
expense
|
- | - | - | - | 2,554 | 2,554 | ||||||||||||||||||
|
Total
comprehensive income
|
- | - | - | 23,797 | 9,060 | 32,857 | ||||||||||||||||||
|
Stock-based
compensation
|
- | - | 2,593 | - | - | 2,593 | ||||||||||||||||||
|
Balance
at December 31, 2009
|
$ | - | $ | 43 | $ | 402,852 | $ | (76,273 | ) | $ | (109,797 | ) | $ | 216,825 | ||||||||||
See
accompanying notes to consolidated financial statements.
48
COLFAX
CORPORATION
CONSOLIDATED
STATEMENTS OF CASH FLOWS
Dollars
in thousands
|
Year ended
December 31,
|
||||||||||||
|
2009
|
2008
|
2007
|
||||||||||
|
Restated
|
Restated
|
Restated
|
||||||||||
|
Cash
flows from operating activities:
|
||||||||||||
|
Net
income
|
$ | 23,797 | $ | 531 | $ | 65,646 | ||||||
|
Adjustments
to reconcile net income to cash provided by (used in) operating
activities:
|
||||||||||||
|
Depreciation,
amortization and fixed asset impairment charges
|
15,074 | 14,788 | 15,239 | |||||||||
|
Noncash
stock-based compensation
|
2,593 | 11,330 | - | |||||||||
|
Write
off of deferred loan costs
|
- | 4,614 | - | |||||||||
|
Amortization
of deferred loan costs
|
677 | 934 | 1,644 | |||||||||
|
Loss
(gain) on sale of fixed assets
|
(64 | ) | 60 | (35 | ) | |||||||
|
Deferred
income taxes
|
2,689 | (13,330 | ) | 22,496 | ||||||||
|
Changes
in operating assets and liabilities, net of acquisitions:
|
||||||||||||
|
Trade
receivables
|
16,280 | (20,612 | ) | (3,149 | ) | |||||||
|
Inventories
|
10,763 | (15,556 | ) | (2,279 | ) | |||||||
|
Accounts
payable and accrued liabilities, excluding asbestos related accrued
expenses
|
(20,899 | ) | 7,044 | 8,748 | ||||||||
|
Other
current assets
|
2,605 | (3,285 | ) | (2,304 | ) | |||||||
|
Change
in asbestos liability and asbestos-related accrued expenses, net of
asbestos insurance asset and receivable
|
(10,166 | ) | (9,457 | ) | (27,807 | ) | ||||||
|
Changes
in other operating assets and liabilities
|
(5,063 | ) | (10,042 | ) | (3,716 | ) | ||||||
|
Net
cash provided by (used in) operating activities
|
38,286 | (32,981 | ) | 74,483 | ||||||||
|
Cash
flows from investing activities:
|
||||||||||||
|
Purchases
of fixed assets
|
(11,006 | ) | (18,645 | ) | (13,671 | ) | ||||||
|
Acquisitions,
net of cash received
|
(1,260 | ) | (439 | ) | (32,987 | ) | ||||||
|
Proceeds
from sale of fixed assets
|
219 | 23 | 133 | |||||||||
|
Net
cash used in investing activities
|
(12,047 | ) | (19,061 | ) | (46,525 | ) | ||||||
|
Cash
flows from financing activities:
|
||||||||||||
|
Borrowings
under term credit facility
|
- | 100,000 | 55,000 | |||||||||
|
Payments
under term credit facility
|
(5,000 | ) | (210,278 | ) | (11,791 | ) | ||||||
|
Proceeds
from borrowings on revolving credit facilities
|
- | 28,185 | 58,000 | |||||||||
|
Repayments
of borrowings on revolving credit facilities
|
- | (28,158 | ) | (86,500 | ) | |||||||
|
Payments
on capital leases
|
(417 | ) | (309 | ) | (449 | ) | ||||||
|
Payments
for loan costs
|
- | (3,347 | ) | (1,368 | ) | |||||||
|
Payment
of deferred stock issuance costs
|
- | - | (1,155 | ) | ||||||||
|
Proceeds
from the issuance of common stock, net of offering costs
|
- | 193,020 | - | |||||||||
|
Repurchases
of common stock
|
- | (5,731 | ) | - | ||||||||
|
Dividends
paid to preferred shareholders
|
- | (38,546 | ) | - | ||||||||
|
Net
cash (used in) provided by financing activities
|
(5,417 | ) | 34,836 | 11,737 | ||||||||
|
Effect
of exchange rates on cash
|
379 | (2,125 | ) | 790 | ||||||||
|
Increase
(decrease) in cash and cash equivalents
|
21,201 | (19,331 | ) | 40,485 | ||||||||
|
Cash
and cash equivalents, beginning of year
|
28,762 | 48,093 | 7,608 | |||||||||
|
Cash
and cash equivalents, end of year
|
$ | 49,963 | $ | 28,762 | $ | 48,093 | ||||||
|
Cash
interest paid
|
$ | 6,615 | $ | 9,970 | $ | 16,978 | ||||||
|
Cash
income taxes paid
|
$ | 16,596 | $ | 18,534 | $ | 12,931 | ||||||
See
accompanying notes to consolidated financial statements.
49
COLFAX
CORPORATION
NOTES
TO CONSOLIDATED FINANCIAL STATEMENTS
December 31,
2009, 2008 and 2007
Dollars
in thousands, unless otherwise noted
1.
Organization and Nature of Operations
Colfax
Corporation (the “Company”, “Colfax”, “we”, “our” or “us”) is a global supplier
of a broad range of fluid handling products, including pumps, fluid handling
systems and controls, and specialty valves. We believe that we are a leading
manufacturer of rotary positive displacement pumps, which include screw pumps,
gear pumps and progressive cavity pumps. We have a global manufacturing
footprint, with production facilities in Europe, North America and Asia, as well
as worldwide sales and distribution channels. Our products serve a variety of
applications in five strategic markets: commercial marine, oil and gas, power
generation, global navy and general industrial. We design and engineer our
products to high quality and reliability standards for use in critical fluid
handling applications where performance is paramount. We also offer customized
fluid handling solutions to meet individual customer needs based on our in-depth
technical knowledge of the applications in which our products are used. Our
products are marketed principally under the Allweiler, Fairmount, Houttuin, Imo,
LSC, Portland Valve, Tushaco, Warren, and Zenith brand names. We believe that
our brands are widely known and have a premium position in our industry.
Allweiler, Houttuin, Imo and Warren are among the oldest and most recognized
brands in the fluid handling industry, with Allweiler dating back to
1860.
2.
Restatement
On
October 19, 2010, the Audit Committee of the Company’s Board of Directors
concluded, based upon the recommendation of the Company’s management, that the
Company should restate these financial statements to correct an overstatement of
its pension liability. The Company has restated all periods in the accompanying
consolidated financial statements.
While
preparing the 2010 census data for our defined benefit pension plan actuarial
valuations, the Company determined that previous actuarial valuations for the
plans of a U.S. subsidiary contained errors in participant data. The errors
largely originated in census data compiled by the subsidiary’s former actuaries
prior to our acquisition of the subsidiary in 1997. Because these
errors affected the valuation of pension liabilities at the date of the
acquisition, goodwill was also overstated.
This
amendment also contains two immaterial balance sheet reclassification
corrections at December 31, 2009 to reclassify a portion of the asbestos
insurance asset from long term to current and to reflect certain property
previously recorded in other assets as property, plant and
equipment.
The
following tables set forth the effects of the restatement on affected line items
within the Company’s previously reported financial statements. The income tax
effects of the restatement include the effects of reductions to the valuation
allowance for deferred tax assets as a result of the reduction in grross
deferred tax assets (See Note 6, Income Taxes):
CONSOLIDATED
STATEMENTS OF OPERATIONS
|
|
Year Ended
|
|||||||||||
|
December 31, 2009
|
||||||||||||
|
As
|
||||||||||||
|
Previously
|
As
|
|||||||||||
|
Reported
|
Adjustment
|
Restated
|
||||||||||
|
Selling,
general and administrative expenses
|
$ | 113,674 | $ | (1,171 | ) | $ | 112,503 | |||||
|
Operating
income
|
38,459 | 1,171 | 39,630 | |||||||||
|
Income
before income taxes
|
31,247 | 1,171 | 32,418 | |||||||||
|
Provision
for income taxes
|
9,525 | (904 | ) | 8,621 | ||||||||
|
Net
income
|
21,722 | 2,075 | 23,797 | |||||||||
|
Net
income available to common shareholders
|
21,722 | 2,075 | 23,797 | |||||||||
|
Net
income per share—basic and diluted
|
$ | 0.50 | $ | 0.05 | $ | 0.55 | ||||||
50
|
Year
Ended
|
||||||||||||
|
December 31, 2008
|
||||||||||||
|
As
|
||||||||||||
|
Previously
|
As
|
|||||||||||
|
Reported
|
Adjustment
|
Restated
|
||||||||||
|
Selling,
general and administrative expenses
|
$ | 125,234 | $ | (1,129 | ) | $ | 124,105 | |||||
|
Operating
income
|
16,689 | 1,129 | 17,818 | |||||||||
|
Income
before income taxes
|
4,867 | 1,129 | 5,996 | |||||||||
|
Provision
for income taxes
|
5,438 | 27 | 5,465 | |||||||||
|
Net
(loss) income
|
(571 | ) | 1,102 | 531 | ||||||||
|
Net
(loss) income available to common shareholders
|
(4,063 | ) | 1,102 | (2,961 | ) | |||||||
|
Net
(loss) income per share—basic and diluted
|
$ | (0.11 | ) | $ | 0.03 | $ | (0.08 | ) | ||||
|
Year
Ended
|
||||||||||||
|
December 31, 2007
|
||||||||||||
|
As
|
||||||||||||
|
Previously
|
As
|
|||||||||||
|
Reported
|
Adjustment
|
Restated
|
||||||||||
|
Selling,
general and administrative expenses
|
$ | 98,500 | $ | (1,074 | ) | $ | 97,426 | |||||
|
Operating
income
|
123,275 | 1,074 | 124,349 | |||||||||
|
Income
before income taxes
|
104,029 | 1,074 | 105,103 | |||||||||
|
Provision
for income taxes
|
39,147 | 310 | 39,457 | |||||||||
|
Net
income
|
64,882 | 764 | 65,646 | |||||||||
|
Net
income available to common shareholders
|
39,066 | 764 | 39,830 | |||||||||
|
Net
income per share—basic and diluted
|
$ | 1.79 | $ | 0.03 | $ | 1.82 | ||||||
CONSOLIDATED
BALANCE SHEETS
|
December 31, 2009
|
December 31, 2008
|
|||||||||||||||||||||||
|
As
|
As
|
|||||||||||||||||||||||
|
Previously
|
Adjustment and
|
As
|
Previously
|
As
|
||||||||||||||||||||
|
Reported
|
Reclassifications
|
Restated
|
Reported
|
Adjustment
|
Restated
|
|||||||||||||||||||
|
Deferred
income taxes, net
|
$ | 6,823 | $ | 291 | $ | 7,114 | $ | 6,327 | $ | 162 | $ | 6,489 | ||||||||||||
|
Asbestos
insurance asset
|
30,606 | 896 | 31,502 | 26,473 | - | 26,473 | ||||||||||||||||||
|
Total
current assets
|
289,561 | 1,187 | 290,748 | 294,857 | 162 | 295,019 | ||||||||||||||||||
|
Deferred
income taxes, net
|
52,023 | (185 | ) | 51,838 | 53,428 | (56 | ) | 53,372 | ||||||||||||||||
|
Property,
plant and equipment, net
|
90,434 | 1,656 | 92,090 | 92,090 | - | 92,090 | ||||||||||||||||||
|
Goodwill
|
167,254 | (3,836 | ) | 163,418 | 165,530 | (3,836 | ) | 161,694 | ||||||||||||||||
|
Long-term
asbestos insurance asset
|
358,843 | (896 | ) | 357,947 | 277,542 | - | 277,542 | |||||||||||||||||
|
Deferred
loan costs, pension and other assets
|
16,188 | (1,656 | ) | 14,532 | 16,113 | (1,796 | ) | 14,317 | ||||||||||||||||
|
Total
assets
|
1,003,131 | (3,730 | ) | 999,401 | 913,076 | (5,526 | ) | 907,550 | ||||||||||||||||
|
Pension
and accrued post-retirement benefits
|
126,953 | (21,723 | ) | 105,230 | 130,188 | (19,970 | ) | 110,218 | ||||||||||||||||
|
Total
liabilities
|
804,299 | (21,723 | ) | 782,576 | 746,145 | (19,970 | ) | 726,175 | ||||||||||||||||
|
Retained
deficit
|
(91,579 | ) | 15,306 | (76,273 | ) | (113,301 | ) | 13,231 | (100,070 | ) | ||||||||||||||
|
Accumulated
other comprehensive loss
|
(112,484 | ) | 2,687 | (109,797 | ) | (120,070 | ) | 1,213 | (118,857 | ) | ||||||||||||||
|
Total
shareholders’ equity
|
198,832 | 17,993 | 216,825 | 166,931 | 14,444 | 181,375 | ||||||||||||||||||
|
Total
liabilities and shareholders' equity
|
$ | 1,003,131 | $ | (3,730 | ) | $ | 999,401 | $ | 913,076 | $ | (5,526 | ) | $ | 907,550 | ||||||||||
The
cumulative adjustment to retained deficit as of January 1, 2008 was a decrease
of $12.1 million.
51
CONSOLIDATED
STATEMENTS OF CASH FLOWS
|
Year
Ended
|
||||||||||||
|
December 31, 2009
|
||||||||||||
|
As
|
||||||||||||
|
Previously
|
As
|
|||||||||||
|
Reported
|
Adjustment
|
Restated
|
||||||||||
|
Cash
flows from operating activities:
|
||||||||||||
|
Net
income
|
$ | 21,722 | $ | 2,075 | $ | 23,797 | ||||||
|
Deferred
income taxes
|
3,593 | (904 | ) | 2,689 | ||||||||
|
Accounts
payable and accrued liabilities, excluding asbestos
|
(20,899 | ) | - | (20,899 | ) | |||||||
|
Changes
in other operating assets and liabilities
|
(3,892 | ) | (1,171 | ) | (5,063 | ) | ||||||
|
Net
cash provided by (used in) operating activities
|
38,386 | - | 38,386 | |||||||||
|
Year
Ended
|
||||||||||||
|
December 31, 2008
|
||||||||||||
|
As
|
||||||||||||
|
Previously
|
As
|
|||||||||||
|
Reported
|
Adjustment
|
Restated
|
||||||||||
|
Cash
flows from operating activities:
|
||||||||||||
|
Net
income
|
$ | (571 | ) | $ | 1,102 | $ | 531 | |||||
|
Deferred
income taxes
|
(13,357 | ) | 27 | (13,330 | ) | |||||||
|
Accounts
payable and accrued liabilities, excluding asbestos
|
7,020 | 24 | 7,044 | |||||||||
|
Changes
in other operating assets and liabilities
|
(8,889 | ) | (1,153 | ) | (10,042 | ) | ||||||
|
Net
cash provided by (used in) operating activities
|
(32,981 | ) | - | (32,981 | ) | |||||||
|
Year
Ended
|
||||||||||||
|
December 31, 2007
|
||||||||||||
|
As
|
||||||||||||
|
Previously
|
As
|
|||||||||||
|
Reported
|
Adjustment
|
Restated
|
||||||||||
|
Cash
flows from operating activities:
|
||||||||||||
|
Net
income
|
$ | 64,882 | $ | 764 | $ | 65,646 | ||||||
|
Deferred
income taxes
|
22,186 | 310 | 22,496 | |||||||||
|
Accounts
payable and accrued liabilities, excluding asbestos
|
8,772 | (24 | ) | 8,748 | ||||||||
|
Changes
in other operating assets and liabilities
|
(2,666 | ) | (1,050 | ) | (3,716 | ) | ||||||
|
Net
cash provided by (used in) operating activities
|
74,483 | - | 74,483 | |||||||||
CONSOLIDATED
COMPREHENSIVE INCOME (LOSS)
|
As
|
||||||||||||
|
Previously
|
As
|
|||||||||||
|
Reported
|
Adjustment
|
Restated
|
||||||||||
|
Year
ended December 31, 2007
|
$ | 14,829 | $ | (495 | ) | $ | 14,334 | |||||
|
Year
ended December 31, 2008
|
$ | (80,676 | ) | $ | (43 | ) | $ | (80,719 | ) | |||
|
Year
ended December 31, 2009
|
$ | 7,586 | $ | 1,474 | $ | 9,060 | ||||||
52
3.
Summary of Significant Accounting Policies
Principles
of Consolidation
The
consolidated financial statements include the accounts of the Company and its
subsidiaries. The Company owns 44% of the common shares of Sistemas Centrales de
Lubricación S.A. de C.V., a Mexican company and 28% of the common shares of
Allweiler Al-Farid Pumps Company (S.A.E.), an Egyptian
Corporation. These investments are recorded in these financial
statements using the equity method of accounting. Accordingly, $6.6 million and
$5.4 million are recorded in other assets on the consolidated balance sheets at
December 31, 2009 and 2008, respectively. The Company records its share of these
investments’ net earnings, based on its economic ownership percentage.
Accordingly, $1.5 million of earnings from equity investments were included as a
reduction of selling, general and administrative expenses on the consolidated
statements of operations for each of the three years ended December 31, 2009,
2008 and 2007, respectively. All significant intercompany accounts
and transactions have been eliminated.
Revenue
Recognition
The
Company generally recognizes revenues and costs from product sales when all of
the following criteria are met: persuasive evidence of an arrangement
exists, the price is fixed and determinable, product delivery has occurred or
services have been rendered, there are no further obligations to customers, and
collectibility is probable. Product delivery occurs when title and risk of loss
transfer to the customer. The Company’s shipping terms vary based on the
contract. If any significant obligations to the customer with respect to such
sale remain to be fulfilled following shipments, typically involving obligations
relating to installation and acceptance by the buyer, revenue recognition is
deferred until such obligations have been fulfilled. Any customer allowances and
discounts are recorded as a reduction in reported revenues at the time of sale
because these allowances reflect a reduction in the sales price for the products
sold. These allowances and discounts are estimated based on historical
experience and known trends. Revenue related to service agreements is recognized
as revenue over the term of the agreement.
In some
cases, customer contracts may include multiple deliverables for product
shipments and installation or maintenance labor. The cost of the products is
generally quoted separately from the service costs, and the services that are
provided are available from other vendors. Revenues from product shipments on
this type of contract are recognized when title and risk of loss transfer to the
customer, and the service revenue components are recognized as services are
performed.
For
long-term contracts, revenue is generally recognized based on the
percentage-of-completion method calculated on the units of delivery basis or the
cost-to-cost basis. Percentage of completion revenue was approximately 2.2%,
0.9%, and 2.9% of consolidated revenues for the years ended December 31,
2009, 2008 and 2007, respectively. For long-term contracts in which reasonable
estimates cannot be made, the Company uses the completed contract
method.
Amounts
billed for shipping and handling are recorded as revenue. Shipping and handling
expenses are recorded as cost of sales. Progress billings are generally shown as
a reduction of inventory unless such billings are in excess of accumulated
costs, in which case such balances are included in accrued liabilities. The
Company accrues for bad debts, as a component of selling, general, and
administrative expenses, based upon estimates of amounts deemed uncollectible
and a specific review of significant delinquent accounts factoring in current
and expected economic conditions. Product return reserves are accrued at the
time of sale based on historical rates, and are recorded as a reduction to net
sales.
Taxes
Collected from Customers and Remitted to Governmental Authorities
The
Company collects various taxes and fees as an agent in connection with the sale
of products and remits these amounts to the respective taxing authorities. These
taxes and fees have been presented on a net basis in the consolidated statements
of operations and are recorded as a liability until remitted to the respective
taxing authority.
Research
and Development
Research
and development costs are expensed as incurred.
Advertising
Advertising
costs of $0.5 million, $0.9 million, and $0.6 million for years ending
December 31, 2009, 2008 and 2007, respectively, are expensed as incurred
and have been included in selling, general and administrative
expenses.
53
Cash
and Cash Equivalents
Cash and
cash equivalents include all financial instruments purchased with an initial
maturity of three months or less.
Trade
Receivables
Receivables
are presented net of allowances for doubtful accounts. The Company records the
allowance for doubtful accounts based on its best estimate of probable losses
incurred in the collection of accounts receivable. Estimated losses are based on
historical collection experience, and are reviewed periodically by
management.
Inventories
Inventories
include the costs of material, labor and overhead. Inventories are stated at the
lower of cost or market. Cost is primarily determined using the first-in,
first-out method. The Company periodically reviews its quantities of inventories
on hand and compares these amounts to the expected usage of each particular
product. The Company records as a charge to cost of sales any amounts required
to reduce the carrying value of inventories to net realizable
value.
Property,
Plant and Equipment
Property,
plant and equipment are stated at historical cost, which includes the fair
values of such assets acquired. Depreciation of property, plant and
equipment is provided for on a straight-line basis over estimated useful lives
ranging from three to 40 years. Assets recorded under capital leases are
amortized over the shorter of their estimated useful lives or the lease terms.
The estimated useful lives or lease terms of assets range from three to
40 years. Repairs and maintenance expenditures are expensed as incurred
unless the repair extends the useful life of the asset.
Impairment
of Goodwill and Indefinite-Lived Intangible Assets
Goodwill
represents the costs in excess of the fair value of net assets acquired
associated with acquisitions by the Company.
The
Company evaluates the recoverability of goodwill and indefinite-lived intangible
assets annually on December 31 or more frequently if an event occurs or
circumstances change in the interim that would more likely than not reduce the
fair value of the asset below its carrying amount. Goodwill is considered to be
impaired when the net book value of a reporting unit exceeds its estimated fair
value.
In the
evaluation of goodwill for impairment, the Company first compares the fair value
of the reporting unit to its carrying value. If the carrying value of a
reporting unit exceeds its fair value, the goodwill of that reporting unit is
potentially impaired and step two of the impairment analysis is performed. In
step two of the analysis, an impairment loss is recorded equal to the excess of
the carrying value of the reporting unit’s goodwill over its implied fair value
should such a circumstance arise.
The
Company measures fair value of reporting units based on a present value of
future discounted cash flows or a market valuation approach. The discounted cash
flows model indicates the fair value of the reporting units based on the present
value of the cash flows that the reporting units are expected to generate in the
future. Significant estimates in the discounted cash flows model include: the
weighted average cost of capital; long-term rate of growth and profitability of
our business; and working capital effects. The market valuation approach
indicates the fair value of the business based on a comparison of the Company
against certain market information. Significant estimates in the market approach
model include identifying appropriate market multiples and assessing earnings
before interest, income taxes, depreciation and amortization (EBITDA) in
estimating the fair value of the reporting units.
The
analysis performed for each of the years ended December 31, 2009, 2008 and 2007
indicated no impairment to be present.
Impairment
of Long-Lived Assets Other than Goodwill and Indefinite-Lived Intangible
Assets
Intangibles
primarily represent acquired customer relationships, acquired order backlog,
acquired technology, software license agreements and patents. Acquired order
backlog is amortized in the same period the corresponding revenue is recognized.
A portion of the Company’s acquired customer relationships is being amortized
over seven years based on the present value of the future cash flows expected to
be generated from the acquired customers. All other intangibles are being
amortized on a straight-line basis over their estimated useful lives, generally
ranging from three to 15 years.
54
The
Company assesses its long-lived assets other than goodwill and indefinite-lived
intangible assets for impairment whenever facts and circumstances indicate that
the carrying amounts may not be fully recoverable. To analyze recoverability,
the Company projects undiscounted net future cash flows over the remaining lives
of such assets. If these projected cash flows are less than the carrying
amounts, an impairment loss would be recognized, resulting in a write-down of
the assets with a corresponding charge to earnings. The impairment loss is
measured based upon the difference between the carrying amounts and the fair
values of the assets. Assets to be disposed of are reported at the lower of the
carrying amounts or fair value less cost to sell. Management determines fair
value using the discounted cash flow method or other accepted valuation
techniques. The Company recorded asset impairment losses totaling $0.6 million
in 2009 in connection with the closure of two facilities. No such impairments
were recorded in 2008 or 2007.
Derivatives
The
Company periodically enters into foreign currency, interest rate swap, and
commodity derivative contracts. The Company uses interest rate swaps to manage
exposure to interest rate fluctuations. Foreign currency contracts are used to
manage exchange rate fluctuations and generally hedge transactions between the
Euro and the U.S. dollar. Commodity futures contracts are used to manage
costs of raw materials used in the Company’s production processes.
The
Company enters into such contracts with financial institutions of good standing,
and the total credit exposure related to non-performance by those institutions
is not material to the operations of the Company. The Company does not enter
into contracts for trading purposes.
We
designate a portion of our derivative instruments as cash flow hedges for
accounting purposes. For all derivatives designated as hedges, we formally
document the relationship between the hedging instrument and the hedged item, as
well as the risk management objective and the strategy for using the hedging
instrument. We assess whether the hedging relationship between the
derivative and the hedged item is highly effective at offsetting changes in the
cash flows both at inception of the hedging relationship and on an ongoing
basis. Any change in the fair value of the derivative that is not effective at
offsetting changes in the cash flows or fair values of the hedged item is
recognized currently in earnings.
Interest
rate swaps and other derivative contracts are recognized on the balance sheet as
assets and liabilities, measured at fair value on a recurring basis using
significant observable inputs, which is Level 2 as defined in the fair value
hierarchy. For transactions in which we are hedging the variability of cash
flows, changes in the fair value of the derivative are reported in accumulated
other comprehensive income until earnings are affected by the hedged item.
Changes in the fair value of derivatives not designated as hedges are recognized
currently in earnings.
Self-Insurance
We are
self-insured for a portion of our product liability, workers’ compensation,
general liability, medical coverage and certain other liability exposures. The
Company accrues loss reserves up to the retention amounts when such amounts are
reasonably estimable and probable. The accompanying consolidated balance sheets
include estimated amounts for claims exposure based on experience factors and
management estimates for known and anticipated claims as follows:
|
December
31,
|
||||||||
|
2009
|
2008
|
|||||||
|
Medical
insurance
|
$ | 697 | $ | 563 | ||||
|
Workers'
compensation
|
189 | 173 | ||||||
|
Total
self-insurance reserves
|
$ | 886 | $ | 736 | ||||
Warranty
Costs
Estimated
expenses related to product warranties are accrued at the time products are sold
to customers and recorded as part of cost of sales. Estimates are established
using historical information as to the nature, frequency, and average costs of
warranty claims.
55
Warranty
activity for the years ended December 31, 2009 and 2008 consisted of the
following:
|
2009
|
2008
|
|||||||
|
Warranty
liability at beginning of the year
|
$ | 3,108 | $ | 2,971 | ||||
|
Accrued
warranty expense, net of adjustments
|
860 | 801 | ||||||
|
Changes
in estimates related to pre-existing warranties
|
(552 | ) | 374 | |||||
|
Cost
of warranty service work performed
|
(646 | ) | (869 | ) | ||||
|
Foreign
exchange translation effect
|
82 | (169 | ) | |||||
|
Warranty
liability at end of the year
|
$ | 2,852 | $ | 3,108 | ||||
Income
Taxes
Income
taxes for the Company are accounted for under the asset and liability method.
Deferred income tax assets and liabilities are recognized for the future tax
consequences attributable to differences between the financial statement
carrying amounts of existing assets and liabilities and their respective tax
bases. Deferred income tax assets and liabilities are measured using enacted tax
rates expected to apply to taxable income in the years in which those temporary
differences are expected to be recovered or settled. The effect on deferred
income tax assets and liabilities of a change in tax rates is generally
recognized in income in the period that includes the enactment
date.
Valuation
allowances are recorded if it is more likely than not that some portion of the
deferred tax asset will not be realized. In evaluating the need for a valuation
allowance, we take into account various factors, including the expected level of
future taxable income and available tax planning strategies. If actual results
differ from the assumptions made in the evaluation of our valuation allowance,
we record a change in valuation allowance through income tax expense or other
comprehensive income in the period such determination is made.
Foreign
Currency Exchange Gains and Losses
The
Company’s financial statements are presented in U.S. dollars. The
functional currencies of the Company’s operating subsidiaries are the local
currencies of the countries in which each subsidiary is located. Assets and
liabilities denominated in foreign currencies are translated at rates of
exchange in effect at the balance sheet date. Revenues and expenses are
translated at average rates of exchange in effect during the year. The amounts
recorded in each year are net of income taxes to the extent the underlying
equity balances in the entities are not deemed to be permanently
reinvested.
Transactions
in foreign currencies are translated at the exchange rate in effect at the
date of each transaction. Differences in exchange rates during the period
between the date a transaction denominated in a foreign currency is
consummated and the date on which it is either settled or translated for
inclusion in the consolidated balance sheets are recognized in the consolidated
statements of operations for that period. The foreign currency transaction gain
(loss) in income was $(1.4) million, $0.3 million, and $1.0 million for the
years ended December 31, 2009, 2008 and 2007, respectively.
Debt
Issuance Costs
Costs
directly related to the placement of debt are capitalized and amortized using
the straight-line method, which approximates the effective interest method over
the term of the related obligation. Amounts written off due to early
extinguishment of debt are charged to earnings. Cost and accumulated
amortization related to debt issuance costs amounted to approximately $3.4
million and $1.1 million, respectively, as of December 31, 2009 and $3.3 million
and $0.4 million, respectively, as of December 31, 2008.
Use
of Estimates
The
preparation of financial statements in conformity with accounting principles
generally accepted in the U.S. requires management to make estimates and
assumptions that affect the reported amounts of assets and liabilities and
disclosure of contingent assets and liabilities at the date of the financial
statements and the reported amounts of revenues and expenses for the periods
presented. Actual results could differ from those estimates.
56
Reclassifications
Certain
prior period amounts have been reclassified to conform to current year
presentations.
4.
Recent Accounting Pronouncements
In
October 2009, the Financial Accounting Standards Board issued Accounting
Standards Update (ASU) No. 2009-13, Multiple-Deliverable Revenue
Arrangements—a consensus of the FASB Emerging Issues Task
Force. ASU No. 2009-13 addresses the unit of accounting for
arrangements involving multiple deliverables and how arrangement consideration
should be allocated to the separate units of accounting. The Company will be
required to adopt the provisions of ASU No. 2009-13 prospectively beginning
January 1, 2011. Earlier retrospective application is
permitted. The Company is evaluating the effects of implementing the
provisions of this new guidance.
5.
Acquisitions
The
following acquisitions were accounted for using the purchase method of
accounting and, accordingly, the accompanying financial statements include the
financial position and the results of operations from the dates of
acquisition.
On
January 31, 2007, the Company purchased all of the outstanding stock of
Lubrication Systems Company of Texas (LSC), a manufacturer of fluid handling
systems, including oil mist lubrication systems and lube oil purification
systems, for $29.8 million. As a result of the acquisition of LSC,
intangible assets of $22.6 million were recorded. The purchase of LSC
complements the Company’s existing line of fluid handling products.
On
November 29, 2007, the Company acquired Fairmount Automation, Inc.
(Fairmount), an original equipment manufacturer of mission critical programmable
automation controllers in fluid handling applications primarily for the U.S.
Navy, for $4.5 million plus contingent payments based on achievement of future
revenue and earnings targets over the period ending December 31, 2010. In the
fourth quarters of 2009 and 2008, the first two targets were achieved, resulting
in payments of $0.4 million in each period, which were recorded as goodwill.
Remaining contingent payments, if any, of up to $1.3 million will also be
recorded as additional goodwill. In addition to strengthening its existing
position with the U.S. Navy, the Company is leveraging Fairmount’s experienced
engineering talent and technology expertise to develop a portfolio of fluid
handling solutions with diagnostic and prognostic capabilities for use in
industrial applications.
On August
31, 2009, we completed the acquisition of PD-Technik Ingenieurbüro GmbH
(“PD-Technik”), a provider of marine aftermarket related products and services
located in Hamburg, Germany, for $1.3 million, net of cash acquired in the
transaction.
Purchase
price allocations are based on fair value of the acquired assets and
liabilities. This information is obtained mainly through due diligence and other
information from the sellers, as well as tangible and intangible asset
appraisals. The allocations for our significant acquisitions, Fairmount and LSC,
are as follows:
|
Fairmount
|
LSC
|
|||||||
|
Cash
|
$ | 1,155 | $ | 74 | ||||
|
Accounts
receivable
|
243 | 5,809 | ||||||
|
Inventories
|
469 | 4,248 | ||||||
|
Prepaid
expenses and other current assets
|
77 | 301 | ||||||
|
Property,
plant and equipment
|
109 | 428 | ||||||
|
Goodwill
|
3,028 | 15,065 | ||||||
|
Trade
name
|
90 | 870 | ||||||
|
Developed
technology
|
860 | 2,770 | ||||||
|
Backlog
of open orders
|
- | 552 | ||||||
|
Customer
relationships
|
990 | 3,330 | ||||||
|
Other
long-term assets
|
- | 1,381 | ||||||
|
Total
assets acquired
|
$ | 7,021 | $ | 34,828 | ||||
|
Accounts
payable and accrued liabilities assumed
|
$ | 1,698 | $ | 5,078 | ||||
57
Developed
technology is being amortized over a term of 6 to 15 years. Backlog of open
orders is amortized over a term of approximately one year. Customer
relationships are being amortized over periods of 7 to 10 years. The
weighted average amortization period for intangibles subject to amortization is
approximately six years.
Goodwill
deductible for income tax purposes due to the Fairmount and LSC acquisitions is
$2.8 million and $14.4 million, respectively.
The
unaudited pro forma information below gives effect to these acquisitions as if
they had occurred at the beginning of the period. The pro forma information is
presented for informational purposes only and is not necessarily indicative of
the results of operations that actually would have occurred had the acquisitions
been consummated as of that time.
|
Pro
Forma
|
||||
|
Year ended
|
||||
|
December
31,
|
||||
|
2007
Restated
|
||||
|
Net
sales
|
$ | 510,021 | ||
|
Net
income
|
65,521 | |||
|
Earnings
per common share - basic and diluted
|
$ | 1.81 | ||
6.
Income Taxes
Income
before income taxes and the components of the provision for income taxes were
as follows:
|
Year
ended December 31,
|
||||||||||||
|
2009
Restated
|
2008
Restated
|
2007
Restated
|
||||||||||
|
Income
(loss) before income tax expense:
|
||||||||||||
|
Domestic
|
$ | 698 | $ | (54,303 | ) | $ | 60,993 | |||||
|
Foreign
|
31,720 | 60,299 | 44,110 | |||||||||
| $ | 32,418 | $ | 5,996 | $ | 105,103 | |||||||
|
Provision
for income taxes:
|
||||||||||||
|
Current
income tax expense (benefit):
|
||||||||||||
|
Federal
|
$ | (1,323 | ) | $ | (1,145 | ) | $ | 444 | ||||
|
State
|
344 | 239 | 199 | |||||||||
|
Foreign
|
6,911 | 19,701 | 16,318 | |||||||||
| 5,932 | 18,795 | 16,961 | ||||||||||
|
Deferred
income tax expense (benefit):
|
||||||||||||
|
Domestic
|
2,241 | (12,607 | ) | 24,567 | ||||||||
|
Foreign
|
448 | (723 | ) | (2,071 | ) | |||||||
| 2,689 | (13,330 | ) | 22,496 | |||||||||
| $ | 8,621 | $ | 5,465 | $ | 39,457 | |||||||
U.S.
income taxes at the statutory rate reconciled to the overall U.S. and foreign
provision for income taxes were as follows:
58
|
Year
ended December 31,
|
||||||||||||
|
2009
Restated
|
2008
Restated
|
2007
Restated
|
||||||||||
|
Tax
at U.S. federal income tax rate
|
$ | 11,346 | $ | 2,099 | $ | 36,786 | ||||||
|
State
taxes
|
34 | (1,500 | ) | 2,131 | ||||||||
|
Effect
of international tax rates
|
(2,260 | ) | (3,342 | ) | (2,230 | ) | ||||||
|
Payment
of non-deductible underwriting fee
|
- | 4,483 | - | |||||||||
|
Changes
in valuation and tax reserves
|
(710 | ) | 2,903 | 755 | ||||||||
|
Inclusion
of foreign earnings
|
- | - | 1,565 | |||||||||
|
Other
|
211 | 822 | 450 | |||||||||
|
Provision
for income taxes
|
$ | 8,621 | $ | 5,465 | $ | 39,457 | ||||||
Deferred
income taxes reflect the net tax effects of temporary differences between the
carrying amounts of assets and liabilities for financial reporting purposes and
the amounts used for income tax purposes. Significant components of the deferred
tax assets and liabilities were as follows:
|
December
31,
|
||||||||||||||||
|
2009
|
2008
|
|||||||||||||||
|
Restated
|
Restated
|
|||||||||||||||
|
Current
|
Long-Term
|
Current
|
Long-Term
|
|||||||||||||
|
Deferred
tax assets:
|
||||||||||||||||
|
Post-retirement
benefit obligations
|
$ | 1,003 | $ | 23,262 | $ | 602 | $ | 25,632 | ||||||||
|
Expenses
not currently deductible
|
9,552 | 30,200 | 7,536 | 30,017 | ||||||||||||
|
Net
operating loss carryover
|
- | 42,268 | - | 42,770 | ||||||||||||
|
Tax
credit carryover
|
- | 5,560 | - | 7,518 | ||||||||||||
|
Other
|
- | 837 | - | 1,094 | ||||||||||||
|
Total
deferred tax assets
|
10,555 | 102,127 | 8,138 | 107,031 | ||||||||||||
|
Valuation
allowance for deferred tax assets
|
(2,649 | ) | (42,404 | ) | (1,649 | ) | (43,556 | ) | ||||||||
|
Net
deferred tax assets
|
7,906 | 59,723 | 6,489 | 63,475 | ||||||||||||
|
Net
tax liabilities:
|
||||||||||||||||
|
Tax
over book depreciation
|
- | 10,578 | - | 10,809 | ||||||||||||
|
Other
|
1,074 | 7,680 | - | 6,979 | ||||||||||||
|
Total
deferred tax liabilities
|
1,074 | 18,258 | - | 17,788 | ||||||||||||
|
Net
deferred tax assets
|
$ | 6,832 | $ | 41,465 | $ | 6,489 | $ | 45,687 | ||||||||
For
purposes of the balance sheet presentation, the Company nets current and
non-current tax assets and liabilities within each taxing jurisdiction. The
above table is presented prior to the netting of the current and non-current
deferred tax items. The Company evaluates the recoverability of its net deferred
tax assets on a jurisdictional basis by considering whether net deferred tax
assets will be realized on a more likely than not basis. To the
extent a portion or all of the applicable deferred tax assets do not meet the
more likely than not threshold, a valuation allowance is recorded. During the
year ending December 31, 2009, the valuation allowance decreased from $45.2
million to $45.1 million with the decrease recognized in income tax
expense. The $0.1 million net decrease in 2009 was primarily
attributable to a corresponding reduction in deferred tax assets due to the
pension restatement, offset in part by an increase attributable to certain
separate company losses the company believes may not be realized. Consideration
was given to U.S. tax planning strategies and future U.S. taxable income as to
how much of the relevant deferred tax asset could be realized on a more likely
than not basis.
59
The
Company has U.S. net operating loss carryforwards of approximately $109.6
million expiring in years 2021 through 2028, and minimum tax credits of
approximately $1.9 million that may be carried forward indefinitely. Tax
credit carryforwards include foreign tax credits that have been offset by a
valuation allowance. We experienced an “ownership change” within the meaning of
Section 382 of the Internal Revenue Code of 1986, as amended, as a result of the
IPO. The Company’s ability to use these various carryforwards
existing at the time of the ownership change to offset any taxable income
generated in taxable periods after the ownership change may be limited under
Section 382 and other federal tax provisions.
For the
years ended December 31, 2009, 2008 and 2007, the Company intends that all
undistributed earnings of its controlled international subsidiaries will be
reinvested and no tax expense has been recognized under the applicable
accounting standard, for these reinvested earnings. The amount of
unremitted earnings from these international subsidiaries, subject to local
statutory restrictions, as of December 31, 2009 is approximately $128.2
million. It is not reasonably determinable as to the amount of
deferred tax liability that would need to be provided if such earnings were not
reinvested.
The
Company adopted an accounting standard which created a single model to address
accounting for uncertainty in tax positions. This accounting standard applies to
all tax positions and requires a recognition threshold and measurement of a tax
position taken or expected to be taken in a tax return. This standard also
provides guidance on classification, interest and penalties, accounting in
interim periods and transition, and significantly expanded income tax disclosure
requirements. As a result of the implementation of this accounting standard, the
Company increased its net liability for unrecognized tax benefits by $6.7
million with a corresponding charge to beginning retained earnings as of
January 1, 2007.
A
reconciliation of the beginning and ending amount of gross unrecognized tax
benefits is as follows:
|
Balance
at December 31, 2007
|
$ | 10,299 | ||
|
Additions
for tax positions in prior periods
|
886 | |||
|
Additions
for tax positions in current period
|
886 | |||
|
Reductions
for tax positions in prior periods
|
(1,658 | ) | ||
|
Foreign
exchange impact / other
|
(312 | ) | ||
|
Balance
at December 31, 2008
|
$ | 10,101 | ||
|
Additions
for tax positions in prior periods
|
73 | |||
|
Additions
for tax positions in current period
|
308 | |||
|
Reductions
for tax positions in prior periods
|
(1,896 | ) | ||
|
Foreign
exchange impact / other
|
160 | |||
|
Balance
at December 31, 2009
|
$ | 8,746 |
The
Company’s unrecognized tax benefits as of December 31, 2009 and 2008 totaled
$9.3 million and $11.1 million inclusive of $0.5 million and $1.0 million of
interest, respectively. These amounts were offset in part by tax
benefits of approximately $0.7 million and $1.4 million for the years ended
December 31, 2009 and 2008, respectively. The net liabilities for
uncertain tax positions for the years ended December 31, 2009 and 2008 were $8.6
million and $9.7 million, respectively, and if recognized, would favorably
impact the effective tax rate.
The
Company records interest and penalties on uncertain tax positions for
post-adoption periods as a component of income tax expense. The interest and
penalty expense recorded in income tax expense attributed to uncertain tax
positions for the years ending December 31, 2009, 2008 and 2007 was $0.2
million, $0.2 million and $0.3 million, respectively.
The
Company is subject to income tax in the U.S., state, and international
locations. The Company’s significant operations outside the U.S. are located in
Germany and Sweden. In Sweden, tax years 2004 to 2009 and in Germany, tax years
2003 and 2006 to 2008 remain subject to examination. In the U.S., tax years 2005
and beyond generally remain open for examination by U.S. and state tax
authorities as well as tax years ending in 1997, 1998, 2000 and 2003 that have
U.S. tax attributes available that have been carried forward to open tax years
or are available to be carried forward to future tax years.
Due to
the difficulty in predicting with reasonable certainty when tax audits will be
fully resolved and closed, the range of reasonably possible significant
increases or decreases in the liability for unrecognized tax benefits that may
occur within the next 12 months is difficult to ascertain. Currently, we
estimate it is reasonably possible the expiration of various statutes of
limitations and resolution of tax audits may reduce our tax expense in the next
12 months ranging from zero to $1.3 million.
60
7.
Restructuring and Other Related Charges
The
Company has initiated a series of restructuring actions during 2009 in response
to current and expected future economic conditions. As a result, the Company
recorded pre-tax restructuring and related costs of $18.2 million during the
year ended December 31, 2009. As of December 31, 2009, we have reduced our
company-wide workforce by 328 associates from December 31,
2008. Additionally, during 2009, approximately 630 associates
participated in a German government-sponsored furlough program in which the
government pays the wage-related costs for the portion of the work week the
associate is not working. Payroll taxes and other employee benefits
related to employees’ furlough time are included in restructuring costs. Our
agreement with the German works council allowing participation in the furlough
program ends February 2011. Future restructuring costs that may be
incurred cannot be reasonably estimated as of the date these financial
statements are filed.
During
the second quarter of 2009, we closed a repair facility in Aberdeen, NC.
Further, during the fourth quarter of 2009, we closed a manufacturing facility
in Sanford, NC and moved its production to the Company’s facilities in Monroe,
NC and Columbia, KY. We recorded non-cash impairment charges of $0.6 million to
reduce the carrying value of the real estate and equipment at these facilities
to their estimated fair values.
We
recognize the cost of involuntary termination benefits at the communication date
or ratably over any remaining expected future service
period. Voluntary termination benefits are recognized as a liability
and a loss when employees accept the offer and the amount can be reasonably
estimated. We record asset impairment charges to reduce the carrying amount of
long-lived assets that will be sold or disposed of to their estimated fair
values. Fair values are estimated using observable inputs including third party
appraisals and quoted market prices.
A
summary of restructuring activity for the year ended December 31, 2009 is shown
below.
|
Year Ended December 31,
2009
|
||||||||||||||||||||
|
Restructuring
|
Foreign
|
Restructuring
|
||||||||||||||||||
|
Liability
at
|
Currency
|
Liability
at
|
||||||||||||||||||
|
Dec. 31, 2008
|
Provisions
|
Payments
|
Translation
|
Dec. 31, 2009
|
||||||||||||||||
|
Restructuring
Charges:
|
||||||||||||||||||||
|
Termination
benefits (1)
|
$ | - | $ | 15,218 | $ | (5,545 | ) | $ | (200 | ) | $ | 9,473 | ||||||||
|
Furlough
charges (2)
|
- | 1,187 | (1,273 | ) | 86 | - | ||||||||||||||
|
Facility
closure charges (3)
|
- | 1,122 | (1,122 | ) | - | - | ||||||||||||||
|
Total
Restructuring Charges
|
$ | - | 17,527 | $ | (7,940 | ) | $ | (114 | ) | $ | 9,473 | |||||||||
|
Other
Related Charges:
|
||||||||||||||||||||
|
Asset
impairment charges (4)
|
648 | |||||||||||||||||||
|
Total
Restructuring and Other Related Charges
|
$ | 18,175 | ||||||||||||||||||
|
(1)
|
Includes
severance and other termination benefits such as outplacement
services.
|
|
(2)
|
Includes
payroll taxes and other employee benefits related to German employees’
furlough time.
|
|
(3)
|
Includes
the cost of relocating and training associates and relocating equipment in
connection with the closing of the Sanford, NC
facility.
|
|
(4)
|
Includes
asset impairment charges associated with the real estate and equipment at
the Aberdeen, NC and Sanford, NC
locations.
|
61
8.
Earnings (Loss) Per Share
The
following table presents the computation of basic and diluted earnings (loss)
per share:
|
Year ended December 31,
|
||||||||||||
|
2009
Restated
|
2008
Restated
|
2007
Restated
|
||||||||||
|
Numerator:
|
||||||||||||
|
Net
income
|
$ | 23,797 | $ | 531 | $ | 65,646 | ||||||
|
Dividends
on preferred stock
|
- | (3,492 | ) | (25,816 | ) | |||||||
|
Net
income (loss) available to common shareholders
|
$ | 23,797 | $ | (2,961 | ) | $ | 39,830 | |||||
|
Denominator:
|
||||||||||||
|
Weighted-average
shares of common stock outstanding - basic
|
43,222,616 | 36,240,157 | 21,885,929 | |||||||||
|
Net
income (loss) per share - basic
|
$ | 0.55 | $ | (0.08 | ) | $ | 1.82 | |||||
|
Weighted-average
shares of common stock outstanding - basic
|
43,222,616 | 36,240,157 | 21,885,929 | |||||||||
|
Net
effect of potentally dilutive securities (1)
|
103,088 | - | - | |||||||||
|
Weighted-average
shares of common stock outstanding - diluted
|
43,325,704 | 36,240,157 | 21,885,929 | |||||||||
|
Net
income (loss) per share - diluted
|
$ | 0.55 | $ | (0.08 | ) | $ | 1.82 | |||||
(1) Potentially
dilutive securities consist of options and restricted stock units.
In the
years ended December 31, 2009 and 2008, respectively, approximately 0.6 million
and 0.5 million potentially dilutive stock options, restricted stock units and
deferred stock units were excluded from the calculation of diluted loss per
share since their effect would have been anti-dilutive.
9.
Inventories
Inventories
consisted of the following:
|
December
31,
|
||||||||
|
2009
|
2008
|
|||||||
|
Raw
materials
|
$ | 28,445 | $ | 34,074 | ||||
|
Work
in process
|
32,888 | 33,691 | ||||||
|
Finished
goods
|
21,013 | 21,600 | ||||||
| 82,346 | 89,365 | |||||||
|
Less-Customer
progress billings
|
(3,171 | ) | (2,115 | ) | ||||
|
Less-Allowance
for excess, slow-moving and obsolete inventory
|
(8,025 | ) | (6,923 | ) | ||||
| $ | 71,150 | $ | 80,327 | |||||
62
10.
Property, Plant and Equipment
Property,
plant and equipment consisted of the following:
|
Depreciable
|
December
31,
|
||||||||||
|
Lives in Years
|
2009
|
2008
|
|||||||||
|
Land
|
- | $ | 16,618 | $ | 16,593 | ||||||
|
Buildings
and improvements
|
3 -
40
|
|
36,651 | 34,784 | |||||||
|
Machinery
and equipment
|
3 -
15
|
119,727 | 114,857 | ||||||||
|
Software
|
3 -
5
|
17,324 | 14,487 | ||||||||
| 190,320 | 180,721 | ||||||||||
|
Less-Accumulated
depreciation
|
(98,230 | ) | (88,631 | ) | |||||||
| $ | 92,090 | $ | 92,090 | ||||||||
Depreciation
expense, including the amortization of assets recorded under capital leases, for
the years ended December 31, 2009, 2008 and 2007, was approximately $11.8
million, $12.1 million and $11.8 million, respectively. These amounts
include depreciation expense related to software for the years ended
December 31, 2009, 2008 and 2007 of $1.7 million, $2.0 million and
$2.6 million, respectively.
11.
Goodwill and Intangible Assets
Changes
in the carrying amount of goodwill during the years ended December 31, 2009
and 2008 are as follows:
|
Goodwill
Restated
|
||||
|
Balance
December 31, 2007
|
$ | 165,123 | ||
|
Contingent
purchase price payment for Fairmount acquisition
|
439 | |||
|
Adjustments
due to finalization of purchase price allocations
|
165 | |||
|
Impact
of changes in foreign exchange rates
|
(4,033 | ) | ||
|
Balance
December 31, 2008
|
161,694 | |||
|
Contingent
purchase price payment for Fairmount acquisition
|
418 | |||
|
Attributable
to 2009 acquisition of PD-Technik
|
6 | |||
|
Impact
of changes in foreign exchange rates
|
1,300 | |||
|
Balance
December 31, 2009
|
$ | 163,418 | ||
Other
intangible assets consisted of the following:
|
December 31,
|
||||||||||||||||
|
2009
|
2008
|
|||||||||||||||
|
Gross
Carrying
Amount
|
Accumulated
Amortization
|
Gross
Carrying
Amount
|
Accumulated
Amortization
|
|||||||||||||
|
Acquired
customer relationships
|
$ | 15,512 | $ | (8,989 | ) | $ | 14,450 | $ | (7,022 | ) | ||||||
|
Trade
names - indefinite life
|
2,062 | - | 2,040 | - | ||||||||||||
|
Acquired
developed technology
|
5,811 | (2,444 | ) | 5,808 | (1,760 | ) | ||||||||||
|
Other
intangibles
|
146 | (146 | ) | 464 | (464 | ) | ||||||||||
| $ | 23,531 | $ | (11,579 | ) | $ | 22,762 | $ | (9,246 | ) | |||||||
63
In
connection with the acquisition of PD-Technik in 2009, customer relationship
intangibles of $0.9 million were acquired and are being amortized over a period
of six years.
Amortization
expense for the years ended December 31, 2009, 2008 and 2007 was
approximately $2.6 million, $2.7 million and $3.4 million,
respectively. Amortization expense for the next five fiscal years is expected to
be: 2010—$2.5 million, 2011—$2.5 million, 2012—$2.2 million, 2013—$1.0
million, and 2014—$0.7 million.
12.
Retirement and Benefit Plans
The
Company sponsors various defined benefit plans, defined contribution plans and
other post-retirement benefits plans, including health and life insurance, for
certain eligible employees or former employees. We use December 31 as the
measurement date for all of our employee benefit plans.
The
following table summarizes the changes in our pension and other post-retirement
benefit plan obligations and plan assets and includes a statement of the plans’
funded status:
|
Other
|
||||||||||||||||
|
Pension Benefits
|
Post-retirement Benefits
|
|||||||||||||||
|
Year
ended December 31,
|
2009
Restated
|
2008
Restated
|
2009
|
2008
|
||||||||||||
|
Change
in benefit obligation:
|
||||||||||||||||
|
Projected
benefit obligation at beginning of year
|
$ | 295,165 | $ | 303,654 | $ | 10,370 | $ | 7,304 | ||||||||
|
Service
cost
|
1,381 | 1,160 | - | - | ||||||||||||
|
Interest
cost
|
17,577 | 17,429 | 525 | 501 | ||||||||||||
|
Plan
amendments
|
- | - | - | 2,359 | ||||||||||||
|
Actuarial
loss
|
10,662 | 3,740 | 772 | 901 | ||||||||||||
|
Acquisitions
|
72 | - | - | - | ||||||||||||
|
Settlement/curtailment
|
- | - | - | - | ||||||||||||
|
Foreign
exchange effect
|
2,958 | (7,844 | ) | - | - | |||||||||||
|
Benefits
paid
|
(21,244 | ) | (22,974 | ) | (808 | ) | (695 | ) | ||||||||
|
Projected
benefit obligation at end of year
|
$ | 306,571 | $ | 295,165 | $ | 10,859 | $ | 10,370 | ||||||||
|
Accumulated
benefit obligation at end of year
|
$ | 303,598 | $ | 290,007 | $ | - | $ | - | ||||||||
|
Change
in plan assets:
|
||||||||||||||||
|
Fair
value of plan assets at beginning of year
|
$ | 192,859 | $ | 257,036 | $ | - | $ | - | ||||||||
|
Actual
return on plan assets
|
29,193 | (42,694 | ) | - | - | |||||||||||
|
Employer
contribution
|
7,517 | 5,695 | 808 | 695 | ||||||||||||
|
Acquisitions
|
60 | - | - | - | ||||||||||||
|
Foreign
exchange effect
|
1,536 | (4,204 | ) | - | - | |||||||||||
|
Benefits
paid
|
(21,244 | ) | (22,974 | ) | (808 | ) | (695 | ) | ||||||||
|
Fair
value of plan assets at end of year
|
$ | 209,921 | $ | 192,859 | $ | - | $ | - | ||||||||
|
Funded
status at end of year
|
$ | (96,650 | ) | $ | (102,306 | ) | $ | (10,859 | ) | $ | (10,370 | ) | ||||
|
Amounts
recognized in the balance sheet at December 31:
|
||||||||||||||||
|
Non-current
assets
|
$ | 244 | $ | 132 | $ | - | $ | - | ||||||||
|
Current
liabilities
|
(1,114 | ) | (1,153 | ) | (1,409 | ) | (1,437 | ) | ||||||||
|
Non-current
liabilities
|
(95,780 | ) | (101,285 | ) | (9,450 | ) | (8,933 | ) | ||||||||
|
Total
|
$ | (96,650 | ) | $ | (102,306 | ) | $ | (10,859 | ) | $ | (10,370 | ) | ||||
The
accumulated benefit obligation and fair value of plan assets for the pension
plans with accumulated benefit obligations in excess of plan assets were
$301.2 million and $207.2 million, respectively, as of December 31,
2009 and $288.1 million and $190.7 million, respectively, as of
December 31, 2008.
64
The
projected benefit obligation and fair value of plan assets for the pension plans
with projected benefit obligations in excess of plan assets were $304.1 million
and $207.2 million, respectively, as of December 31, 2009 and $293.1
million and $190.7 million, respectively, as of December 31,
2008.
The
following table summarizes the changes in our foreign pension plans’ obligations
and plan assets, included in the previous disclosure, and includes a statement
of the foreign plans’ funded status:
|
Foreign Pension Benefits
|
||||||||
|
Year
ended December 31,
|
2009
|
2008
|
||||||
|
Change
in benefit obligation:
|
||||||||
|
Projected
benefit obligation at beginning of year
|
$ | 82,253 | $ | 83,649 | ||||
|
Service
cost
|
1,381 | 1,160 | ||||||
|
Interest
cost
|
4,668 | 4,364 | ||||||
|
Actuarial
(gain) loss
|
(5,947 | ) | 5,786 | |||||
|
Acquisitions
|
72 | - | ||||||
|
Foreign
exchange effect
|
2,958 | (7,844 | ) | |||||
|
Benefits
paid
|
(4,425 | ) | (4,862 | ) | ||||
|
Projected
benefit obligation at end of year
|
$ | 80,960 | $ | 82,253 | ||||
|
Accumulated
benefit obligation at end of year
|
$ | 77,988 | $ | 77,097 | ||||
|
Change
in plan assets
|
||||||||
|
Fair
value of plan assets at beginning of year
|
$ | 23,219 | $ | 28,918 | ||||
|
Actual
return on plan assets
|
1,390 | 69 | ||||||
|
Employer
contribution
|
3,061 | 3,298 | ||||||
|
Acquisitions
|
60 | - | ||||||
|
Foreign
exchange effect
|
1,536 | (4,204 | ) | |||||
|
Benefits
paid
|
(4,425 | ) | (4,862 | ) | ||||
|
Fair
value of plan assets at end of year
|
$ | 24,841 | $ | 23,219 | ||||
|
Funded
status at end of year
|
$ | (56,119 | ) | $ | (59,034 | ) | ||
Expected
contributions to the pension plans for 2010 are $5.5 million. The following benefit
payments are expected to be paid during the years ending December
31:
|
Other
|
||||||||||||
|
Pension Benefits
|
Post-retirement
|
|||||||||||
|
All Plans
|
Foreign Plans
|
Benefits
|
||||||||||
|
Restated
|
||||||||||||
|
2010
|
$ | 22,203 | $ | 4,664 | $ | 1,409 | ||||||
|
2011
|
23,308 | 4,760 | 843 | |||||||||
|
2012
|
22,290 | 4,793 | 850 | |||||||||
|
2013
|
22,219 | 4,858 | 840 | |||||||||
|
2014
|
22,281 | 4,969 | 817 | |||||||||
|
Years
2015-2019
|
109,186 | 24,652 | 3,689 | |||||||||
The
Company’s primary investment objective for its pension plan assets is to provide
a source of retirement income for the plans’ participants and
beneficiaries. The assets are invested with the goal of preserving
principal while providing a reasonable real rate of return over the long
term. Diversification of assets is achieved through strategic
allocations to various asset classes. Actual allocations to each
asset class vary due to periodic investment strategy changes, market value
fluctuations, the length of time it takes to fully implement investment
allocation positions, and the timing of benefit payments and contributions. The
asset allocation is monitored and rebalanced as required, as frequently as on a
quarterly basis in some instances. The following are the actual and target
allocation percentages for the Company’s pension plan assets:
65
|
Actual
Allocation
|
||||||||||||
|
December
31,
|
Target
|
|||||||||||
|
2009
|
2008
|
Allocation
|
||||||||||
|
United
States Plans:
|
||||||||||||
|
Equity
securities:
|
||||||||||||
|
U.S.
|
39 | % | 36 | % | 34% - 42 | % | ||||||
|
International
|
12 | 12 | 10% - 14 | % | ||||||||
|
Fixed
income securities
|
34 | 37 | 27% - 43 | % | ||||||||
|
Hedge
fund
|
15 | 15 | 13% - 17 | % | ||||||||
|
Foreign
Plans:
|
||||||||||||
|
Large
cap equity securities
|
15 | 19 | 0% - 20 | % | ||||||||
|
Fixed
income securities
|
83 | 80 | 80% - 100 | % | ||||||||
|
Cash
and cash equivalents
|
2 | 1 | 0% - 5 | % | ||||||||
The
following table presents the Company’s pension plan assets using the fair value
hierarchy as of December 31, 2009. The fair value hierarchy has three
levels based on the reliability of the inputs used to determine fair
value. Level 1 refers to fair values determined based on quoted
prices in active markets for identical assets. Level 2 refers to fair
values estimated using significant observable inputs, and Level 3 includes fair
values estimated using significant unobservable inputs.
|
Total
|
Level 1
|
Level 2
|
Level 3
|
|||||||||||||
|
United
States Plans:
|
||||||||||||||||
|
Cash
and cash equivalents
|
$ | 1,180 | $ | 1,180 | $ | - | $ | - | ||||||||
|
Equity
mutual funds:
|
||||||||||||||||
|
U.S.
large cap
|
56,400 | 56,400 | - | - | ||||||||||||
|
U.S.
small / mid-cap
|
15,992 | 15,992 | - | - | ||||||||||||
|
Foreign
|
22,548 | 22,548 | - | - | ||||||||||||
|
Fixed
income mutual funds:
|
||||||||||||||||
|
U.S.
|
50,805 | 50,805 | - | - | ||||||||||||
|
Foreign
|
11,386 | 11,386 | - | - | ||||||||||||
|
Hedge
fund
|
26,769 | - | - | 26,769 | ||||||||||||
|
Foreign
Plans:
|
||||||||||||||||
|
Cash
and cash equivalents
|
568 | 568 | - | - | ||||||||||||
|
Large
cap equity securities
|
3,688 | 3,688 | - | - | ||||||||||||
|
Fixed
income securities
|
20,585 | - | 20,585 | - | ||||||||||||
| $ | 209,921 | $ | 162,567 | $ | 20,585 | $ | 26,769 | |||||||||
Fixed
income securities held by the foreign plans are valued using quotes from
independent pricing vendors based on recent trading activity and other relevant
information, including market interest rate curves, referenced credit spreads
and estimated prepayment rates. The hedge fund investment is valued
at the net asset value of units held by the plans at year end.
The table
below presents a summary of the changes in the fair value of the Level 3 assets
held during the year ended December 31, 2009.
|
Balance
at January 1, 2009
|
$ | 25,983 | ||
|
Unrealized
gains
|
786 | |||
|
Balance
at December 31, 2009
|
$ | 26,769 |
66
The
components of net periodic cost and other comprehensive (income) loss were as
follows:
|
Pension Benefits
|
Other Post-retirement Benefits
|
|||||||||||||||||||||||
|
2009
Restated
|
2008
Restated
|
2007
Restated
|
2009
|
2008
|
2007
|
|||||||||||||||||||
|
Components
of net periodic benefit cost:
|
||||||||||||||||||||||||
|
Service
cost
|
$ | 1,381 | $ | 1,160 | $ | 1,170 | $ | - | $ | - | $ | - | ||||||||||||
|
Interest
cost
|
17,577 | 17,429 | 16,954 | 525 | 501 | 445 | ||||||||||||||||||
|
Amortization
|
3,639 | 2,523 | 3,606 | 353 | 227 | 133 | ||||||||||||||||||
|
Expected
return on plan assets
|
(19,570 | ) | (20,509 | ) | (19,667 | ) | - | - | - | |||||||||||||||
|
Net
periodic benefit cost
|
$ | 3,027 | $ | 603 | $ | 2,063 | $ | 878 | $ | 728 | $ | 578 | ||||||||||||
|
Change
in plan assets and benefit obligations recognized in other comprehensive
(income) loss:
|
||||||||||||||||||||||||
|
Current
year net actuarial loss (gain)
|
710 | 66,101 | (8,225 | ) | 772 | 901 | 167 | |||||||||||||||||
|
Prior
service cost
|
- | - | - | - | 2,359 | - | ||||||||||||||||||
|
Less
amounts included in net periodic cost:
|
- | |||||||||||||||||||||||
|
Amortization
of net loss
|
(3,639 | ) | (2,523 | ) | (3,606 | ) | (104 | ) | (165 | ) | (133 | ) | ||||||||||||
|
Amortization
of prior service cost
|
- | - | - | (249 | ) | (62 | ) | - | ||||||||||||||||
|
Total
recognized in other comprehensive (income) loss
|
$ | (2,929 | ) | $ | 63,578 | $ | (11,831 | ) | $ | 419 | $ | 3,033 | $ | 34 | ||||||||||
The
components of net periodic cost and other comprehensive (income) loss for our
foreign pension plans, included within the previous disclosure, were as
follows:
|
Foreign Pension Benefits
|
||||||||||||
|
2009
|
2008
|
2007
|
||||||||||
|
Components
of net periodic benefit cost:
|
||||||||||||
|
Service
cost
|
$ | 1,381 | $ | 1,160 | $ | 1,170 | ||||||
|
Interest
cost
|
4,668 | 4,364 | 3,738 | |||||||||
|
Recognized
net actuarial loss
|
808 | 348 | 718 | |||||||||
|
Expected
return on plan assets
|
(1,204 | ) | (1,456 | ) | (1,538 | ) | ||||||
|
Net
periodic benefit cost
|
$ | 5,653 | $ | 4,416 | $ | 4,088 | ||||||
|
Change
in plan assets and benefit obligations recognized in other comprehensive
loss (income):
|
||||||||||||
|
Current
year net actuarial (gain) loss
|
(6,464 | ) | 6,339 | (4,202 | ) | |||||||
|
Less
amounts included in net periodic cost:
|
||||||||||||
|
Amortization
of net loss
|
(808 | ) | (348 | ) | (718 | ) | ||||||
|
Total
recognized in other comprehensive loss (income)
|
$ | (7,272 | ) | $ | 5,991 | $ | (4,920 | ) | ||||
67
The
components of accumulated other comprehensive income that have not been
recognized as components of net periodic cost are as follows:
|
Other
|
||||||||||||||||
|
Pension Benefits
|
Post-retirement Benefits
|
|||||||||||||||
|
At December 31,
|
2009
Restated
|
2008
Restated
|
2009
|
2008
|
||||||||||||
|
Net
actuarial loss
|
$ | 141,614 | $ | 144,543 | $ | 3,337 | $ | 2,669 | ||||||||
|
Prior
service cost
|
- | - | 2,048 | 2,297 | ||||||||||||
|
Total
|
$ | 141,614 | $ | 144,543 | $ | 5,385 | $ | 4,966 | ||||||||
The
components of accumulated other comprehensive income that are expected to be
recognized in net periodic cost during the year ended December 31, 2010 are as
follows:
|
Pension
|
Other
|
|||||||
|
Benefits
|
Post-retirement
|
|||||||
|
Restated
|
Benefits
|
|||||||
|
Net
actuarial loss
|
$ | 4,565 | $ | 248 | ||||
|
Prior
service cost
|
- | 233 | ||||||
|
Total
|
$ | 4,565 | $ | 481 | ||||
The key
economic assumptions used in the measurement of the Company’s benefit
obligations at December 31, 2009 and 2008 are as follows:
|
Pension Benefits
|
Other
Post-retirement Benefits
|
|||||||||||||||
|
2009
|
2008
|
2009
|
2008
|
|||||||||||||
|
Weighted-average
discount rate:
|
||||||||||||||||
|
For
all plans
|
5.7 | % | 6.1 | % | 5.6 | % | 6.0 | % | ||||||||
|
For
all foreign plans
|
5.6 | % | 5.8 | % | - | - | ||||||||||
|
Weighted-average
rate of increase in compensation levels for active foreign
plans
|
2.0 | % | 2.1 | % | - | - | ||||||||||
The key
economic assumptions used in the computation of net periodic benefit cost for
the years ended December 31, 2009, 2008 and 2007 are as
follows:
|
Pension Benefits
|
Other Post-retirement Benefits
|
|||||||||||||||||||||||
|
2009
|
2008
|
2007
|
2009
|
2008
|
2007
|
|||||||||||||||||||
|
Weighted-average
discount rate:
|
||||||||||||||||||||||||
|
For
all plans
|
6.1 | % | 6.0 | % | 5.9 | % | 6.0 | % | 6.3 | % | 6.0 | % | ||||||||||||
|
For
all foreign plans
|
5.8 | % | 4.7 | % | 5.4 | % | - | - | - | |||||||||||||||
|
Weighted-average
expected return on plan assets:
|
||||||||||||||||||||||||
|
For
all plans
|
8.3 | % | 8.3 | % | 8.4 | % | - | - | - | |||||||||||||||
|
For
all foreign plans
|
5.0 | % | 5.1 | % | 5.5 | % | - | - | - | |||||||||||||||
|
Weighted-average
rate of increase in compensation levels for active foreign
plans
|
2.1 | % | 2.2 | % | 2.6 | % | - | - | - | |||||||||||||||
68
In
determining discount rates, the Company utilizes the single discount rate
equivalent to discounting the expected future cash flows from each plan using
the yields at each duration from a published yield curve as of the measurement
date.
For
measurement purposes, an annual rate of increase in the per capita cost of
covered health care benefits of approximately 7.0% was assumed. The rate was
assumed to decrease gradually to 5.0% by 2014 and remain at that level
thereafter for benefits covered under the plans.
The
expected long-term rate of return on plan assets was based on the Company’s
investment policy target allocation of the asset portfolio between various asset
classes and the expected real returns of each asset class over various periods
of time that are consistent with the long-term nature of the underlying
obligations of these plans.
Assumed
health care cost trend rates have a significant effect on the amounts reported
for the health care plan. A one-percentage point change in assumed health care
cost trend rates would have the following pre-tax effects:
|
1 Percentage
Point Increase
|
1 Percentage
Point Decrease
|
|||||||
|
Effect
on total service and interest cost components for 2009
|
$ | 44 | $ | (35 | ) | |||
|
Effect
on post-retirement benefit obligation at December 31, 2009
|
1,201 | (945 | ) | |||||
The
Company maintains defined contribution plans covering substantially all of their
non-union domestic employees, as well as certain union domestic employees. Under
the terms of the plans, eligible employees may generally contribute from 1% to
50% of their compensation on a pre-tax basis. The Company’s contributions are
based on 50% of the first 6% of each participant’s pre-tax contribution.
Additionally, the Company makes a unilateral contribution of 3% of all
employees’ salary (including non-contributing participants) to the defined
contribution plans. The Company’s expense for 2009, 2008 and 2007 was $2.4
million, $2.2 million and $2.0 million, respectively, related to these
plans.
13.
Debt
Long-term
debt consisted of the following:
|
December 31,
|
||||||||
|
2009
|
2008
|
|||||||
|
Term
A notes (senior bank debt)
|
$ | 91,250 | $ | 96,250 | ||||
|
Capital
leases and other
|
235 | 871 | ||||||
|
Total
debt
|
91,485 | 97,121 | ||||||
|
Less-current
portion Term A
|
(8,750 | ) | (5,000 | ) | ||||
|
Less-current
portion capital leases and other
|
(219 | ) | (420 | ) | ||||
| $ | 82,516 | $ | 91,701 | |||||
On
May 13, 2008, coinciding with the closing of the IPO, the Company
terminated its existing credit facility. There were no material early
termination penalties incurred as a result of the termination. Deferred loan
costs of $4.6 million were written off in connection with this
termination. On the same day, the Company entered into a new credit
agreement (the Credit Agreement). The Credit Agreement, led by Banc
of America Securities LLC and administered by Bank of America, is a senior
secured structure with a $150.0 million revolver and a Term A Note of $100.0
million.
The Term
A Note bears interest at LIBOR plus a margin ranging from 2.25% to 2.75%
determined by the total leverage ratio calculated at quarter end. At December
31, 2009, the interest rate was 2.48% inclusive of 2.25% margin. The
Term A Note, as entered into on May 13, 2008, has $1.25 million due on a
quarterly basis on the last day of each March, June, September and December
beginning with June 30, 2008 and ending March 31, 2010, $2.5 million due on a
quarterly basis on the last day of each March, June, September and December
beginning with June 30, 2010 and ending March 31, 2013, and one installment of
$60.0 million payable on May 13, 2013.
69
The
$150.0 million revolver contains a $50.0 million letter of credit sub-facility,
a $25.0 million swing line loan sub-facility and a €100.0 million
sub-facility. The annual commitment fee on the revolver ranges from
0.4% to 0.5% determined by the total leverage ratio calculated at quarter end.
At December 31, 2009, the commitment fee was 0.4% and there was $14.4 million
outstanding on the letter of credit sub-facility, leaving approximately $136
million available under the revolver loan. The bankruptcy of Lehman Brothers,
one of the financial institutions in the consortium that provided the Company’s
revolving credit line, resulted in their default under the terms of the revolver
and it is doubtful that we would be able to draw on their commitment of $6.0
million. At December 31, 2008, the commitment fee was 0.4% and there
was $16.7 million outstanding on the letter of credit sub-facility, leaving
approximately $130 million available under the revolver loan.
Substantially
all assets and stock of the Company’s domestic subsidiaries and 65% of the
shares of certain European subsidiaries are pledged as collateral against
borrowings under the Credit Agreement. Certain European assets are pledged
against borrowings directly made to our European subsidiary. The Credit
Agreement contains customary covenants limiting the Company’s ability to, among
other things, pay cash dividends, incur debt or liens, redeem or repurchase
Company stock, enter into transactions with affiliates, make investments, merge
or consolidate with others or dispose of assets. In addition, the Credit
Agreement contains financial covenants requiring the Company to maintain a total
leverage ratio of not more than 3.25 to 1.0 and a fixed charge coverage ratio of
not less than 1.50 to 1.0, measured at the end of each quarter. If the Company
does not comply with the various covenants under the Credit Agreement and
related agreements, the lenders may, subject to various customary cure rights,
require the immediate payment of all amounts outstanding under the Term A Note
and revolver and foreclose on the collateral. The Company is in compliance with
all such covenants as of December 31, 2009.
The
future aggregate annual maturities of long-term debt and annual principal
payments for capital leases at December 31, 2009 are:
|
Term Debt
|
Capital Leases
& Other
|
Total
|
||||||||||
|
2010
|
$ | 8,750 | $ | 219 | $ | 8,969 | ||||||
|
2011
|
10,000 | 7 | 10,007 | |||||||||
|
2012
|
10,000 | 9 | 10,009 | |||||||||
|
2013
|
62,500 | - | 62,500 | |||||||||
|
2014
|
- | - | - | |||||||||
|
Total
|
$ | 91,250 | $ | 235 | $ | 91,485 | ||||||
14.
Shareholders’ Equity
Preferred
Stock
On May
13, 2008, pursuant to the amended articles of incorporation, the Company’s
preferred stock was automatically converted into shares of common stock upon the
closing of the IPO, determined by dividing the original issue price of the
preferred shares by the issue price of the common shares at the offering
date.
The
holders of the Company’s preferred stock were entitled to receive dividends in
preference to any dividend on the common stock at the rate of LIBOR plus 2.50%
per annum, when and if declared by the Company’s board of directors. Preferred
dividends of $3.5 million, $12.2 million and $13.7 million were declared on May
12, 2008, December 31, 2007, and May 15, 2007,
respectively. These amounts were paid immediately prior to the
consummation of the Company’s IPO on May 13, 2008. The holders of the
preferred stock did not have voting rights except in certain corporate matters
involving the priority and payment rights of such shares.
Stock
Split
On April
21, 2008, the Company’s board of directors approved a restatement of capital
accounts of the Company through an amendment of the Company’s certificate of
incorporation to provide for a stock split to convert each share of common stock
issued and outstanding into 13,436.22841 shares of common stock. The
consolidated financial statements give retroactive effect as though the stock
split occurred for all periods presented.
70
Issuance
of Common Stock
On
May 13, 2008, the Company completed its IPO of 21,562,500 shares of common
stock at a per share price of $18.00. Of the 21,562,500 shares sold in the
offering, 11,852,232 shares were sold by the Company and 9,710,268 shares were
sold by certain selling stockholders. The Company received net proceeds of
approximately $193.0 million, net of the underwriter’s discount of $14.4 million
and offering-related costs of $5.9 million.
Results
for the year ended December 31, 2008, include $57.0 million of nonrecurring
costs associated with the IPO, including $10.0 million of share-based
compensation and $27.8 million of special cash bonuses paid under previously
adopted executive compensation plans, as well as $2.8 million of employer
payroll taxes and other related costs. It also included $11.8 million
to reimburse the selling stockholders for the underwriting discount on the
shares sold by them and the write off of $4.6 million of deferred loan costs
associated with the early termination of a credit facility.
In 2009,
18,078 shares of common stock were issued in connection with employee
share-based payment arrangements that vested during the year.
Repurchases
of Common Stock
On
November 5, 2008, the Company’s board of directors authorized the repurchase of
up to $20 million (up to $10 million per year in 2008 and 2009) of the Company’s
common stock from time to time on the open market or in privately negotiated
transactions. The repurchase program was conducted pursuant to SEC
Rule 10b5-1. The timing and amount of any shares repurchased was determined by
the Company’s management based on its evaluation of market conditions and other
factors. In the fourth quarter of 2008, the Company purchased 795,000
shares of its common stock for approximately $5.7 million. There were
no repurchases in 2009.
Dividend
Restrictions
The
Company’s Credit Agreement limits the amount of cash dividends and common stock
repurchases the Company may make to a total of $10 million
annually.
Accumulated
Other Comprehensive Income
The
components of accumulated other comprehensive income (loss) are as
follows:
|
December
31,
|
||||||||
|
2009
Restated
|
2008
Restated
|
|||||||
|
Foreign
currency translation adjustment
|
$ | 14,188 | $ | 8,787 | ||||
|
Unrealized
losses on hedging activities
|
(3,035 | ) | (5,050 | ) | ||||
|
Net
unrecognized pension and other post-retirement benefit
costs
|
(120,950 | ) | (122,594 | ) | ||||
|
Total
accumulated other comprehensive loss
|
$ | (109,797 | ) | $ | (118,857 | ) | ||
Share-Based
Payments
2008 Omnibus Incentive
Plan
The
Company adopted the Colfax Corporation 2008 Omnibus Incentive Plan (the 2008
Plan) on April 21, 2008. The 2008 Plan provides the compensation committee
of the board of directors discretion in creating employee equity incentives.
Awards under the 2008 Plan may be made in the form of stock options, stock
appreciation rights, restricted stock, restricted stock units, dividend
equivalent rights, performance shares, performance units, and other stock-based
awards.
71
The
Company measures and recognizes compensation expense relating to share-based
payments based on the fair value of the instruments issued. Stock-based
compensation expense is recognized as a component of “Selling, general and
administrative expenses” in the accompanying consolidated statements of
operations as payroll costs of the employees receiving the awards are recorded
in the same line item. In the years ended December 31, 2009 and 2008, $2.6
million and $1.3 million, respectively, of compensation cost and deferred tax
benefits of approximately $0.9 million and $0.4 million, respectively, were
recognized. At December 31, 2009, the Company had $4.5 million of unrecognized
compensation expense related to stock-based awards that will be recognized over
a weighted-average period of approximately 2.3 years. At December 31, 2009, the
Company had issued stock-based awards that are described below.
Stock
Options
Under the
2008 Plan, the Company may grant options to purchase common stock, with a
maximum term of 10 years at a purchase price equal to the market value of the
common stock on the date of grant. Or, in the case of an incentive stock option
granted to a 10% stockholder, the Company may grant options to purchase common
stock with a maximum term of 5 years, at a purchase price equal to 110% of the
market value of the common stock on the date of grant. One-third of the options
granted pursuant to the 2008 Plan vest on each anniversary of the grant date and
the options expire in seven years.
Stock-based
compensation expense for stock option awards was based on the grant-date fair
value using the Black-Scholes option pricing model. We recognize
compensation expense for stock option awards on a ratable basis over the
requisite service period of the entire award. The following table shows the
weighted-average assumptions we used to calculate fair value of stock option
awards using the Black-Scholes option pricing model, as well as the
weighted-average fair value of options granted during the years ended December
31, 2009 and 2008.
|
Years Ended December 31,
|
||||||||
|
2009
|
2008
|
|||||||
|
Weighted-average
assumptions used in Black-Scholes model:
|
||||||||
|
Expected
period that options will be outstanding (in
years)
|
4.50 | 4.50 | ||||||
|
Interest
rate (based on U.S.
Treasury yields at time of grant)
|
1.87 | % | 3.08 | % | ||||
|
Volatility
|
32.50 | % | 32.35 | % | ||||
|
Dividend
yield
|
- | - | ||||||
|
Weighted-average
fair value of options granted
|
$ | 2.24 | $ | 5.75 | ||||
Expected
volatility is estimated based on the historical volatility of comparable public
companies. The Company uses historical data to estimate employee termination
within the valuation model. Separate groups of employees that have similar
historical exercise behavior are considered separately for valuation purposes.
Since the Company has limited option exercise history, it has elected to
estimate the expected life of an award based upon the SEC-approved “simplified
method” noted under the provisions of Staff Accounting Bulletin No. 107 with the
continued use of this method extended under the provisions of Staff Accounting
Bulletin No. 110.
Stock option activity for the years
ended December 31, 2009 and 2008 is as follows:
|
Shares
|
Weighted-
Average
Exercise
Price
|
Remaining
Contractual
Term
|
Aggregate
Intrinsic
Value
|
|||||||||||||
|
(Years)
|
||||||||||||||||
|
Outstanding
at January 1, 2008
|
- | $ | - | |||||||||||||
|
Granted
|
531,999 | 17.94 | ||||||||||||||
|
Exercised
|
- | - | ||||||||||||||
|
Forfeited
|
(17,008 | ) | 18.00 | |||||||||||||
|
Outstanding
at December 31, 2008
|
514,991 | $ | 17.93 | |||||||||||||
|
Granted
|
844,165 | 7.44 | ||||||||||||||
|
Exercised
|
- | - | ||||||||||||||
|
Forfeited
|
(91,523 | ) | 11.70 | |||||||||||||
|
Outstanding
at December 31, 2009
|
1,267,633 | $ | 11.40 | 5.88 | $ | 3,655 | ||||||||||
|
Vested
and expected to vest at December 31, 2009
|
1,150,635 | $ | 11.16 | 5.90 | $ | 3,439 | ||||||||||
|
Exercisable
at December 31, 2009
|
159,883 | $ | 17.93 | 5.36 | $ | 8 | ||||||||||
72
The
aggregate intrinsic value is based on the difference between the Company’s
closing stock price at the balance sheet date and the exercise price of the
stock option, multiplied by the number of in-the-money options. The
amount of intrinsic value will change based on the fair value of the Company’s
stock.
The
aggregate fair value of options that vested in 2009 was $0.9
million.
Performance-Based
Awards
Under the
2008 Plan, the compensation committee may award performance-based restricted
stock and restricted stock units whose vesting is contingent upon meeting
various performance goals. The vesting of the stock units is determined based on
whether the Company achieves the applicable performance criterion established by
the compensation committee of the board of directors. If the performance
criteria are satisfied, the units are subject to additional time vesting
requirements, by which units will vest fully in two equal installments on the
fourth and fifth anniversary of the grant date, provided the individual remains
an employee during this period.
The fair
value of each grant of performance-based restricted stock or restricted stock
units is equal to the market value of a share of common stock on the date of
grant and the compensation expense is recognized when it is expected that the
performance goals will be achieved. The performance criterion for the
performance-based restricted stock units (PRSUs) granted in 2008 was achieved;
however, the performance criterion for those granted in 2009 was not achieved
and accordingly, no compensation expense for the 2009 grants was
recognized.
Other Restricted Stock and
Restricted Stock Units
Under the
2008 Plan, the compensation committee may award non-performance based restricted
stock and restricted stock units (RSUs) to selected executives, key employees
and outside directors. The compensation committee determines the terms and
conditions of each award including the restriction period and other criteria
applicable to the awards.
The
employee RSUs vest either 100% at the 1st anniversary of the grant date or 50%
at the 1st anniversary and 50% at the 2nd anniversary of the grant date. The
majority of the director RSUs granted to date vest in three equal installments
on each anniversary of the grant date over a 3-year period. Directors can also
elect to defer their annual board fees into RSUs with immediate vesting.
Delivery of the shares underlying these director restricted stock units is
deferred until termination of the director’s service on the Company’s board. The
fair value of each restricted stock unit is equal to the market value of a share
of common stock on the date of grant.
The
following table summarizes the Company’s PRSU and RSU and activity for 2009 and
2008:
|
PRSUs
|
RSUs
|
|||||||||||||||
|
Nonvested shares
|
Shares
|
Weighted-
Average
Grant Date
Fair Value
|
Shares
|
Weighted-
Average
Grant Date
Fair Value
|
||||||||||||
|
Nonvested
at January 1, 2008
|
- | - | - | - | ||||||||||||
|
Granted
|
125,041 | 17.89 | 73,305 | 18.00 | ||||||||||||
|
Vested
|
- | - | - | - | ||||||||||||
|
Forfeited
|
(694 | ) | 18.00 | (1,116 | ) | 18.00 | ||||||||||
|
Nonvested
at December 31, 2008
|
124,347 | $ | 17.89 | 72,189 | $ | 18.00 | ||||||||||
|
Granted
|
337,716 | 7.44 | 69,610 | 8.35 | ||||||||||||
|
Vested
|
- | - | (48,871 | ) | 15.72 | |||||||||||
|
Forfeited
|
(31,566 | ) | 10.69 | - | - | |||||||||||
|
Nonvested
at December 31, 2009
|
430,497 | $ | 10.22 | 92,928 | $ | 11.97 | ||||||||||
2001 Plan and 2006
Plan
In 2001
and 2006, the board of directors implemented long-term cash incentive plans as a
means to motivate senior management or those most responsible for the overall
growth and direction of the Company. Certain executive officers participated in
the Colfax Corporation 2001 Employee Appreciation Rights Plan (the 2001 Plan) or
the 2006 Executive Stock Rights Plan (the 2006 Plan).
73
Generally,
each of these plans provided the applicable officers with the opportunity to
receive a certain percentage, in cash (or, with respect to the 2001 Plan only,
in equity, at the determination of the Board of Directors), of the increase in
value of the Company from the date of grant of the award until the date of the
liquidity event.
The 2001
Plan rights fully vested on the third anniversary of the grant date. The 2006
Plan rights vested if a liquidity event occurred prior to the expiration of the
term of the plan. Amounts were only payable upon the occurrence of a liquidity
event. The Board determined that the IPO qualified as a liquidity event for both
plans. In conjunction with the IPO, the participants received a total of 557,597
shares of common stock and approximately $27.8 million in cash payments under
the 2001 Plan and 2006 Plan and thereafter both plans terminated. In
the year ended December 31, 2008, the Company recognized $10.0 million of
stock-based compensation expense associated with the 557,597 shares of common
stock awarded and a related tax benefit of approximately $3.8
million.
15.
Financial Instruments
The
carrying values of financial instruments, including accounts receivable,
accounts payable and other accrued liabilities, approximate their fair values
due to their short-term maturities. The estimated fair value of the Company’s
long-term debt of $88.6 million and $92.3 million at December 31, 2009 and 2008,
respectively, was based on current interest rates for similar types of
borrowings. The estimated fair values may not represent actual values of the
financial instruments that could be realized as of the balance sheet date or
that will be realized in the future.
A summary
of the Company’s assets and liabilities that are measured at fair value on a
recurring basis for each fair value hierarchy level for the periods presented
follows:
|
Total
|
Level 1
|
Level 2
|
Level 3
|
|||||||||||||
|
As
of December 31, 2009
|
||||||||||||||||
|
Assets:
|
||||||||||||||||
|
Cash
equivalents
|
$ | 33,846 | $ | 33,846 | $ | - | $ | - | ||||||||
|
Liabilities:
|
||||||||||||||||
|
Derivatives
|
$ | 3,156 | $ | - | $ | 3,156 | $ | - | ||||||||
|
As
of December 31, 2008
|
||||||||||||||||
|
Assets:
|
||||||||||||||||
|
Cash
equivalents
|
$ | 17,965 | $ | 17,965 | $ | - | $ | - | ||||||||
|
Derivatives
|
1,651 | - | 1,651 | - | ||||||||||||
| $ | 19,616 | $ | 17,965 | $ | 1,651 | $ | - | |||||||||
|
Liabilities:
|
||||||||||||||||
|
Derivatives
|
$ | 7,070 | $ | - | $ | 7,070 | $ | - | ||||||||
The
Company’s cash equivalents consist of investments in interest-bearing deposit
accounts and money market mutual funds which are valued based on quoted market
prices. The fair value of these investments approximate cost due to
their short-term maturities and the high credit quality of the issuers of the
underlying securities. Interest rate swaps are valued based on
forward curves observable in the market. Other derivative contracts
are measured using broker quotations or observable market transactions in either
listed or over-the-counter markets. There were no changes during the periods
presented in the Company’s valuation techniques used to measure asset and
liability fair values on a recurring basis.
On June
24, 2008, the Company entered into an interest rate swap with an aggregate
notional value of $75 million whereby it exchanged its LIBOR-based variable rate
interest for a fixed rate of 4.1375%. The notional value decreases to
$50 million and then $25 million on June 30, 2010 and June 30, 2011,
respectively, and expires on June 29, 2012. The fair value of the swap
agreement, based on third-party quotes, was a liability of $3.0 million and $5.0
million at December 31, 2009 and 2008, respectively, which are recorded in
“Other long term liabilities” on the consolidated balance sheet. The
swap agreement has been designated as a cash flow hedge, and therefore changes
in its fair value are recorded as an adjustment to other comprehensive income.
There has been no ineffectiveness related to this arrangement since its
inception. During the years ended December 31, 2009 and 2008, $2.9 million and
$0.8 million, respectively, of losses on the swap were reclassified from AOCI to
interest expense. At December 31, 2009, the Company expects to
reclassify $2.3 million of net losses on the interest rate swap from accumulated
other comprehensive income to earnings during the next twelve
months.
74
Also on
June 24, 2008, the Company entered into a cross currency swap denominated in
Euro with an aggregate notional value of $27.3 million. The notional
value decreased ratably each month over the term of the agreement and expired on
March 31, 2009. The fair value of the swap agreement, based on third-party
quotes, was an asset of $1.0 million at December 31, 2008. The swap agreement
was designated as a cash flow hedge, and therefore changes in its fair value
were recorded as an adjustment to other comprehensive income. There
was no ineffectiveness related to this arrangement.
As of
December 31, 2009, the Company had no open commodity futures
contracts. As of December 31, 2008, the Company had copper and
nickel futures contracts with notional values of $3.6 million. The
fair value of the contracts, based on third-party quotes, was a liability of
$2.1 million as of December 31, 2008, and is recorded in “Other accrued
liabilities” on the accompanying consolidated balance sheets. The Company did
not electe hedge accounting for these contracts, and therefore changes in their
fair value were recognized in earnings. For the years ended December
31, 2009, 2008 and 2007, the consolidated statements of operations include $2.0
million, $(1.7) million and $(0.1) million, respectively, of unrealized gains
(losses) as a result of changes in the fair value of these
contracts. Realized gains (losses) on these contracts of $(1.0)
million, $(0.4) million and $0.1 million were recognized in the years ended
December 31, 2009, 2008, and 2007, respectively.
As of
December 31, 2009 and 2008, the Company had foreign currency contracts with
notional values of $10.5 million and $16.5 million, respectively. The fair
values of the contracts was a liability of $0.1 million at December 31, 2009 and
an asset of $0.7 million at December 31, 2008, and are recorded in “Other
accrued liabilities” and in “Other current assets”, respectively, on the
consolidated balance sheets. The Company has not elected hedge accounting for
these contracts; therefore, changes in the fair value are recognized as a
component of selling, general and administrative expense. For the
years ended December 31, 2009, 2008 and 2007, the consolidated statements of
operations include $(0.7) million, $0.3 million and $0.2 million, respectively,
of unrealized gains (losses) as a result of changes in the fair value of these
contracts. Realized gains (losses) on these contracts of $0.9
million, $(0.3) million and $0.5 million were recognized in the years ended
December 31, 2009, 2008, and 2007, respectively.
On
July 1, 2005, the Company entered into an interest rate collar with an
aggregate notional value of $90 million, whereby the Company exchanged its
LIBOR based variable rate interest for a ceiling of 4.75% and a floor of
approximately 3.40%. The LIBOR-based interest can vary between the ceiling and
floor based on market conditions. The Company did not elect hedge accounting for
the collar agreement, and therefore changes in the fair value were recognized in
income as a component of interest expense. The collar agreement expired on
July 1, 2008.
16.
Concentration of Credit Risk
In
addition to interest rate swaps, financial instruments which potentially subject
the Company to concentrations of credit risk consist primarily of trade accounts
receivable.
The
Company performs credit evaluations of its customers prior to delivery or
commencement of services and normally does not require collateral. Letters of
credit are occasionally required for international customers when the Company
deems necessary. The Company maintains an allowance for potential credit losses
and losses have historically been within management’s expectations.
The
Company may be exposed to credit-related losses in the event of non-performance
by counterparties to financial instruments. Counterparties to the Company’s
financial instruments represent, in general, international financial
institutions or well-established financial institutions.
No one
customer accounted for 10% or more of the Company’s sales in 2009, 2008 or 2007
or accounts receivable at December 31, 2009 or 2008.
75
17.
Related Party Transactions
During
2008 and 2007, the Company paid a management fee of $0.5 million, and $1.0
million, respectively, to Colfax Towers, a party related by common ownership,
recorded in selling, general and administrative expenses. This arrangement was
discontinued following the Company’s IPO in May 2008.
18.
Operations by Geographical Area
The
Company’s operations have been aggregated into a single reportable operating
segment for the design, production and distribution of fluid handling products.
The operations of the Company on a geographic basis are as follows:
|
Year ended December 31,
|
||||||||||||
|
2009
|
2008
|
2007
|
||||||||||
|
Net
sales by origin:
|
||||||||||||
|
United
States
|
$ | 177,373 | $ | 189,924 | $ | 173,713 | ||||||
|
Foreign
locations:
|
||||||||||||
|
Germany
|
180,917 | 239,723 | 190,693 | |||||||||
|
Other
|
166,734 | 175,207 | 141,899 | |||||||||
|
Total
foreign locations
|
347,651 | 414,930 | 332,592 | |||||||||
|
Total
net sales
|
$ | 525,024 | $ | 604,854 | $ | 506,305 | ||||||
|
Net
sales by product:
|
||||||||||||
|
Pumps,
including aftermarket parts and service
|
$ | 443,073 | $ | 529,300 | $ | 441,692 | ||||||
|
Systems,
including installation service
|
69,339 | 58,231 | 48,355 | |||||||||
|
Valves
|
10,081 | 10,094 | 9,537 | |||||||||
|
Other
|
2,531 | 7,229 | 6,721 | |||||||||
|
Total
net sales
|
$ | 525,024 | $ | 604,854 | $ | 506,305 | ||||||
|
December 31,
|
||||||||
|
2009
|
2008
|
|||||||
|
Long-lived
assets:
|
||||||||
|
United
States
|
$ |
24,785
|
$ | 26,257 | ||||
|
Foreign
locations:
|
||||||||
|
Germany
|
48,232 | 48,598 | ||||||
|
Other
|
19,073 | 17,235 | ||||||
|
Total
foreign locations
|
67,305 | 65,833 | ||||||
|
Total
long-lived assets
|
$ | 92,090 | $ | 92,090 | ||||
19.
Commitments and Contingencies
Asbestos
Liabilities and Insurance Assets
Two of
our subsidiaries are each one of many defendants in a large number of lawsuits
that claim personal injury as a result of exposure to asbestos from products
manufactured with components that are alleged to have contained asbestos. Such
components were acquired from third-party suppliers, and were not manufactured
by any of our subsidiaries nor were the subsidiaries producers or direct
suppliers of asbestos. The manufactured products that are alleged to have
contained asbestos generally were provided to meet the specifications of the
subsidiaries’ customers, including the U.S. Navy.
The
subsidiaries settle asbestos claims for amounts management considers reasonable
given the facts and circumstances of each claim. The annual average settlement
payment per asbestos claimant has fluctuated during the past several years.
Management expects such fluctuations to continue in the future based upon, among
other things, the number and type of claims settled in a particular period and
the jurisdictions in which such claims arise. To date, the majority of settled
claims have been dismissed for no payment.
76
Of the
25,295 pending claims, approximately 4,400 of such claims have been brought in
various federal and state courts in Mississippi; approximately 3,100 of such
claims have been brought in the Supreme Court of New York County, New York;
approximately 200 of such claims have been brought in the Superior Court,
Middlesex County, New Jersey; and approximately 1,000 claims have been filed in
state courts in Michigan and the U.S. District Court, Eastern and Western
Districts of Michigan. The remaining pending claims have been filed in state and
federal courts in Alabama, California, Kentucky, Louisiana, Pennsylvania, Rhode
Island, Texas, Virginia, the U.S. Virgin Islands and Washington.
Claims
activity related to asbestos is as follows (1):
|
Year ended December 31,
|
||||||||||||
|
2009
|
2008
|
2007
|
||||||||||
|
Claims
unresolved at the beginning of the period
|
35,357 | 37,554 | 50,020 | |||||||||
|
Claims
filed (2)
|
3,323 | 4,729 | 6,861 | |||||||||
|
Claims
resolved (3)
|
(13,385 | ) | (6,926 | ) | (19,327 | ) | ||||||
|
Claims
unresolved at the end of the period
|
25,295 | 35,357 | 37,554 | |||||||||
|
Average
cost of resolved claims (4)
|
$ | 11,106 | $ | 5,378 | $ | 5,232 | ||||||
|
(1)
|
Excludes
claims filed by one legal firm that have been “administratively
dismissed.”
|
|
(2)
|
Claims
filed include all asbestos claims for which notification has been received
or a file has been opened.
|
|
(3)
|
Claims
resolved include asbestos claims that have been settled or dismissed or
that are in the process of being settled or dismissed based upon
agreements or understandings in place with counsel for the
claimants.
|
|
(4)
|
Average
cost of settlement to resolve claims in whole dollars. These amounts
exclude claims in Mississippi for which the majority of claims have
historically been without merit and have been resolved for no payment.
These amounts exclude any potential insurance
recoveries.
|
The
Company has projected each subsidiary’s future asbestos-related liability costs
with regard to pending and future unasserted claims based upon the Nicholson
methodology. The Nicholson methodology is the standard approach used by most
experts and has been accepted by numerous courts. It is the Company’s policy to
record a liability for asbestos-related liability costs for the longest period
of time that it can reasonably estimate.
The
Company believes that it can reasonably estimate the asbestos-related liability
for pending and future claims that will be resolved in the next 15 years and has
recorded that liability as its best estimate. While it is reasonably possible
that the subsidiaries will incur costs after this period, the Company does not
believe the reasonably possible loss or range of reasonably possible loss is
estimable at the current time. Accordingly, no accrual has been recorded for any
costs which may be paid after the next 15 years. Defense costs associated with
asbestos-related liabilities as well as costs incurred related to litigation
against the subsidiaries’ insurers are expensed as incurred.
During
the third quarter of 2009, an analysis of claims data including filing and
dismissal rates, alleged disease mix, filing jurisdiction, as well as settlement
values resulted in the determination that the Company should revise its rolling
15-year estimate of asbestos-related liability for pending and future
claims. As a result, the Company recorded an $11.6 million pretax
charge in the third quarter of 2009, which was comprised of an increase to its
asbestos-related liabilities of $111.3 million offset by expected insurance
recoveries of $99.7 million.
Each
subsidiary has separate, substantial insurance coverage resulting from the
independent corporate history of each entity. In its evaluation of the insurance
asset, in addition to the criteria listed above, the Company used differing
insurance allocation methodologies for each subsidiary based upon the applicable
law pertaining to the affected subsidiary.
For one
of the subsidiaries, on October 14, 2009, the Delaware Court of Chancery ruled
that asbestos-related costs should be allocated among excess insurers using an
“all sums” allocation (which allows an insured to collect all sums paid in
connection with a claim from any insurer whose policy is triggered, up to the
policy’s applicable limits) and that the subsidiary has rights to excess
insurance policies purchased by a former owner of the business. Based
upon this ruling mandating an “all sums” allocation, as well as the language of
the underlying insurance policies and the determination that defense costs are
outside policy limits, the Company as of October 2, 2009, increased its future
expected recovery percentage from 67% to 90% of asbestos-related costs following
the exhaustion in the future of its primary and umbrella layers of insurance and
recorded a pretax gain of $17.3 million. The subsidiary expects to be
responsible for approximately 10% of all future asbestos-related
costs.
77
In
November 2008, the subsidiary entered into a settlement agreement with the
primary and umbrella carrier governing all aspects of the carrier’s past and
future handling of the asbestos related bodily injury claims against the
subsidiary. As a result of this agreement, during the third quarter of
2008, the Company increased its insurance asset by $7.0 million attributable to
resolution of a dispute concerning certain pre-1966 insurance policies and
recorded a corresponding pretax gain. The additional insurance will be allocated
by the carrier to cover any gaps in coverage up to $7.0 million resulting from
exhaustion of umbrella policies and/or the failure of any excess carrier to pay
amounts incurred in connection with asbestos claims. The Company reimbursed the
primary insurer for $7.6 million in deductibles and retrospective premiums in
the fourth quarter of 2008 and has no further liability to the insurer under
these provisions of the primary policies.
Presently,
this subsidiary is having all of its liability and defense costs covered in full
by its primary and umbrella insurance carrier; however, this coverage
is expected to exhaust in the first quarter of 2010. No cost
sharing or allocation agreement is currently in place with the Company’s
excess insurers; however, certain excess insurers have stated that they will
abide by the Delaware Chancery Court's recent coverage rulings, including
its ruling that the subsidiary may seek insurance coverage from the
Company's excess insurers on and “all sums” basis and that they will defend
and/or indemnify the subsidiary against asbestos claims, subject to
their reservation of rights.
In 2003,
the other subsidiary brought legal action against a large number of its insurers
and its former parent to resolve a variety of disputes concerning insurance for
asbestos-related bodily injury claims asserted against it. Although
none of these insurance companies contested coverage, they disputed the timing,
reasonableness and allocation of payments. For this subsidiary, it
was determined by court ruling in the fourth quarter of 2007, that the
allocation methodology mandated by the New Jersey courts will apply. Further
court rulings in December of 2009, clarified the allocation
calculation related to amounts currently due from insurers as well as
amounts the Company expects to be reimbursed for asbestos-related costs incurred
in future periods. As a result, in the fourth quarter of 2009, the
Company increased its receivable for past costs by $11.9 million and decreased
its insurance asset for future costs by $9.8 million and recorded a pretax gain
of $2.1 million. The subsidiary expects to responsible for
approximately 14% of all future asbestos-related costs.
The
Company has established reserves of $443.8 million and $357.3 million as of
December 31, 2009 and December 31, 2008, respectively, for the probable and
reasonably estimable asbestos-related liability cost it believes the
subsidiaries will pay through the next 15 years. It has also
established recoverables of $389.4 million and $304.0 million as of
December 31, 2009 and December 31, 2008, respectively, for the insurance
recoveries that are deemed probable during the same time period. Net of these
recoverables, the expected cash outlay on a non-discounted basis for
asbestos-related bodily injury claims over the next 15 years was
$54.3 million and $53.3 million as of December 31, 2009 and
December 31, 2008, respectively. In addition, the Company has recorded a
receivable for liability and defense costs previously paid in the amount of
$45.9 million and $36.4 million as of December 31, 2009 and December 31,
2008, respectively, for which insurance recovery is deemed
probable. The Company has recorded the reserves for the asbestos
liabilities as “Accrued asbestos liability” and “Long-term asbestos liability”
and the related insurance recoveries as “Asbestos insurance asset” and
“Long-term asbestos insurance asset”. The receivable for previously
paid liability and defense costs is recorded in “Asbestos insurance receivable”
and “Long-term asbestos insurance receivable” in the accompanying consolidated
balance sheets.
The
income related to these liabilities and legal defense was $2.2 million, net of
estimated insurance recoveries, for the year ended December 31, 2009 compared to
$4.8 million and $63.9 million for the years ended December 31, 2008 and 2007,
respectively. Legal costs related to the subsidiaries’ action against
their asbestos insurers were $11.7 million for the year ended December 31, 2009
compared to $17.2 million and $13.6 million for the years ended December 31,
2008 and 2007, respectively.
Management’s
analyses are based on currently known facts and a number of assumptions.
However, projecting future events, such as new claims to be filed each year, the
average cost of resolving each claim, coverage issues among layers of insurers,
the method in which losses will be allocated to the various insurance policies,
interpretation of the effect on coverage of various policy terms and limits and
their interrelationships, the continuing solvency of various insurance
companies, the amount of remaining insurance available, as well as the numerous
uncertainties inherent in asbestos litigation could cause the actual liabilities
and insurance recoveries to be higher or lower than those projected or recorded
which could materially affect our financial condition, results of operations or
cash flow.
78
General
Litigation
On
June 3, 1997, one of our subsidiaries was served with a complaint in a case
brought by Litton Industries, Inc. (“Litton”) in the Superior Court of New
Jersey which alleges damages in excess of $10.0 million incurred as a result of
losses under a government contract bid transferred in connection with the sale
of its former Electro-Optical Systems business. In the third quarter of 2004,
this case was tried and the jury rendered a verdict of $2.1 million for the
plaintiffs. After appeals by both parties, the Supreme Court of New Jersey
upheld the plaintiffs’ right to a refund of their attorney’s fees and costs of
trial, but remanded the issue to the trial court to reconsider the amount of
fees using a proportionality analysis of the relationship between the fee
requested and the damages recovered. The date for the new trial on
additional claims allowed by the Appellate Division of the New Jersey Superior
Court and the recalculation of attorney’s fees has not been set. The
subsidiary intends to continue to defend this matter vigorously. At December 31,
2009, the Company’s consolidated balance sheet includes a liability, reflected
in “Other liabilities”, related to this matter of $9.5 million.
In April
1999, the Company’s Imo Industries subsidiary resolved through a settlement the
matter of Young v. Imo Industries Inc. that was pending in the United States
District Court for the District of Massachusetts. This matter had been brought
on behalf of a class of retirees of one of the subsidiary’s divisions relating
to retiree health care obligations. On June 15, 2005, a motion was filed
seeking an order that certain of the features of the plan as implemented by the
Company were in violation of the settlement agreement. On December 16, 2008, the
parties executed a Memorandum of Understanding, memorializing the principal
terms of a new settlement agreement that resolved the litigation in its
entirety. A final settlement agreement was executed by the parties and approved
by the court in the fourth quarter of 2009. At December 31, 2009, the
Company’s consolidated balance reflected an accumulated post retirement benefit
obligation of $2.4 million related to this matter, of which $0.6 million was
paid in January 2010.
The
Company is also involved in various other pending legal proceedings arising out
of the ordinary course of the Company’s business. None of these legal
proceedings are expected to have a material adverse effect on the financial
condition, results of operations or cash flow of the Company. With respect
to these proceedings and the litigation and claims described in the
preceding paragraphs, management of the Company believes that it will
either prevail, has adequate insurance coverage or has established
appropriate reserves to cover potential liabilities. Any costs that management
estimates may be paid related to these proceedings or claims are accrued when
the liability is considered probable and the amount can be reasonably estimated.
There can be no assurance, however, as to the ultimate outcome of any of
these matters, and if all or substantially all of these legal proceedings were
to be determined adversely to the Company, there could be a material adverse
effect on the financial condition, results of operations or cash flow of the
Company.
Guarantees
At
December 31, 2009, there were $14.4 million of letters of credit
outstanding. Additionally, at December 31, 2009, we had issued $12.9
million of bank guarantees securing primarily customer prepayments, performance,
and product warranties in our European and Asian operations.
79
Minimum
Lease Obligations
The
Company has the following minimum rental obligations under non-cancelable
operating leases for certain property, plant and equipment. The remaining lease
terms range from 1 to 5 years.
|
Year
ended December 31,
|
||||
|
2010
|
$ | 3,873 | ||
|
2011
|
2,428 | |||
|
2012
|
1,719 | |||
|
2013
|
1,087 | |||
|
2014
|
519 | |||
|
Thereafter
|
240 | |||
|
Total
|
$ | 9,866 | ||
Net
rental expense under operating leases was approximately $4.8 million, $5.1
million, and $4.6 million in 2009, 2008 and 2007,
respectively.
20.
Quarterly Results for 2009 and 2008 (Unaudited)
The summarized interim financial
data presented below for 2009 and 2008 gives effect to the restatement of the
Company’s consolidated financial statements as discussed in Note 2.
|
First Quarter
|
Second Quarter
|
|||||||||||||||||||||||
|
As
|
As
|
|||||||||||||||||||||||
|
Previously
|
As
|
Previously
|
As
|
|||||||||||||||||||||
|
Reported
|
Adjustment
|
Restated
|
Reported
|
Adjustment
|
Restated
|
|||||||||||||||||||
|
2009
|
||||||||||||||||||||||||
|
Net
sales
|
$ | 136,323 | $ | 136,323 | $ | 129,185 | $ | 129,185 | ||||||||||||||||
|
Cost
of sales
|
88,308 | 88,308 | 84,630 | 84,630 | ||||||||||||||||||||
|
Gross
profit
|
48,015 | 48,015 | 44,555 | 44,555 | ||||||||||||||||||||
|
Selling,
general and administrative expenses
|
30,187 | (322 | ) | 29,865 | 28,586 | (193 | ) | 28,393 | ||||||||||||||||
|
Restructuring
and other related charges
|
- | - | 486 | - | 486 | |||||||||||||||||||
|
Research
and development expenses
|
1,407 | 1,407 | 1,680 | 1,680 | ||||||||||||||||||||
|
Asbestos
liability and defense costs
|
1,645 | 1,645 | 1,482 | 1,482 | ||||||||||||||||||||
|
Asbestos
coverage litigation expenses
|
2,966 | 2,966 | 4,027 | 4,027 | ||||||||||||||||||||
|
Operating
income
|
11,810 | 322 | 12,132 | 8,294 | 193 | 8,487 | ||||||||||||||||||
|
Interest
expense
|
1,846 | 1,846 | 1,786 | 1,786 | ||||||||||||||||||||
|
Income
before income taxes
|
9,964 | 322 | 10,286 | 6,508 | 193 | 6,701 | ||||||||||||||||||
|
Provision
for income taxes
|
3,103 | 118 | 3,221 | 2,142 | 83 | 2,225 | ||||||||||||||||||
|
Net
income available to common shareholders
|
$ | 6,861 | $ | 204 | $ | 7,065 | $ | 4,366 | $ | 110 | $ | 4,476 | ||||||||||||
|
Net
income per share—basic and diluted
|
$ | 0.16 | $ | - | $ | 0.16 | $ | 0.10 | $ | - | $ | 0.10 | ||||||||||||
80
|
Third Quarter
|
Fourth Quarter
|
|||||||||||||||||||||||
|
As
|
As
|
|||||||||||||||||||||||
|
Previously
|
As
|
Previously
|
As
|
|||||||||||||||||||||
|
Reported
|
Adjustment
|
Restated
|
Reported
|
Adjustment
|
Restated
|
|||||||||||||||||||
|
2009
|
||||||||||||||||||||||||
|
Net
sales
|
$ | 128,545 | $ | 128,545 | $ | 130,971 | $ | 130,971 | ||||||||||||||||
|
Cost
of sales
|
82,339 | 82,339 | 83,960 | 83,960 | ||||||||||||||||||||
|
Gross
profit
|
46,206 | 46,206 | 47,011 | 47,011 | ||||||||||||||||||||
|
Selling,
general and administrative expenses
|
28,136 | (258 | ) | 27,878 | 27,426 | (398 | ) | 27,028 | ||||||||||||||||
|
Restructuring
and other related charges
|
9,608 | 9,608 | 7,420 | 7,420 | ||||||||||||||||||||
|
Research
and development expenses
|
1,523 | 1,523 | 1,320 | 1,320 | ||||||||||||||||||||
|
Asbestos
liability and defense income
|
(4,303 | ) | (4,303 | ) | (1,017 | ) | (1,017 | ) | ||||||||||||||||
|
Asbestos
coverage litigation expenses
|
1,845 | 1,845 | 2,904 | 2,904 | ||||||||||||||||||||
|
Operating
income
|
9,397 | 258 | 9,655 | 8,958 | 398 | 9,356 | ||||||||||||||||||
|
Interest
expense
|
1,834 | 1,834 | 1,746 | 1,746 | ||||||||||||||||||||
|
Income
before income taxes
|
7,563 | 258 | 7,821 | 7,212 | 398 | 7,610 | ||||||||||||||||||
|
Provision
for income taxes
|
2,188 | 103 | 2,291 | 2,092 | (1,208 | ) | 884 | |||||||||||||||||
|
Net
income available to common shareholders
|
$ | 5,375 | $ | 155 | $ | 5,530 | $ | 5,120 | $ | 1,606 | $ | 6,726 | ||||||||||||
|
Net
income per share—basic
|
$ | 0.12 | $ | 0.01 | $ | 0.13 | $ | 0.12 | $ | 0.04 | $ | 0.16 | ||||||||||||
|
Net
income per share—diluted
|
$ | 0.12 | $ | 0.01 | $ | 0.13 | $ | 0.12 | $ | 0.04 | $ | 0.15 | ||||||||||||
|
First Quarter
|
Second Quarter
|
|||||||||||||||||||||||
|
As
|
As
|
|||||||||||||||||||||||
|
Previously
|
As
|
Previously
|
As
|
|||||||||||||||||||||
|
Reported
|
Adjustment
|
Restated
|
Reported
|
Adjustment
|
Restated
|
|||||||||||||||||||
|
2008
|
||||||||||||||||||||||||
|
Net
sales
|
$ | 130,651 | $ | 130,651 | $ | 161,431 | $ | 161,431 | ||||||||||||||||
|
Cost
of sales
|
82,473 | 82,473 | 104,654 | 104,654 | ||||||||||||||||||||
|
Gross
profit
|
48,178 | 48,178 | 56,777 | 56,777 | ||||||||||||||||||||
|
Selling,
general and administrative expenses
|
28,507 | (330 | ) | 28,177 | 35,776 | (331 | ) | 35,445 | ||||||||||||||||
|
Initial
public offering related costs
|
- | - | 57,017 | 57,017 | ||||||||||||||||||||
|
Research
and development expenses
|
1,381 | 1,381 | 1,571 | 1,571 | ||||||||||||||||||||
|
Asbestos
liability and defense costs (income)
|
278 | 278 | (715 | ) | (715 | ) | ||||||||||||||||||
|
Asbestos
coverage litigation expenses
|
3,139 | 3,139 | 3,970 | 3,970 | ||||||||||||||||||||
|
Operating
income
|
14,873 | 330 | 15,203 | (40,842 | ) | 331 | (40,511 | ) | ||||||||||||||||
|
Interest
expense
|
4,497 | 4,497 | 3,236 | 3,236 | ||||||||||||||||||||
|
Income
before income taxes
|
10,376 | 330 | 10,706 | (44,078 | ) | 331 | (43,747 | ) | ||||||||||||||||
|
Provision
for income taxes
|
3,578 | 102 | 3,680 | (12,679 | ) | 88 | (12,591 | ) | ||||||||||||||||
|
Net
income (loss)
|
6,798 | 228 | 7,026 | (31,399 | ) | 243 | (31,156 | ) | ||||||||||||||||
|
Dividends
on preferred stock
|
- | - | (3,492 | ) | (3,492 | ) | ||||||||||||||||||
|
Net
income (loss) available to common shareholders
|
$ | 6,798 | $ | 228 | $ | 7,026 | $ | (34,891 | ) | $ | 243 | $ | (34,648 | ) | ||||||||||
|
Net
income (loss) per share—basic and diluted
|
$ | 0.31 | $ | 0.01 | $ | 0.32 | $ | (1.01 | ) | $ | 0.01 | $ | (1.00 | ) | ||||||||||
81
|
Third Quarter
|
Fourth Quarter
|
|||||||||||||||||||||||
|
As
|
As
|
|||||||||||||||||||||||
|
Previously
|
As
|
Previously
|
As
|
|||||||||||||||||||||
|
Reported
|
Adjustment
|
Restated
|
Reported
|
Adjustment
|
Restated
|
|||||||||||||||||||
|
2008
|
||||||||||||||||||||||||
|
Net
sales
|
$ | 153,461 | $ | 153,461 | $ | 159,311 | $ | 159,311 | ||||||||||||||||
|
Cost
of sales
|
98,983 | 98,983 | 101,557 | 101,557 | ||||||||||||||||||||
|
Gross
profit
|
54,478 | 54,478 | 57,754 | 57,754 | ||||||||||||||||||||
|
Selling,
general and administrative expenses
|
33,233 | (330 | ) | 32,903 | 27,718 | (138 | ) | 27,580 | ||||||||||||||||
|
Research
and development expenses
|
1,478 | 1,478 | 1,426 | 1,426 | ||||||||||||||||||||
|
Asbestos
liability and defense (income) costs
|
(6,312 | ) | (6,312 | ) | 1,978 | 1,978 | ||||||||||||||||||
|
Asbestos
coverage litigation expenses
|
5,148 | 5,148 | 4,905 | 4,905 | ||||||||||||||||||||
|
Operating
income
|
20,931 | 330 | 21,261 | 21,727 | 138 | 21,865 | ||||||||||||||||||
|
Interest
expense
|
1,951 | 1,951 | 2,138 | 2,138 | ||||||||||||||||||||
|
Income
before income taxes
|
18,980 | 330 | 19,310 | 19,589 | 138 | 19,727 | ||||||||||||||||||
|
Provision
for income taxes
|
5,329 | 173 | 5,502 | 9,210 | (336 | ) | 8,874 | |||||||||||||||||
|
Net
income available to common shareholders
|
$ | 13,651 | $ | 157 | $ | 13,808 | $ | 10,379 | $ | 474 | $ | 10,853 | ||||||||||||
|
Net
income per share—basic
|
$ | 0.31 | $ | - | $ | 0.31 | $ | 0.24 | $ | 0.01 | $ | 0.25 | ||||||||||||
|
(1)
|
Second
quarter 2008 results include $57.0 million of non-recurring costs
associated with our IPO.
|
21.
Subsequent Event
The board
of directors of the Company appointed Clay H. Kiefaber as the Company’s
President and Chief Executive Officer effective January 9, 2010. Mr.
Kiefaber succeeds John A. Young, who resigned as President and Chief Executive
Officer and as a director of the Company, effective January 9,
2010.
In
connection with Mr. Young’s resignation, the Company and Mr. Young entered into
a separation agreement on January 9, 2010, which provided Mr. Young with certain
termination benefits, including cash payments totaling $1.6 million, health
coverage for a period of one year and accelerated vesting of share-based
payments. In the first quarter of 2010, the Company expects to
recognize restructuring and other related charges totaling $2.1 million for
these benefits.
In
connection with Mr. Kiefaber’s appointment, the board of directors approved a
grant to him of 102,124 stock options and 40,850 performance restricted stock
units, effective on January 11, 2010 (the “Grant Date”) pursuant to the terms of
the 2008 Plan. The stock options vest in three equal annual installments
beginning with the first anniversary of the Grant Date (subject to Mr.
Kiefaber’s continued employment with the Company on each such anniversary) and
will have a per share exercise price of $12.27, the closing price of the
Company’s common stock on the Grant Date. The performance restricted stock units
will be earned if the Company has cumulative adjusted earnings per share equal
to at least 110% of the adjusted earnings per share for the 2009 fiscal year for
any four consecutive fiscal quarters beginning with the first fiscal quarter of
2010 and ending with the last fiscal quarter of 2013, and, if earned, will vest
in two equal installments upon the fourth and fifth anniversaries of the Grant
Date, subject to Mr. Kiefaber’s continued employment with the Company on each
such anniversary. The fair value of these awards totaled $1.1
million, which is expected to be recognized over a period of approximately 3.4
years.
82
|
ITEM
9.
|
CHANGES
IN AND DISAGREEMENTS WITH ACCOUNTANTS ON ACCOUNTING AND FINANCIAL
DISCLOSURE
|
None
|
ITEM
9A.
|
CONTROLS
AND PROCEDURES
|
Disclosure
Controls and Procedures
In
connection with this restatement on Form 10-K/A, under the supervision and with
the participation of our management, including our Chief Executive Officer and
Chief Financial Officer, the Company has re-evaluated the effectiveness of our
disclosure controls and procedures as defined in Rule 13a-15(e) under the
Securities Exchange Act of 1934, as amended (the “Exchange Act”), as of the end
of the period covered by this report. Management, in consultation with the Audit
Committee, has concluded that the restatement errors, described in Note 2 to the
Consolidated Financial Statements, constituted a material weakness in the
Company’s internal control over financial reporting as of the date of the
Original Form 10-K. As a result of the material weakness, management
has concluded that the Company’s disclosure controls and procedures were not
effective in providing reasonable assurance that the information required to be
disclosed in this report has been recorded, processed, summarized and reported
as of the end of the period covered by this report.
Disclosure
controls and procedures include, without limitation, controls and procedures
designed to ensure that information required to be disclosed by us in reports we
file or submit under the Exchange Act is recorded, processed, summarized and
reported within the time periods specified in the Securities and Exchange
Commissions rules and forms, and that such information is accumulated and
communicated to our management, including our Chief Executive Officer and Chief
Financial Officer, as appropriate, to allow timely decisions regarding required
disclosure.
The
financial statements for the period covered by this amended report were prepared
with particular attention to the material weakness. Accordingly, management
believes that the consolidated financial statements included in this Annual
Report fairly present, in all material respects, our financial condition,
results of operations and cash flows as of and for the periods
presented.
The
Company continually reviews its disclosure controls and procedures and makes
changes, as necessary, to ensure the quality of its financial reporting. As
detailed below, the Company has implemented certain additional controls that it
believes will remediate the issues that arose with respect to the material
weakness.
Changes
in Internal Control Over Financial Reporting
Management
and the Board of Directors are committed to the remediation of the material
weakness set forth above as well as the continued improvement of the Company’s
overall system of internal control over financial reporting. Subsequent to the
period covered by this report, management has implemented measures to remediate
the material weakness in internal control over financial reporting described
above. Specifically, we have implemented procedures to enhance the maintenance
and review of participant data for benefit plans. As part of the
Company’s fiscal 2010 assessment of internal control over financial reporting,
management will conduct sufficient testing and evaluation of the implemented
controls to ascertain whether they are designed and operating
effectively. Management believes the implemented controls will
remediate the material weakness related to the maintenance and review of
participant data for benefit plans discussed in Note 2 to the Consolidated
Financial Statements.
Management’s
Annual Report on Internal Control Over Financial Reporting
The
management of Colfax Corporation is responsible for establishing and maintaining
adequate internal control over financial reporting as defined in Rules 13a-15(f)
and 15d-15(f) under the Securities Exchange Act of 1934. Our internal control
over financial reporting is designed to provide reasonable assurance regarding
the reliability of financial reporting and the preparation of financial
statements for external purposes in accordance with U.S.
GAAP. Internal control over financial reporting includes policies and
procedures that:
|
|
(i)
|
pertain
to the maintenance of records that, in reasonable detail, accurately and
fairly reflect the transactions and dispositions of the company’s
assets;
|
83
|
(ii)
|
provide
reasonable assurance that transactions are recorded as necessary to permit
preparation of financial statements in accordance with U.S. GAAP, and that
receipts and expenditures are being made only in accordance with the
authorization of management and directors of the company;
and
|
|
(iii)
|
provide
reasonable assurance regarding prevention or timely detection of
unauthorized acquisition, use or disposition of the company’s assets that
could have a material effect on the financial
statements.
|
Because
of inherent limitations, internal control over financial reporting may not
prevent or detect misstatements. Also, projections of any evaluation
of effectiveness to future periods are subject to the risk that controls may
become inadequate because of changes in conditions, or that the degree of
compliance with existing policies or procedures may deteriorate.
Under the
supervision and with the participation of our Chief Executive Officer and Chief
Financial Officer, our management conducted an assessment of the effectiveness
of internal control over financial reporting as of December 31, 2009 based on
the criteria established in Internal Control – Integrated
Framework, issued by the Committee of Sponsoring Organizations of the
Treadway Commission. As a result of the material weakness discussed
above, management has concluded that our internal control over financial
reporting were not effective as of December 31, 2009.
Our
independent registered public accounting firm is engaged to express an opinion
on our internal control over financial reporting, as stated in their report
which is included in Part II, Item 8 of this Form 10-K/A under the caption
“Report of Ernst & Young LLP, Independent Registered Public Accounting Firm,
on Internal Control Over Financial Reporting.”
|
ITEM
9B.
|
OTHER
INFORMATION
|
None
PART
III
|
ITEM
10.
|
DIRECTORS,
EXECUTIVE OFFICERS AND CORPORATE
GOVERNANCE
|
Information
relating to our Executive Officers is set forth in Part I of this Form 10-K/A
under the caption “Executive Officers of the Registrant.” Additional
information regarding our directors, audit committee and compliance with Section
16(a) of the Exchange Act is incorporated by reference to such information
included in our proxy statement for our 2010 annual meeting to be filed with the
SEC within 120 days after the end of the fiscal year covered by this Form 10-K
(the “2010 Proxy Statement”) under the captions “Election of Directors”, “Board
of Directors and its Committees – Audit Committee” and “Section 16(a) Beneficial
Ownership Reporting Compliance”.
As part
of our system of corporate governance, our board of directors has adopted a code
of ethics that applies to all employees, including our principal executive
officer and our principal financial officer and principal accounting officer. A
copy of the code of ethics is available on our website at www.colfaxcorp.com.
We intend to satisfy any disclosure requirement under Item 5.05 of Form 8-K
regarding an amendment to, or a waiver from, a provision of our code of ethics
by posting such information on our website at the address above.
|
ITEM
11.
|
EXECUTIVE
COMPENSATION
|
Information
responsive to this item is incorporated by reference to such information
included in our 2010 Proxy Statement under the captions “Executive
Compensation”, “Director Compensation”, “Compensation Discussion and Analysis”,
“Compensation Committee Report” and “Compensation Committee Interlocks and
Insider Participation”,
|
ITEM
12.
|
SECURITY
OWNERSHIP OF CERTAIN BENEFICIAL OWNERS AND MANAGEMENT AND RELATED
STOCKHOLDER MATTERS
|
Information
responsive to this item is incorporated by reference to such information
included in our 2010 Proxy Statement under the captions “Beneficial Ownership of
Our Common Stock” and “Equity Compensation Plan Information”.
84
|
ITEM
13.
|
CERTAIN
RELATIONSHIPS AND RELATED TRANSACTIONS, AND DIRECTOR
INDEPENDENCE
|
Information
responsive to this item is incorporated by reference to such information
included in our 2010 Proxy Statement under the captions “Certain Relationships
and Related Person Transactions” and “Director Independence”.
|
ITEM
14.
|
PRINCIPAL
ACCOUNTANT FEES AND SERVICES
|
Information
responsive to this item is incorporated by reference to such information
included in our 2010 Proxy Statement under the captions “Independent Registered
Public Accountant Fees and Services” and “Audit Committee’s Pre-Approval
Policies and Procedures”.
PART
IV
|
ITEM
15.
|
EXHIBITS
AND FINANCIAL STATEMENT SCHEDULES
|
|
(a)
|
The
following documents are filed as part of this
report.
|
|
|
(1)
|
Financial
Statements. The financial statements are set forth under “Item 8.
Financial Statements and Supplementary Data” of this report on Form
10-K/A.
|
|
|
(2)
|
Schedules.
An index of Exhibits and Schedules is on page 88 of this report. Schedules
other than those listed below have been omitted from this Annual Report
because they are not required, are not applicable or the required
information is included in the financial statements or the notes
thereto.
|
|
(b)
|
Exhibits.
The exhibits listed in the accompanying Exhibit Index are filed or
incorporated by reference as part of this
report.
|
|
(c)
|
Not
applicable.
|
85
SIGNATURES
Pursuant
to the requirements of Section 13 or 15(d) of the Securities Exchange Act
of 1934, the Registrant has duly caused this report to be signed on its behalf
by the undersigned, thereunto duly authorized on December 13, 2010.
|
COLFAX
CORPORATION
|
|
|
By:
|
/s/ CLAY H.
KIEFABER
|
|
Clay
H. Kiefaber
|
|
|
President
and Chief Executive
Officer
|
|
86
COLFAX
CORPORATION
INDEX
TO FINANCIAL STATEMENTS, SUPPLEMENTARY DATA AND FINANCIAL STATEMENT
SCHEDULES
|
|
|
Page Number in
Form 10-K/A
|
|
Schedules:
|
|
|
|
Valuation
and Qualifying Accounts
|
|
91
|
87
EXHIBIT
INDEX
|
Exhibit
Number
|
Description
|
Location*
|
|||
|
3.1
|
Amended
and Restated Certificate of Incorporation of Colfax
Corporation
|
|
Incorporated
by reference to Exhibit 3.1 to Colfax Corporation’s Form 8-K (File No.
001-34045) as filed with the Commission on May 13, 2008
|
||
|
3.2
|
Colfax
Corporation Amended and Restated Bylaws
|
|
Incorporated
by reference to Exhibit 3.2 to Colfax Corporation’s Form 8-K (File No.
001-34045) as filed with the Commission on May 13, 2008
|
||
|
4.1
|
Specimen
Common Stock Certificate
|
|
|||
|
10.1
|
Colfax
Corporation 2008 Omnibus Incentive Plan**
|
|
|||
|
10.1
|
a
|
Form
of Non-Qualified Stock Option Agreement for grants pursuant to the Colfax
Corporation 2008 Omnibus Incentive Plan**
|
|||
|
10.1
|
b
|
Form
of Performance Stock Unit Agreement for grants pursuant to the Colfax
Corporation 2008 Omnibus Incentive Plan**
|
|||
|
10.1
|
c
|
Form
of Outside Director Restricted Stock Unit Agreement for grants pursuant to
the Colfax Corporation 2008 Omnibus Incentive Plan**
|
|||
|
10.1
|
d
|
Form
of Outside Director Deferred Stock Unit Agreement for grants pursuant to
the Colfax Corporation 2008 Omnibus Incentive Plan**
|
|||
|
10.1
|
e
|
Form
of Outside Director Deferred Stock Unit Agreement for deferral of grants
of restricted stock made pursuant to the Colfax Corporation 2008 Omnibus
Incentive Plan**
|
|||
|
10.1
|
f
|
Form
of Outside Director Deferred Stock Unit Agreement for deferral of director
fees**
|
|||
|
10.2
|
Service
Contract for Board Member, dated November 14, 2006, between the Company
and Dr. Michael Matros**
|
||||
|
10.3
|
Form
of Indemnification Agreement entered into between the Company and each of
its directors and officers**
|
||||
|
10.4
|
Colfax
Corporation Amended and Restated Excess Benefit Plan**
|
||||
|
10.5
|
Retirement
Plan for salaried U.S. Employees of Imo Industries, Inc. and
Affiliates**
|
||||
|
10.6
|
Colfax
Corporation Excess Benefit Plan**
|
||||
|
10.7
|
Allweiler
AG Company Pension Plan**
|
||||
|
10.8
|
Colfax
Corporation Director Deferred Compensation Plan**
|
||||
|
10.9
|
Employment
Agreement between Colfax Corporation and Clay Kiefaber
|
Incorporated
by reference to Exhibit 10.1 to Colfax Corporation’s Form 8-K (File No.
001-34045) as filed with the Commission on January 11,
2010
|
|||
88
|
10.10
|
Employment
Agreement between Colfax Corporation and John A. Young**
|
||||
|
10.11
|
Employment
Agreement between Colfax Corporation and Thomas M.
O’Brien**
|
||||
|
10.12
|
Employment
Agreement between Colfax Corporation and Michael K.
Dwyer**
|
||||
|
10.13
|
Employment
Agreement between Colfax Corporation and William E.
Roller**
|
Incorporated
by reference to Exhibit 10.1 to Colfax Corporation’s Form 10-Q (File No.
001-34045) as filed with the Commission on May 8, 2009
|
|||
|
10.14
|
Employment
Agreement between Colfax Corporation and Mario E.
DiDomenico**
|
Incorporated
by reference to Exhibit 10.3 to Colfax Corporation’s Form 10-Q (File No.
001-34045) as filed with the Commission on May 8, 2009
|
|||
|
10.15
|
Employment
Agreement between Colfax Corporation and G. Scott Faison**
|
||||
|
10.16
|
Amendment
to the Employment Agreement between Colfax Corporation and John A.
Young**
|
Incorporated
by reference to Exhibit 10.13 to Colfax Corporation’s Form 10-K (File No.
001-034045) as filed with the Commission on March 6,
2009
|
|||
|
10.17
|
Amendment
to the Employment Agreement between Colfax Corporation and Thomas B.
O’Brien**
|
Incorporated
by reference to Exhibit 10.14 to Colfax Corporation’s Form 10-K (File No.
001-034045) as filed with the Commission on March 6,
2009
|
|||
|
10.18
|
Amendment
to the Employment Agreement between Colfax Corporation and Michael K.
Dwyer**
|
Incorporated
by reference to Exhibit 10.15 to Colfax Corporation’s Form 10-K (File No.
001-034045) as filed with the Commission on March 6,
2009
|
|||
|
10.19
|
Amendment
to the Employment Agreement between Colfax Corporation and William E.
Roller**
|
Incorporated
by reference to Exhibit 10.2 to Colfax Corporation’s Form 10-Q (File No.
001-34045) as filed with the Commission on May 8, 2009
|
|||
|
10.20
|
Amendment
to the Employment Agreement between Colfax Corporation and Mario E.
DiDomenico**
|
Incorporated
by reference to Exhibit 10.4 to Colfax Corporation’s Form 10-Q (File No.
001-34045) as filed with the Commission on May 8, 2009
|
|||
|
10.21
|
Amendment
to the Employment Agreement between Colfax Corporation and G. Scott
Faison**
|
Incorporated
by reference to Exhibit 10.16 to Colfax Corporation’s Form 10-K (File No.
001-034045) as filed with the Commission on March 6,
2009
|
|||
|
10.22
|
Separation
Agreement between Colfax Corporation and John A. Young**
|
Incorporated
by reference to Exhibit 10.2 to Colfax Corporation’s 8-K (File No.
001-34045) as filed with the Commission on January 11,
2010
|
|||
|
10.23
|
Tax
Equalization Program Amendment Letter between Colfax Corporation and
Michael K. Dwyer**
|
Incorporated
by reference to Exhibit 10.17 to Colfax Corporation’s Form 10-K (File No.
001-034045) as filed with the Commission on March 6,
2009
|
89
|
10.24
|
Colfax
Corporation Annual Incentive Plan**
|
Incorporated
by reference to Exhibit 10.1 to Colfax Corporation’s Form 10-Q (File No.
001-34045) as filed with the Commission on August 4,
2009
|
|||
|
10.25
|
Credit
Agreement, dated May 13, 2008, by and among the Colfax Corporation,
certain subsidiaries of Colfax Corporation identified therein and the
lenders identified therein
|
Incorporated
by reference to Exhibit 10.1 to Colfax Corporation’s Form 8-K (File No.
001-34045) as filed with the Commission on May 13, 2008
|
|||
|
21.1
|
Subsidiaries
of the registrant
|
|
Incorporated
by reference to Exhibit 21.1 to Colfax Corporation’s Form 10-K (File No.
001-34045) as filed with the Commission on February 25,
2010
|
||
|
23.1
|
Consent
of Ernst & Young LLP, Independent Registered Public Accounting
Firm
|
Filed
herewith
|
|||
|
31.1
|
Certification
of Chief Executive Officer Pursuant to Item 601(b)(31) of Regulation S-K,
as adopted pursuant to Section 302 of the Sarbanes-Oxley Act of
2002.
|
|
Filed
herewith
|
||
|
31.2
|
Certification
of Chief Financial Officer Pursuant to Item 601(b)(31) of Regulation S-K,
as adopted pursuant to Section 302 of the Sarbanes-Oxley Act of
2002.
|
|
Filed
herewith
|
||
|
32.1
|
Certification
of Chief Executive Officer, Pursuant to 18 U.S.C. Section 1350, as adopted
pursuant to Section 906 of the Sarbanes-Oxley Act of 2002
|
|
Filed
herewith
|
||
|
32.2
|
Certification
of Chief Financial Officer, Pursuant to 18 U.S.C. Section 1350, as adopted
pursuant to Section 906 of the Sarbanes-Oxley Act of 2002
|
|
Filed
herewith
|
|
*
|
Unless
otherwise noted, all exhibits are incorporated by reference to the
Company’s Registration Statement on Form S-1 (File No.
001-34045).
|
|
**
|
Indicates
management contract or compensatory plan, contract or
arrangement.
|
90
COLFAX
CORPORATION AND SUBSIDIARIES
SCHEDULE
II—VALUATION AND QUALIFYING ACCOUNTS
(Dollars
in thousands)
|
Balance at
Beginning of
Period
|
Charged to
Cost and
Expenses (a)
|
Charged to
Other Accounts
|
Write-offs,
Write-downs
& Deductions
|
Foreign
Currency
Translation
|
Balance at
End of Period
|
|||||||||||||||||||
|
Year
Ended December 31, 2009
|
||||||||||||||||||||||||
|
Allowance
for doubtful accounts
|
$ | 2,486 | 405 | - | (178 | ) | 124 | $ | 2,837 | |||||||||||||||
|
Allowance
for excess, slow-moving and obsolete inventory
|
$ | 6,923 | 1,368 | - | (413 | ) | 147 | $ | 8,025 | |||||||||||||||
|
Valuation
allowance for deferred tax assets (as restated)
|
$ | 45,206 | (82 | ) | - | - | (71 | ) | $ | 45,053 | ||||||||||||||
|
Year
Ended December 31, 2008
|
||||||||||||||||||||||||
|
Allowance
for doubtful accounts
|
$ | 1,812 | 828 | - | (33 | ) | (121 | ) | $ | 2,486 | ||||||||||||||
|
Allowance
for excess, slow-moving and obsolete inventory
|
$ | 7,589 | (334 | ) | - | (74 | ) | (258 | ) | $ | 6,923 | |||||||||||||
|
Valuation
allowance for deferred tax assets (as restated)
|
$ | 17,776 | 2,999 | 24,431 | (b) | - | - | $ | 45,206 | |||||||||||||||
|
Year
Ended December 31, 2007
|
||||||||||||||||||||||||
|
Allowance
for doubtful accounts
|
$ | 1,650 | 964 | (10 | ) (c) | (909 | ) | 117 | $ | 1,812 | ||||||||||||||
|
Allowance
for excess, slow-moving and obsolete inventory
|
$ | 6,412 | 1,735 | 144 | (c) | (1,309 | ) | 607 | $ | 7,589 | ||||||||||||||
|
Valuation
allowance for deferred tax assets (as restated)
|
$ | 17,884 | (108 | ) | - | - | - | $ | 17,776 | |||||||||||||||
|
(a)
|
Net
of recoveries.
|
|
(b)
|
Amounts
charged to other comprehensive
income.
|
|
(c)
|
Amounts
related to businesses acquired and related
adjustments.
|
91