Attached files
| file | filename |
|---|---|
| EX-21 - EX-21 - BRT Apartments Corp. | a2201396zex-21.htm |
| EX-32.3 - EX-32.3 - BRT Apartments Corp. | a2201396zex-32_3.htm |
| EX-31.3 - EX-31.3 - BRT Apartments Corp. | a2201396zex-31_3.htm |
| EX-10.5 - EX-10.5 - BRT Apartments Corp. | a2201396zex-10_5.htm |
| EX-32.1 - EX-32.1 - BRT Apartments Corp. | a2201396zex-32_1.htm |
| EX-31.1 - EX-31.1 - BRT Apartments Corp. | a2201396zex-31_1.htm |
| EX-23.1 - EX-23.1 - BRT Apartments Corp. | a2201396zex-23_1.htm |
| EX-31.2 - EX-31.2 - BRT Apartments Corp. | a2201396zex-31_2.htm |
| EX-32.2 - EX-32.2 - BRT Apartments Corp. | a2201396zex-32_2.htm |
Use these links to rapidly review the document
TABLE OF CONTENTS
TABLE OF CONTENTS 2
UNITED STATES
SECURITIES AND EXCHANGE COMMISSION
Washington, D.C. 20549
FORM 10-K
| (Mark One) | ||
ý |
ANNUAL REPORT PURSUANT TO SECTION 13 OR 15(d) OF THE SECURITIES EXCHANGE ACT OF 1934 |
|
For the fiscal year ended September 30, 2010 |
||
Or |
||
o |
TRANSITION REPORT PURSUANT TO SECTION 13 OR 15(d) OF THE SECURITIES EXCHANGE ACT OF 1934 |
|
Commission file number 001-07172
BRT REALTY TRUST
(Exact name of registrant as specified in its charter)
| Massachusetts (State or other jurisdiction of incorporation or organization) |
13-2755856 (I.R.S. employer identification no.) |
|
60 Cutter Mill Road, Great Neck, New York (Address of principal executive offices) |
11021 (Zip Code) |
516-466-3100
Registrant's telephone number, including area code
Securities registered pursuant to Section 12(b) of the Act:
| Title of each class | Name of each exchange on which registered | |
|---|---|---|
| Shares of Beneficial Interest, $3.00 Par Value | New York Stock Exchange |
Securities registered pursuant to Section 12(g) of the Act:
NONE
(Title of Class)
Indicate by check mark if the registrant is a well-known seasoned issuer, as defined in Rule 405 of the Securities Act. Yes o No ý
Indicate by check mark if the registrant is not required to file reports pursuant to Section 13 or 15(d) of the Act. Yes o No ý
Indicate by check mark whether the registrant: (1) has filed all reports required to be filed by Section 13 or 15(d) of the Securities Exchange Act of 1934 during the preceding 12 months (or for such shorter period that the registrant was required to file such reports), and (2) has been subject to such filing requirements for the past 90 days. Yes ý No o
Indicate by check mark whether the registrant has submitted electronically and posted on its corporate Web site, if any, every Interactive Data File required to be submitted and posted pursuant to Rule 405 of Regulation S-T (232.405 of this chapter) during the preceding 12 months (or for such shorter period that the registrant was required to submit and post such files). Yes o No o
Indicate by check mark if disclosure of delinquent filers pursuant to Item 405 of Regulation S-K (Section 229.405 of this chapter) is not contained herein, and will not be contained, to the best of registrant's knowledge, in definitive proxy or information statements incorporated by reference in Part III of this Form 10-K or any amendment to this Form 10-K o
Indicate by check mark whether the registrant is a large accelerated filer, an accelerated filer, a non-accelerated filer, or a smaller reporting company. See definitions of "large accelerated filer," "accelerated filer" and "smaller reporting company" in Rule 12b-2 of the Exchange Act. (Check one):
| Large accelerated filer o | Accelerated filer ý | Non-accelerated filer o | Smaller reporting company o |
Indicate by check mark whether registrant is a shell company (as defined in Exchange Act Rule 12b-2). Yes o No ý
The aggregate market value of voting and non-voting common equity held by non-affiliates of the registrant was approximately $56.7 million based on the last sale price of the common equity on March 31, 2010, which is the last business day of the registrant's most recently completed second quarter.
As of December 6, 2010, the registrant had 13,932,799 Shares of Beneficial Interest outstanding, excluding treasury shares.
DOCUMENTS INCORPORATED BY REFERENCE
Portions of the proxy statement for the annual meeting of shareholders of BRT Realty Trust to be filed not later than January 28, 2011 are incorporated by reference into Part III of this Form 10-K.
Form 10-K
i
Forward-Looking Statements
This Annual Report on Form 10-K, together with other statements and information publicly disseminated by us, contains certain forward looking statements within the meaning of Section 27A of the Securities Act of 1933, as amended, and Section 21E of the Securities Exchange Act of 1934, as amended. We intend such forward-looking statements to be covered by the safe harbor provisions for forward-looking statements contained in the Private Securities Litigation Reform Act of 1995 and include this statement for purposes of complying with these safe harbor provisions. Forward-looking statements relate to expectations, beliefs, projections, future plans and strategies, anticipated events or trends concerning matters that are not historical facts. Forward looking statements are generally identifiable by use of words such as "may," "will," "will likely result," "shall," "should," "could," "believe," "expect," "intend," "anticipate," "estimate," "project" or similar expressions or variations thereof.
Forward-looking statements contained in this Annual Report on Form 10-K are based on our beliefs, assumptions and expectations of our future performance taking into account all information currently available to us. These beliefs, assumptions and expectations can change as a result of many possible events or factors, not all of which are known to us or within our control, and which could materially affect actual results, performance or achievements. Factors which may cause actual results to vary from our forward-looking statements include, but are not limited to:
- •
- factors described in this Annual Report on Form 10-K, including those set forth under the captions
"Risk Factors" and "Business";
- •
- defaults by borrowers in paying debt service on outstanding loans;
- •
- limitation of credit by institutional lenders;
- •
- impairment in the value of real estate property we own and real estate property securing our loans;
- •
- availability of mortgage origination opportunities acceptable to us;
- •
- national and local economic and business conditions;
- •
- general and local commercial real estate property conditions;
- •
- changes in Federal government policies;
- •
- changes in Federal, state and local governmental laws and regulations;
- •
- increased competition from entities engaged in mortgage lending;
- •
- changes in interest rates; and
- •
- the availability of and costs associated with sources of liquidity.
We caution you not to place undue reliance on forward-looking statements, which speak only as of the date of this Annual Report on Form 10-K. Except to the extent required by applicable law or regulation, we undertake no obligation to update these forward-looking statements to reflect events or circumstances after the date of the filing of this Annual Report on Form 10-K or to reflect the occurrence of unanticipated events.
ii
General
Our primary business is to originate and hold for investment senior mortgage loans secured by commercial and multi-family real estate property in the United States. The loans we originate generally have relatively high yields and are short term or bridge loans with a duration ranging from six months to one year. We generally lend at a floating rate of interest based on a spread over the prime rate and receive an origination fee for the loans we originate. We conduct our operations to qualify as a real estate investment trust, or REIT, for federal income tax purposes.
From time-to-time we originate junior commercial and multi-family mortgage loans, participate as an equity investor in, and mortgage lender to, joint ventures which acquire income producing real estate property and purchase securities of other REITs.
The unprecedented disruptions in the credit markets and the economic recession have caused significant declines in the value of real estate property assets and loss of liquidity, both long and short term, from the capital markets. As discussed below, these conditions had an adverse effect on our business, requiring us, from the latter part of Fiscal 2008 through a substantial portion of Fiscal 2010, to refocus our business activities from originating loans to servicing our loan portfolio, which included workout activities, pursuing foreclosure actions, acquiring title to real estate properties securing our loans and, subsequent to acquiring title, operating these properties and engaging in activities related to selling these properties. As we have resolved a substantial portion of the problems in our loan portfolio, we began, in the second half of Fiscal 2010, to shift our emphasis back to our primary lending business.
Information regarding our segments is included in Note 13 to our Consolidated Financial Statements and is incorporated herein by this reference.
We were organized as a business trust under the laws of the Commonwealth of Massachusetts in June 1972. Our address is 60 Cutter Mill Road, Suite 303, Great Neck, New York 11021, telephone number 516-466-3100. Our website can be accessed at www.brtrealty.com, where copies of our Annual Reports on Form 10-K, Quarterly Reports on Form 10-Q, Current Reports on 8-K and other filings with the Securities and Exchange Commission ("SEC") can be obtained free of charge. These SEC filings are added to the website as soon as reasonably practicable.
The Effect of the Crisis in the Credit and Real Estate Markets on BRT
The crisis in the credit and real estate markets and the recession have had, from Fiscal 2008 through Fiscal 2010, a material adverse effect on our business, resulting in net losses attributable to common shareholders of $8.0 million, $47.8 million and $260,000 for Fiscal 2010, Fiscal 2009 and Fiscal 2008, respectively. The net losses contributed to the decrease in BRT Realty Trust shareholders' equity from $235.2 million at September 30, 2007 to $124.6 million at September 30, 2010. Specifically, the crisis in the credit and real estate markets and the recession negatively impacted our business in the following ways:
- •
- Loans aggregating $34.6 million, $68.2 million and $84.2 million in principal amount became
non-earning in Fiscal 2010, 2009 and 2008, respectively.
- •
- We recorded provisions for loan losses of $3.2 million, $17.1 million, $15.3 million in Fiscal 2010,
2009 and 2008, respectively.
- •
- We recorded impairment charges of $3.4 million, $31 million and $9.2 million against real estate properties in Fiscal 2010, 2009 and 2008, respectively.
1
- •
- We originated $17.4 million and $12.7 million of loans in Fiscal 2010 and 2009, respectively, as compared to
$66.0 million of loans originated in Fiscal 2008. The foregoing excludes senior purchase money mortgage loans of $17.8 million we originated in Fiscal 2009 to facilitate the sale of real
estate we owned.
- •
- We do not currently have a credit facility. Without a credit facility, the amount of loans that we will be able to
originate will be limited primarily to cash and cash equivalents, proceeds we receive from sales of securities and loan payoffs.
- •
- Real properties acquired by us in foreclosure proceedings had a negative cash flow in Fiscal 2010 and 2009 of
$1.8 million and $3.5 million, respectively.
- •
- We incurred $673,000, $908,000 and $2 million of foreclosure related professional fees in Fiscal 2010, 2009 and
2008, respectively.
- •
- We incurred a tax loss in calendar 2009 of approximately $44.6 million. We expect to report a tax loss for calendar 2010 of approximately $10 million and anticipate that at December 31, 2010, our net operating loss carry-forward will be approximately $72 million. It is highly unlikely that we will pay any dividends until we have offset our future taxable income against our tax loss carry-forward and it may take us several years to use this offset in its entirety.
As used herein, the term "foreclosure proceeding", "foreclosure" and words of similar import refer to and include judicial foreclosure proceedings, deeds-in-lieu of foreclosure, workouts, settlements or other resolutions of non-performing loans.
Our Loan Portfolio
At September 30, 2010, we had twelve senior loans outstanding, secured by properties located in six states, of which 70% were secured by properties located in the New York metropolitan area. Our outstanding loans had an aggregate principal balance as of September 30, 2010 of $57.7 million, before allowance for possible losses of $3.17 million, and an average contractual interest rate of 9.50%. At September 30, 2010, two of our loans, with a principal balance of an aggregate of $5.3 million, or 9% of our outstanding loans, represented senior purchase money mortgage loans provided by us to facilitate the sale of real estate properties acquired in foreclosure proceedings. With respect to the outstanding loans at September 30, 2010, $35.1 million, or 61% of our loan portfolio, was not earning interest. This compares with a loan portfolio, including loans held for sale, at September 30, 2009 of $81.2 million, before allowance for possible losses of $1.6 million, with an average contractual rate of interest of 9.11%. Of the loans outstanding at September 30, 2009, $19.1 million, or 23.5% of our loan portfolio, was not earning interest.
In Fiscal 2010, we originated $17.4 million of new loans and an aggregate of $22.5 million loans were repaid, in whole or in part. Interest on our loans is payable to us monthly. In the first two months of Fiscal 2011, we originated five loans in aggregate principal amount of $24.5 million. Our loans usually require that our borrowers pay to us monthly escrow amounts that are adequate to pay, when due, real estate tax installments on the properties securing our loans. We may also require and hold funds in escrow for the payment of casualty insurance premiums. At September 30, 2010, our three largest loans outstanding of approximately $26.1 million (which is non-performing), $9 million and $8.5 million (which is non-performing), represented approximately 14.0%, 4.9% and 4.6%, respectively, of our total assets. There were no other loans in our portfolio that, at such date, represented more than 2.2% of our total assets.
With respect to certain loans originated by us, the borrower funds an interest reserve out of the loan proceeds, from which all or a portion of the interest payments due to us are made for a specified period of time. We generally lend at a floating rate of interest based on a spread over the prime rate, with a stated minimum interest rate. In Fiscal 2009, we provided senior purchase money mortgages with
2
a fixed rate of interest to purchasers of properties acquired by us in foreclosure proceedings to facilitate the sale of these properties. Additionally, in certain loan work-out situations, we converted existing floating interest rate loans to fixed rate loans to reduce the risk of borrower defaults. As a result, the percentage of our loan portfolio which was at a floating rate of interest at September 30, 2010 was less than our historical percentage. At September 30, 2010, approximately 43% of our outstanding loans had a floating rate of interest and 57%, were fixed rate mortgages.
The following table sets forth information regarding mortgage loans outstanding at September 30, 2010 (including senior purchase money mortgages) before giving effect to deferred fee income:
| (Dollars in thousands) |
NUMBER OF LOANS |
EARNING INTEREST |
NOT EARNING INTEREST |
TOTAL | ALLOWANCE FOR POSSIBLE LOSSES |
REAL ESTATE LOANS NET |
||||||||||||||
|---|---|---|---|---|---|---|---|---|---|---|---|---|---|---|---|---|---|---|---|---|
Portfolio loans |
||||||||||||||||||||
Condominium units—multi-family |
1 | $ | — | $ | 8,488 | $ | 8,488 | $ | — | $ | 8,488 | |||||||||
Vacant loft building with retail |
1 | — | 26,075 | 26,075 | (2,985 | ) | 23,090 | |||||||||||||
Multi-family residential |
6 | 14,097 | 580 | 14,677 | (180 | ) | 14,497 | |||||||||||||
Retail |
2 | 3,166 | — | 3,166 | — | 3,166 | ||||||||||||||
|
10 | 17,263 | 35,143 | 52,406 | (3,165 | ) | 49,241 | |||||||||||||
Purchase money mortgage loans—multi-family |
2 | 5,340 | — | 5,340 | — | 5,340 | ||||||||||||||
Total |
12 | $ | 22,603 | $ | 35,143 | $ | 57,746 | $ | (3,165 | ) | $ | 54,581 | ||||||||
Loan Defaults
At September 30, 2010, three loans, each to a separate borrower, with an aggregate outstanding principal balance of $35.1 million, before allowances for possible losses of $3.2 million, were not earning interest. The following table sets forth information concerning these loans:
(Dollars in thousands) TYPE OF PROPERTY |
LOCATION | PRINCIPAL BALANCE AS OF SEPTEMBER 30, 2010 |
|||||
|---|---|---|---|---|---|---|---|
Vacant loft building with retail |
Manhattan, NY | $ | 26,075 | (1) | |||
Condominium units/multi-family |
Brooklyn, NY | 8,488 | (2) | ||||
Multi-family residential |
Manhattan, NY | 580 | |||||
Total |
$ | 35,143 | |||||
- (1)
- A
judgment of foreclosure has been issued with respect to this property and it is anticipated that the auction of the property will be held in late calendar
2010 or early calendar 2011.
- (2)
- The borrower filed for protection under Chapter XI of the Federal Bankruptcy Code and has filed a plan of reorganization that we are contesting. We are also seeking to enforce judgments against the individual guarantors of this loan.
In the event of a default by a borrower on a loan, we will, in substantially all cases, foreclose on the loan or other collateral held by us and may seek to protect our investment through negotiations with the borrower or other interested parties. Once a loan becomes non-performing, we generally do not receive interest payments on our loan, thereby reducing our revenues and net income (and taxable income). Foreclosure proceedings in certain jurisdictions can take considerable time, and may extend for as long as two years. In addition, if a borrower files for protection under the United States bankruptcy laws during the foreclosure process, the delays may be longer. In a foreclosure proceeding,
3
we will typically seek to have a receiver appointed by the court or an independent third party property manager appointed with the borrower's consent in order to preserve the property's income stream and provide for the maintenance of the property. From time-to-time, we make cash advances to the borrower, a court appointed receiver or an independent third-party manager for emergency repair items and for real estate taxes. At the conclusion of the foreclosure or negotiated workout process, the rents collected by the receiver or the third party manager, as the case may be, less costs and expenses of operating the property and the receiver's or manager's fees are remitted to us.
Our Real Estate Assets
At September 30, 2010, we owned real estate properties having a book value of $55.8 million. These properties include assemblage sites and additional properties located in downtown Newark, NJ (vacant land, vacant buildings, retail, office and parking). The Newark, NJ properties, owned by a consolidated joint venture, had a total book value of $41.9 million at September 30, 2010, representing 75% of our real estate assets and 22% of our total assets. None of our other real estate assets accounted for more than 10% of our total assets at September 30, 2010. See "—Newark Joint Venture."
In Fiscal 2010, we sold five properties with an aggregate book value of $13.8 million for net sales proceeds of $15.7 million.
With respect to properties we acquire in foreclosure proceedings, we supervise local property managers, and our staff supervises, or is directly responsible for, repairs and improvements at such properties and completing any construction projects unfinished by borrowers. In Fiscal 2010, we expended $4.1 million for improvements and development work at properties acquired in foreclosure proceedings.
With respect to unsold individual residential condominium units we acquire in foreclosure proceedings, we examine the local real estate market to determine the advisability of selling and/or leasing vacant units. These activities include retaining sales and leasing agents, preparing advertising materials, negotiating brokerage agreements, supervising activities of brokers selected by us, and seeking mortgage financing opportunities for potential purchasers.
Generally, our policy is to sell properties we acquire in foreclosure proceedings after completing necessary repairs and maintenance and engaging in leasing activities, if required. We may retain a property if we determine that holding it will result in a substantial increase in its market value. We may provide senior purchase money mortgage loans at competitive fixed interest rates, if necessary, in order to consummate a sale which we deem to be beneficial to us. In Fiscal 2010, we did not provide any senior purchase money mortgage financing and in Fiscal 2009 we provided $17.8 million of such financing.
At September 30, 2010, less than 1% of our total assets, or an aggregate of approximately $775,000, were represented by interests in unconsolidated joint ventures that collectively own two properties. None of the real estate properties acquired by us in foreclosure proceedings are owned by these joint ventures. During Fiscal 2009, we sold our joint venture interest in four joint ventures, each of which owned one real estate property located in Connecticut, to our joint venture partner for a total consideration of $1.35 million, resulting in a gain to us of $271,000.
Newark Joint Venture
Background
Two of our wholly-owned subsidiaries are members of a joint venture (which we refer to as the Newark Joint Venture) with two members that are not affiliated with us. The Newark Joint Venture
4
owns assemblage sites and additional properties located in downtown Newark, NJ. The assemblage sites are surrounded by a variety of governmental, educational, cultural and entertainment institutions and facilities. In close proximity to both assemblage sites is Rutgers University, the New Jersey Institute of Technology, University of Medicine and Dentistry of New Jersey, Essex County College, Seton Hall Law School, the New Jersey Performing Arts Center, the Prudential Arena (home of the National Hockey League New Jersey Devils and temporary home of the National Basketball Association New Jersey Nets), the Essex County Court Complex, Newark's City Hall and a Federal Courthouse. Both assemblage sites are within walking distance of Newark Penn Station, which provides access to Amtrak and New Jersey Transit trains and are accessible to local bus routes. The assemblage sites are served by various highways, including the Garden State Parkway, Interstate-95, Interstate-78 and Interstate-280.
The Newark Joint Venture intends to redevelop all or a portion of the sites, particularly the assemblage sites, with personnel hired by the Newark Joint Venture or with development partners or sell some of its sites to developers or end users. The financial condition and the results of operations of the Newark Joint Venture are consolidated with our financial statements. Accordingly, the assets of the Newark Joint Venture are included in our real estate properties, and our $27 million loan to the Newark Joint Venture (which is secured by substantially all of the real estate assets of the Newark Joint Venture), is eliminated in consolidation and is not included in our outstanding loans. The properties owned by the Newark Joint Venture have adequate insurance coverage for their current use.
Immediately prior to the formation of the Newark Joint Venture, we held loans aggregating approximately $38 million, secured by substantially all of the properties conveyed to the Newark Joint Venture by our borrowers. We entered into loan work-out negotiations with our borrowers and, as a result of such negotiations, entered into the Newark Joint Venture. In connection with the work-out of our loans and the formation of the Newark Joint Venture, our loans were refinanced with a mortgage loan of $27 million (which we currently, as described below, hold as two separate mortgage loans), with the balance of our loans converted into a $6.9 million preferred capital account interest and a 50.1% membership interest in the Newark Joint Venture, providing us with a separate capital account of $3.9 million. The other members caused all the properties secured by our loans, and additional properties (unencumbered by our loans) and contract rights to acquire additional properties, all located in downtown Newark, NJ, to be contributed to the Newark Joint Venture for which the other members received a 49.9% membership interest in the Newark Joint Venture (with a separate capital account of $3.9 million). Our loans are the senior mortgage loans with respect to substantially all of the properties owned by the Newark Joint Venture.
In connection with an $8.6 million financing provided by an institutional lender with respect to the Teachers Village project (described under "—Information and Activities Related to Assemblage Sites"), our $27 million mortgage loan was bi-furcated into a $7.5 million loan secured by the Teachers Village properties and a $19.5 million loan secured by substantially all of the other properties owned by the Newark Joint Venture. The $7.5 million loan matures September 14, 2011 with the option to extend until March 14, 2012. Further, if the $8.6 million loan is extended, refinanced or satisfied, there is an additional option to extend the $7.5 million loan until the earlier of (i) the maturity date of such lender's loan as so extended or the replacement of such lender's loan or (ii) June 3, 2016. The $19.5 million loan matures on June 3, 2014, with a two-year extension option. These loans provide for an interest rate of 11% per annum, of which 6% is paid currently and 5% accrues and is paid at maturity. The extension option cannot be exercised unless specified conditions are met. See "—Information and Activities Relating to Assemblage Sites" for material terms of the financing provided by an institutional lender.
5
Current Property Information
The following table sets forth, as of September 30, 2010, information regarding the properties owned in fee by the Newark Joint Venture:
ASSEMBLAGE OR PROPERTY |
NUMBER OF PROPERTIES |
TYPE OF PROPERTY |
RENTABLE SQUARE FEET(1) |
ANNUAL REAL ESTATE TAXES |
NUMBER OF TENANTS |
PERCENT LEASED |
PRINCIPAL TENANTS |
||||||||||||
|---|---|---|---|---|---|---|---|---|---|---|---|---|---|---|---|---|---|---|---|
Assemblage #1 |
13 | (2) | Office and retail | 303,406 | (2) | $ | 362,000 | 17 | (3) | 54 | % | None | |||||||
Assemblage #2 |
9 |
(4) |
Retail, office and parking(5) |
185,049 |
401,000 |
7 |
61 |
% |
(6) |
||||||||||
Beaver Street Property |
1 |
Retail |
8,160 |
10,000 |
1 |
25 |
% |
None |
|||||||||||
Lincoln Park Property |
2 |
Retail, office and parking |
97,493 |
95,000 |
3 |
83 |
% |
LA Parking Corp.(7) |
|||||||||||
- (1)
- Rentable
square feet includes 421,363 square feet of retail and office space and 172,745 square feet of land used for parking.
- (2)
- Two
of the Assemblage #1 properties are subject to third party mortgages. One mortgage, which is secured by a property which contains approximately 11% of
the rentable square feet of the Assemblage, has an outstanding principal balance of approximately $900,000, provides for interest only payments of 7% per annum and matures in January 2015. The other
mortgage is secured by a property which contains approximately 3% of the rentable square feet of the Assemblage, has an outstanding principal balance of approximately $1.2 million, provides for
interest only payments of 7% per annum and matures in September 2011.
- (3)
- Leases
representing 90% of the leased space of Assemblage #1 are month-to-month or have cancellation, relocation or demolition
provisions. Many of these leases are at below market rentals.
- (4)
- One
of the properties at Assemblage #2 is subject to three third party mortgages. Two of these mortgages are secured by a property which contains 53,781
square feet of rentable space (including 6,217 square feet of basement space) and is leased to a charter school and two retail tenants, have an outstanding principal balance aggregating approximately
$6.49 million, provide for an interest rate of 6% per annum rate, are being amortized over the term of the mortgages and mature in 2030. The third mortgage is secured by properties that are
currently under development and has an outstanding principal balance of $1.8 million (which may increase up to $8.6 million), provides for an interest rate of 17% per annum and matures
in September 2011 with an option to extend until March 2012 subject to compliance with specified conditions.
- (5)
- The
Newark Joint Venture's current intention is to redevelop Assemblage #2, either by itself or with a development partner, with charter schools and
residences for teachers, and the ground floor for retail space. As part of its redevelopment plan, the Newark Joint Venture leased 35,848 rentable square feet of space at this Assemblage site to a
charter school pursuant to a 20 year lease. The lease commenced on October 1, 2009. The charter school is currently in operation. See "—Information and Activities Relating to
Assemblage Sites."
- (6)
- Friends
of Team Academy Charter School.
- (7)
- The manager of an approximately 38,000 square foot parking lot.
6
The following table sets forth as of September 30, 2010, summary schedule of the annual lease expirations of the Newark Joint Venture's real estate assets, assuming that none of the tenants exercise renewal or cancellation options, if any, at or prior to the scheduled expirations:
LEASE EXPIRATION |
NUMBER OF LEASES EXPIRING(1) |
SQUARE FOOTAGE OF LEASES EXPIRING |
PERCENTAGE OF TOTAL LEASED SQUARE FEET |
PROJECTED 2011 RENTAL INCOME(2) |
PROJECTED % OF 2011 RENTAL INCOME(2) |
|||||||||||
|---|---|---|---|---|---|---|---|---|---|---|---|---|---|---|---|---|
Month-to-month |
11 | 168,113 | 48 | % | $ | 258,339 | 14 | % | ||||||||
2011 |
3 | 44,892 | 12 | 88,757 | 5 | |||||||||||
2012 |
7 | 57,227 | 16 | 554,012 | 30 | |||||||||||
2013 |
2 | 16,175 | 4 | 89,592 | 5 | |||||||||||
2014 |
— | — | — | — | — | |||||||||||
2015 |
1 | 5,260 | 1 | 69,700 | 4 | |||||||||||
2016 |
— | — | — | — | — | |||||||||||
2017 |
2 | 31,527 | 9 | 77,625 | 4 | |||||||||||
2018 |
— | — | — | — | — | |||||||||||
2019 |
1 | 1,460 | — | 29,400 | 2 | |||||||||||
2020 and thereafter |
1 | 35,848 | 10 | 666,928 | 36 | |||||||||||
TOTAL |
28 | 360,502 | 100 | $ | 1,834,353 | 100 | ||||||||||
- (1)
- With
respect to the Assemblage sites, there are eleven leases which are month-to-month and nine leases which contain cancellation,
relocation or demolition provisions.
- (2)
- Assumes all month-to-month tenants remain in occupancy for the entire 2011 calendar year.
Information and Activities Relating to Assemblage Sites
Assemblage #1 is an approximately 98,000 square foot site, representing approximately 303,406 rentable square feet. The site is bounded by Market Street, Campbell Street, Washington Street and University Avenue in downtown Newark, New Jersey. Potential redevelopment opportunities with respect to this site include an office complex with a retail component, a medical office complex containing offices, research laboratories and other medical related services, a retail center, corporate headquarters, university offices, classrooms and/or dormitories, or a combination of one or more of these uses. The Newark Joint Venture may redevelop this site for its own account, but will only do so if it has entered into long-term lease transactions with credit worthy lessees and has obtained satisfactory assurances that it will obtain necessary construction financing. Alternatively, the Newark Joint Venture may enter into a joint venture with a development partner or sell all or portions of the site. Although the Newark Joint Venture has conducted discussions and responded to requests for bid proposals with various parties concerning the development of portions of the site, which have included build to suit construction for potential users on a sale/leaseback or long-term lease basis and the sale of portions of the property to end users and/or developers, the Newark Joint Venture has not entered into any understandings or agreements concerning the redevelopment of all or any portion of the site and there is no assurance that it will be able to conclude any such arrangement or obtain the financing necessary to proceed with any arrangement which it may conclude.
Assemblage #2, referred to herein as "Teachers Village", encompasses an area bounded by Branford Street to the north, Treat Place to the east, Hill Street to the south and Washington Street to the west, and is adjacent to Halsey Street. The Teachers Village site aggregates approximately 185,000 square feet, of which approximately 137,000 square feet is comprised of existing parking lots and vacant buildings to be demolished or rehabilitated and the balance is comprised of existing structures under lease. The project contemplates a mix of residential, educational and retail facilitates and will include both the renovation of an existing nine story structure and the construction of approximately six
7
additional buildings. Two of the buildings are being designed for occupancy by three charter schools and the remaining buildings are being designed to provide approximately 200 residential rental units. It is contemplated that the ground floor level of the charter school buildings and the residential buildings will provide for approximately 65,000 square feet of retail space. The project can be constructed and financed in stages.
The cost of the entire Teachers Village project was, in September 2010, projected by the Newark Joint Venture to be approximately $125 million. The Newark Joint Venture is proceeding with the project on the assumption that it will develop the site for its account, although it may in the future elect to partner with a developer or developers for all or a portion of the project. If it proceeds with the development on its own, the Newark Joint Venture contemplates that the project will be financed by a combination of public (federal, state and local) and private sources. Potential public financing sources include, without limitation, New Market Tax Credits, Urban Transit Hub Tax Credits and Economic Recovery Growth Grants. Private financing would be provided by conventional construction financing, if available. An institutional lender has agreed to provide the Newark Joint Venture with up to $8.6 million in financing secured by a pledge of 100% of the equity interests of the borrowing entity and a subordinate mortgage encumbering the Teachers Village properties. The loan bears interest at the rate of 17% per annum and matures in September 2011, subject to the right to extend to March 2012 upon satisfaction of specified conditions. The loan proceeds can only be used for the project's "soft costs" (including, without limitation, the cost of architects, engineers, specified consultants, permits and legal and accounting fees). Through September 30, 2010, the Newark Joint Venture has drawn down $1.83 million of the committed amount. The balance of the funds may be drawn in two tranches upon satisfaction of specified conditions applicable to the particular tranche, including without limitation, conditions relating to the Newark Joint Venture having obtained governmental approvals with respect to specified financing and grant arrangements, guaranties as to rental payments from tenants or prospective tenants (or their affiliates) of the contemplated structures and the receipt of term sheets and/or commitments with respect to construction financing for the project. The Trust and its joint venture partners each have severally guaranteed up to 25% of any amount drawn down under this facility and the amount drawn down under this facility is subordinate to the Trust's mortgage of $7,500,000 applicable to the Teachers Village properties.
No assurance can be given that sufficient financing will be obtained to complete the Teachers Village project or any portion thereof, that our $7.5 million loan with respect to the Teachers Village project will be repaid or that the Teachers Village will be profitable for us. In addition, since it is contemplated that a substantial portion of the financing required for the project will be debt financing, the profit which the joint venture partners receives, if any, will only be received after completion of the construction and repayment of all the debt, which will be a significant period of time from the present.
Terms of the Newark Joint Venture Operating Agreement
The following is a summary of the material provisions of the amended and restated limited liability company operating agreement of the Newark Joint Venture, which is qualified in its entirety by reference to the agreement, a copy of which was filed with the Securities and Exchange Commission on June 9, 2009 as an exhibit to our Current Report on Form 8-K.
Membership Interests. We own 50.1% of the membership interests in the Newark Joint Venture, and the other members (collectively, the "Other Member") own 49.9% of the membership interests in the Newark Joint Venture.
Manager. An affiliate of the other members is the manager of the Newark Joint Venture and is responsible for the day to day management activities of the Newark Joint Venture, but our consent is required for all major decisions affecting the Newark Joint Venture and its properties. We may remove
8
the manager upon six months advance written notice or immediately upon the occurrence of certain significant events.
Fees to the Manager. Until such time as the current manager is no longer the manager of the Newark Joint Venture, the Newark Joint Venture shall pay to the current manager an asset management fee and a property management fee aggregating $890,000 per annum, payable monthly in advance.
Mandatory Capital Calls. Members are required to make pro rata capital contributions to the Newark Joint Venture for any projected budget shortfalls.
Buy-Sell. Commencing on December 3, 2013 or, under specified circumstances, December 3, 2015, either member group may provide the other member group with written notice setting forth the amount they will pay to purchase all of the assets of the Newark Joint Venture. The member group which receives such notice has the option to (i) sell their membership interests in the Newark Joint Venture to the other members for their pro rata portion of the asset purchase price set forth in the written notice, or (ii) purchase the other members' membership interests in the Newark Joint Venture for their pro rata portion of the asset purchase price set forth in the written notice. If the acquirer is the Other Member, then the Other Member is required to, among other things, pay in full our mortgage and our preferred equity interest at closing.
Right of First Refusal and Tag-along Rights. At any time, either member group may provide the other member group with written notice setting forth the sale price at which it desires to sell all or a portion of its membership interests. The member group which received such notice may purchase the offered membership interests at the price set forth in the notice. If they do not elect to purchase the membership interest in accordance with the terms of the notice, the offering members may secure another person to purchase its offered membership interests within 180 days. The group of members which received the sale notice may tag-along in a sale to such other person and sell their pro rata portion of the membership interests.
Distributions. The Newark Joint Venture may not distribute any cash flow to its members until our $27 million loan has been fully repaid, including accrued interest. Once it has been fully repaid, the cash flow of the Newark Joint Venture will generally be distributed as follows: (i) first, to each member pro rata in an amount equal to their unreturned additional capital contributions, (ii) second, to our members until we receive a 10% return on our preferred capital contributions, (iii) third, to our members until we receive an amount equal to our preferred capital contributions, and (iv) fourth, to each member pro rata until such members receive a 10% return on their additional capital contributions, (v) fifth, to the members pro rata an amount equal to their common capital contributions, and (vi) the remainder shall be distributed as follows: (a) 10% to the managing member, and (b) 90% pro rata to the other members pro rata.
Manager of the Newark Joint Venture
The manager of the Newark Joint Venture is RBH Group LLC; its managing member and President is Ron Beit-Halachmy. Mr. Beit-Halachmy, 38 years of age, has over 16 years of experience in the real estate industry and has been involved for more than nine years in acquiring sites in Newark, New Jersey. He was the managing member of the entities which acquired all of the real property currently owned by the Newark Joint Venture. Mr. Beit-Halachmy earned a BA in Economics from the University of Wisconsin and a law degree from New York Law School.
Our Investment Strategy
Our long-term objective is to provide our shareholders with returns over time, including capital appreciation and cash distributions, by originating loans secured by a diversified portfolio of
9
commercial and multi-family real property. Due to the crisis in the credit and commercial real estate markets, our business focus had shifted from originating loans to servicing our loan portfolio, including workout activities, pursuing foreclosure actions, acquiring the underlying real estate properties in foreclosure proceedings and supervising real estate assets and real estate asset dispositions.
Our loan originations in Fiscal 2010, 2009 and 2008 were $17.4 million, $12.7 million and $66 million, respectively. Our originations in Fiscal 2010 and 2009 were significantly less than in Fiscal 2008 due to a limited demand for our short term bridge loans and our concerns about the ability of potential borrowers, in the recessionary environment, to refinance and repay a loan we originate or to be able to sell the underlying real estate collateral or otherwise raise funds in order to repay the loan. Although we have originated five mortgage loans in aggregate amount of $24.5 million in the first two months of Fiscal 2011, there can be no assurance that such increased demand for our short-term bridge lending will continue.
We pursue lending opportunities with purchasers and prospective purchasers of commercial and multi-family real estate properties and property owners who require short-term financing for renovation or repositioning of a real estate asset. We have also recently begun originating loans to persons purchasing their own mortgage debt or purchasing third party mortgage debt, in each case at a discount to the principal amount thereof. The purchase of third party mortgage debt is generally structured as a repurchase agreement pursuant to which we purchase the mortgage and our counterparty is obligated to repurchase such mortgage within a specified period.
Our investment policy emphasizes the origination of short-term real estate loans secured by senior liens on real property. As of September 30, 2010, our loan portfolio only consisted of first mortgage loans or pari passu participations in first mortgage loans. Our lending activities focus on operating properties such as multi-family residential properties, residential properties being converted to condominium ownership, office buildings, retail, shopping centers, mixed use buildings, hotels/motels, and industrial buildings.
We also will, on a limited basis, provide senior loans secured by unimproved land, but generally require that the unimproved land collateralizing our loan has proper entitlements and that zoning is in place for the intended purpose. We also originate and hold for investment loans secured by improved commercial or multi-family residential property which is vacant, pending renovation or repositioning and sale or leasing of the property. From time to time, we may sell a senior, junior or pari passu participation in a loan we originate. We may also acquire senior, junior or pari passu participations in loans originated by others, and we invest in the securities of other REITs.
From time-to-time we will originate junior commercial loans, invest in loans as a junior participant or sell senior participations in loans we originate. When we invest in junior loans or hold junior participations, the collateral securing our loan is subordinate to the liens of senior loans or senior participations. It is possible that the amount which may be recovered by us in cases in which we hold a junior position may be less, or significantly less, than our total investment. At September 30, 2010, none of our loans was represented by a junior loan or a junior participation.
We have historically solicited loans secured by real estate property located within the continental United States. We may expand our lending activities to include loans secured by properties located in Canada and Puerto Rico.
Our Origination Process and Underwriting Criteria
We originate loans in a number of ways. We primarily rely on relationships developed by our officers and loan originators with real estate investors, commercial real estate brokers, mortgage brokers and bankers. We also advertise, use the internet and attend trade shows in order to develop relationships with potential borrowers and real estate brokers, mortgage brokers and bankers.
10
When underwriting a loan, the primary focus of our analysis is the value of a property, which we evaluate by considering a number of factors, including location, current use and potential for alternative use, current and potential net operating income, if any, the local market for condominium conversion, if conversion to condominium ownership is contemplated, comparable sales prices, existing zoning regulations and intended use, if the loan is to be secured by undeveloped land, and local demographics. We also examine the experience of our potential borrower's principals in real estate ownership and management and, if applicable, real estate development.
Loan approvals are based on a review of property information as well as other due diligence activities undertaken by us. Those activities may include a site visit to the property, an in-house property valuation, a review of the results of operations of the property (historical and projected, if any) or, in the case of an acquisition of the property by our prospective borrower, a review of projected results of operations for the property, and a review of the financial condition and a credit report and background check of the principals of the prospective borrower. We do not obtain independent property appraisals, but instead rely on our in-house activities described above. If management determines that an environmental assessment of the underlying property is necessary, then such an assessment is conducted by an experienced third-party service provider. Before a loan commitment is issued, the loan must be reviewed and approved by our loan committee. Loan approval occurs after the assent of not less than four of the seven members of our loan committee, all of whom are executive officers of ours. We generally obtain a non-refundable cash deposit for legal, travel, and other expenses from a prospective borrower prior to or at the time of issuing a loan commitment, and our loan commitments are generally issued subject to receipt by us of title documentation and title insurance, in a form satisfactory to us, for the underlying property. The approval of our board of trustees is required for each loan which exceeds $20,000,000 in principal amount, and the approval of our board of trustees is also required where loans by us to one borrower exceed $50,000,000, in the aggregate.
We usually require either a personal guarantee or a "walk-away guarantee" from the principal or principals of the borrower, in substantially all of the loans originated by us. A "walk-away guarantee" generally provides that the full guarantee of the principal or principals of the borrower terminates if the borrower conveys title to the property to us within a negotiated period of time after a loan default if the payment of mortgage interest to us, real estate taxes and other operating expenses are current. The "walk-away guarantee" is intended to provide an incentive to the principals of a borrower, in a situation where our borrower has defaulted, to have the collateral deeded to us in lieu of foreclosure, thereby reducing the cost of foreclosure proceedings. By complying with the terms of the "walk-away guarantee," the principals of the borrower can avoid the risk of being personally responsible for any difference between the amount owed to us and the amount we recover in a foreclosure proceeding. If we make more than one loan to a borrower, we may require that all or some of the outstanding loans to that borrower be cross-collateralized. In our judgment, the "walk-away guarantees" we have secured upon the origination of certain loans have provided us with leverage in negotiating loan paydowns from "walk away guarantors" and assisted in expediting the foreclosure process.
Junior Subordinated Notes
On May 26, 2009, we entered into an exchange agreement pursuant to which an aggregate of $55 million of our outstanding trust preferred securities were exchanged for an aggregate of $58.3 million of newly issued junior subordinated notes. From May 1, 2009 through July 31, 2012, the outstanding notes bear interest at the rate of 3.5% per annum, to be paid annually in advance. From August 1, 2012 through April 28, 2016, the interest rate will be 8.37% per annum, and commencing April 29, 2016, the annual interest rate will equal LIBOR plus 2.95%. On September 29, 2009, we retired $15.9 million of our junior subordinated notes in exchange for aggregate consideration of $7.95 million, consisting of replacement securities we acquired in the open market during September 2009 and cash, which resulted in an accounting gain to us of $6.44 million. As of September 30, 2010,
11
$42.4 million notional value of our junior subordinated notes was outstanding. These securities, which have an outstanding book balance of $40.8 million, mature on April 30, 2036 and are redeemable at our option at any time.
Pursuant to the governing agreements, at all times prior to August 1, 2012, as long as we remain a REIT, we will be permitted to make distributions to our shareholders provided that (i) for tax years 2008 and 2009, such distributions are paid in the form of common shares to the maximum extent permissible under existing Internal Revenue Service regulations, with the balance payable in cash and (ii) thereafter, to satisfy REIT requirements or pay capital gains, if any, provided such distributions are paid in the form of common shares to the maximum extent permissible under the IRS regulations in effect at the time of such distributions, with the balance payable in cash.
Competition
With respect to our real estate lending activities, we compete, in the current economic environment, for first mortgage loans with other entities, including other mortgage REITs, specialty finance companies, public and private lending companies, investment funds and others. Many of our competitors possess greater financial and other resources than we possess. Mortgage lending has been historically competitive, but in the current economic environment it is difficult to determine our direct and indirect competitors or the extent of the competition.
Competitive variables in our lending activities include market visibility, size of loans offered, rate, fees, term and underwriting standards. To the extent a competitor offers a lower rate, is willing to risk more capital in a particular transaction, and/or employs more liberal underwriting standards, our origination volume and profit margins would be adversely impacted. We compete by offering rapid response time in terms of approval and closing and by offering "no prepayment penalty" loans. In order to supplement our marketing activities, we engage in a national advertising program.
With respect to the sale by us of real estate assets, we compete with any entity seeking to dispose of similar properties, including other REITs, banks, pension funds, hedge funds, real estate developers and private real estate investors. Competition is primarily dependent on price and the ability to secure financing. Other competitive factors which a potential buyer may take into account are location and physical condition of the property.
Our Structure
We share facilities, personnel and other resources with several affiliated entities including, among others, Gould Investors L.P., a master limited partnership involved in the ownership and operation of a diversified portfolio of real estate, and One Liberty Properties, Inc., a publicly-traded equity REIT. Jeffrey A. Gould, our President and Chief Executive Officer, George Zweier, our Vice President and Chief Financial Officer, two other officers engaged in loan origination, underwriting and servicing activities, and four others engaged in underwriting and servicing activities devote substantially all of their business time to us, while our other personnel (including several officers) share their services on a part-time basis with us and other affiliated entities that share our executive offices. The allocation of expenses for the shared facilities, personnel and other resources is computed in accordance with a shared services agreement by and among us and the affiliated entities. The allocation is based on the estimated time devoted by executive, administrative and clerical personnel to the affairs of each entity that is a party to the Shared Services Agreement. A copy of the Shared Services Agreement was filed on December 11, 2008 with the Securities and Exchange Commission as Exhibit 10.2 to our Annual Report on Form 10-K for the year ended September 30, 2008.
In addition, we are party to an Amended and Restated Advisory Agreement, between us and REIT Management Corp., our advisor. Pursuant to the Amended and Restated Advisory Agreement, REIT Management Corp. furnishes advisory and administrative services with respect to our business,
12
including, without limitation, arranging and negotiating credit facilities, participating in our loan analysis and approvals, providing investment advice, providing assistance with building inspections and litigation strategy and support. In addition, in connection with non-performing loans, REIT Management Corp., among other activities, engages in negotiations with borrowers, guarantors, and their advisors related to workouts, participates in strategic decisions relating to workouts and foreclosures and may interface with receivers, managing agents and court appointed trustees with respect to specific collateral securing our loans. The termination date of this agreement was recently extended from December 31, 2010 to April 30, 2011.
For services performed by REIT Management Corp. under the Amended and Restated Advisory Agreement, REIT Management Corp. receives an asset management fee equal to 0.6% of our invested assets and an incentive fee from borrowers of 0.5% of the total commitment amount, payable upon funding a loan commitment, provided that we have received at least a loan commitment fee of 1% from the borrower in any such transaction and any loan commitment fee in excess of 1.5% of the total commitment amount is retained by us. REIT Management Corp. is wholly owned by the chairman of our Board of Trustees and he and certain of our executive officers, including our President and Chief Executive Officer, receive compensation from REIT Management Corp. We discuss compensation paid by REIT Management Corp. to our Chairman and President and Chief Executive Officer and to certain of our executive officers in our proxy statement for our Annual Meeting of Shareholders.
We believe that the Shared Services Agreement and the Amended and Restated Advisory Agreement allow us to benefit from access to, and from the services of, a group of senior executives with significant real estate knowledge and experience.
We also engage affiliated entities in management activities with respect to some of the properties acquired by us in foreclosure proceedings and some of the properties owned by joint ventures in which we are an equity participant. These management activities include, among other things, rent billing and collection, property repair, maintenance and improvement, contractor negotiation, construction management and sales and leasing activities. In management's judgment, the fees paid by us to these affiliated entities are competitive with fees that would be charged for comparable services by unrelated entities.
13
In addition to the other information contained or incorporated by reference in this Form 10-K, you should carefully consider the following risk factors. Any of these risks or the occurrence of any one or more uncertainties described below could have a material adverse effect on our business, financial condition, results of operations and the price of our common shares.
Risks Related to our Business
The disruptions in the credit and real estate markets may continue to adversely affect our business.
Since mid-2007, the credit markets and the markets for real estate assets have been subject to unprecedented disruptions, which has had a material adverse effect on us. These disruptions have resulted in severe limitations on the availability of credit and a deterioration in the value of real estate assets causing a significant increase in defaults by our borrowers in their monetary obligations to us, declining revenues and increased expenses, including significant increases in provisions for loan losses and impairment charges, losses sustained in the operation of real estate properties acquired in foreclosure proceedings and foreclosure related professional fees. Although there has been some improvement in access to credit and real estate values appear to be stabilizing in different parts of the United States, the continuing limitation of credit and the uncertain economic environment may adversely impact our results of operations in the future.
If defaults on our loans continue, it will result in continuing declines in revenues and net income.
Loan defaults result in a decrease in interest income and may require the establishment of, or an increase in, loan loss reserves. The decrease in interest income resulting from loan defaults may be for a prolonged period of time as we seek to recover, primarily through legal proceedings, the outstanding principal balance and accrued interest due on a defaulted loan, plus the legal costs incurred in pursuing our legal remedies. Legal proceedings, which may include foreclosure actions and bankruptcy proceedings, are expensive and time consuming. The decrease in interest income, and the costs involved in pursuing our legal remedies will reduce the amount of cash available to meet our expenses. In addition, the decrease in interest income, the costs incurred by us in a defaulted loan situation and increases in loan loss reserves will have an adverse impact on our net income, taxable income, and shareholders' equity.
During Fiscal 2010, loans aggregating $34.6 million, before loan loss allowances, became non-earning. Non-earning loans represented 61% of the principal balance of our outstanding loans and 19% of our total assets at September 30, 2010. The non-payment of interest income on non-earning loans had the effect of reducing our revenues by $2.9 million in Fiscal 2010. Continuing uncertainty in the credit markets and the uncertain economic environment may result in defaults by our borrowers in the future.
Decrease in our loan originations will negatively affect our results of operations.
In the current economic environment, we are concerned with the ability of potential borrowers to refinance or sell properties in order to repay our loans and therefore we have been conservative in originating loans. As a result, we only originated $17.4 million of loans in Fiscal 2010. Interest and fees earned on our loan portfolio, including purchase money mortgages, but excluding loans held for sale, was $3.9 million, $9.7 million and $18.8 million in Fiscal 2010, 2009 and 2008, respectively. Until there are sustained positive changes in the credit and real estate markets and an increased demand for bridge loans, our loan originations may continue at a reduced level, which negatively affects our revenues, net income, shareholders' equity and may result in our operating at a cash flow deficit in Fiscal 2011.
14
We do not have a credit facility, which will limit our loan origination activity.
At September 30, 2010, we had $58.5 million in cash and cash equivalents and $10.3 million of securities available-for-sale, or a total of $68.8 million available for loan originations and operations. At December 1, 2010, we had approximately $33.5 million in cash and cash equivalents and approximately $10 million of securities available-for-sale, or a total of approximately $43.5 million available for originations and operations. Because we do not have, and may be unable to obtain, a credit facility, we will be limited in the amount of mortgage loans we can originate, which will limit our revenues and operating results. There can be no assurance that we will secure a new credit facility.
We may incur loan loss provisions and impairment charges in Fiscal 2011.
We evaluate on a quarterly basis our loan and real estate portfolios for indicators of impairment. Our loan loss provisions and impairment charges reflect management's judgment of the probability and severity of loan losses and the decline in the value of real estate property assets owned by us and securing our loans. The valuation process, which is inherently difficult, is particularly difficult during a recessionary period in which the availability of credit is limited and commercial real estate transactions have significantly decreased.
Regardless of the loan loss provisions we have taken with respect to our loans or impairment charges we have taken with respect to real estate properties owned, additional provisions and impairments may be required in the future as a result of factors beyond our control, including, among other things, the continuation or downward acceleration of the economic recession and changes in market conditions affecting the value of loan collateral and real property assets. If our loan loss provisions or impairment charges prove inadequate to cover actual losses, we could suffer additional losses.
Due to the credit crisis and the significant decrease in commercial real estate values, we incurred loan loss provisions of $3.2 million and impairment charges of $3.4 million in Fiscal 2010, loan loss provisions of $17.1 million and impairment charges of $31 million in Fiscal 2009 and loan loss provisions of $15.3 million and $9.2 million of impairment charges in Fiscal 2008. These loan loss provisions and impairment charges contributed significantly to the losses we sustained in the past three fiscal years and in particular in Fiscal 2009. Loan loss provisions and impairment charges have adversely impacted our results of operations and may continue to do so. Our loans and real estate properties may suffer additional loan loss provisions and impairments in the future causing us to recognize additional losses.
It is highly unlikely that we will declare any dividends in the next few years.
In December 2008, our board of trustees suspended the payment of regular quarterly dividends. Except for a special capital gain dividend of $1.15 per share paid on October 30, 2009, of which 10% of the total dividend amount was paid in cash and the balance in our common shares, no other dividends were declared or paid in Fiscal 2009 or Fiscal 2010.
In order to qualify as a REIT, we are required to distribute 90% of our taxable income. At December 31, 2009, we had a tax loss carry-forward of $61.4 million and we anticipate a taxable loss of approximately $10 million for calendar 2010. Under current tax laws, we can offset our future taxable income against our tax loss carry-forward for twenty years or until the tax loss carry-forward has been fully used, whichever occurs first. As a result, we do not expect to pay a dividend in calendar 2011 and it is unlikely that we will be required to pay a dividend for many years thereafter in order to maintain our REIT status.
15
Though our board reviews the payment of dividends periodically, there is currently no expectation that a dividend will be paid in the 2011 calendar year and for many years thereafter. The non-payment of dividends may negatively impact the price of our common shares.
Risks of cost overruns and noncompletion of renovation of properties underlying rehabilitation loans or condominium conversions may result in significant losses.
The renovation or refurbishment by a borrower of the property securing our loan involves risks of cost overruns and noncompletion. If such renovation or refurbishment is not completed in a timely manner, or if it costs more than projected, the borrower may experience a prolonged impairment of net operating income and may be unable to make payments on our loan, which could result in reduced income to us. In addition we may be required to complete the renovation or refurbishment if we acquire the property in foreclosure proceedings.
The increased risk of loans secured by unimproved land may harm our results of operations.
From time-to-time, we provide loans that are secured by unimproved land. Land loans are subject to a higher risk of default because such properties are not income producing properties. In addition, the market value of such properties is volatile. Although we only make loans on undeveloped land if entitlements and zoning is in place for the intended use, there is always the risk that entitlements and zoning may be changed or lapse. Consequently, in the event of a default and foreclosure, we may not be able to sell undeveloped land for an amount equal to our investment and we may lose a significant portion of our investment. In the event of our acquisition of undeveloped land in foreclosure proceedings, we may elect to hold the property until the market becomes more favorable. In such case during the holding period, which could be for a number of years, we will not receive any income from this property and we will be required to pay the costs of carrying the property, primarily real estate taxes and insurance, which could adversely affect our net income and shareholders' equity.
Risks Related to the Newark Joint Venture.
The Newark Joint Venture may have an operating loss for the foreseeable future.
Our real estate assets include the properties owned by the Newark Joint Venture, which properties had, at September 30, 2010, an aggregate book value of $41.9 million. At September 30, 2010, the Newark Joint Venture properties represented 75% and 22%, respectively, of our real property assets and total assets. We anticipate that the Newark Joint Venture will operate at a loss in Fiscal 2011 and for several years thereafter. If the Newark Joint Venture operates at a loss, we and our Newark Joint Venture partners will be required to fund the losses by making additional capital contributions, on a pro rata basis. Although it is possible that the need to make additional contributions will be mitigated by the sale of some of the Newark Joint Venture properties or financing secured by the Newark Joint Venture for the operation and/or development of its properties, currently, there is no assurance that we will be able to sell any of such properties on satisfactory terms or that we will obtain the financing (other than the soft-cost financing of up to $8.6 million which is already committed) to fund development and construction activities. The operations of the Newark Joint Venture could have an adverse effect on our results of operations, financial condition and liquidity for several years.
We have limited experience in developing and operating assemblage sites.
The principal assets of our Newark Joint Venture are two assemblage sites and two additional properties located in downtown Newark, NJ. Since we have not previously engaged in the real estate development business, we are subject to risks that differ from those to which we have been subject to
16
historically. Although the principal of the managing member of the Newark Joint Venture (who is formerly the principal of our borrowers) is knowledgeable with respect to the local real estate market and has experience in the development of gut rehabilitation properties, this experience may not necessarily be relevant to a particular redevelopment project. As a result, to redevelop the assemblage sites, the Newark Joint Venture will have to hire personnel knowledgeable in real estate development to assist in its development, become involved with a development partner, or sell some or all of the sites to developers or potential users. There can be no assurance that the Newark Joint Venture will be successful in hiring experienced personnel, finding a development partner with skills needed to develop and/or manage the redevelopment of the sites, or that we will be able to sell some or all of the properties to developers or potential users.
The success of our Newark Joint Venture depends, to a large extent, on the principal of the Newark Joint Venture's manager.
The principal of the manager of the Newark Joint Venture was responsible for acquiring all the properties owned by the Newark Joint Venture. We believe that the principal's continued involvement is important to the success of the Newark Joint Venture. The diminution or loss of his services due to disability, death or for any other reasons could have a material adverse effect on the Newark Joint Venture's business, which would result in a material adverse effect on our business.
The Newark Joint Venture carries key man life insurance on the principal of the manager of the Newark Joint Venture in the amount of $20,000,000. There can be no assurance that the proceeds from such life insurance would be sufficient to compensate the Newark Joint Venture for the loss of his services, and these policies do not provide any benefits if he becomes disabled or is otherwise unable to render services to the Newark Joint Venture.
Our Newark Joint Venture is subject to risks particular to real estate development activities.
Our Newark Joint Venture is subject to the risks associated with development activities. These risks include:
- •
- The inability to obtain the $125 million or more needed to fund the Teachers Village development project.
- •
- The failure to obtain governmental and other approvals on a timely basis;
- •
- Construction, financing and other costs of developing the properties owned by the Newark Joint Venture and in particular,
Teachers Village, may not be obtained or if obtained exceed original estimates, possibly making such activities unprofitable;
- •
- Time required to complete the construction of Teachers Village or to lease up the completed project may be greater than
originally anticipated, thereby adversely affecting our cash flow and liquidity; and
- •
- Occupancy rates and rents of a completed project may not be sufficient to make such project profitable.
We may be unable to renew leases or relet space and are exposed to the risks of defaults by tenants.
In Fiscal 2010, approximately 59% of our rental income was generated from properties at the Newark Joint Venture. The leases at the properties owned by the Newark Joint Venture are generally short-term in nature. If our tenants decide not to renew their leases upon their expiration, we may not be able to relet the space. Even if our tenants do renew or we are able to relet the space, the terms of
17
renewal or reletting may be less favorable than current lease terms. If we are unable to promptly renew the leases or relet the space, or if the rental rates upon such renewal or reletting are significantly lower than current rates, our income would be adversely affected.
Any of our tenants may experience a downturn in their businesses that may weaken their financial condition. In the event of default or the insolvency of our tenants, we may experience a loss of rental revenue and/or delays in collecting rent and incur substantial costs in enforcing our rights as landlord. If a tenant files for bankruptcy protection, a court could allow the tenant to reject and terminate its lease with us. Our income could be adversely affected if our tenants became unable to meet their obligations to us, became insolvent or declare bankruptcy.
Risks Related to our Industry
The geographic concentration of our assets may make our revenues and the value of our assets vulnerable to adverse changes in economic conditions in the New York metropolitan area.
At September 30, 2010, 70% of our outstanding loans are secured by properties located in the New York metropolitan area and 75% of our real estate assets are located in Newark, NJ. A lack of geographical diversification makes our mortgage portfolio and real estate property holdings more sensitive to local or regional economic conditions. A significant decline in the economy of the New York metropolitan area (including Newark, NJ), could result in a greater risk of default under our loans compared with the default rate for loans secured by properties in other geographic locations and a greater risk of a decrease in the value of our real estate assets compared with a decrease in value of properties located in other geographic locations. This could result in a reduction of our revenues, increases in our loan loss allowances and impairment charges and greater losses, which might not be as acute if our portfolio were more geographically diverse.
In order for real estate properties to generate positive cash flow or to make real estate properties suitable for sale, we may need to make significant capital improvements and incur deferred maintenance costs to these properties.
Some of the properties we acquired or will acquire in foreclosure proceedings may face competition from newer, more updated properties. In order to remain competitive and increase occupancy at these properties and/or make them attractive to potential purchasers, we may have to make significant capital improvements and/or incur deferred maintenance costs with respect to these properties. The cost of these improvements and deferred maintenance items may impair our financial performance and our liquidity.
Financing with high loan-to-value ratios involves increased risk of loss and may adversely affect us.
Our primary source of recovery in the event of a loan default is the real estate underlying a defaulted loan. Therefore, the value of our loan depends upon the value of the underlying real estate. The value of the underlying property is dependent on numerous factors outside of our control, including national, regional and local business and economic conditions, inflation, government economic policies and the availability of credit. A loan-to-value ratio is the ratio of the amount of our loan to the estimated market value of the property underlying a loan, as determined by our internal valuation process. The higher the loan to value ratio, the greater the risk that the amount obtainable from sale of a property will be insufficient to repay the loan in full upon default.
18
To facilitate the sale of our real estate properties, we provided seller financing to several purchasers in Fiscal 2009 and may do so in the future.
Due to the credit crisis, institutional lenders adopted restrictive and onerous lending policies and significantly increased the costs of borrowing, making it difficult for potential purchasers to secure financing for the purchase of a property. In Fiscal 2009 we sold properties for an aggregate of $42.9 million, of which we received an aggregate of $25.2 million in cash and provided an aggregate of $17.8 million (of which $11.6 million was repaid in Fiscal 2010) of fixed rate senior purchase money mortgages to facilitate the sale of properties we acquired in foreclosure proceedings. As a result, we only receive a portion of the sales proceeds from these properties at closing, and the balance of the sales proceeds is at risk. If we provide senior purchase money mortgages in the future in connection with the sale of real estate we acquire through foreclosure, we may only receive a portion of the sales proceeds at closing and will only receive the balance of the sales proceeds if the purchaser does not default under such financing. The sale of properties with seller financing also limits our liquidity.
We are subject to the risks associated with loan participations, such as lack of full control rights.
Some of our investments are participating interests in loans in which we share the rights, obligations and benefits of the loan with participating lenders pursuant to a participation agreement. We may need the consent of these parties to exercise our rights under such loans, including rights with respect to amendment of loan documentation, the institution of, and control over, foreclosure actions, entering into forbearance agreements with borrowers, and sale of the underlying property upon acquisition in foreclosure. Our participant may have interests and goals that are different from ours and may desire an action or position which we oppose. As a result, we could become engaged in a dispute with a participant which may affect our ability to take action with respect to defaulted loan or disposition of the property, to our detriment.
We may have less control of our investment when we invest in joint ventures.
From time-to-time, we have entered into joint venture agreements. Our co-venturers may have different interests or goals than we do and our co-venturers may not be able or willing to take an action that is desired by us. A disagreement with respect to the activities of the joint venture could result in a substantial diversion of time and effort by our management and could result in our exercise, or one of our co-venturers exercise, of the buy/sell provision often contained in our joint venture organizational documents. In addition, there is no limitation under our charter documents as to the amount of funds that we may invest in joint ventures. Accordingly, we could invest a substantial amount of our funds in joint ventures which ultimately may not be profitable as a result of disagreements with and among our co-venturers.
Liability relating to environmental matters may impact the value of properties that we may acquire upon foreclosure of the properties underlying our investments.
To the extent we foreclose on properties with respect to which we have extended mortgage loans, we may be subject to environmental liabilities arising from such foreclosed properties. Under various U.S. federal, state and local laws, an owner or operator of real property may become liable for the costs of removal of certain hazardous substances released on its property. These laws often impose liability without regard to whether the owner or operator knew of, or was responsible for, the release of such hazardous substances.
The presence of hazardous substances may adversely affect an owner's ability to sell real estate or borrow using real estate as collateral. To the extent that an owner of a property underlying one of our
19
loans becomes liable for removal costs, the ability of the owner to make payments to us may be reduced, which in turn may adversely affect the value of the relevant mortgage asset held by us.
If we foreclose on properties underlying our loans, the presence of hazardous substances on a property may adversely affect our ability to sell the property and we may incur substantial remediation costs. The discovery of material environmental liabilities attached to such properties could have a material adverse effect on our results of operations and financial condition.
We operate in a highly competitive market.
We compete with many third parties engaged in finance and real estate investment activities, including other REITs, specialty finance companies, public and private lending companies, investment funds and other entities. Some of these competitors have substantially greater financial resources than we do and generally may be able to accept more risk. As such, they have the ability to make larger loans and to reduce the risk of loss from any one loan by having a more diversified loan portfolio. They may also enjoy significant competitive advantages that result from, among other things, enhanced operating efficiencies. An increase in the availability of funds to lenders, or a decrease in the amount of borrowing activity, may increase competition for making loans and may reduce obtainable yields or increase the credit risk inherent in the available loans.
Our revenues and the value of our portfolio may be negatively affected by casualty events occurring on properties securing our loans.
We require our borrowers to obtain, for our benefit, comprehensive insurance covering the property and any improvements to the property collateralizing our loan in an amount intended to be sufficient to provide for the cost of replacement in the event of casualty. In addition, joint ventures in which we are an equity participant carry comprehensive insurance covering the property and any improvements to the property owned by the joint venture for the cost of replacement in the event of a casualty. Further, we carry insurance for such purpose on properties owned by us. However, the amount of insurance coverage maintained for any property may not be sufficient to pay the full replacement cost following a casualty event. In addition, the rent loss coverage under a policy may not extend for the full period of time that a tenant may be entitled to a rent abatement that is a result of, or that may be required to complete restoration following a casualty event. In addition, there are certain types of losses, such as those arising from earthquakes, floods, hurricanes and terrorist attacks, that may be uninsurable or that may not be economically insurable. Changes in zoning, building codes and ordinances, environmental considerations and other factors may make it impossible for our borrower, a joint venture or us, as the case may be, to use insurance proceeds to replace damaged or destroyed improvements at a property. If any of these or similar events occur, the amount of coverage may not be sufficient to replace a damaged or destroyed property and/or to repay in full the amount due on all loans collateralized by such property. As a result, our returns and the value of our investment may be reduced.
Senior management and other key personnel are critical to our business and our future success may depend on our ability to retain them.
We depend on the services of Fredric H. Gould, chairman of our board of trustees, Jeffrey A. Gould, our president and chief executive officer, and other members of senior management to carry out our business and investment strategies. Although Jeffrey A. Gould devotes substantially all of his business time to our affairs, he devotes a limited amount of his business time to entities affiliated with us. In addition to Jeffrey A. Gould, only three other executive officers, Mitchell Gould, our executive vice president, Lonnie Halpern, a vice president, and George Zweier, our vice president and chief
20
financial officer, devote all or substantially all of their business time to us. The remainder of our executive management personnel share their services on a part-time basis with entities affiliated with us and located in the same executive offices pursuant to a shared services agreement. We rely on part-time executive officers to provide certain services to us, including legal, accounting and computer services, since we do not employ full-time executive officers to handle these services. If the shared services agreement is terminated, we will have to obtain such services or hire employees to perform them. We may not be able to replace these services or hire such employees in a timely manner or on terms, including cost and level of expertise, that are as favorable as those we receive under the shared services agreement.
In addition, in the future we may need to attract and retain qualified senior management and other key personnel, both on a full-time and part-time basis. The loss of the services of any of our senior management or other key personnel or our inability to recruit and retain qualified personnel in the future, could impair our ability to carry out our business and our investment strategies.
We do not carry key man life insurance on members of our senior management.
Our transactions with affiliated entities involve conflicts of interest.
Entities affiliated with us and with certain of our executive officers provide services to us and on our behalf. Although our policy is to obtain terms in transactions with affiliates that are at least as favorable as those that we would receive if the transactions were entered into with unaffiliated entities, these transactions raise the potential that we may not receive terms as favorable as those that we would receive if the transactions were entered into with unaffiliated entities.
Compliance with REIT requirements may hinder our ability to maximize profits.
In order to qualify as a REIT for Federal income tax purposes, we must continually satisfy tests concerning among other things, our sources of income, the amounts we distribute to our shareholders and the ownership of securities. We may also be required to make distributions to shareholders at disadvantageous times or when we do not have funds readily available for distribution. Accordingly, compliance with REIT requirements may hinder our ability to operate solely on the basis of maximizing profits.
In order to qualify as a REIT, we must also ensure that at the end of each calendar quarter at least 75% of the value of our assets consists of cash, cash items, government securities and qualified REIT real estate assets. The remainder of our investment in securities cannot include more than 10% of the outstanding voting securities of any one issuer or more than 10% of the total value of the outstanding securities of such issuer. In addition, no more than 5% of the value of our assets can consist of the securities of any one issuer, other than a qualified REIT security. If we fail to comply with these requirements, we must dispose of the portion of our assets in excess of such amounts within 30 days after the end of the calendar quarter in order to avoid losing our REIT status and suffering adverse tax consequences. This requirement could cause us to dispose of assets for consideration of less than their true value and could lead to a material adverse impact on our results of operations and financial condition.
Item 1B. Unresolved Staff Comments.
None.
21
Executive Officers of Registrant
Set forth below is a list of our executive officers whose terms will expire at our 2011 annual Board of Trustees' meeting. The business history of officers who are also Trustees will be provided in our proxy statement to be filed pursuant to Regulation 14A not later than January 28, 2011.
Name
|
Office | |
|---|---|---|
| Fredric H. Gould* | Chairman of the Board of Trustees | |
Jeffrey A. Gould* |
President and Chief Executive Officer; Trustee |
|
Mitchell K. Gould |
Executive Vice President |
|
Matthew J. Gould* |
Senior Vice President; Trustee |
|
Simeon Brinberg** |
Senior Vice President; Senior Counsel; and Secretary |
|
David W. Kalish |
Senior Vice President, Finance |
|
Israel Rosenzweig |
Senior Vice President |
|
Mark H. Lundy** |
Senior Vice President and General Counsel |
|
George E. Zweier |
Vice President, Chief Financial Officer |
|
Lonnie Halpern |
Vice President |
- *
- Fredric
H. Gould is the father of Jeffrey A. and Matthew J. Gould.
- **
- Simeon Brinberg is the father-in-law of Mark H. Lundy.
Mitchell K. Gould (age 38), employed by us since May 1998, has been a Vice President since March 1999 and Executive Vice President since March 2007. From January 1998 until May 1998, Mr. Gould was employed by Bear Stearns Companies, Inc. where he was engaged in originating and underwriting commercial real estate loans for securitization.
Simeon Brinberg (age 76) has been our Secretary since 1983, a Senior Vice President since 1988, and Senior Counsel since March 2006. Mr. Brinberg has been a Vice President of Georgetown Partners, Inc., the managing general partner of Gould Investors L.P., since October 1988. Gould Investors L.P. is primarily engaged in the ownership and operation of real estate properties held for investment. Since June 1989, Mr. Brinberg has been a Vice President of One Liberty Properties, Inc. (currently a Senior Vice President), a REIT engaged in the ownership of income producing real properties leased to tenants under long term leases. Mr. Brinberg is a member of the New York Bar and was engaged in the private practice of law for approximately 30 years prior to 1988.
David W. Kalish (age 63) has been our Senior Vice President, Finance since August 1998. Mr. Kalish was our Vice President and Chief Financial Officer from June 1990 until August 1998. He has been Chief Financial Officer of One Liberty Properties, Inc. and Georgetown Partners, Inc. since June 1990. For more than five years prior to June 1990, Mr. Kalish, a certified public accountant, was a partner of Buchbinder Tunick & Company LLP and its predecessors.
Israel Rosenzweig (age 63) has been a Senior Vice President since April 1998. Mr. Rosenzweig has been a Vice President of Georgetown Partners, Inc. since May 1997 and from 2000 to March 2009 was President of GP Partners, Inc., an affiliate of Gould Investors L.P. which provided advisory services in the real estate and financial services industries to an investment advisor. He also has been a Senior Vice President of One Liberty Properties, Inc. since May 1997.
22
Mark H. Lundy (age 48) has been our General Counsel since March 2007 and a Senior Vice President since March 2005. From 1993 to March 2005 he was a Vice President. He has been the Secretary of One Liberty Properties, Inc. since June 1993 and he also serves as a Senior Vice President of One Liberty Properties, Inc. Mr. Lundy has been a Vice President of Georgetown Partners, Inc. (currently Senior Vice President) since July 1990. He is a member of the bars of New York and Washington, D.C.
George E. Zweier (age 46) has been employed by us since June 1998 and was elected Vice President, Chief Financial Officer in August 1998. For approximately five years prior to joining us, Mr. Zweier, a certified public accountant, was an accounting officer with the Bank of Tokyo-Mitsubishi Limited in its New York office.
Lonnie Halpern (age 35) has been employed by us since August 2005 and was elected a Vice President in March 2007. Mr. Halpern is a member of the bars of New York and Massachusetts, and was an associate at Goodwin Procter LLP, New York, N.Y. from September 2001 to March 2004 and Hogan & Hartson LLP, New York, N.Y. from April 2004 to July 2005.
Our executive offices are located at 60 Cutter Mill Road, Great Neck, New York, where we currently occupy approximately 12,000 square feet with Gould Investors L.P., REIT Management Corp., One Liberty Properties, Inc. and other related entities. The building in which our executive offices are located is owned by a subsidiary of Gould Investors L.P. For the year ended September 30, 2010, we contributed $60,000 to the annual rent of $495,000 paid by Gould Investors L.P., REIT Management Corp., One Liberty Properties, Inc., and related entities. We also lease, under a direct lease with the Gould Investors L.P. subsidiary, an additional 1,800 square feet directly adjacent to the 12,000 square feet at an annual rental of $60,000.
At September 30, 2010, we owned four real estate properties, with an aggregate book value of $55.8 million, of which three properties were acquired in foreclosure proceedings. The properties owned by our Newark Joint Venture, having a book value of $41.9 million as of September 30, 2010, represent 22% of our total assets as of September 30, 2010. No other real estate property owned by us represents 5% of our total assets as of September 30, 2010. See "Item 1. Business—Our Real Estate Assets" and "Item 1. Business—Newark Joint Venture" for a schedule of the real property assets acquired by us in foreclosure proceedings and owned at September 30, 2010 and information relating to the Newark Joint Venture.
None.
Item 4. [Removed and Reserved]
23
Item 5. Market for Registrant's Common Equity, Related Stockholder Matters and Issuer Purchases of Equity Securities.
Our common shares of beneficial interest, or Common Shares, are listed on the New York Stock Exchange, or the NYSE, under the symbol "BRT." The following table shows for the periods indicated, the high and low sales prices of the Common Shares on the NYSE as reported on the Composite Tape and the per share dividend declared in the periods indicated:
| |
Fiscal 2010 | Fiscal 2009 | |||||||||||||||||
|---|---|---|---|---|---|---|---|---|---|---|---|---|---|---|---|---|---|---|---|
Quarter Ended
|
High | Low | Dividend Per Share |
High* | Low* | Dividend Per Share |
|||||||||||||
December 31 |
$ | 5.84 | $ | 4.35 | $ | — | $ | 7.75 | $ | 1.90 | $ | — | |||||||
March 31 |
6.79 | 4.36 | — | 4.30 | 2.35 | — | |||||||||||||
June 30 |
7.25 | 5.18 | — | 4.73 | 2.89 | — | |||||||||||||
September 30 |
6.50 | 4.84 | — | 5.72 | 2.73 | 1.15 | ** | ||||||||||||
- *
- As
adjusted to give effect to the issuance of a stock dividend in connection with the special capital gain dividend described below.
- **
- Represents a special capital gain dividend of $1.15 per share, which was declared on September 14, 2009 and distributed on October 30, 2009. We applied the provisions of an IRS Revenue Procedure related to REITs, which permits public REITs to distribute a dividend with respect to the tax year ending December 31, 2009 by issuing shares of common stock; provided that at least 10% of the dividend amount is paid in cash. As a result, we distributed an aggregate of 2,437,352 of our Common Shares and paid approximately $1,330,000 in cash in connection with the special capital gain dividend. The cash amount was allocated pro rata among all shareholders who elected to receive cash. Since any shareholder electing cash could not receive the entire dividend in cash, the remainder of the dividend was paid in our Common Shares. Shareholders who did not elect to receive cash received the entire dividend in our Common Shares.
On December 6, 2010, the high and low sales prices of our Common Shares on the NYSE was $6.64 and $6.55, respectively.
As of December 6, 2010, there were approximately 1,282 holders of record of our Common Shares and approximately 4,820 shareholders.
24
Stock Performance Graph
This graph compares the performance of our shares with the Standard & Poor's 500 Stock Index and a peer group index consisting of publicly traded mortgage REITs. The graph assumes $100 invested on September 30, 2005 and assumes the reinvestment of dividends.
COMPARISON OF 5 YEAR CUMULATIVE TOTAL RETURN*
Among BRT Realty Trust, The S&P 500 Index
And The FTSE NAREIT Mortgage REITs Index
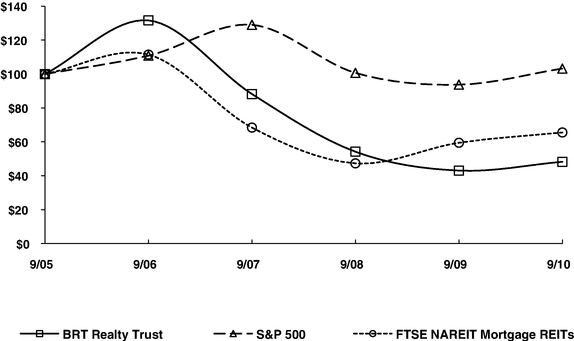
- *
- $100 invested on 9/30/05 in stock or index, including reinvestment of dividends. Fiscal year ending September 30.
Copyright© 2010 S&P, a division of The McGraw-Hill Companies Inc. All rights reserved.
| |
9/05 | 9/06 | 9/07 | 9/08 | 9/09 | 9/10 | |||||||||||||
|---|---|---|---|---|---|---|---|---|---|---|---|---|---|---|---|---|---|---|---|
BRT Realty Trust |
100.00 | 131.59 | 88.20 | 54.17 | 43.04 | 48.25 | |||||||||||||
S&P 500 |
100.00 | 110.79 | 129.01 | 100.66 | 93.70 | 103.22 | |||||||||||||
FTSE NAREIT Mortgage REITs |
100.00 | 111.44 | 68.41 | 47.32 | 59.45 | 65.52 | |||||||||||||
25
Equity Compensation Plan Information
The table below provides information as of September 30, 2010 with respect to our Common Shares that may be issued under the BRT Realty Trust 2003 Incentive Plan and the BRT Realty Trust 2009 Incentive Plan:
| |
Number of securities to be issued upon exercise of outstanding options, warrants and rights |
Weighted-average exercise price of outstanding options, warrants and rights |
Number of securities remaining available-for future issuance under equity compensation plans— excluding securities reflected in column (a) |
|||||||
|---|---|---|---|---|---|---|---|---|---|---|
| |
(a) |
(b) |
(c) |
|||||||
Equity compensation plans approved by security holders |
22,500 | (1) | $ | 7.16 | 492,960 | |||||
Equity compensation plans not approved by security holders |
— | — | — | |||||||
Total |
22,500 | (1) | $ | 7.16 | 492,960 | |||||
- (1)
- Does not include 391,580 shares of restricted stock issued to officers, directors, employees and consultants. Each award of restricted shares vests five years from the effective date of the award, unless vesting is accelerated by our Compensation Committee and Board of Trustees under special circumstances. Such shares vest as follows: 37,850 shares in 2011; 40,925 shares in 2012; 62,805 shares in 2013; 125,400 shares in 2014 and 124,600 shares in 2015.
On September 20, 2010, we commenced a tender offer to acquire up to 2,500,000 of our shares at a price of $6.30 per share. Pursuant to the offer, which expired on October 21, 2010, we acquired 147,388 shares for an aggregate purchase price of $928,544.
26
Item 6. Selected Financial Information.
The following table, not covered by the report of the independent registered public accounting firm, sets forth selected historical financial data for each of the fiscal periods in the five years ended September 30, 2010. This table should be read in conjunction with the detailed information and financial statements appearing elsewhere herein (dollars in thousand except per share amounts).
| |
2010 | 2009 | 2008 | 2007 | 2006 | ||||||||||||
|---|---|---|---|---|---|---|---|---|---|---|---|---|---|---|---|---|---|
(Dollars in thousands, except per share amounts) |
|||||||||||||||||
Operating statement data |
|||||||||||||||||
Total revenues |
$ | 8,135 | $ | 12,154 | $ | 21,990 | $ | 42,900 | $ | 37,488 | |||||||
Total expenses(1)(2) |
19,844 | 36,329 | 35,554 | 30,570 | 20,708 | ||||||||||||
Gain on sale of available-for-sale securities |
1,586 | 1,016 | 19,940 | 19,455 | — | ||||||||||||
Gain on early extinguishment of debt |
— | 6,443 | — | — | — | ||||||||||||
(Loss) income from continuing operations |
(9,927 | ) | (19,236 | ) | 7,734 | 34,702 | 19,279 | ||||||||||
Income (loss) from discontinued operations(3) |
590 | (29,124 | ) | (7,855 | ) | 368 | 792 | ||||||||||
Net (loss) income attributable to common shareholders |
(8,015 | ) | (47,755 | ) | (260 | ) | 35,070 | 20,071 | |||||||||
(Loss) earnings per beneficial share: |
|||||||||||||||||
(Loss) income from continuing operations |
$ | (.62 | ) | $ | (2.50 | ) | .69 | $ | 3.30 | $ | 2.43 | ||||||
Income (loss) from discontinued operations |
.04 | (1.60 | ) | (.67 | ) | .04 | .10 | ||||||||||
Basic (loss) earnings per share |
$ | (.58 | ) | $ | (4.10 | ) | $ | (.02 | ) | $ | 3.34 | $ | 2.53 | ||||
(Loss) income from continuing operations |
(.62 | ) | (2.50 | ) | $ | .69 | $ | 3.29 | $ | 2.42 | |||||||
Income (loss) from discontinued operations |
.04 | (1.60 | ) | (.67 | ) | .04 | .10 | ||||||||||
Diluted (loss) earnings per share |
$ | (.58 | ) | $ | (4.10 | ) | $ | (.02 | ) | $ | 3.33 | $ | 2.52 | ||||
Distribution per common share(4) |
— | $ | 1.15 | $ | 3.19 | $ | 2.44 | $ | 2.14 | ||||||||
Balance sheet data: |
|||||||||||||||||
Total assets |
$ | 186,122 | $ | 193,333 | $ | 270,020 | $ | 328,109 | $ | 368,426 | |||||||
Earning real estate loans(5) |
17,263 | 44,677 | 95,228 | 185,899 | 283,282 | ||||||||||||
Non-earning real estate loans(5) |
35,143 | 2,836 | 18,407 | 63,627 | 1,346 | ||||||||||||
Purchase money mortgage loans |
5,340 | 16,804 | — | — | — | ||||||||||||
Real estate loans held for sale |
— | 16,915 | — | — | — | ||||||||||||
Real estate properties, net |
55,792 | 55,544 | 14,154 | 3,336 | 3,342 | ||||||||||||
Cash and cash equivalents |
58,497 | 25,708 | 35,765 | 17,103 | 8,393 | ||||||||||||
Available-for-sale securities at market |
10,270 | 8,963 | 10,482 | 34,936 | 53,252 | ||||||||||||
Real estate properties held for sale |
51 | 14,204 | 62,858 | 9,355 | 2,833 | ||||||||||||
Junior subordinated notes |
40,815 | 40,234 | 56,702 | 56,702 | 56,702 | ||||||||||||
Mortgages payable |
12,557 | 9,460 | 2,315 | 2,395 | 2,471 | ||||||||||||
Total BRT Realty Trust Shareholders' equity |
124,554 | 121,227 | 186,772 | 235,175 | 154,435 | ||||||||||||
- (1)
- Includes
$3,165, $17,110, $15,260 and $9,300 of provision for loan losses for the fiscal years ended September 30, 2010, 2009, 2008 and 2007,
respectively. There were no provisions in the fiscal year ended September 30, 2006.
- (2)
- Includes $2,625, $1,272 and $1,050 of impairment charges in the fiscal years ended September 30, 2010, 2009 and 2008, respectively. There were no impairments in the fiscal years ended September 30, 2007 or 2006.
27
- (3)
- Includes
$745, $29,774 and $8,165 of impairment charges in the fiscal years ended September 30, 2010, 2009 and 2008, respectively. There were no
impairments in the fiscal years ended September 30, 2007 or 2006.
- (4)
- The
distributions in the fiscal years ended September 30, 2008, 2007 and 2006 were paid wholly in cash. In the fiscal year ended September 30,
2009, a distribution of $1.15 was declared in September 2009 and in October 2009 was paid in a combination of both cash, representing 10% of the total distribution of $13,308, and 90% in our
common shares. The cash amount was allocated pro rata among all shareholders who elected to receive cash. Since any shareholder electing to receive cash could not receive the entire dividend in cash,
the remainder of the dividend was paid to shareholders electing to receive cash in our common shares. Shareholders who did not elect cash received the entire dividend in our common shares.
- (5)
- Earning and non-earning loans, which exclude loans held for sale, are presented without deduction of the related allowance for possible losses and deferred fee income.
Item 7. Management's Discussion and Analysis of Financial Condition and Results of Operations.
Overview
We are a real estate investment trust, also known as a REIT. Our primary business is to originate and hold for investment senior mortgage loans secured by commercial and multi-family real estate property in the United States. Our primary source of revenue has generally been interest income, which is the interest our borrowers pay on our loans, and to a lesser extent, loan fee income generated on the origination and extension of loans, rental revenue from real properties and investment income.
We continue to face challenging and volatile market conditions, with the recessionary environment continuing to cause disruptions in the credit markets, valuation of real estate assets and lessened liquidity. Due to these conditions, and the effect they have had on our business, our focus shifted, in the latter part of Fiscal 2008 through a significant portion of Fiscal 2010, from originating loans to servicing our loan portfolio, including work-out activities, pursuing foreclosure actions, acquiring the real property securing our loans, operating real property acquired by us in foreclosure proceedings, and engaging in activities related to the sale of certain of these properties. Continued disruption in the credit markets and devaluation of real estate assets may have a material adverse effect on our ability to operate our primary lending business.
The credit and real estate crisis adversely affected our business in Fiscal 2010 as follows:
- •
- We had a net loss of $8.0 million for the year ended September 30, 2010;
- •
- Three loans in aggregate principal amount of $34.6 million went into default and became non-earning in
Fiscal 2010;
- •
- We added $3.2 million to our loan loss provisions in Fiscal 2010 and had an aggregate of $3.2 million
in loan loss allowances outstanding against two non-earning loans with a principal balance of $26.7 million at September 30, 2010;
- •
- We recorded impairment charges of $3.4 million in Fiscal 2010 against our real properties, including those
held for sale;
- •
- At September 30, 2010, we owned three properties, with a book value of $52.9 million, which were acquired in
foreclosure proceedings; and
- •
- Real properties, including properties held for sale, acquired by us in foreclosure proceedings had a negative cash flow in Fiscal 2010 of $1.8 million. We made improvements in Fiscal 2010 to these properties at a cost of $3.7 million.
28
We cannot predict with any certainty the potential impact the economic crisis will have on our future financial performance. However, because of our low leverage position we have been able to withstand the significant disruptions in the real estate and capital markets. At present, we are seeking to position ourselves to be able to take advantage of opportunities as market conditions improve. To do this, we continue to focus on:
- •
- carefully monitoring and managing our liquidity position;
- •
- carefully monitoring and managing our loan portfolio to reposition non-performing assets and maximize cash;
- •
- acquiring, stabilizing and selling properties securing non-earning loans in order to increase our liquidity;
- •
- investing in attractive REIT debt; and
- •
- securing a new credit facility.
Until credit becomes readily available, and there is consistent and considerable improvement in the overall economy, we could experience (i) more borrower defaults, (ii) additional loan loss provisions and impairment charges, (iii) additional foreclosure actions (with an increase in expenses incurred in pursuing such actions), (iv) the acquisition of additional properties in foreclosure proceedings, (v) significant expenses for stabilizing, repairing and operating properties acquired in foreclosure proceedings, (vi) limited origination activity, and (vii) reduced access to capital and increased cost of financing, all of which could result in a decline in our revenues and continuing operating losses.
Our loan originations in Fiscal 2011 (through December 1, 2010), Fiscal 2010 and Fiscal 2009 were $24.5 million, $17.4 million and $12.7 million, respectively.
Year Ended September 30, 2010 Compared to Year Ended September 30, 2009
Revenues
The following table sets forth a comparison of our revenues for Fiscal 2010 and 2009:
| |
Fiscal | |
|
|||||||||||
|---|---|---|---|---|---|---|---|---|---|---|---|---|---|---|
| (Dollars in thousands): |
2010 | 2009 | Variance | % Change | ||||||||||
Interest on real estate loans |
$ | 2,412 | $ | 8,577 | $ | (6,165 | ) | (71.9 | )% | |||||
Interest on purchase money mortgage loans |
1,212 | 246 | 966 | 392.7 | % | |||||||||
Loan fee income |
253 | 887 | (634 | ) | (71.5 | )% | ||||||||
Rental revenue from real estate properties |
3,422 | 1,718 | 1,704 | 99.2 | % | |||||||||
Recovery of previously provided allowance |
365 | 0 | 365 | N/A | ||||||||||
Other, primarily investment income |
471 | 726 | (255 | ) | (35.1 | )% | ||||||||
Total revenues |
$ | 8,135 | $ | 12,154 | $ | (4,019 | ) | (33.1 | )% | |||||
Interest on real estate loans. The decrease is primarily due to the $57.6 million decrease from Fiscal 2009 in the average balance of earning loans outstanding. The decrease in such balance is attributable to the increase in non-performing loans (which increased because two loans in the aggregate principal amount of $34.6 million became non-performing in the first quarter of Fiscal 2010) and payoffs and sales of $39.3 million of outstanding loans. Partially offsetting this decrease was an increase of approximately $449,000 of interest income attributable to the increase from 11.48% to 12.17% in the interest rate earned on the performing loans and interest income of $486,000, of which $359,000 is attributable to payments received in connection with the settlement of a lawsuit relating to a series of loans to one borrower and $90,000 is attributable to the receipt of interest on non-performing loans.
29
Interest on purchase money mortgages. The increase is attributable to the inclusion for a full fiscal year of interest on such mortgages. We began to originate such loans in the third quarter of Fiscal 2009 to facilitate the sale of our owned real estate.
Rental revenue from real estate properties. The increase is due to the inclusion for a full fiscal year of rental revenues earned from the properties owned by our Newark Joint Venture, including $465,000 derived from a lease entered into in the first quarter of Fiscal 2010. We entered into the Newark Joint Venture in the fourth quarter of Fiscal 2009 and accordingly, rental revenues for Fiscal 2009 only includes revenues from such venture for the fourth quarter.
Recovery of previously provided allowance. In Fiscal 2010, we recognized a $365,000 recovery in previously provided loan loss allowances from two loans that were previously impaired and were paid off for amounts greater than their net carrying value. There was no comparable revenue in Fiscal 2009.
Other, primarily investment income. The net decrease is attributable to the decrease in dividend income due to the sale of dividend paying securities and to a lesser extent to lower rates earned on short-term investments.
Expenses
The following table sets forth a comparison of expenses for Fiscal 2010 and 2009:
| |
Fiscal | |
|
|||||||||||
|---|---|---|---|---|---|---|---|---|---|---|---|---|---|---|
| (Dollars in thousands) |
2010 | 2009 | Variance | % Change | ||||||||||
Interest—borrowed funds |
$ | 1,773 | $ | 4,435 | $ | (2,662 | ) | (60.0 | )% | |||||
Advisor's fee—related party |
785 | 1,173 | (387 | ) | (33.0 | )% | ||||||||
Provision for loan loss |
3,165 | 17,110 | (13,945 | ) | (81.5 | )% | ||||||||
Impairment charges |
2,625 | 1,272 | 1,353 | 106.4 | % | |||||||||
Foreclosure related professional fees |
673 | 908 | (235 | ) | (25.9 | )% | ||||||||
Debt restructuring expenses |
— | 685 | (685 | ) | N/A | |||||||||
General and administrative |
6,063 | 7,045 | (982 | ) | (13.9 | )% | ||||||||
Operating expenses related to real estate owned |
3,866 | 2,361 | 1,505 | 63.8 | % | |||||||||
Amortization and depreciation |
894 | 1,340 | (446 | ) | (33.3 | )% | ||||||||
Total expenses |
$ | 19,844 | $ | 36,329 | $ | (16,485 | ) | (45.4 | )% | |||||
Interest—borrowed funds. The components of the decrease are as follows: (a) $1.09 million is due to the restructuring effected in Fiscal 2009 of our junior subordinated notes; (b) $787,000 is attributable to the $15.5 million decrease in the average outstanding balance of our junior subordinated notes which decrease in turn is attributable to our partial repayment of these notes at the end of the fourth quarter of Fiscal 2009; (c) $146,000 is due to the reduction of amounts borrowed due to our termination of the credit facility in the third quarter of Fiscal 2009; (d) $311,000 is attributable to the reduction in amortization of deferred borrowing costs resulting primarily from our termination of the credit facility and (e) $328,000 is due to the capitalization of interest expense allocated to the development of one of the Newark, NJ Assemblages.
Advisor's fee—related party. The fee is calculated based on invested assets and decreased because of the decrease in our portfolio of loans and real estate assets. These assets decreased because of our foreclosure of defaulted mortgage loans and the subsequent sale of the underlying real estate.
Provision for loan losses. In Fiscal 2010 we took loan loss provisions against two loans with an aggregate outstanding balance of $26.7 million. In Fiscal 2009, the loan loss provision was taken against 22 loans with an aggregate principal balance $65.8 million.
30
Impairment Charges. The impairments in Fiscal 2010 were taken against two properties, of which $2.5 million relates to a parcel of unimproved land located in South Daytona Beach, Florida and the $125,000 balance was taken against six individual condominium units located in Apopka, Florida. In Fiscal 2009, we took an impairment charge against one property in our real estate portfolio
Foreclosure related professional fees. Fees decreased due to the decrease in foreclosure actions and workout activity as many of the foreclosure actions pending in Fiscal 2009 were concluded in Fiscal 2009 or early Fiscal 2010.
Debt restructuring expenses. This represents legal expenses and third party costs incurred in Fiscal 2009 in connection with the restructuring of our trust preferred securities. There was no comparable expense in Fiscal 2010.
General and administrative expense. The decrease is attributable primarily to net decreases of $595,000 in professional fees and $367,000 in salary, benefits and expenses allocated pursuant to our shared services agreement. Professional fees decreased primarily because Fiscal 2009 included expenses incurred in connection with the workout and the resulting joint venture agreement that was entered into in the fourth quarter of Fiscal 2009 with respect to the Newark Joint Venture. There was no comparable expense in Fiscal 2010. Professional fees also decreased because Fiscal 2009 includes additional audit and internal control fees incurred in connection with workout and foreclosure activity. Salary, benefits and allocated expenses decreased on a net basis primarily due to reduced bonuses and the reduction in our level of workout and foreclosure activity. There were also decreases in taxes and travel and entertainment expenses which were partially offset by increases in advertising/promotional fees and exchange listing and other public company expenses.
Operating expenses related to real estate owned. The increase is attributable to the inclusion, for a full fiscal year, of the operating expenses related to our Newark Joint Venture properties. In Fiscal 2009, such expenses were only incurred in the fourth fiscal quarter.
Amortization and depreciation. The decrease is attributable to reclassification of real estate to real estate held for sale as depreciation is not recorded on properties held for sale.
Other revenue and expense items
Equity in earnings (loss) of unconsolidated ventures. In Fiscal 2010, we had a gain of $196,000 compared to a loss of $2.8 million in Fiscal 2009. The change is attributable primarily to the inclusion in Fiscal 2009 of a $2.8 million loss reflecting our proportionate share of the loss sustained by our joint venture with the CIT Capital USA, Inc. and the write off of the balance of the unamortized fee we paid to an investment banker for obtaining capital from CIT Capital USA. The principal reason for the loss recorded by the joint venture was a loan loss provision taken to reflect a decrease in the value of the real estate underlying a non-performing loan.
Gain on early extinguishment of debt. In Fiscal 2009, we retired $15.9 million face value of junior subordinated notes for $7.95 million. We incurred legal and other fees of $365,000 related to the transaction. The carrying value at the time of the redemption was $14.8 million, which included $329,000 of deferred fees. We recorded a gain of $6.44 million on the transaction. There was no comparable gain in Fiscal 2010.
31
Discontinued operations
The following table sets forth a comparison of discontinued operations and the components thereof for Fiscal 2010 and 2009:
| |
Fiscal | |
|
||||||||||
|---|---|---|---|---|---|---|---|---|---|---|---|---|---|
| (Dollars in thousands) |
2010 | 2009 | Variance | % Change | |||||||||
Loss from operations |
$ | (602 | ) | $ | (1,549 | ) | $ | 947 | 61.1 | % | |||
Impairment charges |
(745 | ) | (29,774 | ) | 29,029 | 97.5 | % | ||||||
Gain on sale of real estate assets |
1,937 | 2,199 | (262 | ) | (11.9 | )% | |||||||
Income (loss) from discontinued operations |
$ | 590 | $ | (29,124 | ) | $ | 29,714 | 102.0 | % | ||||
Loss from operations. The decrease is attributable to the sale in late Fiscal 2009 and early Fiscal 2010 of real estate assets that we acquired through foreclosures in Fiscal 2009 that were classified in Fiscal 2009 as held for sale.
Impairment charges. These charges decreased as we sold most of the properties acquired by foreclosure in Fiscal 2009 and the beginning of Fiscal 2010. In Fiscal 2010, the impairment charges were taken against two properties and in Fiscal 2009 were taken against thirteen properties.
Gain on sale of real estate assets. We recorded gains on the sale of five properties in Fiscal 2010 and on the sale of six properties in Fiscal 2009.
Year Ended September 30, 2009 Compared to Year Ended September 30, 2008
Revenues
The following table sets forth a comparison of revenues for the Fiscal 2009 and 2008:
| |
Fiscal | |
|
|||||||||||
|---|---|---|---|---|---|---|---|---|---|---|---|---|---|---|
| (Dollars in thousands) |
2009 | 2008 | Variance | % Change | ||||||||||
Interest on real estate loans |
$ | 8,577 | $ | 16,526 | $ | (7,949 | ) | (48.1 | )% | |||||
Interest on purchase money mortgages |
246 | — | 246 | N/A | ||||||||||
Loan fee income |
887 | 2,246 | (1,359 | ) | (60.5 | )% | ||||||||
Rental revenue from real estate properties |
1,718 | 1,452 | 266 | 18.3 | % | |||||||||
Other, primarily investment income |
726 | 1,766 | (1,040 | ) | (58.9 | )% | ||||||||
Total revenues |
$ | 12,154 | $ | 21,990 | $ | (9,836 | ) | (44.7 | )% | |||||
Interest on real estate loans. The decline in interest on real estate loans is primarily due to a decline in the average balance of earning loans outstanding of $57.5 million, due to a reduced originations combined with payoffs, foreclosures and increase in non-performing loans caused by the crisis in the credit markets nationally and significant declines in the value of real estate property assets, which limited investments in real estate and demand for bridge loans. This caused interest to decline by $6.8 million. There was also a decline in the rate earned on the performing portfolio of 69 basis points, from 12.60% in the year ended September 30, 2008 to 11.48%, in the year ended September 30, 2009, thereby reducing revenues by $1.1 million.
Interest on purchase money mortgages. The increase results from the origination of loans to facilitate the sale of our owned real estate. We did not originate any senior purchase money mortgages in the fiscal year ended September 30, 2008.
Loan fee income. The decline is the result of a decline in loan originations over the last year and a decline in extension fee income due to a reduced portfolio.
Rental revenues from real estate properties. The increase is primarily the result of the inclusion of rental revenue for four months in Fiscal 2009 from the properties owned by our Newark Joint Venture.
32
Other, primarily investment income. The decline was due to reduced dividend income from shares of Entertainment Properties Trust owned by us due to our sale of 535,511 shares of EPR in fiscal 2008 and 2009, and a decline in the rate earned on other short-term investments.
Expenses
The following table sets forth a comparison of expenses for Fiscal 2009 and 2008:
| |
Fiscal | |
|
|||||||||||
|---|---|---|---|---|---|---|---|---|---|---|---|---|---|---|
| (Dollars in thousands) |
2009 | 2008 | Variance | Change | ||||||||||
Interest—borrowed funds |
$ | 4,435 | $ | 6,644 | $ | (2,209 | ) | (33.3 | )% | |||||
Advisor's fee—related party |
1,173 | 1,730 | (557 | ) | (32.2 | )% | ||||||||
Provision for loan loss |
17,110 | 15,260 | 1,850 | 12.1 | % | |||||||||
Impairment charges |
1,272 | 1,050 | 222 | 21.2 | % | |||||||||
Foreclosure related professional fees |
908 | 2,009 | (1,101 | ) | (54.8 | )% | ||||||||
Debt restructuring expenses |
685 | — | 685 | N/A | ||||||||||
General and administrative |
7,045 | 7,090 | (45 | ) | (0.6 | )% | ||||||||
Operating expenses related to real estate owned |
2,361 | 976 | 1,385 | 141.9 | % | |||||||||
Amortization and depreciation |
1,340 | 795 | 545 | 68.6 | % | |||||||||
Total expenses |
$ | 36,329 | $ | 35,554 | $ | 775 | 2.2 | % | ||||||
Interest on borrowed funds. In Fiscal 2009, the average outstanding balance of borrowed funds declined $15 million as a result of our paydown of the credit facility during such period with funds from loan repayments and the sale of properties. This decline accounted for a decrease in interest expense of $619,000. We also recognized an $806,000 reduction in interest expense as a result of the restructuring of our trust preferred securities. A decline of 257 basis points in the interest rate paid on the credit facility caused a further decrease in interest expense of $347,000. The remaining decrease of $437,000 was the result of a decline in the amortization of deferred fees.
Advisor's fee. This fee, which is calculated based on invested assets, declined as a result of a decreased level of invested assets, primarily a decline in outstanding mortgage loans, partially offset by an increase in real estate assets.
Provision for loan losses. Management, in its regular review process, analyzes the loan portfolio and the underlying value of the collateral securing our loans to determine the necessity of recording provisions for loan losses to reflect a decrease in the value of the collateral underlying loans. We recorded $17.1 million in provisions for loan losses in Fiscal 2009. The provision was taken against 22 loans with an aggregate outstanding balance of $65.8 million. The provision taken in Fiscal 2009 includes a $2.3 million provision taken against a loan due to a fraud committed against us by our borrower. The fraud was reported by us to the appropriate authorities and the perpetrator has been indicted. In the prior fiscal year, we recorded provisions for loan losses of $15.3 million. The prior period's provisions were taken against nine loans with an aggregate outstanding balance of $71.3 million. The increase in the provisions year-over-year is due to the continuation of the credit crisis and acceleration of the decrease in real estate values.
Impairment Charges. For Fiscal 2009, the Trust recorded $1.3 million of impairment charges against its real estate portfolio. For Fiscal 2008, impairment charges of $1.1 million were taken against the real estate portfolio. Management analyzed the real estate portfolio and determined that the deterioration in the credit markets and the real estate markets where our properties are located made it necessary to write down the value of our properties to our estimate of current market value.
Foreclosure related professional fees. The decline is due to reduced legal fees and other expenses as many of the foreclosure actions pending in Fiscal 2008 came to a conclusion in such period and during Fiscal 2009 the number of foreclosure actions instituted in was at a reduced level.
33
Debt restructuring charges. Charges of $685,000 were recorded in Fiscal 2009. These charges include legal expenses and third party costs in connection with restructuring of our trust preferred securities. There was no comparable charge in the prior fiscal year.
General and Administrative. There were decreases in most general and administrative expense categories, including payroll and payroll related expenses, travel, advertising and promotion, and expenses allocated under the shared services agreement. However, these decreases were substantially offset by increases in auditing and internal control expenses and in professional fees related to the workout and establishment of the Newark Joint Venture.
Operating expenses relating to real estate properties. These expenses increased primarily due to operating expenses relating to our Newark Joint Venture which was entered into in June of 2009.
Amortization and depreciation. These expenses increased due to amortization and depreciation at four properties acquired in foreclosure proceedings during Fiscal 2009 and not classified as held for sale.
Other revenue and expense items
The following table sets forth a comparison of other revenue and expense items for Fiscal 2009 and 2008:
| |
Fiscal | |
|
||||||||||
|---|---|---|---|---|---|---|---|---|---|---|---|---|---|
| (Dollars in thousands) |
2009 | 2008 | Variance | % Change | |||||||||
Equity in earnings (loss) of unconsolidated ventures |
$ | (2,791 | ) | $ | 1,358 | $ | (4,149 | ) | (305.5 | )% | |||
Gain on sale of joint venture interest |
271 | — | 271 | — | |||||||||
Gain on sale of available-for-sale securities |
1,016 | 19,940 | (18,924 | ) | (94.9 | )% | |||||||
Gain on early extinguishment of debt |
6,443 | — | 6,443 | — | |||||||||
Equity in earnings of unconsolidated ventures. The decrease is primarily attributable to a loss incurred in our joint venture with the CIT Capital USA due to loan loss provisions. It also includes the write off of the balance of the unamortized fee, due to a change in estimate related to the remaining term of the agreement, paid by us to an investment banker for obtaining the capital from the CIT Capital USA, Inc. This venture was terminated in fiscal 2009. Seven other unconsolidated ventures contributed varying amounts to equity in earnings (losses) of unconsolidated joint ventures none of which is material. We sold our interest in four of these seven joint ventures in Fiscal 2009.
Gain on sale of available-for-sale securities. In Fiscal 2009, we sold 42,000 shares of Entertainment Properties Trust and other securities for a gain of $1.0 million. These securities with a cost basis of $1.7 million were sold for $2.7 million. In Fiscal 2008, we sold 493,511 shares of Entertainment Properties Trust for a gain of $19.9 million. These securities, with a cost basis of $6.5 million, were sold for $26.4 million.
Gain on early extinguishment of debt. In Fiscal 2009, we retired $15 million of face value of junior subordinated notes for an aggregate consideration of $7.9 million. We incurred legal fees of $47,000 and $318,000 of other fees and expenses related to the transaction. The carrying value of the securities at the time of redemption was $14.8 million, which included $329,000 of deferred fees. We recorded a gain of $6.4 million on the transaction.
Gain on sale of joint venture interests. In Fiscal 2009, we sold our interest in four joint ventures which owned properties in Connecticut. We received proceeds of $1,350,000 and recognized a gain on the sale of $271,000. There was no comparable transaction in Fiscal 2008.
34
Discontinued operations
The following table sets forth a comparison of discontinued operations for Fiscal 2009 and 2008:
| |
Fiscal | |
|
||||||||||
|---|---|---|---|---|---|---|---|---|---|---|---|---|---|
| (Dollars in thousands) |
2009 | 2008 | Variance | % Change | |||||||||
Loss from operations |
$ | (1,549 | ) | $ | (1,207 | ) | $ | (342 | ) | (28.3 | )% | ||
Impairment charges |
(29,774 | ) | (8,165 | ) | (21,609 | ) | (264.7 | )% | |||||
Gain on sale of real estate assets |
2,199 | 1,517 | 682 | 45.0 | % | ||||||||
Income (loss) from discontinued operations |
$ | (29,124 | ) | $ | (7,855 | ) | $ | (21,269 | ) | (270.8 | )% | ||
Loss from operations. The increase in the loss from operations is the result of the addition of the operations of several properties that we classified as held for sale.
Impairment charges. In Fiscal 2009, we took impairment charges of $29.8 million against 12 properties. In the prior fiscal year, we took impairment charges of $8.2 million against nine properties. Management analyzed the real estate portfolio and determined that the deterioration in the credit markets and the real estate markets where the Trust's properties are located made it necessary to write down the value of our properties to our estimate of current market values.
Gain on sale of real estate assets. In Fiscal 2009, we recognized a gain on the sale of real estate assets of $2.2 million on the sale of seven properties that were held for sale. This compares to a gain on the sale of real estate assets $1.5 million on the sale of six properties in Fiscal 2008.
Liquidity and Capital Resources
Liquidity is a measurement of our ability to meet cash requirements, including to fund loan originations, pay operating expenses, repay borrowings, and other general business needs. We require capital to fund loan originations and pay operating expenses, including operating expenses related to real estate properties owned and real estate properties held for sale. Apart from our cash at hand, our principal sources of liquidity have historically been our revolving credit facility, our margin lines of credit and cash flow from operating activities. We do not have a credit facility and there is no assurance that we will be able to obtain a credit facility on terms acceptable to us. Our current capital sources primarily consist of our cash on hand and marketable securities. Our total available liquidity at September 30, 2010 was approximately $68.8 million, including $58.5 million of cash and cash equivalents. From October 1, 2010 through December 1, 2010, we used capital to fund our operating losses and originated $24.5 million in mortgage loans and as a result, at December 1, 2010, our total available liquidity was approximately $43.5 million, including approximately $33.5 million of cash and cash equivalents.
We believe we have sufficient capital to meet our operating expenses in Fiscal 2011, including real estate operating expenses related to real estate acquired by us in foreclosure proceedings, and to fund any capital contributions required by the Newark Joint Venture. We also have funds available to engage in our primary lending business; however, because we are experiencing an increase in demand for bridge loans, our ability to originate loans is limited by our cash availability.
The Newark Joint Venture may borrow up to $8.6 million (of which $1.8 million had been borrowed at September 30, 2010) to fund specified development activities with respect to the Teachers Village project. While it is currently seeking up to $125 million in financing from public and private sources to fund the further development and construction of this project, no assurance can be given that the Newark Joint Venture will obtain the necessary financing on acceptable terms or if that such financing is obtained, that such project will be profitable for us.
Junior Subordinated Notes
On May 26, 2009, we entered into an exchange agreement pursuant to which an aggregate of $55 million of our statutory trusts' outstanding trust preferred securities were exchanged for an
35
aggregate of $58.3 million of newly issued unsecured junior subordinated notes. On September 29, 2009, we retired $15.9 million of these of unsecured junior subordinated notes in exchange for an aggregate consideration of $7.95 million. From May 1, 2009 through July 31, 2012, these notes bear interest at 3.5% per annum, to be paid annually in advance. From August 1, 2012 through April 28, 2016, the interest rate will be 8.37%, and commencing April 29, 2016, the interest rate will equal LIBOR plus 2.95%. As of September 30, 2010, $42.4 million of our unsecured junior subordinated notes were outstanding. The securities mature on April 30, 2036 and are redeemable at any time at our option.
Off Balance Sheet Arrangements
We are not a party to any off balance sheet arrangements.
Disclosure of Contractual Obligations
The following table sets forth as of September 30, 2010 our known contractual obligations:
| |
Payment due by Period | |||||||||||||||
|---|---|---|---|---|---|---|---|---|---|---|---|---|---|---|---|---|
| (Dollars in thousands) |
Less than 1 Year |
1 - 3 Years |
3 - 5 Years |
More than 5 Years |
Total | |||||||||||
Long-Term Debt Obligations |
$ | 1,470 | $ | 2,424 | $ | 3,156 | $ | 47,908 | $ | 54,957 | ||||||
Capital Lease Obligations |
— | — | — | — | — | |||||||||||
Operating Lease Obligation |
120 | 129 | 116 | 522 | 887 | |||||||||||
Purchase Obligations |
— | — | — | — | — | |||||||||||
Other Long-Term Liabilities Reflected on Company Balance Sheet Under GAAP |
— | — | — | — | — | |||||||||||
Total |
$ | 1,590 | $ | 2,553 | $ | 3,272 | $ | 48,430 | $ | 55,844 | ||||||
Significant Accounting Estimates and Critical Accounting Policies
Our significant accounting policies are more fully described in Note 1 to our consolidated financial statements. The preparation of financial statements and related disclosure in conformity with accounting principles generally accepted in the United States requires management to make certain judgments and estimates that affect the amounts reported in the consolidated financial statements and accompanying notes. Certain of our accounting policies are particularly important to understand our financial position and results of operations and require the application of significant judgments and estimates by our management; as a result they are subject to a degree of uncertainty. These significant accounting policies include the following:
Allowance for Possible Losses and Impairment Charges
We conduct a quarterly review of (i) each loan in our mortgage portfolio, including the real estate securing each loan, (ii) each of our real estate assets, and (iii) each real estate asset owned by our joint ventures. This review is conducted in order to determine if there is uncertainty that the borrower has sufficient funds to repay the loan or if indicators of impairment are present on the real estate.
In reviewing the value of the collateral underlying a loan and the real estate assets owned, whether by us or our joint ventures, if there is an indicator of impairment, we seek to arrive at the fair value of each piece of collateral and each real estate asset by using one or more valuation techniques, such as comparable sales, discounted cash flow analysis or replacement cost analysis. Determination of the fair value of the collateral securing a loan requires significant judgment, estimates and discretion by management. Our real estate assets (other than real estate held for sale) and our joint venture's real estate assets are evaluated for indicators of impairment using an undiscounted cash flow analysis. If the analysis suggests that the undiscounted cash flows to be generated by the property will be insufficient to recover the investment made by us or any joint venture, as the case may be, an impairment provision will be calculated based upon the excess of the carrying amount of the property over its fair value using
36
a discounted cash flow model. Real estate assets are valued at the lower of the recorded cost or estimated fair value, less the cost to sell. We do not obtain any third party appraisals regarding the value of the property securing loans made by us or our joint ventures, or the real estate assets owned by us or our joint ventures. Instead, we rely on our own "in-house" valuations. Any valuation allowances taken with respect to our loan portfolio or real estate assets reduces our net income, assets and shareholders' equity to the extent of the amount of the valuation allowance, but it will not affect our cash flow until such time as the property is sold. For Fiscal 2010, $3.17 million of loan loss provisions were recorded against our mortgage portfolio and $3.37 million of impairment charges were taken with respect to our real estate assets (including real estate properties held for sale).
Revenue Recognition
We recognize interest income and rental income on an accrual basis, unless we make a judgment that impairment of a loan or of real estate owned renders doubtful collection of interest or rent in accordance with the applicable loan documents or lease. In making a judgment as to the collectability of interest or rent, we consider, among other factors, the status of the loan or property, the borrower's or tenant's financial condition, payment history and anticipated events in the future. Income recognition is suspended for loans when, in the opinion of management, a full recovery of income and principal becomes doubtful. Income recognition is resumed when the loan becomes contractually current and continued performance is demonstrated. Accordingly, management must make a significant judgment as to whether to treat a loan or real estate owned as impaired. If we make a decision to treat a "problem" loan or real estate asset as not impaired and therefore continue to recognize the interest and rent as income on an accrual basis, we could overstate income by recognizing income that will not be collected and the uncollectible amount will ultimately have to be written off. The period in which the uncollectible amount is written off could adversely affect taxable income for a specific year.
Cash Distribution Policy
We have elected to be taxed as a REIT under the Internal Revenue Code of 1986, as amended, since our organization. To qualify as a REIT, we must meet a number of organizational and operational requirements, including a requirement that we distribute currently (within the time frames prescribed by the Code and the applicable regulations) to our shareholders at least 90% of our adjusted ordinary taxable income. It is the current intention of our management to maintain our REIT status. As a REIT, we generally will not be subject to corporate Federal income tax on taxable income we distribute currently in accordance with the Code and applicable regulations to shareholders. If we fail to qualify as a REIT in any taxable year, we will be subject to Federal income taxes at regular corporate rates and may not be able to qualify as a REIT for four subsequent tax years. Even if we qualify for Federal taxation as a REIT, we may be subject to certain state and local taxes on our income and to Federal income and excise taxes on undistributed taxable income, i.e., taxable income not distributed in the amounts and in the time frames prescribed by the Code and applicable regulations thereunder.
In December 2008, our board of trustees suspended the payment of regular quarterly dividends. Except for a special capital gain dividend of $1.15 per share paid on October 30, 2009, of which 10% of the total dividend amount was paid in cash and the balance in our common shares, no other dividend was paid in Fiscal 2009 and no dividend was paid in Fiscal 2010. At December 31, 2009, we had a net operating loss carry-forward of $61.4 million and we anticipate a taxable loss of approximately $10 million for calendar 2010. Since we can offset our future taxable income against our tax loss carry-forward until the earlier of 2029 or the tax loss carry-forward has been fully used, we do not expect to pay a dividend in calendar 2011 and it is unlikely that we will be required to pay a dividend for several years thereafter to maintain our REIT status. Although our board of trustees reviews the payment of dividends periodically, there is no expectation that a dividend will be paid in the 2011 calendar year and for several years thereafter.
37
Item 7A. Quantitative and Qualitative Disclosure About Market Risk.
Our primary component of market risk is interest rate sensitivity. Our interest income is subject to changes in interest rates. We seek to minimize these risks by originating loans that are indexed to the prime rate, with a stated minimum interest rate. At September 30, 2010, approximately 41% of our portfolio was comprised of variable rate loans tied primarily to the prime rate. Accordingly, changes in the prime interest rate would affect our net interest income. When determining interest rate sensitivity, we assume that any change in interest rates is immediate and that the interest rate sensitive assets and liabilities existing at the beginning of the period remain constant over the period being measured. We assessed the market risk for our variable rate mortgage receivables and believe that a one percent increase in interest rates would cause an increase in income before taxes of $124,000 and a one percent decline in interest rates would not cause an increase in income before taxes based on our loan portfolio as of September 30, 2010. In addition, we originate loans with short maturities and maintain a low leverage capital position. As of September 30, 2010, 72% of our loan portfolio was secured by properties located in the New York metropolitan area, and we are therefore subject to risks associated with the New York economy.
Item 8. Financial Statements and Supplementary Data.
The information required by this item appears in a separate section of this Report following Part IV.
Item 9. Changes in and Disagreements with Accountants on Accounting and Financial Disclosure.
None.
Item 9A. Controls and Procedures.
A review and evaluation was performed by our management, including our Chief Executive Officer (CEO) and Chief Financial Officer (CFO), of the effectiveness of the design and operation of our disclosure controls and procedures as of the end of the period covered by this Annual Report on Form 10-K. Based on that review and evaluation, the CEO and CFO have concluded that our current disclosure controls and procedures, as designed and implemented, were effective. There have been no significant changes in our internal controls or in other factors that could significantly affect our internal controls subsequent to the date of their evaluation. There were no significant material weaknesses identified in the course of such review and evaluation and, therefore, we took no corrective measures.
Management Report on Internal Control Over Financial Reporting
Our management is responsible for establishing and maintaining adequate internal control over financial reporting. Internal control over financial reporting is defined in Rules 13a-15(f) and 15d-15(f) promulgated under the Securities Exchange Act of 1934, as amended, as a process designed by, or under the supervision of, a company's principal executive and principal financial officers and effected by a company's board, management and other personnel to provide reasonable assurance regarding the reliability of financial reporting and the preparation of financial statements for external purposes in accordance with GAAP and includes those policies and procedures that:
- •
- pertain to the maintenance of records that in reasonable detail accurately and fairly reflect the transactions and
dispositions of the assets of a company;
- •
- provide reasonable assurance that transactions are recorded as necessary to permit preparation of financial statements in accordance with GAAP, and that receipts and expenditures of a company are being made only in accordance with authorizations of management and directors of a company; and
38
- •
- provide reasonable assurance regarding prevention or timely detection of unauthorized acquisition, use or disposition of a company's assets that could have a material effect on the financial transactions.
Because of its inherent limitations, internal control over financial reporting may not prevent or detect misstatements. Projections of any evaluation of effectiveness to future periods are subject to the risks that controls may become inadequate because of changes in conditions or that the degree of compliance with the policies or procedures may deteriorate.
Our management assessed the effectiveness of our internal control over financial reporting as of September 30, 2010. In making this assessment, our management used criteria set forth by the Committee of Sponsoring Organizations of the Treadway Commission (COSO) in Internal Control-Integrated Framework.
Based on its assessment, our management believes that, as of September 30, 2010, our internal control over financial reporting was effective based on those criteria.
Our independent auditors, Ernst & Young, LLP, have issued an audit report on the effectiveness of internal control over financial reporting. This report appears on page F-1 of this Annual Report on Form 10-K.
None.
39
Item 10. Directors, Executive Officers and Corporate Governance.
Apart from certain information concerning our executive officers which is set forth in Part I of this report, the other information required by Item 10 is incorporated herein by reference to the applicable information to be in the proxy statement to be filed for our 2011 Annual Meeting of Shareholders.
Item 11. Executive Compensation.
The information concerning our executive compensation required by Item 11 will be included in the proxy statement to be filed relating to our 2011 Annual Meeting of Shareholders and is incorporated herein by reference.
Item 12. Security Ownership of Certain Beneficial Owners and Management and Related Stockholder Matters.
The information concerning our beneficial owners required by Item 12 will be included in the proxy statement to be filed relating to our 2011 Annual Meeting of Shareholders and is incorporated herein by reference.
Item 13. Certain Relationships and Related Transactions.
The information concerning relationships and certain transactions required by Item 13 will be included in the proxy statement to be filed relating to our 2011 Annual Meeting of Shareholders and is incorporated herein by reference.
Item 14. Principal Accounting Fees and Services.
The information concerning our principal accounting fees required by Item 14 will be included in the proxy statement to be filed relating to our 2011 Annual Meeting of Shareholders and is incorporated herein by reference.
Item 15. Exhibits, Financial Statement Schedules.
- (a)
- 1.
- All
Financial Statements.
The response is submitted in a separate section of this report following Part IV.
- 2.
- Financial
Statement Schedules.
The response is submitted in a separate section of this report following Part IV.
- 3.
- Exhibits:
| Exhibit No. |
Title of Exhibits | ||
|---|---|---|---|
| 3.1 | Third Amended and Restated Declaration of Trust (incorporated by reference to Exhibit 3.1 to the Form 10-K of BRT Realty Trust for the year ended September 30, 2005). | ||
3.2 |
By-laws of BRT Realty Trust, formerly known as Berg Enterprise Realty Group (incorporated by reference to Exhibit 3.2 to the Form 10-K of BRT Realty Trust for the year ended September 30, 2005). |
||
40
| Exhibit No. |
Title of Exhibits | ||
|---|---|---|---|
| 3.3 | Amendment to By-laws, dated December 10, 2007 (incorporated by reference to Exhibit 3.1 to the Form 8-K of BRT Realty Trust filed December 11, 2007). | ||
4.1 |
Junior Subordinated Indenture, dated as of May 26, 2009, between BRT Realty Trust and the Bank of New York Mellon (incorporated by reference to Exhibit 4.1 to the Form 8-K of BRT Realty Trust filed June 1, 2009). |
||
10.1 |
Amended and Restated Advisory Agreement, effective as of January 1, 2007, between BRT Realty Trust and REIT Management Corp. (incorporated by reference to Exhibit 10.1 to the Form 8-K of BRT Realty Trust filed November 27, 2006). |
||
10.2 |
Shared Services Agreement, dated as of January 1, 2002, by and among Gould Investors L.P., BRT Realty Trust, One Liberty Properties, Inc., Majestic Property Management Corp., Majestic Property Affiliates, Inc. and REIT Management Corp. (incorporated by reference to Exhibit 10.2 in the Form 10-K filed December 11, 2008). |
||
10.3 |
Exchange Agreement, dated as of May 26, 2009, by and among BRT Realty Trust and Taberna Preferred Funding IV, Ltd., Taberna Preferred Funding V, Ltd., and Taberna Preferred Funding VI, Ltd. (incorporated by reference to Exhibit 10.1 to the Form 8-K of BRT Realty Trust filed June 1, 2009). |
||
10.4 |
Amended and Restated Limited Liability Company Operating Agreement by and among TRB Newark Assemblage LLC, TRB Newark TRS, LLC, RBH Capital, LLC and RBH Partners LLC (incorporated by reference to Exhibit 10.1 to the Form 8-K of BRT Realty Trust filed June 9, 2009). |
||
10.5 |
Form of Restricted Stock Award Agreement |
||
14.1 |
Revised Code of Business Conduct and Ethics of BRT Realty Trust, adopted June 12, 2006 (incorporated by reference to Exhibit 14.1 to the Form 8-K of BRT Realty Trust filed June 14, 2006). |
||
21.1 |
Subsidiaries |
||
23.1 |
Consent of Ernst & Young, LLP |
||
31.1 |
Certification of Chief Executive Officer pursuant to Section 302 of the Sarbanes-Oxley Act of 2002 (the "Act") |
||
31.2 |
Certification of Senior Vice President—Finance pursuant to Section 302 of the Act. |
||
31.3 |
Certification of Chief Financial Officer pursuant to Section 302 of the Act |
||
32.1 |
Certification of Chief Executive Officer pursuant to Section 906 of the Act |
||
32.2 |
Certification of Senior Vice President—Finance pursuant to Section 906 of the Act |
||
32.3 |
Certification of Chief Financial Officer pursuant to Section 906 of the Act |
||
- (b)
- Exhibits.
See Item 15(a)(3) above.
- (c)
- Financial Statements.
See Item 15(a)(2) above.
41
Pursuant to the requirements of Section 13 or 15(d) of the Securities Exchange Act of 1934, the Registrant has duly caused this report to be signed on its behalf by the undersigned thereunto duly authorized.
|
BRT REALTY TRUST | |||
Date: December 13, 2010 |
By: |
/s/ JEFFREY A. GOULD |
||
Pursuant to the requirements of the Securities Exchange Act of 1934, this report has been signed below by the following persons on behalf of the Registrant and in the capacity and on the dates indicated.
Signature
|
Title
|
Date
|
||
|---|---|---|---|---|
| /s/ FREDRIC H. GOULD Fredric H. Gould |
Chairman of the Board | December 13, 2010 | ||
/s/ JEFFREY A. GOULD Jeffrey A. Gould |
Chief Executive Officer, President and Trustee (Principal Executive Officer) |
December 13, 2010 |
||
/s/ KENNETH BERNSTEIN Kenneth Bernstein |
Trustee |
December 13, 2010 |
||
/s/ ALAN GINSBURG Alan Ginsburg |
Trustee |
December 13, 2010 |
||
/s/ LOUIS C. GRASSI Louis C. Grassi |
Trustee |
December 13, 2010 |
||
/s/ MATTHEW J. GOULD Matthew J. Gould |
Trustee |
December 13, 2010 |
||
/s/ GARY HURAND Gary Hurand |
Trustee |
December 13, 2010 |
||
/s/ JEFFREY RUBIN Jeffrey Rubin |
Trustee |
December 13, 2010 |
||
/s/ JONATHAN SIMON Jonathan Simon |
Trustee |
December 13, 2010 |
||
/s/ ELIE WEISS Elie Weiss |
Trustee |
December 13, 2010 |
||
/s/ GEORGE E. ZWEIER George E. Zweier |
Chief Financial Officer, Vice President (Principal Financial and Accounting Officer) |
December 13, 2010 |
42
Item 8, Item 15(a)(1) and (2)
Index to Consolidated Financial Statements and Consolidated Financial Statement Schedules
All other schedules are omitted because they are not applicable or the required information is shown in the consolidated financial statements or the notes thereto.
43
REPORT OF INDEPENDENT REGISTERED PUBLIC ACCOUNTING FIRM
The
Board of Trustees and Shareholders of
BRT Realty Trust and Subsidiaries
We have audited BRT Realty Trust and Subsidiaries' (the "Trust") internal control over financial reporting as of September 30, 2010, based on criteria established in Internal Control—Integrated Framework issued by the Committee of Sponsoring Organizations of the Treadway Commission (the COSO criteria). The Trust's management is responsible for maintaining effective internal control over financial reporting and for its assessment of the effectiveness of internal control over financial reporting included in the accompanying Item 9A. Controls and Procedures—Management Report on Internal Control Over Financial Reporting. Our responsibility is to express an opinion on the trust's internal control over financial reporting based on our audit.
We conducted our audit in accordance with the standards of the Public Company Accounting Oversight Board (United States). Those standards require that we plan and perform the audit to obtain reasonable assurance about whether effective internal control over financial reporting was maintained in all material respects. Our audit included obtaining an understanding of internal control over financial reporting, assessing the risk that a material weakness exists, testing and evaluating the design and operating effectiveness of internal control based on the assessed risk, and performing such other procedures as we considered necessary in the circumstances. We believe that our audit provides a reasonable basis for our opinion.
A company's internal control over financial reporting is a process designed to provide reasonable assurance regarding the reliability of financial reporting and the preparation of financial statements for external purposes in accordance with generally accepted accounting principles. A company's internal control over financial reporting includes those policies and procedures that (1) pertain to the maintenance of records that, in reasonable detail, accurately and fairly reflect the transactions and dispositions of the assets of the company; (2) provide reasonable assurance that transactions are recorded as necessary to permit preparation of financial statements in accordance with generally accepted accounting principles, and that receipts and expenditures of the company are being made only in accordance with authorizations of management and directors of the company; and (3) provide reasonable assurance regarding prevention or timely detection of unauthorized acquisition, use, or disposition of the company's assets that could have a material effect on the financial statements.
Because of its inherent limitations, internal control over financial reporting may not prevent or detect misstatements. Also, projections of any evaluation of effectiveness to future periods are subject to the risk that controls may become inadequate because of changes in conditions, or that the degree of compliance with the policies or procedures may deteriorate.
In our opinion, BRT Realty Trust and Subsidiaries maintained, in all material respects, effective internal control over financial reporting as of September 30, 2010, based on the COSO criteria.
We also have audited, in accordance with the standards of the Public Company Accounting Oversight Board (United States), the consolidated balance sheets of BRT Realty Trust and Subsidiaries as of September 30, 2010 and 2009, and the related consolidated statements of operations, equity, and cash flows for each of the three years in the period ended September 30, 2010 of the Trust and our report dated December 13, 2010 expressed an unqualified opinion thereon.
|
/s/ Ernst & Young LLP |
|
New York, New York |
F-1
REPORT OF INDEPENDENT REGISTERED PUBLIC ACCOUNTING FIRM
The
Board of Trustees and Shareholders of
BRT Realty Trust and Subsidiaries
We have audited the accompanying consolidated balance sheets of BRT Realty Trust and Subsidiaries (the "Trust") as of September 30, 2010 and 2009, and the related consolidated statements of operations, equity, and cash flows for each of the three years in the period ended September 30, 2010. Our audits also included the financial statement schedules listed in the Index at Item 15(a). These financial statements and schedules are the responsibility of the Trust's management. Our responsibility is to express an opinion on these financial statements and schedules based on our audits.
We conducted our audits in accordance with auditing standards of the Public Company Accounting Oversight Board (United States). Those standards require that we plan and perform the audit to obtain reasonable assurance about whether the financial statements are free of material misstatement. An audit includes examining, on a test basis, evidence supporting the amounts and disclosures in the financial statements. An audit also includes assessing the accounting principles used and significant estimates made by management, as well as evaluating the overall financial statement presentation. We believe that our audits provide a reasonable basis for our opinion.
In our opinion, the financial statements referred to above present fairly, in all material respects, the consolidated financial position of BRT Realty Trust and Subsidiaries at September 30, 2010 and 2009, and the consolidated results of their operations and their cash flows for each of the three years in the period ended September 30, 2010, in conformity with U.S. generally accepted accounting principles. Also, in our opinion, the related financial statement schedules, when considered in relation to the basic financial statements taken as a whole, present fairly in all material respects the information set forth therein.
As discussed in Note 1 to the financial statements, the Trust changed its method of accounting for non-controlling interests effective October 1, 2009.
We also have audited, in accordance with the standards of the Public Company Accounting Oversight Board (United States), BRT Realty Trust and Subsidiaries' internal control over financial reporting as of September 30, 2010, based on criteria established in Internal Control—Integrated Framework issued by the Committee of Sponsoring Organizations of the Treadway Commission and our report dated December 13, 2010 expressed an unqualified opinion thereon.
|
/s/ Ernst & Young LLP |
|
New York, New York |
F-2
BRT REALTY TRUST AND SUBSIDIARIES
Consolidated Balance Sheets
(Dollars in thousands, except per share amounts)
| |
September 30, | ||||||||
|---|---|---|---|---|---|---|---|---|---|
| |
2010 | 2009 | |||||||
ASSETS |
|||||||||
Real estate loans |
|||||||||
Earning interest |
$ | 17,263 | $ | 44,677 | |||||
Non-earning interest |
35,143 | 2,836 | |||||||
|
52,406 | 47,513 | |||||||
Deferred fee income |
(245 | ) | (44 | ) | |||||
Allowance for possible loan losses |
(3,165 | ) | (1,618 | ) | |||||
|
48,996 | 45,851 | |||||||
Purchase money mortgage loans |
5,340 | 16,804 | |||||||
Real estate loans held for sale |
— | 16,915 | |||||||
Real estate properties net of accumulated depreciation of $1,806 and $1,923 |
55,792 | 55,544 | |||||||
Investment in unconsolidated ventures at equity |
775 | 2,477 | |||||||
Cash and cash equivalents |
58,497 |
25,708 |
|||||||
Available-for-sale securities at market |
10,270 | 8,963 | |||||||
Real estate properties held for sale |
51 | 14,204 | |||||||
Other assets |
6,545 | 6,867 | |||||||
Total Assets |
$ | 186,266 | $ | 193,333 | |||||
LIABILITIES AND EQUITY |
|||||||||
Liabilities: |
|||||||||
Junior subordinated notes |
$ | 40,815 | $ | 40,234 | |||||
Mortgages payable |
12,557 | 9,460 | |||||||
Accounts payable and accrued liabilities |
1,332 | 2,149 | |||||||
Deposits payable |
1,723 | 1,965 | |||||||
Dividends payable |
— | 13,308 | |||||||
Total liabilities |
56,427 | 67,116 | |||||||
Commitments and contingencies |
— |
— |
|||||||
Equity: |
|||||||||
Preferred shares, $1 par value: |
|||||||||
Authorized 10,000 shares, none issued |
— | — | |||||||
Shares of beneficial interest, $3 par value: |
|||||||||
Authorized number of shares, unlimited, 15,148 and 12,711 issued |
45,445 | 38,133 | |||||||
Additional paid-in capital |
172,268 | 167,073 | |||||||
Accumulated other comprehensive income—net unrealized gain on available-for-sale securities |
1,594 | 2,711 | |||||||
Retained deficit |
(83,389 | ) | (75,374 | ) | |||||
Cost of 1,460 and 1,438 treasury shares of beneficial interest |
(11,364 | ) | (11,316 | ) | |||||
Total BRT Realty Trust Shareholders' Equity |
124,554 | 121,227 | |||||||
Non controlling interests |
5,285 | 4,990 | |||||||
Total Equity |
129,839 | 126,217 | |||||||
Total Liabilities and Equity |
$ | 186,266 | $ | 193,333 | |||||
See accompanying notes to consolidated financial statements.
F-3
BRT REALTY TRUST AND SUBSIDIARIES
Consolidated Statements of Operations
(Dollars in thousands, except per share amounts)
| |
Year Ended September 30, | ||||||||||
|---|---|---|---|---|---|---|---|---|---|---|---|
| |
2010 | 2009 | 2008 | ||||||||
Revenues: |
|||||||||||
Interest on real estate loans |
$ | 2,412 | $ | 8,577 | $ | 16,526 | |||||
Interest on purchase money mortgage loans |
1,212 | 246 | — | ||||||||
Loan fee income |
253 | 887 | 2,246 | ||||||||
Rental revenue from real estate properties |
3,422 | 1,718 | 1,452 | ||||||||
Recovery of previously provided allowance |
365 | — | — | ||||||||
Other, primarily investment income |
471 | 726 | 1,766 | ||||||||
Total revenues |
8,135 | 12,154 | 21,990 | ||||||||
Expenses: |
|||||||||||
Interest—borrowed funds |
1,773 | 4,435 | 6,644 | ||||||||
Advisor's fees, related party |
785 | 1,173 | 1,730 | ||||||||
Provision for loan loss |
3,165 | 17,110 | 15,260 | ||||||||
Impairment charges |
2,625 | 1,272 | 1,050 | ||||||||
Foreclosure related professional fees |
673 | 908 | 2,009 | ||||||||
Debt restructuring charges |
— | 685 | — | ||||||||
General and administrative—including $822, $1,002 and $1,039 to related party |
6,063 | 7,045 | 7,090 | ||||||||
Operating expenses relating to real estate properties including interest on mortgages payable of $650, $384 and $149 |
3,866 | 2,361 | 976 | ||||||||
Amortization and depreciation |
894 | 1,340 | 795 | ||||||||
Total expenses |
19,844 | 36,329 | 35,554 | ||||||||
Total revenues less total expenses |
(11,709 | ) | (24,175 | ) | (13,564 | ) | |||||
Equity in earnings (loss) of unconsolidated ventures |
196 |
(2,791 |
) |
1,358 |
|||||||
Gain on sale of joint venture interest |
— | 271 | — | ||||||||
Gain on sale of available-for-sale securities |
1,586 | 1,016 | 19,940 | ||||||||
Gain on early extinguishment of debt |
— | 6,443 | — | ||||||||
(Loss) income from continuing operations |
(9,927 | ) | (19,236 | ) | 7,734 | ||||||
Discontinued Operations: |
|||||||||||
Loss from operations |
(602 | ) | (1,549 | ) | (1,207 | ) | |||||
Impairment charges |
(745 | ) | (29,774 | ) | (8,165 | ) | |||||
Gain on sale of real estate assets |
1,937 | 2,199 | 1,517 | ||||||||
Income (loss) from discontinued operations |
590 | (29,124 | ) | (7,855 | ) | ||||||
Net loss |
(9,337 | ) | (48,360 | ) | (121 | ) | |||||
Less net loss (income) attributable to non controlling interests |
1,322 | 605 | (139 | ) | |||||||
Net loss attributable to common shareholders |
$ | (8,015 | ) | $ | (47,755 | ) | $ | (260 | ) | ||
Basic and Diluted per share amounts attributable to common shareholders: |
|||||||||||
(Loss) income from continuing operations |
$ | (.62 | ) | $ | (2.50 | ) | $ | .65 | |||
Income (loss) from discontinued operations |
.04 | (1.60 | ) | (.67 | ) | ||||||
Basic and Diluted loss per share |
$ | (.58 | ) | $ | (4.10 | ) | $ | (.02 | ) | ||
Amounts attributable to BRT Realty Trust: |
|||||||||||
(Loss) income from continuing operations |
$ | (8,605 | ) | $ | (18,631 | ) | $ | 7,595 | |||
Income (Loss) from discontinued operations |
590 | (29,124 | ) | (7,855 | ) | ||||||
Net loss |
$ | (8,015 | ) | $ | (47,755 | ) | $ | (260 | ) | ||
Weighted average number of common shares outstanding: |
|||||||||||
Basic and Diluted |
13,871,668 | 11,643,972 | 11,648,885 | ||||||||
See accompanying notes to consolidated financial statements.
F-4
BRT REALTY TRUST AND SUBSIDIARIES
Consolidated Statements of Equity
Years Ended September 30, 2010, 2009, and 2008
(Dollars in thousands, except share and per share data)
| |
Shares of Beneficial Interest |
Additional Paid-In Capital |
Accumulated Other Comprehensive Income |
Retained Earnings/ (Deficit) |
Treasury Shares |
Non Controlling Interests |
Total | |||||||||||||||
|---|---|---|---|---|---|---|---|---|---|---|---|---|---|---|---|---|---|---|---|---|---|---|
Balances, September 30, 2007 |
$ | 36,746 | $ | 160,162 | $ | 25,097 | $ | 23,191 | $ | (10,021 | ) | $ | 222 | $ | 235,397 | |||||||
Shares issued—dividend reinvestment and stock purchase plan (462,315 shares) |
1,387 |
5,584 |
— |
— |
— |
— |
6,971 |
|||||||||||||||
Distributions—common share ($3.19 per share) |
— | — | — | (37,242 | ) | — | — | (37,242 | ) | |||||||||||||
Exercise of stock options |
— | (1 | ) | — | — | 11 | — | 10 | ||||||||||||||
Restricted stock vesting |
— | (201 | ) | — | — | 201 | — | — | ||||||||||||||
Compensation expense—restricted stock |
— | 858 | — | — | — | — | 858 | |||||||||||||||
Distributions to non-controlling interests |
(240 | ) | (240 | ) | ||||||||||||||||||
Shares repurchased (67,334 shares) |
— | — | — | (769 | ) | (769 | ) | |||||||||||||||
Net loss |
— | — | — | (260 | ) | — | 139 | (121 | ) | |||||||||||||
Other comprehensive loss—net unrealized loss on available-for-sale securities (net of reclassification adjustment for gains of $18,588 included in net loss) |
— | — | (17,971 | ) | — | — | — | (17,971 | ) | |||||||||||||
Comprehensive loss |
— | — | — | — | — | — | (18,092 | ) | ||||||||||||||
Balances, September 30, 2008 |
38,133 | 166,402 | 7,126 | (14,311 | ) | (10,578 | ) | 121 | 186,893 | |||||||||||||
Distributions—common share ($1.15 per share) |
— |
— |
— |
(13,308 |
) |
— |
— |
(13,308 |
) |
|||||||||||||
Restricted stock vesting |
— | (205 | ) | — | — | 205 | — | — | ||||||||||||||
Compensation expense—restricted stock |
— | 876 | — | — | — | — | 876 | |||||||||||||||
Contributions from non-controlling interests |
— | — | — | — | — | 5,534 | 5,534 | |||||||||||||||
Distributions to non-controlling interests |
— | — | — | — | — | (60 | ) | (60 | ) | |||||||||||||
Shares repurchased (256,110 shares) |
— | — | — | — | (943 | ) | — | (943 | ) | |||||||||||||
Net loss |
— | — | — | (47,755 | ) | — | (605 | ) | (48,360 | ) | ||||||||||||
Other comprehensive loss—net unrealized loss on available-for-sale securities (net of reclassification adjustment for gains of $1,014 included in net loss) |
— | — | (4,415 | ) | — | — | — | (4,415 | ) | |||||||||||||
Comprehensive loss |
— | — | — | — | — | — | (52,775 | ) | ||||||||||||||
Balances, September 30, 2009 |
38,133 | 167,073 | 2,711 | (75,374 | ) | (11,316 | ) | 4,990 | 126,217 | |||||||||||||
Shares issued—stock dividend (2,437,352 shares) |
7,312 |
4,604 |
— |
— |
— |
— |
11,916 |
|||||||||||||||
Restricted stock vesting |
— | (242 | ) | — | — | 242 | — | — | ||||||||||||||
Compensation expense—restricted stock |
— | 833 | — | — | — | — | 833 | |||||||||||||||
Contributions from non-controlling interests |
— | — | — | — | — | 1,846 | 1,846 | |||||||||||||||
Distributions to non-controlling interests |
— | — | — | — | — | (229 | ) | (229 | ) | |||||||||||||
Shares repurchased (52,403 shares) |
— | — | — | — | (290 | ) | — | (290 | ) | |||||||||||||
Net loss |
— | — | — | (8,015 | ) | — | (1,322 | ) | (9,337 | ) | ||||||||||||
Other comprehensive loss—net unrealized loss on available-for-sale securities (net of reclassification adjustment for gains of $1,557 included in net loss) |
— | — | (1,117 | ) | — | — | — | (1,117 | ) | |||||||||||||
Comprehensive loss |
— | — | — | — | — | — | (10,454 | ) | ||||||||||||||
Balances, September 30, 2010 |
$ | 45,445 | $ | 172,268 | $ | 1,594 | $ | (83,389 | ) | $ | (11,364 | ) | $ | 5,285 | $ | 129,839 | ||||||
See accompanying notes to consolidated financial statements.
F-5
BRT REALTY TRUST AND SUBSIDIARIES
Consolidated Statements of Cash Flows
(Dollars in thousands)
| |
Year Ended September 30, | |||||||||||
|---|---|---|---|---|---|---|---|---|---|---|---|---|
| |
2010 | 2009 | 2008 | |||||||||
Cash flows from operating activities: |
||||||||||||
Net loss |
$ | (9,337 | ) | $ | (48,360 | ) | $ | (121 | ) | |||
Adjustments to reconcile net loss to net cash (used in) provided by operating activities: |
||||||||||||
Provision for loan loss |
3,165 | 17,110 | 15,260 | |||||||||
Recovery of previously provided allowances |
(365 | ) | — | — | ||||||||
Impairment charges |
3,370 | 31,046 | 9,215 | |||||||||
Amortization and depreciation |
927 | 1,686 | 1,506 | |||||||||
Amortization of deferred fee income |
(219 | ) | (897 | ) | (2,128 | ) | ||||||
Accretion of securities discount |
(69 | ) | (28 | ) | — | |||||||
Accretion of junior subordinated notes principal |
581 | 322 | — | |||||||||
Amortization of restricted stock |
833 | 876 | 858 | |||||||||
Net gain on sale of real estate assets from discontinued operations |
(1,937 | ) | (2,199 | ) | (1,517 | ) | ||||||
Net gain on sale of available-for-sale securities |
(1,586 | ) | (1,016 | ) | (19,940 | ) | ||||||
Equity in (earnings) loss of unconsolidated ventures |
(196 | ) | 2,791 | (1,358 | ) | |||||||
Gain on sale of joint venture interests |
— | (271 | ) | — | ||||||||
Gain on early extinguishment of debt |
— | (6,443 | ) | — | ||||||||
Distributions of earnings of unconsolidated ventures |
193 | 185 | 1,766 | |||||||||
Increases and decreases from changes in other assets and liabilities: |
||||||||||||
Increase in straight line rent |
(330 | ) | (16 | ) | (16 | ) | ||||||
Decrease in interest and dividends receivable |
398 | 754 | 1,291 | |||||||||
Decrease (increase) in prepaid expenses |
115 | (1,876 | ) | (159 | ) | |||||||
Decrease in accounts payable and accrued liabilities |
(960 | ) | (1,431 | ) | (1,353 | ) | ||||||
Increase in deferred costs |
— | — | (463 | ) | ||||||||
Other |
(297 | ) | 340 | 137 | ||||||||
Net cash (used in) provided by operating activities |
(5,714 | ) | (7,427 | ) | 2,978 | |||||||
Cash flows from investing activities: |
||||||||||||
Collections from real estate loans |
22,475 | 20,207 | 56,824 | |||||||||
Proceeds from the sale of loans |
16,815 | — | — | |||||||||
Loan loss recoveries |
227 | 2,417 | — | |||||||||
Additions to real estate loans |
(17,384 | ) | (12,704 | ) | (66,027 | ) | ||||||
Net costs capitalized to real estate owned |
(4,120 | ) | (4,721 | ) | (3,914 | ) | ||||||
Collections of loan fees |
419 | 557 | 2,144 | |||||||||
Additions to real estate |
— | (15,718 | ) | — | ||||||||
Proceeds from sale of real estate owned |
15,930 | 25,152 | 36,398 | |||||||||
Purchase of available-for-sale securities |
(4,194 | ) | (4,520 | ) | — | |||||||
Proceeds from sale of available-for-sale securities |
3,425 | 2,668 | 26,423 | |||||||||
Proceeds from maturity of held-to-maturity security |
1,000 | — | — | |||||||||
Contributions to unconsolidated ventures |
— | (781 | ) | (1,076 | ) | |||||||
Proceeds from the sale of joint venture interests |
— | 1,350 | — | |||||||||
Distributions of capital of unconsolidated ventures |
1,701 | 4,111 | 4,413 | |||||||||
Net cash provided by investing activities |
36,294 | 18,018 | 55,185 | |||||||||
Cash flows from financing activities: |
||||||||||||
Proceeds from borrowed funds |
— | 6,000 | 66,000 | |||||||||
Repayment of borrowed funds |
— | (9,000 | ) | (83,000 | ) | |||||||
Increase in mortgage payable |
3,202 | 5,131 | — | |||||||||
Mortgage principal payments |
(105 | ) | (86 | ) | (80 | ) | ||||||
Repayment of subordinated debt |
— | (8,316 | ) | — | ||||||||
Capital contributions from non controlling interests |
1,846 | 3,117 | — | |||||||||
Capital distributions to non controlling interests |
(229 | ) | — | — | ||||||||
Exercise of stock options |
— | — | 10 | |||||||||
Cash distribution—common shares |
(1,334 | ) | (15,564 | ) | (28,633 | ) | ||||||
Payment of stock issuance costs |
(60 | ) | — | — | ||||||||
Issuance of shares- dividend reinvestment and stock purchase plan |
— | — | 6,971 | |||||||||
Increase in deferred mortgage costs |
(821 | ) | (987 | ) | — | |||||||
Repurchase of shares |
(290 | ) | (943 | ) | (769 | ) | ||||||
Net cash provided by (used in) financing activities |
2,209 | (20,648 | ) | (39,501 | ) | |||||||
Net increase (decrease) in cash and cash equivalents |
32,789 | (10,057 | ) | 18,662 | ||||||||
Cash and cash equivalents at beginning of year |
25,708 | 35,765 | 17,103 | |||||||||
Cash and cash equivalents at end of year |
$ | 58,497 | $ | 25,708 | $ | 35,765 | ||||||
F-6
BRT REALTY TRUST AND SUBSIDIARIES
Consolidated Statements of Cash Flows (Continued)
(Dollars in thousands)
| |
Year Ended September 30, | ||||||||||
|---|---|---|---|---|---|---|---|---|---|---|---|
| |
2010 | 2009 | 2008 | ||||||||
Supplemental disclosures of cash flow information: |
|||||||||||
Cash paid during the year for interest expense, including capitalized interest of $328 in 2010 |
$ | 2,120 | $ | 5,841 | $ | 6,196 | |||||
Cash paid during the year for income and excise taxes |
$ | 17 | $ | 145 | $ | 1,070 | |||||
Non cash investing and financing activity: |
|||||||||||
Common stock dividend—portion paid in the Trust's common shares |
$ | 11,916 | — | — | |||||||
Reclassification of loans to real estate and real estate held for sale upon foreclosure |
— | $ | 43,329 | $ | 104,828 | ||||||
Accrued distributions |
— | $ | 13,308 | $ | 15,565 | ||||||
Junior subordinated notes redeemed to cancel statutory trust common securities |
— | $ | 1,702 | $ | — | ||||||
Seller financing provided for sale of real estate |
— | $ | 17,777 | $ | — | ||||||
Reclassification of real estate properties to/from real estate held for sale |
$ | 8,552 | $ | 6,801 | $ | 7,118 | |||||
Assumption of mortgages of consolidated joint venture |
— | $ | 2,100 | $ | — | ||||||
Reclassification of real estate loans to real estate loans held for sale |
— | $ | 16,915 | $ | — | ||||||
See accompanying notes to consolidated financial statements.
F-7
BRT REALTY TRUST AND SUBSIDIARIES
Notes to Consolidated Financial Statements
September 30, 2010
NOTE 1—ORGANIZATION, BACKGROUND AND SIGNIFICANT ACCOUNTING POLICIES
Organization and Background
BRT Realty Trust is a real estate investment trust organized as a business trust in 1972 under the laws of the Commonwealth of Massachusetts. Our primary business is and has been for over twenty five years, to originate and hold for investment short-term senior and junior commercial mortgage loans secured by real property in the United States. Our objective is to provide our shareholders with returns over time, including quarterly cash distributions and capital appreciation, by originating mortgage loans secured by a diversified portfolio of real property. Due to the credit crisis and the economic recession, our business focus, from late 2008 through a significant portion of 2010, shifted emphasis from the origination of loans to servicing our loan portfolio, workout activities, including pursuing foreclosure actions, acquiring the underlying properties in foreclosure proceedings, supervising the operations of real estate assets and selling real estate assets acquired in foreclosure proceedings. As we have resolved a substantial portion of the problems in our loan portfolio, we began, in the second half of Fiscal 2010, to shift our emphasis back to our primary lending business.
Principles of Consolidation; Basis of Preparation
Certain items on the consolidated financial statements for the preceding periods have been reclassified in the accompanying consolidated financial statements to conform to the current year's presentation, primarily to reclassify properties which were sold during the current fiscal year to real estate properties held for sale and to reclassify the operations of these properties to discontinued operations.
The consolidated financial statements include the accounts and operations of BRT Realty Trust, its wholly owned subsidiaries, and its majority-owned or controlled real estate entities and its interests in variable interest entities in which it is the primary beneficiary. Material intercompany items and transactions have been eliminated. BRT Realty Trust and its subsidiaries are hereinafter referred to as "BRT" or the "Trust."
With respect to its unconsolidated joint ventures, as (i) the Trust is primarily the managing member but does not exercise substantial operating control over these entities or the Trust is not the managing member and (ii) such entities are not variable-interest entities, the Trust has determined that such joint ventures should be accounted for under the equity method of accounting for financial statement purposes.
RBH-TRB Newark Holdings LLC was determined to be a Variable Interest Entity ("VIE") because the Trust has disproportionately few voting rights as compared with its obligations to absorb expected losses or rights to receive expected residual returns. The Trust was determined to be the primary beneficiary as it is expected to absorb a majority of the VIE's expected losses. For these reasons, the Trust has consolidated the operations of this VIE in the Trust's consolidated financial statements.
Income Tax Status
The Trust qualifies as a real estate investment trust under Sections 856-860 of the Internal Revenue Code of 1986, as amended. The Trustees may, at their option, elect to operate the Trust as a business trust not qualifying as a real estate investment trust.
F-8
BRT REALTY TRUST AND SUBSIDIARIES
Notes to Consolidated Financial Statements (Continued)
September 30, 2010
NOTE 1—ORGANIZATION, BACKGROUND AND SIGNIFICANT ACCOUNTING POLICIES (Continued)
Income Recognition
Income and expenses are recorded on the accrual basis of accounting for financial reporting purposes. The Trust does not accrue interest on impaired loans where, in the judgment of management, collection of interest according to the contractual terms of the loan documents is considered doubtful. Among the factors the Trust considers in making an evaluation of the amount of interest that is collectable, are the financial condition of the borrower, the status of the underlying collateral and anticipated future events. The Trust accrues interest on performing impaired loans and records cash receipts as a reduction of interest receivable. For impaired non-accrual loans, interest is recognized on a cash basis. The Trust will resume the accrual of interest if it determines the collection of interest according to the contractual terms of the loan is probable.
Loan commitment and extension fee income on loans held in our portfolio is deferred and recorded as loan fee income over the life of the commitment and loan. Commitment fees are generally non-refundable. When a commitment expires or the Trust no longer has any other obligation to perform, the remaining fee is recognized into income.
Rental revenue from real estate properties includes the base rent that each tenant is required to pay in accordance with the terms of their respective leases reported on a straight line basis over the initial term of the lease.
The basis on which cost was determined in computing the realized gain or loss on available-for-sale securities is average historical cost.
Allowance for Possible Losses
A loan evaluated for impairment is deemed to be impaired when based on current information and events, it is probable, in the judgment of management, that the Trust will not be able to collect all amounts due according to the contractual terms of the loan documents. When making this evaluation numerous factors are considered, as appropriate, including, market evaluations of the underlying collateral, estimated operating cash flow from the property during the projected holding period, and estimated sales value computed by applying an estimated capitalization rate to the projected stabilized net operating income of the specific property, less selling costs, discounted at market discount rates. If upon completion of the evaluation, the value of the collateral securing the loan is less than the recorded investment in the loan, an allowance is created with a corresponding charge to expense. The fair values related to the collateral securing impaired loans based on discounted cash flow models are considered to be level 3 valuations within the fair value hierarchy. When the Trust acquires title to the property, the loan loss allowance is adjusted by charging off all amounts related to the loan and recording the property at its adjusted carrying value.
Real Estate Properties and Real Estate Properties Held For Sale
Real estate properties, shown net of accumulated depreciation, is comprised primarily of real property acquired by foreclosure proceedings.
F-9
BRT REALTY TRUST AND SUBSIDIARIES
Notes to Consolidated Financial Statements (Continued)
September 30, 2010
NOTE 1—ORGANIZATION, BACKGROUND AND SIGNIFICANT ACCOUNTING POLICIES (Continued)
When real estate is acquired by foreclosure proceedings, it is recorded at the lower of the recorded investment of the loan or estimated fair value of the property at the time of foreclosure or delivery of a deed in lieu of foreclosure. The recorded investment is the face amount of the loan that has been decreased by any deferred fees, loan loss allowances and any valuation adjustments. Real estate assets, including assets acquired by foreclosure proceedings, that are operated for the production of income are depreciated over their estimated useful lives. Costs incurred in connection with the foreclosure of the properties collateralizing the real estate loans are expensed as incurred.
Real estate is classified as held for sale when management has determined that it has met the appropriate criteria in ASC 360. Properties which are held for sale are not depreciated and their operations are shown in discontinued operations. Real estate assets that are expected to be disposed of are valued at the lower of their carrying amount or their fair value less costs to sell on an individual asset basis.
The Trust accounts for the sale of real estate when title passes to the buyer, sufficient equity payments have been received, there is no continuing involvement by the Trust and there is reasonable assurance that the remaining receivable, if any, will be collected.
Real Estate Asset Impairments
The Trust reviews each real estate asset owned, including investments in real estate ventures to determine if there are indicators of impairment. If they are present, we determine whether the carrying amount of the asset can be recovered. Recognition of impairment is required if the undiscounted cash flows estimated to be generated by the assets are less than the assets' carrying amount. Measurement of impairment is based upon the estimated fair value of the asset. Upon evaluating a property, many factors are considered, including estimated current and expected operating cash flow from the property during the projected holding period, costs necessary to extend the life or improve the asset, expected capitalization rates, projected stabilized net operating income, selling costs, and the ability to hold and dispose of such real estate owned in the ordinary course of business. Valuation adjustments may be necessary in the event that effective interest rates, rent-up periods, future economic conditions, and other relevant factors vary significantly from those assumed in valuing the property. If future evaluations result in a diminution in the value of the property, the reduction will be recognized as an impairment charge. The fair values related to the impaired real estate are considered to be a level 3 valuation within the fair value hierarchy.
Fixed Asset Capitalization
A variety of costs may be incurred in the development of our properties. After determination is made to capitalize a cost, it is allocated to the specific project that is benefited. The costs of land and building under development include specifically identifiable costs. The capitalized costs include pre-construction costs essential to the development of the property, development costs, construction costs, interest costs, real estate taxes, and other costs incurred during the period of development. We consider a construction project as substantially completed when it is available for occupancy, but no later than one year from cessation of major construction activity. We cease capitalization when the project is available for occupancy
F-10
BRT REALTY TRUST AND SUBSIDIARIES
Notes to Consolidated Financial Statements (Continued)
September 30, 2010
NOTE 1—ORGANIZATION, BACKGROUND AND SIGNIFICANT ACCOUNTING POLICIES (Continued)
Investments in Unconsolidated Ventures at Equity
Investments in ventures in which the Trust does not have the ability to exercise operational or financial control, are accounted for using the equity method. Accordingly, the Trust reports its pro rata share of net profits and losses from its investments in unconsolidated ventures in the accompanying consolidated financial statements.
Equity Based Compensation
The Trust's compensation expense for restricted stock awards is amortized over the vesting period of such awards, based upon the estimated fair value of such restricted stock at the grant date.
Per Share Data
Basic earnings (loss) per share was determined by dividing net income (loss) applicable to common shareholders for each year by the weighted average number of shares of beneficial interest outstanding during each year. Diluted earnings (loss) per share reflects the potential dilution that could occur if securities or other contracts to issue shares of beneficial interest were exercised or converted into shares of beneficial interest or resulted in the issuance of shares of beneficial interest that then shared in the earnings (loss) of the Trust. Diluted earnings (loss) per share was determined by dividing net income (loss) applicable to common shareholders for each year by the total of the weighted average number of shares of beneficial interest outstanding plus the dilutive effect of the Trust's unvested restricted stock and outstanding options using the treasury stock method.
Cash Equivalents
Cash equivalents consist of highly liquid investments, primarily direct United States treasury obligations with maturities of three months or less when purchased.
Use of Estimates
The preparation of the financial statements in conformity with accounting principles generally accepted in the United States requires management to make estimates and assumptions that affect the amounts reported in the financial statements and accompanying notes. Actual results could differ from those estimates.
Segment Reporting
Management has determined that it operates in two reportable segments: a loan and investment segment and a real estate segment. Our loan segment includes all activities related to the origination and servicing of our loan portfolio and other investments and our real estate segment includes all activities related to the operation and disposition of our real estate assets. These two lines of business require different support infrastructures.
F-11
BRT REALTY TRUST AND SUBSIDIARIES
Notes to Consolidated Financial Statements (Continued)
September 30, 2010
NOTE 1—ORGANIZATION, BACKGROUND AND SIGNIFICANT ACCOUNTING POLICIES (Continued)
New Accounting Pronouncements
In December 2007, the Financial Accounting Standards Board ("FASB") issued updated guidance, which applies to all transactions or events in which an entity obtains control of one or more businesses. This guidance establishes the acquisition-date fair value as the measurement objective for all assets acquired and liabilities assumed, (ii) requires expensing of most transaction costs, and (iii) requires the acquirer to disclose to investors and other users all of the information needed to evaluate and understand the nature and financial effect of the business combination. The Trust adopted this guidance on October 1, 2009. The impact of adopting this guidance on the Trust's consolidated financial statements is the requirement to expense most transaction costs relating to its future acquisition activities.
In December 2007, the FASB issued updated guidance which requires non-controlling interests in a consolidated subsidiary to be displayed in the consolidated balance sheet as a separate component of equity. Consolidated net income and consolidated comprehensive income shall be adjusted to include the net income attributable to the non controlling interests. The Trust adopted this guidance on October 1, 2009. The impact of adopting this guidance on the consolidated financial statements is limited to the presentation of non controlling interests and prior period amounts were retrospectively adjusted to reflect this adoption.
In February 2008, the FASB issued updated guidance which deferred the effective date of previous guidance issued regarding the fair value of non-financial assets and liabilities, except for items that are recognized or disclosed at fair value in the financial statements on a recurring basis, until fiscal years beginning after November 15, 2008. The Trust adopted this guidance on October 1, 2009. As the Trust's presentation was consistent with this guidance, there has been no impact to the Trust's consolidated financial statements.
In June 2008, the FASB issued updated guidance which states that unvested share-based payment awards that contain non-forfeitable rights to dividends or dividend equivalents (whether paid or unpaid) are participating securities and shall be included in the computation of earnings per share. The Trust adopted this guidance on October 1, 2009. As the Trust's presentation was consistent with this guidance, there has been no impact to the Trust's consolidated financial statements.
In June 2009, the FASB issued updated guidance to amend various components of the guidance regarding sale accounting related to financial assets, including the recognition of assets obtained and liabilities assumed as a result of a transfer, and considerations of effective control by a transferor over transferred assets. In addition, this guidance removes the exemption for qualifying special purpose entities from the previous guidance. This guidance is effective for the first annual reporting period that begins after November 15, 2009, with early adoption prohibited. While the Trust is currently evaluating the effect of the adoption of this guidance, the Trust believes the adoption will not have a material impact on the consolidated financial statements.
In June 2009, the FASB issued updated guidance, which amends guidance for determining whether an entity is a variable interest entity, or VIE, and requires the performance of a qualitative rather than a quantitative analysis to determine the primary beneficiary of a VIE. Under this guidance, an entity would be required to consolidate a VIE if it has (i) the power to direct the activities that most
F-12
BRT REALTY TRUST AND SUBSIDIARIES
Notes to Consolidated Financial Statements (Continued)
September 30, 2010
NOTE 1—ORGANIZATION, BACKGROUND AND SIGNIFICANT ACCOUNTING POLICIES (Continued)
significantly impact the entity's economic performance and (ii) the obligation to absorb losses of the VIE or the right to receive benefits from the VIE that could be significant to the VIE. This guidance is effective for the first annual reporting period that begins after November 15, 2009, with early adoption prohibited. The Trust is currently evaluating the effect of adopting this guidance.
In January 2010 the FASB issued Accounting Standards Update 2010-06, Fair Value Measurements and Disclosures, (Topic 820): Improving Disclosures about Fair Value Measurements ("ASU 2010-06"). ASU 2010-06 requires a number of additional disclosures regarding fair value measurements, including the amount of transfers between Level 1 and 2 of the fair value hierarchy, the reasons for transfers in or out of Level 3 of the fair value hierarchy and activity for recurring Level 3 measures. In addition, the amendments clarify certain existing disclosure requirements related to the level at which fair value disclosures should be disaggregated and the requirement to provide disclosures about the valuation techniques and inputs used in determining the fair value of assets or liabilities classified as Level 2 or 3. ASU 2010-06 was effective January 1, 2010, except for the disclosures about purchases, sales, issuances and settlements in the roll forward of activity in Level 3 fair value measurements. Those disclosures are effective for the Trust on January 1, 2011 and early adoption is permitted. There were no transfers between Level 1 and 2 of the fair value hierarchy during the fiscal year ended September 30, 2010. The adoption did not have a material effect on the Company's consolidated financial condition, results of operations, or cash flows. See Note 14 for the related disclosures
NOTE 2—REAL ESTATE LOANS AND PURCHASE MONEY MORTGAGES
At September 30, 2010, information as to real estate loans and purchase money mortgages, all of which are first mortgage loans, is summarized as follows (dollars in thousands):
| |
Earning Interest |
Non-Earning Interest |
Total | Allowance For Possible Losses |
Real Estate Loans, Net |
|||||||||||||
|---|---|---|---|---|---|---|---|---|---|---|---|---|---|---|---|---|---|---|
Real Estate Loans: |
||||||||||||||||||
Condominium units (existing multi-family) |
— | $ | 8,488 | $ | 8,488 | — | $ | 8,488 | ||||||||||
Vacant loft building with retail |
— | 26,075 | 26,075 | $ | (2,985 | ) | 23,090 | |||||||||||
Multi-family residential |
$ | 14,097 | 580 | 14,677 | (180 | ) | 14,497 | |||||||||||
Retail |
3,166 | — | 3,166 | — | 3,166 | |||||||||||||
|
17,263 | 35,143 | 52,406 | (3,165 | ) | 49,241 | ||||||||||||
Deferred fee income |
(159 | ) | (86 | ) | (245 | ) | (245 | ) | ||||||||||
Real estate loans, net |
17,104 | 35,057 | 52,161 | (3,165 | ) | 48,996 | ||||||||||||
Purchase money mortgage loans: |
||||||||||||||||||
Multi-family residential |
5,340 | — | 5,340 | — | 5,340 | |||||||||||||
Real estate and purchase money mortgage loans, net |
$ | 22,444 | $ | 35,057 | $ | 57,501 | $ | (3,165 | ) | $ | 54,336 | |||||||
F-13
BRT REALTY TRUST AND SUBSIDIARIES
Notes to Consolidated Financial Statements (Continued)
September 30, 2010
NOTE 2—REAL ESTATE LOANS AND PURCHASE MONEY MORTGAGES (Continued)
The allowance for possible losses recorded in 2010 represent level 3 valuations within the valuation hierarchy established by current accounting guidance and for the vacant loft building was determined utilizing a development model that estimated construction costs and projected sales prices based on comparable sales in the market and for the multi-family residential property was determined using sales comparables of properties in the market similar to the collateral.
At September 30, 2010, three non-performing loans were outstanding to three separate borrowers, having an aggregate principal balance of $35,143,000 before loan loss allowances of $3,165,000, and which represented 60.9% of gross loans and 18.9% of total assets. Information as to the non-performing loans at September 30, 2010 is summarized as follows (dollars in thousands):
Location
|
Brooklyn, NY* | New York, NY | New York, NY | |||
|---|---|---|---|---|---|---|
Principal Balance |
$8,488 | $580 | $26,075 | |||
Accrued Interest |
— | — | — | |||
Cross collateral or cross default provision |
No | No | No | |||
Secured |
Yes | Yes | Yes | |||
Security |
Condominium Units | Vacant multi-family building | Vacant loft building with retail | |||
Recourse/ non recourse |
Recourse | Recourse | Recourse | |||
Impaired |
No | Yes | Yes | |||
Allowance for possible losses |
$— | $180 | $2,985 | |||
Collateral Dependent |
Yes | Yes | Yes | |||
Origination date |
October 2008 | March 2008 | August 2006 |
- *
- Represents a pari passu interest in a loan with a principal balance of $16,976.
A summary of the changes in non-earning loans before allowance for possible losses of $3,165,000 and $1,618,000 for the years ended September 30, 2010 and 2009 respectively, is as follows (dollars in thousands):
| |
2010 | 2009 | |||||
|---|---|---|---|---|---|---|---|
Beginning principal balance |
$ | 2,836 | $ | 18,407 | |||
Additions |
34,563 |
68,184 |
|||||
Protective advances |
— | 93 | |||||
Total additions |
34,563 | 68,277 | |||||
Payoffs and paydowns |
(2,256 |
) |
(883 |
) |
|||
Reclassified to performing |
— | (1,250 | ) | ||||
Reclassified to real estate loans held for sale |
— | (22,967 | ) | ||||
Transferred to owned real estate |
— | (56,448 | ) | ||||
Direct charge off |
— | (2,300 | ) | ||||
Total reductions |
(2,256 | ) | (83,848 | ) | |||
Ending principal balance |
$ | 35,143 | $ | 2,836 | |||
F-14
BRT REALTY TRUST AND SUBSIDIARIES
Notes to Consolidated Financial Statements (Continued)
September 30, 2010
NOTE 2—REAL ESTATE LOANS AND PURCHASE MONEY MORTGAGES (Continued)
At September 30, 2010 and 2009, no earning loans were deemed impaired and accordingly no loan loss allowances have been established against our earning portfolio. During the years ended September 30, 2010, 2009 and 2008, respectively, an average of $23,526,000, $34,932,000 and $37,036,000 respectively, of real estate loans were deemed impaired, and no interest income was recognized in any period.
At September 30, 2009 information as to real estate loans (excluding loans held for sale) and purchase money mortgages, all of which are first mortgage loans, is summarized as follows (dollars in thousands):
| |
Earning Interest |
Non-Earning Interest |
Total | Allowance For Possible Losses |
Real Estate Loans, Net |
|||||||||||||
|---|---|---|---|---|---|---|---|---|---|---|---|---|---|---|---|---|---|---|
Real Estate Loans: |
||||||||||||||||||
Condominium units (existing multi-family) |
$ | 8,488 | — | $ | 8,488 | — | $ | 8,488 | ||||||||||
Vacant loft building with retail |
26,075 | — | 26,075 | — | 26,075 | |||||||||||||
Multi-family residential |
2,066 | 2,836 | 4,902 | (1,618 | ) | 3,284 | ||||||||||||
Hotel condominium units |
1,650 | — | 1,650 | — | 1,650 | |||||||||||||
Land |
6,390 | — | 6,390 | — | 6,390 | |||||||||||||
Residential |
8 | — | 8 | — | 8 | |||||||||||||
|
44,677 | 2,836 | 47,513 | (1,618 | ) | 45,895 | ||||||||||||
Deferred fee income |
(44 | ) | — | (44 | ) | — | (44 | ) | ||||||||||
Real estate loans, net |
44,633 | 2,836 | 47,469 | (1,618 | ) | 45,851 | ||||||||||||
Purchase money mortgage loans |
||||||||||||||||||
Multi-family residential |
16,804 | — | 16,804 | — | 16,804 | |||||||||||||
Real estate and purchase money mortgage loans, net |
$ | 61,437 | $ | 2,836 | $ | 64,273 | $ | (1,618 | ) | $ | 62,655 | |||||||
Loans originated by the Trust generally provide for interest rates indexed to the prime rate. However in 2010 and 2009, in response to the financial crisis, we provided fixed rate financing on loan extensions and workouts and in 2009 the Trust provided fixed rate financing to facilitate the sale of real estate that it owned.
At September 30, 2010, one borrower had a loan outstanding in excess of 5% of the total assets of the Trust. This loan, which is secured by a vacant loft building with retail in New York, has an outstanding principal balance of $26,075,000 and is currently non performing. This loan represents 14% of the Trust's assets and 45% of the Trust's loan portfolio. No other borrower or single loan accounted for more than 16% of the Trust's loan portfolio or 5% of the Trust's assets at September 30, 2010.
The Trust's portfolio consists of senior mortgage loans, secured by residential and commercial property, 70% of which are located in New York, 16% in Michigan, 7% in Florida and 7% in three other states.
F-15
BRT REALTY TRUST AND SUBSIDIARIES
Notes to Consolidated Financial Statements (Continued)
September 30, 2010
NOTE 2—REAL ESTATE LOANS AND PURCHASE MONEY MORTGAGES (Continued)
Annual maturities of real estate loans and purchase money mortgages before allowances for possible losses during the next five years and thereafter are summarized as follows (dollars in thousands):
Year Ending September 30,
|
Amount | |||
|---|---|---|---|---|
2011(a) |
$ | 52,701 | ||
2012 |
5,045 | |||
2013 and thereafter |
— | |||
Total |
$ | 57,746 | ||
- (a)
- includes $35,143 of non earning loans which are due on demand.
If a loan is not repaid at maturity, the Trust may either extend the loan or may commence foreclosure proceedings. The Trust analyzes each loan separately to determine the appropriate course of action. In analyzing each situation, management examines various aspects of the loan receivable, including the value of the collateral, the financial strength of the borrower, past payment history and plans of the owner of the property. Of the $47,512,000 of real estate loans receivable that were scheduled to mature in fiscal 2010, $2,066,000 were extended, $8,048,000 were paid off, and $37,398,000 were foreclosed upon or are currently in foreclosure.
At September 30, 2010, the three largest real estate loans had principal balances outstanding of approximately $26,075,000, $9,000,000 and $8,488,000 prior to loan loss allowances. Of the total interest and fees earned on our loan portfolio during the year ended September 30, 2010, 2.6%, 17.8% and 14.4% related to these loans, respectively.
NOTE 3—ALLOWANCE FOR POSSIBLE LOAN LOSSES
The following is an analysis of the allowance for possible loan losses (dollars in thousands):
| |
Year Ended September 30, | |||||||||
|---|---|---|---|---|---|---|---|---|---|---|
| |
2010 | 2009 | 2008 | |||||||
Balance at beginning of year |
$ | 1,618 | $ | 6,710 | $ | 8,917 | ||||
Provision for loan loss |
3,165 | 17,110 | 15,260 | |||||||
Recovery of previously provided allowance |
(365 | ) | — | — | ||||||
Charge-offs |
(1,480 | ) | (24,619 | ) | (17,467 | ) | ||||
Recoveries |
227 | 2,417 | — | |||||||
Balance at end of year |
$ | 3,165 | $ | 1,618 | $ | 6,710 | ||||
The allowance for possible losses applies to two loans aggregating $26,655,000 at September 30, 2010, one loan aggregating $2,256,000 at September 30, 2009 and four loans aggregating $17,753,000 at September 30, 2008.
F-16
BRT REALTY TRUST AND SUBSIDIARIES
Notes to Consolidated Financial Statements (Continued)
September 30, 2010
NOTE 4—REAL ESTATE PROPERTIES
A summary of real estate properties for the year ended September 30, 2010 is as follows (dollars in thousands):
| |
September 30, 2009 Balance |
Costs Capitalized |
Depreciation, Amortization and Paydowns |
Impairment Charges |
September 30, 2010 Balance |
|||||||||||
|---|---|---|---|---|---|---|---|---|---|---|---|---|---|---|---|---|
Shopping centers/retail |
$ | 3,061 | — | $ | (104 | ) | — | $ | 2,957 | (a) | ||||||
Multi-family |
3,296 | — | (218 | ) | $ | (160 | ) | 2,918 | ||||||||
Commercial |
38,750 | $ | 3,753 | (558 | ) | — | 41,945 | (b) | ||||||||
Land |
10,437 | — | — | (2,465 | ) | 7,972 | (c) | |||||||||
Total real estate properties |
$ | 55,544 | $ | 3,753 | $ | (880 | ) | $ | (2,625 | ) | $ | 55,792 | ||||
The impairment charges in 2010 represent level 3 valuations within the valuation hierarchy established by current accounting guidance and were determined using sales comparables of properties in the respective markets.
- (a)
- The
Trust holds, with a minority partner, a leasehold interest in a portion of a retail shopping center located in Yonkers, New York. The leasehold interest
is for approximately 28,500 square feet and, including all option periods, expires in 2045. The non-controlling interest was 30%, or $152,000 and $189,000 at September 30, 2010 and
2009, respectively. These amounts are included as a component of non-controlling interests on the consolidated balance sheet.
- (b)
- Represents the real estate assets of RBH-TRB Newark Holdings LLC, a consolidated VIE which owns 25 operating and development properties in Newark, New Jersey. These properties contain a mix of office and retail space, totaling approximately 594,000 square feet. These assets are subject to blanket mortgages in the aggregate principal balance of $27,000,000 held by the Trust, which are eliminated in consolidation. Several of the assets are also encumbered by other mortgages which are discussed in Note 9—Debt Obligations—Mortgages Payable. The risks associated with our involvement in this VIE have not changed in the year ended September 30, 2010.
For the years ended September 30, 2010 and 2009, this VIE had revenues of $2,026,000 and $286,000, respectively, and operating expenses of $4,675,000 and $1,552,000, respectively. Operating expense includes interest expense paid to the Trust of $1,712,000 and $531,000, for the years ended September 30, 2010 and 2009, respectively, that is eliminated in consolidation. The Trust made capital contributions of $1,858,000 and $1,363,000 to this venture in the years ended September 30, 2010 and 2009, respectively, representing its proportionate share of capital required to fund the operations of the venture for its next fiscal year. The minority partner also made its proportionate share of the capital contribution which totaled $1,851,000 and $1,358,000 in the years ended September 30, 2010 and 2009, respectively.
- (c)
- Land is composed of an 8.9 acre development parcel located in Daytona Beach, Florida previously acquired in foreclosure.
F-17
BRT REALTY TRUST AND SUBSIDIARIES
Notes to Consolidated Financial Statements (Continued)
September 30, 2010
NOTE 4—REAL ESTATE PROPERTIES (Continued)
Future minimum rentals to be received by the Trust pursuant to non-cancellable operating leases with terms in excess of one year, from properties on which the Trust holds title to at September 30, 2010, are as follows (dollars in thousands):
Year Ending September 30,
|
Amount | |||
|---|---|---|---|---|
2011 |
$ | 2,540 | ||
2012 |
2,326 | |||
2013 |
2,005 | |||
2014 |
1,965 | |||
2015 |
1,969 | |||
Thereafter |
12,620 | |||
Total |
$ | 23,425 | ||
NOTE 5—IMPAIRMENT CHARGES
The Trust reviews each real estate asset owned, including investments in unconsolidated joint ventures, for which indicators of impairment are present to determine whether the carrying amount of the asset can be recovered. If indicators of impairment are present, measurement is then based upon the fair value of the asset. Real estate assets held for sale are valued at the lower of cost or fair value, less costs to sell on an individual asset basis.
As a result of the credit crisis and the deterioration in the value of real estate in locations where the Trust owns properties, the Trust took impairment charges of $3,370,000, $31,046,000 and $9,215,000 for the fiscal years ended September 30, 2010, 2009 and 2008, respectively, as follows (dollars in thousands):
| |
September 30, | ||||||||||
|---|---|---|---|---|---|---|---|---|---|---|---|
| |
2010 | 2009 | 2008 | ||||||||
Real estate properties |
$ | 2,625 | $ | 1,272 | — | ||||||
Investment in unconsolidated venture at equity |
— | — | $ | 1,050 | |||||||
Real estate properties held for sale |
745 | 29,774 | 8,165 | ||||||||
Total impairment charges |
$ | 3,370 | $ | 31,046 | $ | 9,215 | |||||
NOTE 6—INVESTMENT IN UNCONSOLIDATED VENTURES AT EQUITY
The Trust is a partner in three unconsolidated joint ventures, two of which own and operate properties. The third venture was engaged in short term lending and ceased operations in November 2009. These ventures generated $196,000, ($2,791,000) and $1,358,000 in equity earnings (loss) for the year ended September 30, 2010, 2009 and 2008, respectively. The Trust's equity investment in these unconsolidated joint ventures totaled $775,000 and $2,477,000 at September 30, 2010 and 2009, respectively.
F-18
BRT REALTY TRUST AND SUBSIDIARIES
Notes to Consolidated Financial Statements (Continued)
September 30, 2010
NOTE 6—INVESTMENT IN UNCONSOLIDATED VENTURES AT EQUITY (Continued)
In the year ended September 30, 2009, the Trust sold its interest in four unconsolidated joint ventures, which owned four properties located in Connecticut, and recognized a gain of $271,000 on the sale.
NOTE 7—AVAILABLE-FOR-SALE SECURITIES
At September 30, 2010, the Trust had available for sale securities which consisted of both debt securities and equity securities. Details regarding our available-for-sale securities at September 30, 2010 are presented in the table below (dollars in thousands):
| |
Cost basis |
Unrealized gains |
Unrealized losses |
Market value |
||||||||||
|---|---|---|---|---|---|---|---|---|---|---|---|---|---|---|
Debt Securities |
$ | 2,897 | $ | 611 | — | $ | 3,508 | |||||||
Equity Securities |
5,779 | 1,056 | $ | (73 | ) | 6,762 | ||||||||
Total |
$ | 8,676 | $ | 1,667 | $ | (73 | ) | $ | 10,270 | |||||
Unrealized gains and losses are reflected as accumulated other comprehensive income-net unrealized gain on available-for-sale securities in the accompanying consolidated balance sheets.
The Trust's available-for-sale equity securities were determined to be Level 1 financial assets within the valuation hierarchy established by current accounting guidance, and the valuation is based on current market quotes received from financial sources that trade such securities. All of the available-for-sale securities in an unrealized loss position are equity securities and amounts are not considered to be other than temporarily impaired because the Company expects the value of these securities to recover and plans on holding them until at least such recovery.
During the year ended September 30, 2010, the Trust sold equity securities for $2,425,000 with a basis of $975,000, determined using average cost. Accordingly, the Trust recognized a gain of $1,450,000 from these sales.
The Trust's available-for-sale debt securities were determined to be Level 2 financial assets within the valuation hierarchy established by current accounting guidance, and the valuation is based on market quotes from inactive markets received from financial sources that trade such securities.
During the year ended September 30, 2010, the Trust sold a corporate bond for $1,000,000 with a basis of $864,000, determined using specific identification. Accordingly, the Trust recognized a gain of $136,000 on this sale.
F-19
BRT REALTY TRUST AND SUBSIDIARIES
Notes to Consolidated Financial Statements (Continued)
September 30, 2010
NOTE 8—REAL ESTATE PROPERTIES HELD FOR SALE
In the fiscal year ended September 30, 2010, the Trust sold real estate assets which had been classified as held for sale with a book value of $13,775,000. Details of the sales are shown in the table below (dollars in thousands):
Property
|
Net Proceeds | Book Value | Gain | |||||||
|---|---|---|---|---|---|---|---|---|---|---|
Co-op—Manhattan, New York |
$ | 393 | $ | 12 | $ | 381 | ||||
Condominium units—Miami, Florida |
5,808 | 5,647 | 161 | |||||||
Multi-Family—Nashville, Tennessee |
3,091 | 3,080 | 11 | |||||||
Hotel—Fort Wayne, Indiana |
3,257 | 2,685 | 572 | |||||||
Multi-Family—Fort Wayne, Indiana |
3,163 | 2,351 | 812 | |||||||
|
$ | 15,712 | $ | 13,775 | $ | 1,937 | ||||
A summary of changes in real estate properties held for sale for the year ended September 30, 2010 is shown below (dollars in thousands):
| |
Balance September 30, 2009 |
Improvements | Impairment Charges |
Sales | Balance September 30, 2010 |
|||||||||||
|---|---|---|---|---|---|---|---|---|---|---|---|---|---|---|---|---|
Condominium/Co-op Units |
$ | 5,652 | $ | 63 | $ | (5 | ) | $ | (5,659 | ) | $ | 51 | ||||
Multi-family |
5,899 | 272 | (740 | ) | (5,431 | ) | — | |||||||||
Hotel |
2,653 | 32 | — | (2,685 | ) | — | ||||||||||
Total |
$ | 14,204 | $ | 367 | $ | (745 | ) | $ | (13,775 | ) | $ | 51 | ||||
At September 30, 2009 real estate properties held for sale consisted of 37 condominium units located in Miami Florida and one cooperative apartment unit located in Manhattan, New York. The Miami condominium units had a book value at September 30, 2009 of $5,634,000 and the Manhattan cooperative unit had a book value of $18,000. On November 3, 2009 the Trust sold its remaining Miami condominium units in a bulk sale. The sales price approximated the book value of the units, and accordingly the Trust did not recognize a gain or loss on the sale.
A summary of changes in real estate properties held for sale for the year ended September 30, 2009 is shown below (dollars in thousands):
| |
Balance September 30, 2008 |
Additions | Improvements | Impairment Charges |
(a) Depreciation |
Sales | Balance September 30, 2009 |
|||||||||||||||
|---|---|---|---|---|---|---|---|---|---|---|---|---|---|---|---|---|---|---|---|---|---|---|
Residential |
— | $ | 1,476 | $ | 63 | $ | (35 | ) | — | $ | (1,504 | ) | — | |||||||||
Condominium Units |
$ | 24,316 | — | 385 | (9,660 | ) | $ | (504 | ) | (8,885 | ) | $ | 5,652 | |||||||||
Multi-family |
38,542 | 14,720 | 2,427 | (20,079 | ) | (455 | ) | (29,256 | ) | 5,899 | ||||||||||||
Hotel |
— | 2,653 | — | — | — | — | 2,653 | |||||||||||||||
Total |
$ | 62,858 | $ | 18,849 | $ | 2,875 | $ | (29,774 | ) | $ | (959 | ) | $ | (39,645 | ) | $ | 14,204 | |||||
- (a)
- Represents depreciation recorded when the property was not held for sale.
F-20
BRT REALTY TRUST AND SUBSIDIARIES
Notes to Consolidated Financial Statements (Continued)
September 30, 2010
NOTE 9—DEBT OBLIGATIONS
Debt obligations consist of the following (dollars in thousands):
| |
September 30, | |||||||
|---|---|---|---|---|---|---|---|---|
| |
2010 | 2009 | ||||||
Junior subordinated notes |
$ | 40,815 | $ | 40,234 | ||||
Mortgages payable |
12,557 | 9,460 | ||||||
Total debt obligations |
$ | 53,372 | $ | 49,694 | ||||
Junior Subordinated Notes
On May 26, 2009, the Trust entered into an exchange agreement with certain affiliates of Taberna Capital Management LLC, pursuant to which $55,000,000 of its outstanding trust preferred securities was exchanged for $58,300,000 of newly issued unsecured junior subordinated notes, representing approximately 106% of the original face amount. As part of the exchange agreement, $1,702,000 of junior subordinated notes were redeemed and the Statutory Trust common securities, also in the amount of $1,702,000, were cancelled.
From May 1, 2009 through July 31, 2012 (the "Modification Period"), the new notes bear a fixed rate of interest of 3.5% per annum, to be paid annually in advance. Prior to the exchange, the blended interest rate on the Trust preferred securities was 8.37% per annum. Subsequent to the Modification Period, the interest rate will revert back to the rate in effect prior to the exchange, and commencing April 29, 2016, the interest rate will equal LIBOR plus 2.95%.
The Trust is subject to certain additional restrictions during the Modification Period. As long as BRT remains a real estate investment trust, it will be permitted to make distributions to its shareholders provided that (i) during tax years 2008 and 2009, such distributions are paid in the form of common shares to the maximum extent permissible under existing Internal Revenue Service regulations, with the balance payable in cash and (ii) thereafter, to satisfy REIT requirements or pay capital gains, if any, provided such distributions are paid in the form of common shares to the maximum extent permissible under the IRS regulations in effect at the time of such distributions, with the balance payable in cash.
As part of the agreement with Taberna Capital Management LLC, the Trust paid $580,000 for fees and costs incurred in connection with the exchange agreement and also incurred $105,000 in legal costs. These fees, which totaled $685,000, are being expensed and are shown in the statement of operations as "Debt restructuring charges."
On September 29, 2009 the Trust retired $15,900,000 of face value of the notes in exchange for the transfer by BRT to the noteholder of cash and certain replacement securities purchased by BRT in the open market. The cost to the Trust was $7,950,000. The Trust also incurred legal fees of $47,000 in connection with the transaction and paid $318,000 to the collateral manager to cover fees and expenses of the noteholders related to the exchange agreement. The carrying value of the securities at the time of redemption was $14,758,000 which included $329,000 of deferred costs. The Trust recorded a gain of $6,443,000 on the transaction.
At September 30, 2010, the Trust's junior subordinated notes had an outstanding principal balance of $42,400,000 and a book balance of $40,815,000. The difference of $1,585,000, representing
F-21
BRT REALTY TRUST AND SUBSIDIARIES
Notes to Consolidated Financial Statements (Continued)
September 30, 2010
NOTE 9—DEBT OBLIGATIONS (Continued)
unamortized principal, is being accreted over the remaining term of the securities using the level yield method and will be charged to interest expense. The remaining unamortized fees, which total $845,000, are being amortized over the remaining term. Amortization of these fees totaled $33,000, $111,000 and $177,000 in the years ended September 30, 2010, 2009 and 2008, respectively.
Mortgages Payable
The Trust has five first mortgages and one second mortgage outstanding with an aggregate principal balance of $12,557,000. One of these mortgages with an outstanding balance at September 30, 2010 of $2,138,000 secures a long term leasehold position on a shopping center owned by a consolidated joint venture. The remaining five mortgages with an outstanding aggregate principal balance at September 30, 2010 of $10,419,000 secure individual parcels on two land assemblages in Newark, NJ owned by another consolidated joint venture.
Details pertaining to the outstanding mortgages payable at September 30, 2010 are as follows (dollars in thousands):
Location
|
Balance | Amortizing | Rate | Maturity Date |
Other | ||||||||
|---|---|---|---|---|---|---|---|---|---|---|---|---|---|
Yonkers, NY |
$ | 2,138 | Y | 6.25 | % | 10/1/2011 | 5 year extension option | ||||||
Market Street, Newark, NJ |
1,200 | N | 7.00 | % | 9/20/2011 | — | |||||||
Market Street, Newark, NJ |
900 | N | 7.00 | % | 1/18/2015 | — | |||||||
Broad Street, Newark, NJ |
5,988 | Y | 6.00 | % | 8/1/2030 | — | |||||||
Broad Street, Newark, NJ |
499 | Y | 6.00 | % | 8/1/2030 | — | |||||||
Teachers Village, Newark, NJ |
1,832 | N | 17.00 | % | 9/14/2011 | 6 month extension option(a) | |||||||
|
$ | 12,557 | |||||||||||
- (a)
- This mortgage is subordinate to a first mortgage in the amount of $7,500,000 held directly by the Trust that is eliminated in consolidation. The Trust has guaranteed $459,000 of the mortgage obligation at September 30, 2010, based on the current outstanding balance. The guarantee amount will increase to $2,154,000 if the full amount of the $8,600,000 loan is drawn and outstanding.
Scheduled principal repayments on these mortgages after giving effect to all available extensions are as follows (dollars in thousands):
Years Ending September 30,
|
Amount | |||
|---|---|---|---|---|
2011 |
$ | 1,470 | ||
2012 |
2,118 | |||
2013 |
306 | |||
2014 |
325 | |||
2015 |
1,245 | |||
Thereafter |
7,093 | |||
|
$ | 12,557 | ||
F-22
BRT REALTY TRUST AND SUBSIDIARIES
Notes to Consolidated Financial Statements (Continued)
September 30, 2010
NOTE 10—INCOME TAXES
The Trust has elected to be taxed as a real estate investment trust ("REIT"), as defined under the Internal Revenue Code of 1986, as amended. As a REIT, the Trust will generally not be subject to Federal income taxes at the corporate level if it distributes 100% of its REIT taxable income, as defined, to its shareholders. To maintain its REIT status, the Trust must distribute at least 90% of its income; however if it does not distribute 100% of its income, it will be taxed on undistributed income. There are a number of organizational and operational requirements the Trust must meet to remain a REIT. If the Trust fails to qualify as a REIT in any taxable year, its taxable income will be subject to Federal income tax at regular corporate tax rates and it may not be able to qualify as a REIT for four subsequent tax years. Even if it is qualified as a REIT, the Trust is subject to certain state and local income taxes and to Federal income and excise taxes on its undistributed taxable income. For income tax purposes the Trust reports on a calendar year.
During the years ended September 30, 2010, 2009 and 2008, the Trust recorded $6,000, $53,000 and $251,000, respectively, of corporate tax expense for state and local taxes relating to the 2009, 2008 and 2007 tax years. The year ended September 30, 2008 also includes $158,000 for the payment of federal excise tax which is based on taxable income generated but not yet distributed.
Earnings and profits, which determine the taxability of dividends to shareholders, differs from net income reported for financial statement purposes due to various items including timing differences related to loan loss provision, impairment charges, depreciation methods and carrying values.
The financial statement loss is expected to be approximately $3,400,000 more than the loss for tax purposes during calendar 2010, primarily due to impairment charges taken for book purposes in prior calendar years that will be deductible for tax purposes in the current tax year.
At December 31, 2009, the Trust had a tax loss carry forward of $61,400,000. These net operating losses can be used in future years to reduce taxable income when it is generated. These tax loss carry forwards begin to expire in 2028.
NOTE 11—SHAREHOLDERS' EQUITY
Distributions
During the year ended September 30, 2010, the Trust did not declare any dividends.
Stock Options
At September 30, 2010 there were 22,500 options outstanding from the BRT 1996 Stock Option Plan, all of which are currently exercisable. No further grants can be made under this Plan. Information regarding these options is set forth below:
Number of Options
|
Exercise Price | Expiration Date | |||
|---|---|---|---|---|---|
11,500 |
$ | 6.12 | December 2010 | ||
11,000 |
$ | 8.25 | December 2011 | ||
F-23
BRT REALTY TRUST AND SUBSIDIARIES
Notes to Consolidated Financial Statements (Continued)
September 30, 2010
NOTE 11—SHAREHOLDERS' EQUITY (Continued)
Changes in the number of shares under all option arrangements are summarized as follows:
| |
Year Ended September 30, | |||||||||
|---|---|---|---|---|---|---|---|---|---|---|
| |
2010 | 2009 | 2008 | |||||||
Outstanding at beginning of period |
22,500 | 22,500 | 23,750 | |||||||
Exercised |
— | — | (1,250 | ) | ||||||
Outstanding at end of period |
22,500 | 22,500 | 22,500 | |||||||
Exercisable at end of period |
22,500 | 22,500 | 22,500 | |||||||
Option prices per share outstanding(a) |
$ | 6.12 - $8.25 | $ | 7.75 - $10.45 | $ | 7.75 - $10.45 | ||||
As of September 30, 2010, 2009 and 2008 the outstanding options had a weighted average remaining contractual life of approximately 0.6, 1.6 and 2.6 years and a weighted average exercise price of $7.16, $9.07 and $9.07 respectively.
- (a)
- The option prices have been adjusted for the fiscal year ended September 30, 2010 to give effect to the stock dividend that took place in October 2009.
Restricted Shares
On December 16, 2002, the Board of Trustees adopted and on March 24, 2003 the shareholders of the Trust approved the 2003 BRT Incentive Plan, whereby a maximum of 350,000 shares of beneficial interest may be issued in the form of options or restricted shares to the Trust's officers, employees, trustees and consultants. No further shares may be issued under this Plan.
On December 8, 2008, the Board of Trustees adopted and on March 16, 2009, the shareholders of the Trust approved the 2009 BRT Incentive Plan, whereby a maximum of 500,000 shares of beneficial interest may be issued in the form of options or restricted shares to the Trust's officers, employees, trustees and consultants. At September 30, 2010, 367,610 shares remain available for issuance under this Plan.
During the years ended September 30, 2010, 2009 and 2008, the Trust issued 125,150, 126,450 and 63,430 restricted shares, respectively, under the Plans. The shares vest five years from the date of issuance and under certain circumstances may vest earlier. For accounting purposes, the restricted shares are not included in the outstanding shares shown on the consolidated balance sheets until they vest. For the years ended September 30, 2010, 2009 and 2008, the Trust recognized $833,000, $876,000 and $855,000 of compensation expense respectively. At September 30, 2010, $1,653,000 has been deferred as unearned compensation and will be charged to expense over the remaining vesting periods. The weighted average vesting period is 2.99 years.
F-24
BRT REALTY TRUST AND SUBSIDIARIES
Notes to Consolidated Financial Statements (Continued)
September 30, 2010
NOTE 11—SHAREHOLDERS' EQUITY (Continued)
Changes in number of shares outstanding under the 2009 and 2003 BRT Incentive Plans are shown below:
| |
Years Ended September 30, | |||||||||
|---|---|---|---|---|---|---|---|---|---|---|
| |
2010 | 2009 | 2008 | |||||||
Outstanding at beginning of the year |
299,280 | 197,540 | 157,985 | |||||||
Issued |
125,150 | 126,450 | 63,430 | |||||||
Cancelled |
(2,050 | ) | (750 | ) | (575 | ) | ||||
Vested |
(30,800 | ) | (23,960 | ) | (23,300 | ) | ||||
Outstanding at the end of the year |
391,580 | 299,280 | 197,540 | |||||||
(Loss) Earnings Per Share
The following table sets forth the computation of basic and diluted (loss) earnings per share (dollars in thousands):
| |
2010 | 2009 | 2008 | |||||||
|---|---|---|---|---|---|---|---|---|---|---|
Numerator for basic and diluted (loss) per share attributable to common shareholders: |
||||||||||
Net (loss) |
$ | (8,015 | ) | $ | (47,755 | ) | $ | (260 | ) | |
Denominator: |
||||||||||
Denominator for basic (loss) per share—weighted average shares(1) |
13,871,668 | 11,643,972 | 11,648,885 | |||||||
Effect of dilutive securities: |
||||||||||
Employee stock options |
298 | — | 7,549 | |||||||
Stock dividend payable |
— | 2,437,352 | — | |||||||
Denominator for diluted (loss) per share—adjusted weighted average shares and assumed conversions(1) |
13,871,668 | 11,643,972 | 11,648,885 | |||||||
Basic (loss) per share |
$ | (.58 | ) | $ | (4.10 | ) | $ | (.02 | ) | |
Diluted (loss) per share |
$ | (.58 | ) | $ | (4.10 | ) | $ | (.02 | ) | |
- (1)
- Outstanding shares for 2010, 2009 and 2008 are the same for basic and diluted as the effect of dilutive shares in the computation of earnings per share would have been antidilutive.
Treasury Shares
On March 10, 2008, the Board of Trustees approved a share repurchase program whereby the Trust may repurchase up to 1,000,000 of its shares of beneficial interest. During the fiscal year ended September 30, 2010, 2009 and 2008 the Trust repurchased 52,403, 256,110 and 67,334 shares, respectively, at an average cost of $5.55, $3.68 and $11.41 per share respectively.
During the year ended September 30, 2010, 2009 and 2008, 30,800, 23,960 and 24,550 treasury shares, respectively, were issued in connection with the exercise of stock options and the issuance of
F-25
BRT REALTY TRUST AND SUBSIDIARIES
Notes to Consolidated Financial Statements (Continued)
September 30, 2010
NOTE 11—SHAREHOLDERS' EQUITY (Continued)
restricted stock under the Trust's stock option and incentive plans. As of September 30, 2010, the Trust owns 1,460,000 treasury shares of beneficial interest at an aggregate cost of $11,364,000.
Tender Offer
On October 27, 2010, 147,388 shares of beneficial interest were tendered pursuant to a previously announced tender offer. The total purchase price of these shares was $6.30 per share, aggregating $929,000.
NOTE 12—ADVISOR'S COMPENSATION AND RELATED PARTY TRANSACTIONS
Certain of the Trust's officers and trustees are also officers and directors of REIT Management Corp. ("REIT"), (The Advisor) to which the Trust pays advisory fees for administrative services and investment advice. Fredric H. Gould, chairman of the board, is the sole shareholder of REIT Management Corp. The agreement, as amended, expires on December 31, 2010. Advisory fees are currently charged to operations at a rate of 0.6% on invested assets which consist primarily of real estate loans, real estate assets and investment securities. Advisory fees amounted to $785,000, $1,173,000 and $1,730,000 for the years ended September 30, 2010, 2009, and 2008, respectively. The advisory agreement, which was to expire on December 31, 2010 has been extended to April 30, 2011.
The Trust's borrowers pay fees directly to REIT based on loan originations, which generally are one-time fees payable upon funding of a loan, in the amount of 1/2 of 1% of the total loan. These fees were $89,000, $44,000 and $223,000 for the years ended September 30, 2010, 2009 and 2008, respectively.
Management of certain properties for the Trust is provided by Majestic Property Management Corp., a corporation in which the chairman of the board is the sole shareholder, under renewable year-to-year agreements. Certain of the Trust's officers and Trustees are also officers and directors of Majestic Property Management Corp. Majestic Property Management Corp. provides real property management, real estate brokerage and construction supervision services to the Trust and its joint venture properties. For the years ended September 30, 2010, 2009 and 2008, fees for these services aggregated $66,000, $175,000 and $139,000, respectively.
The chairman of the board is also chairman of the board of One Liberty Properties, Inc., a related party, and certain of the Trust's Officers and Trustees are also officers and directors of One Liberty Properties, Inc. In addition the Chairman of the Board is an executive officer and sole shareholder of Georgetown Partners Inc., the managing general partner of Gould Investors L.P. and the sole member of Gould General LLC, a general partner of Gould Investors L.P., a related party. Certain of the Trust's officers and Trustees are also officers and directors of Georgetown Partners Inc. The allocation of expenses for the shared facilities, personnel and other resources is computed in accordance with a shared services agreement by and among the Trust and the affiliated entities. During the years ended September 30, 2010, 2009 and 2008, allocated general and administrative expenses reimbursed by the Trust to Gould Investors L.P. pursuant to the shared services agreement, aggregated $822,000, $1,002,000, and $1,039,000, respectively. At September 30, 2010, $114,000 remains unpaid and is included in accounts payable and accrued liabilities on the consolidated balance sheet.
F-26
BRT REALTY TRUST AND SUBSIDIARIES
Notes to Consolidated Financial Statements (Continued)
September 30, 2010
NOTE 13—SEGMENT REPORTING
Management has determined that the Trust operates in two reportable segments, a loan and investment segment which includes the origination and servicing of our loan portfolio and our investments and a real estate segment which includes the operation and disposition of our real estate assets.
The following table summarizes the Trust's segment reporting for the year ended September 30, 2010 (dollars in thousands):
| |
Loan and Investment |
Real Estate | Total | |||||||
|---|---|---|---|---|---|---|---|---|---|---|
Revenues |
$ | 4,713 | $ | 3,422 | $ | 8,135 | ||||
Interest expense |
1,181 | 592 | 1,773 | |||||||
Provision for loan loss |
3,165 | — | 3,165 | |||||||
Impairment charges |
— | 2,625 | 2,625 | |||||||
Other expenses |
5,233 | 6,154 | 11,387 | |||||||
Amortization and depreciation |
— | 894 | 894 | |||||||
Total expenses |
9,579 | 10,265 | 19,844 | |||||||
Total revenues less total expenses |
(4,866 | ) | (6,843 | ) | (11,709 | ) | ||||
Equity in earnings of unconsolidated ventures |
28 |
168 |
196 |
|||||||
Gain on sale of available-for-sale securities |
1,586 | — | 1,586 | |||||||
Loss from continuing operations |
(3,252 | ) | (6,675 | ) | (9,927 | ) | ||||
Discontinued operations: |
||||||||||
Loss from operations |
— | (602 | ) | (602 | ) | |||||
Impairment charges |
— | (745 | ) | (745 | ) | |||||
Gain on sale of real estate assets |
— | 1,937 | 1,937 | |||||||
Income from discontinued operations |
— | 590 | 590 | |||||||
Net loss |
(3,252 | ) | (6,085 | ) | (9,337 | ) | ||||
Less net loss attributable to non-controlling interests |
— | 1,322 | 1,322 | |||||||
Net loss attributable to common shareholders |
$ |
(3,252 |
) |
$ |
(4,763 |
) |
$ |
(8,015 |
) |
|
Segment assets |
$ |
124,928 |
$ |
61,338 |
$ |
186,266 |
||||
F-27
BRT REALTY TRUST AND SUBSIDIARIES
Notes to Consolidated Financial Statements (Continued)
September 30, 2010
NOTE 13—SEGMENT REPORTING (Continued)
The following table summarizes the Trust's segment reporting for the year ended September 30, 2009 (dollars in thousands):
| |
Loan and Investment |
Real Estate | Total | |||||||
|---|---|---|---|---|---|---|---|---|---|---|
Revenues |
$ | 10,436 | $ | 1,718 | $ | 12,154 | ||||
Interest expense |
2,887 | 1,548 | 4,435 | |||||||
Provision for loan loss |
17,110 | — | 17,110 | |||||||
Impairment charges |
— | 1,272 | 1,272 | |||||||
Other expenses |
6,943 | 5,229 | 12,172 | |||||||
Amortization and depreciation |
— | 1,340 | 1,340 | |||||||
Total expenses |
26,940 | 9,389 | 36,329 | |||||||
Loss before other revenue and expense items |
(16,504 |
) |
(7,671 |
) |
(24,175 |
) |
||||
Equity in loss of unconsolidated ventures |
(2,261 |
) |
(530 |
) |
(2,791 |
) |
||||
Gain on sale of joint venture interest |
— | 271 | 271 | |||||||
Gain on sale of available-for-sale securities |
1,016 | — | 1,016 | |||||||
Gain on early extinguishment of debt |
4,194 | 2,249 | 6,443 | |||||||
Loss from continuing operations |
(13,555 | ) | (5,681 | ) | (19,236 | ) | ||||
Discontinued operations: |
||||||||||
Income (loss) from operations |
824 | (2,373 | ) | (1,549 | ) | |||||
Impairment charges |
— | (29,774 | ) | (29,774 | ) | |||||
Gain on sale of real estate assets |
— | 2,199 | 2,199 | |||||||
Income (loss) from discontinued operations |
824 | (29,948 | ) | (29,124 | ) | |||||
Net loss |
(12,731 | ) | (35,629 | ) | (48,360 | ) | ||||
Less net loss attributable to non-controlling interests |
— | 605 | 605 | |||||||
Net loss attributable to common shareholders |
$ |
(12,731 |
) |
$ |
(35,024 |
) |
$ |
(47,775 |
) |
|
Segment assets |
$ |
122,785 |
$ |
70,548 |
$ |
193,333 |
||||
F-28
BRT REALTY TRUST AND SUBSIDIARIES
Notes to Consolidated Financial Statements (Continued)
September 30, 2010
NOTE 13—SEGMENT REPORTING (Continued)
The following table summarizes the Trust's segment reporting for the year ended September 30, 2008 (dollars in thousands):
| |
Loan and Investment |
Real Estate | Total | |||||||
|---|---|---|---|---|---|---|---|---|---|---|
Revenues |
$ | 20,538 | $ | 1,452 | $ | 21,990 | ||||
Interest expense |
4,633 | 2,011 | 6,644 | |||||||
Provision for loan loss |
15,260 | — | 15,260 | |||||||
Impairment charges |
1,050 | — | 1,050 | |||||||
Other expenses |
8,160 | 3,645 | 11,805 | |||||||
Amortization and depreciation |
— | 795 | 795 | |||||||
Total expenses |
29,103 | 6,451 | 35,554 | |||||||
Loss before other revenue and expense items |
(8,565 |
) |
(4,999 |
) |
(13,564 |
) |
||||
Equity in earnings of unconsolidated ventures |
1,258 |
100 |
1,358 |
|||||||
Net gain on sale of available-for-sale securities |
19,940 | — | 19,940 | |||||||
Income (loss) from continuing operations |
12,633 | (4,899 | ) | 7,734 | ||||||
Discontinued operations |
||||||||||
Income (loss) from operations |
298 | (1,505 | ) | (1,207 | ) | |||||
Impairment charges |
— | (8,165 | ) | (8,165 | ) | |||||
Gain on sale of real estate assets |
— | 1,517 | 1,517 | |||||||
Income (loss) from discontinued operations |
298 | (8,153 | ) | (7,855 | ) | |||||
Net income (loss) |
12,931 | (13,052 | ) | (121 | ) | |||||
Less net income attributable to non-controlling interests |
— | (139 | ) | (139 | ) | |||||
Net income (loss) attributable to common shareholders |
$ |
12,931 |
$ |
(13,191 |
) |
$ |
(260 |
) |
||
Segment assets |
$ |
188,309 |
$ |
81,711 |
$ |
270,020 |
||||
F-29
BRT REALTY TRUST AND SUBSIDIARIES
Notes to Consolidated Financial Statements (Continued)
September 30, 2010
NOTE 14—FAIR VALUE OF FINANCIAL INSTRUMENTS
Financial Instruments Not Measured at Fair Value
The following methods and assumptions were used to estimate the fair value of each class of financial instruments that are not reported at fair value on the consolidated balance sheet:
Cash and cash equivalents, accounts receivable (included in other assets), accounts payable and accrued liabilities: The carrying amounts reported in the balance sheet for these instruments approximate their fair value due to the short term nature of these accounts.
Real estate loans: The earning mortgage loans of the Trust, which have variable rate provisions which are based upon a margin over prime rate, have an estimated fair value which is equal to their carrying value, assuming market rates of interest between 11% and 13%. The earning loans of the Trust, which have fixed rate provisions, have an estimated fair value of $73,000 less than their carrying value assuming market rates of interest between 8% and 11% which reflect institutional lender yield requirements. For loans which are impaired, the Trust has valued such loans based upon the estimated fair value of the underlying collateral as described more fully in Note 1.
At September 30, 2010, the estimated fair value of the Trust's junior subordinated notes is less than their carrying value by approximately $24,470,000, based on a recent independent third party valuation.
At September 30, 2010, the estimated fair value of the Trust's mortgages payable is greater than their carrying value by approximately $440,000 assuming market interest rates between 5.16% and 13%. Market interest rates were determined using current financing transactions provided by third party institutions.
Considerable judgment is necessary to interpret market data and develop estimated fair value. The use of different market assumptions and/or estimation methodologies may have a material effect on the estimated fair value assumptions.
Financial Instruments Measured at Fair Value
The Trust's fair value measurements are based on the assumptions that market participants would use in pricing the asset or liability. As a basis for considering market participant assumptions in fair value measurements, there is a fair value hierarchy that distinguishes between markets participant assumptions based on market data obtained from sources independent of the reporting entity and the reporting entity's own assumptions about market participant assumptions. Level 1 assets/liabilities are valued based on quoted prices for identical instruments in active markets, Level 2 assets/liabilities are valued based on quoted prices in active markets for similar instruments, on quoted prices in less active or inactive markets, or on other "observable" market inputs and Level 3 assets/liabilities are valued
F-30
BRT REALTY TRUST AND SUBSIDIARIES
Notes to Consolidated Financial Statements (Continued)
September 30, 2010
NOTE 14—FAIR VALUE OF FINANCIAL INSTRUMENTS (Continued)
based significantly on "unobservable" market inputs. The Company does not currently own any financial instruments that are classified as Level 3.
| |
Carrying and Fair Value |
Maturity Date | Fair Value Using Fair |
Measurements Value Hierarchy |
|||||||||
|---|---|---|---|---|---|---|---|---|---|---|---|---|---|
| |
|
|
Level 1 |
Level 2 |
|||||||||
Financial assets: |
|||||||||||||
Available-for-sale securities |
|||||||||||||
Corporate equity securities |
$ | 6,762,000 | — | $ | 6,762,000 | — | |||||||
Corporate debt security |
1,010,000 | 2/15/2037 | — | $ | 1,010,000 | ||||||||
Corporate debt security |
1,077,000 | 8/1/2015 | — | 1,077,000 | |||||||||
Corporate debt security |
1,067,000 | 6/1/2014 | — | 1,067,000 | |||||||||
Corporate debt security |
354,000 | 1/15/2012 | — | 354,000 | |||||||||
NOTE 15—COMMITMENT
The Trust maintains a non-contributory defined contribution pension plan covering eligible employees and officers. Contributions by the Trust are made through a money purchase plan, based upon a percent of qualified employees' total salary as defined therein. Pension expense approximated $287,000, $303,000, and $287,000 during the years ended September 30, 2010, 2009 and 2008, respectively. At September 30, 2010, $12,000 remains unpaid and is included in accounts payable and accrued liabilities on the consolidated balance sheet.
NOTE 16—QUARTERLY FINANCIAL DATA (Unaudited)
| |
2010 | |||||||||||||||||
|---|---|---|---|---|---|---|---|---|---|---|---|---|---|---|---|---|---|---|
| |
1st Quarter Oct.-Dec |
2nd Quarter Jan.-March |
3rd Quarter April-June |
4th Quarter July-Sept. |
Total For Year |
|||||||||||||
Revenues |
$ | 1,881 | $ | 2,027 | $ | 2,345 | $ | 1,882 | $ | 8,135 | ||||||||
Provision for loan loss |
3,165 | — | — | — | 3,165 | |||||||||||||
Impairment charges |
— | — | 2,625 | — | 2,625 | |||||||||||||
Gain on sale of available for sale securities |
1,586 | — | — | — | 1,586 | |||||||||||||
Loss from continuing operations |
(2,990 | ) | (1,613 | ) | (3,989 | ) | (1,335 | ) | (9,927 | ) | ||||||||
Discontinued operations(a) |
102 | (114 | ) | 589 | 13 | 590 | ||||||||||||
Net loss |
(2,888 | ) | (1,727 | ) | (3,400 | ) | (1,322 | ) | (9,337 | ) | ||||||||
Less net loss attributable to non-controlling interests |
367 | 370 | 429 | 156 | 1,322 | |||||||||||||
Net loss attributable to common shareholders |
(2,521 | ) | (1,357 | ) | (2,971 | ) | (1,166 | ) | (8,015 | ) | ||||||||
(Loss) income per beneficial share |
||||||||||||||||||
Continuing operations |
$ | (.20 | ) | $ | (.09 | ) | $ | (.25 | ) | $ | (.08 | ) | $ | (.62 | ) | |||
Discontinued operations |
.01 | (.01 | ) | .04 | — | .04 | ||||||||||||
Basic earnings (loss) per share |
$ | (.19 | ) | $ | (.10 | ) | $ | (.21 | ) | $ | (.08 | ) | $ | (.58 | ) | |||
F-31
BRT REALTY TRUST AND SUBSIDIARIES
Notes to Consolidated Financial Statements (Continued)
September 30, 2010
NOTE 16—QUARTERLY FINANCIAL DATA (Unaudited) (Continued)