Attached files
| file | filename |
|---|---|
| 8-K - FORM 8-K - CAMBIUM LEARNING GROUP, INC. | d78272e8vk.htm |
Exhibit 99.1
| Company Overview 7 |
| Forward Looking Statements 2 Forward-Looking StatementsSome of the statements contained herein constitute forward-looking statements. These statements relate to future events, including the future financial performance of Cambium Learning Group, Inc., and involve known and unknown risks, uncertainties and other factors that may cause the markets, actual results, levels of activity, performance or achievements of Cambium Learning Group, Inc. to be materially different from any actual future results, levels of activity, performance or achievements. These risks and other factors you should consider include, but are not limited to, the ability to successfully attract and retain a broad customer base for current and future products, changes in customer demands or industry standards, success of ongoing product development, maintaining acceptable margins, the ability to control costs, K-12 enrollment and demographic trends, the level of educational and education technology funding, the impact of federal, state and local regulatory requirements on the business of the company, the loss of key personnel, the impact of competition and the risk that competitors will seek to capitalize on the risks and uncertainties confronting the new combined company, the uncertainty of general economic conditions and financial market performance, and those other risks and uncertainties listed under the heading "RISK FACTORS" in Cambium Learning Group, Inc.'s 2009 10-K Filing. In some cases, you can identify forward-looking statements by terminology such as "may," "should," "expects," "plans," "anticipates," "believes," "estimates," "predicts," "potential," "continue," "projects," "intends," "prospects," or "priorities," or the negative of such terms, or other comparable terminology. These statements are only predictions. Actual events or results may differ materially. Cambium Learning Group, Inc. does not assume or undertake any obligation to update the information contained in this press release, and expressly disclaims any obligation to do so, whether as a result of new information, future events or otherwise. |
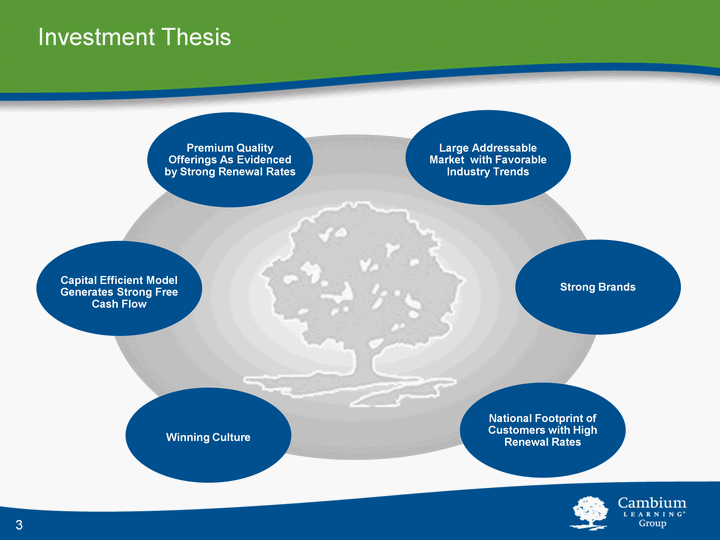
| 3 Investment Thesis Capital Efficient Model Generates Strong Free Cash Flow Winning Culture Large Addressable Market with Favorable Industry Trends Strong Brands National Footprint of Customers with High Renewal Rates Premium Quality Offerings As Evidenced by Strong Renewal Rates 8 |
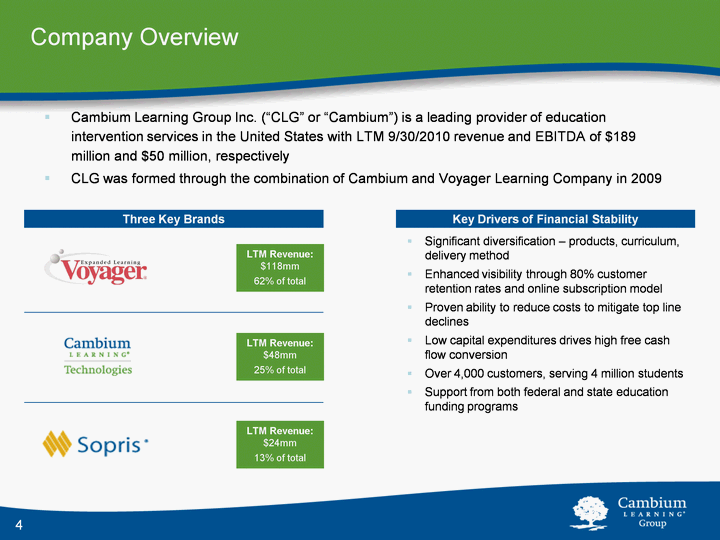
| Cambium Learning Group Inc. ("CLG" or "Cambium") is a leading provider of education intervention services in the United States with LTM 9/30/2010 revenue and EBITDA of $189 million and $50 million, respectivelyCLG was formed through the combination of Cambium and Voyager Learning Company in 2009 Company Overview 4 Significant diversification - products, curriculum, delivery methodEnhanced visibility through 80% customer retention rates and online subscription modelProven ability to reduce costs to mitigate top line declinesLow capital expenditures drives high free cash flow conversionOver 4,000 customers, serving 4 million studentsSupport from both federal and state education funding programs Key Drivers of Financial Stability 9 LTM Revenue: $118mm62% of total LTM Revenue: $48mm25% of total LTM Revenue: $24mm13% of total Three Key Brands |
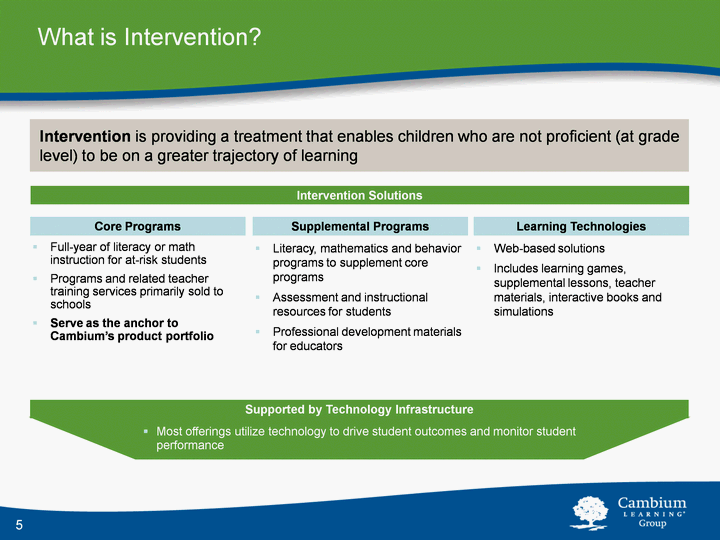
| 5 What is Intervention? Full-year of literacy or math instruction for at-risk studentsPrograms and related teacher training services primarily sold to schoolsServe as the anchor to Cambium's product portfolio Core Programs Intervention is providing a treatment that enables children who are not proficient (at grade level) to be on a greater trajectory of learning Intervention Solutions Literacy, mathematics and behavior programs to supplement core programsAssessment and instructional resources for studentsProfessional development materials for educators Supplemental Programs Supported by Technology Infrastructure Most offerings utilize technology to drive student outcomes and monitor student performance Web-based solutionsIncludes learning games, supplemental lessons, teacher materials, interactive books and simulations Learning Technologies 10 |
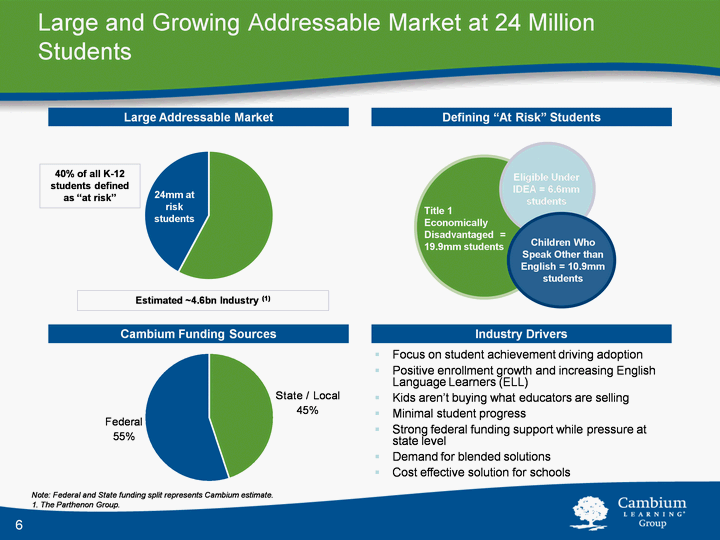
| Focus on student achievement driving adoptionPositive enrollment growth and increasing English Language Learners (ELL)Kids aren't buying what educators are sellingMinimal student progressStrong federal funding support while pressure at state levelDemand for blended solutionsCost effective solution for schools 6 Large and Growing Addressable Market at 24 Million Students Eligible Under IDEA = 6.6mm students Children Who Speak Other than English = 10.9mm students Defining "At Risk" Students Large Addressable Market Industry Drivers 24mm at risk students 40% of all K-12 students defined as "at risk" Cambium Funding Sources Note: Federal and State funding split represents Cambium estimate.1. The Parthenon Group. 11 Estimated ~4.6bn Industry (1) |
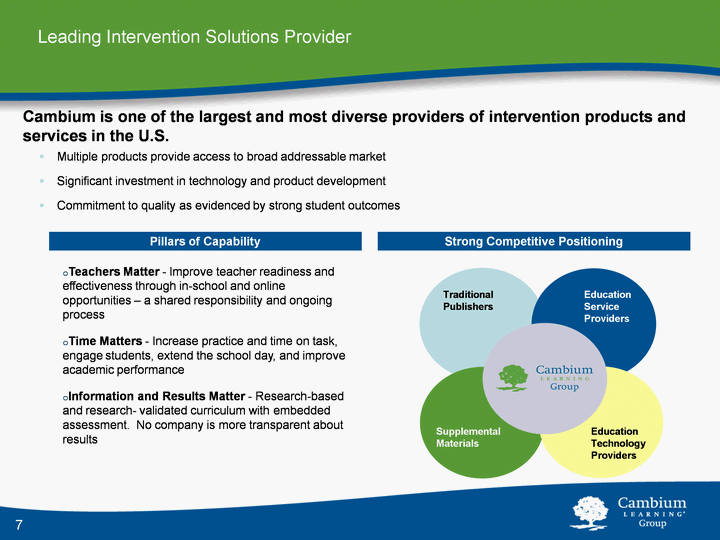
| Leading Intervention Solutions Provider 7 Multiple products provide access to broad addressable marketSignificant investment in technology and product developmentCommitment to quality as evidenced by strong student outcomes Strong Competitive Positioning Traditional Publishers Education Service Providers Supplemental Materials Education Technology Providers Cambium is one of the largest and most diverse providers of intervention products and services in the U.S. 14 Pillars of Capability Teachers Matter - Improve teacher readiness and effectiveness through in-school and online opportunities - a shared responsibility and ongoing processTime Matters - Increase practice and time on task, engage students, extend the school day, and improve academic performanceInformation and Results Matter - Research-based and research- validated curriculum with embedded assessment. No company is more transparent about results |
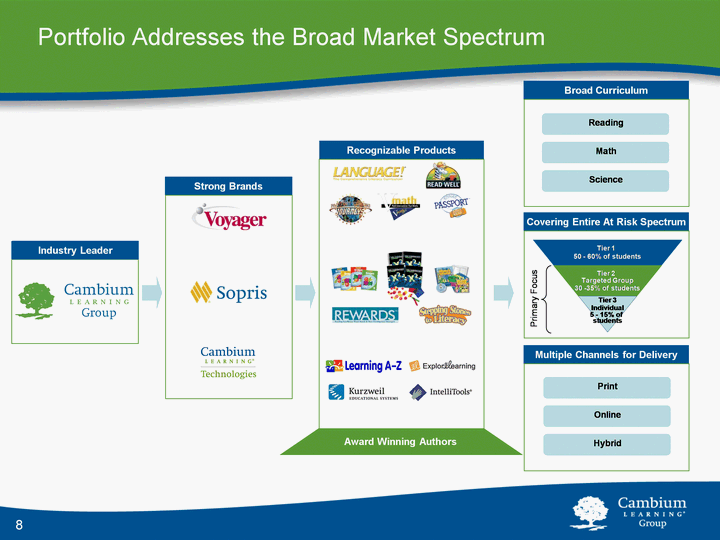
| Portfolio Addresses the Broad Market Spectrum 8 Industry Leader Industry Leader Strong Brands Tier 2 Targeted Group 30 -35% of students Tier 3 Individual 5 - 15% of students Broad Curriculum Covering Entire At Risk Spectrum Multiple Channels for Delivery Reading Math Science Print Online Hybrid Recognizable Products Award Winning Authors Primary Focus 15 |
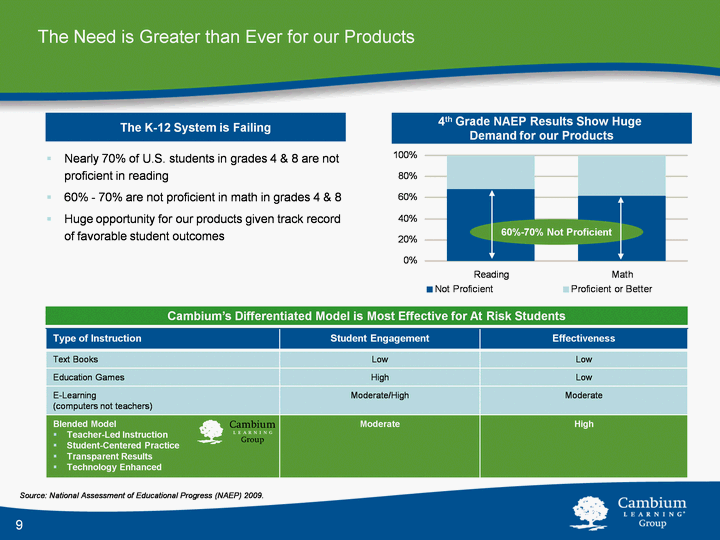
| 9 The Need is Greater than Ever for our Products Nearly 70% of U.S. students in grades 4 & 8 are not proficient in reading60% - 70% are not proficient in math in grades 4 & 8Huge opportunity for our products given track record of favorable student outcomes Source: National Assessment of Educational Progress (NAEP) 2009. 4th Grade NAEP Results Show Huge Demand for our Products Grade 4 Not Proficient Proficient or Better Reading 0.68 0.32 Math 0.62 0.38 The K-12 System is Failing Type of Instruction Student Engagement Effectiveness Text Books Low Low Education Games High Low E-Learning (computers not teachers) Moderate/High Moderate Blended ModelTeacher-Led InstructionStudent-Centered PracticeTransparent ResultsTechnology Enhanced Moderate High 60%-70% Not Proficient Cambium's Differentiated Model is Most Effective for At Risk Students 12 |
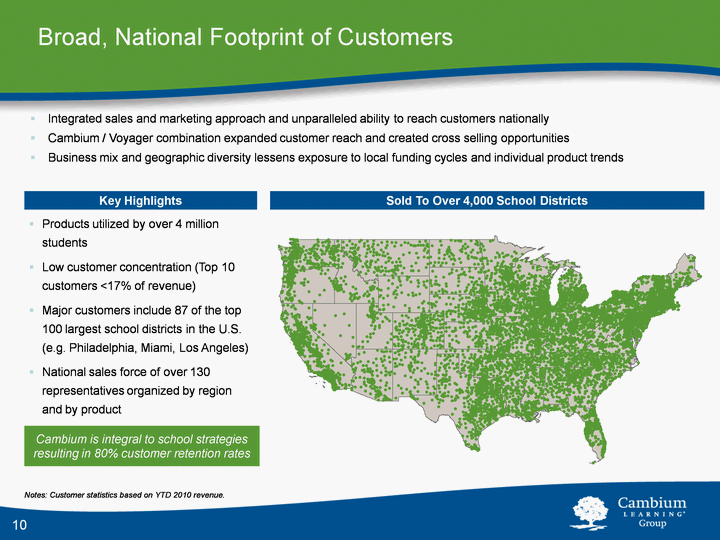
| 10 Broad, National Footprint of Customers Integrated sales and marketing approach and unparalleled ability to reach customers nationallyCambium / Voyager combination expanded customer reach and created cross selling opportunitiesBusiness mix and geographic diversity lessens exposure to local funding cycles and individual product trends Notes: Customer statistics based on YTD 2010 revenue. Products utilized by over 4 million studentsLow customer concentration (Top 10 customers <17% of revenue)Major customers include 87 of the top 100 largest school districts in the U.S. (e.g. Philadelphia, Miami, Los Angeles)National sales force of over 130 representatives organized by region and by product Key Highlights Cambium is integral to school strategies resulting in 80% customer retention rates 16 Sold To Over 4,000 School Districts |
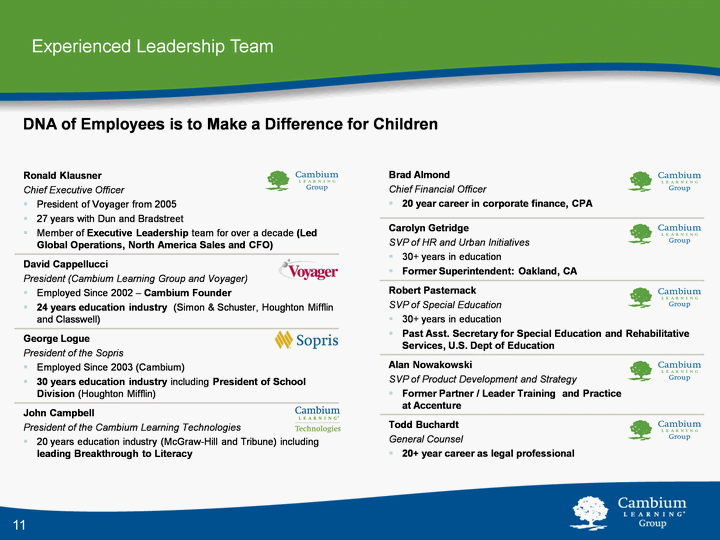
| 11 Experienced Leadership Team Ronald KlausnerChief Executive OfficerPresident of Voyager from 200527 years with Dun and BradstreetMember of Executive Leadership team for over a decade (Led Global Operations, North America Sales and CFO) David CappellucciPresident (Cambium Learning Group and Voyager)Employed Since 2002 - Cambium Founder24 years education industry (Simon & Schuster, Houghton Mifflin and Classwell) George LoguePresident of the SoprisEmployed Since 2003 (Cambium)30 years education industry including President of School Division (Houghton Mifflin) John CampbellPresident of the Cambium Learning Technologies20 years education industry (McGraw-Hill and Tribune) including leading Breakthrough to Literacy Brad AlmondChief Financial Officer20 year career in corporate finance, CPA Carolyn GetridgeSVP of HR and Urban Initiatives30+ years in education Former Superintendent: Oakland, CA Robert PasternackSVP of Special Education30+ years in educationPast Asst. Secretary for Special Education and Rehabilitative Services, U.S. Dept of Education Alan NowakowskiSVP of Product Development and StrategyFormer Partner / Leader Training and Practice at Accenture Todd BuchardtGeneral Counsel20+ year career as legal professional DNA of Employees is to Make a Difference for Children 17 |
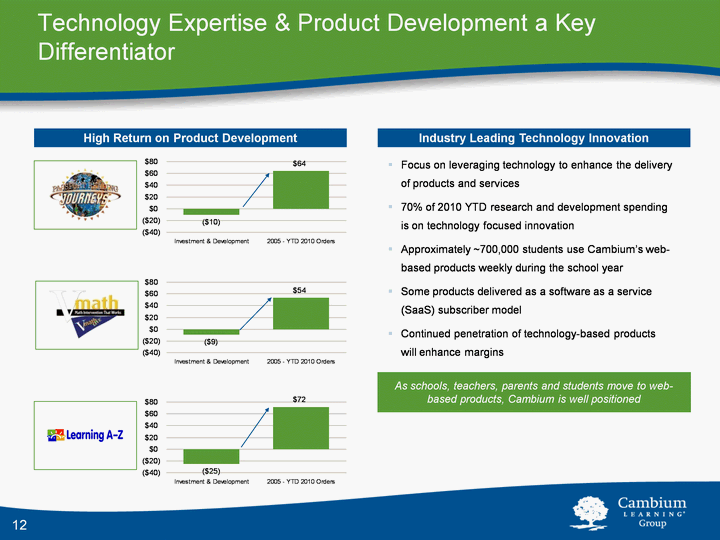
| As schools, teachers, parents and students move to web- based products, Cambium is well positioned Technology Expertise & Product Development a Key Differentiator 12 High Return on Product Development Industry Leading Technology Innovation Focus on leveraging technology to enhance the delivery of products and services70% of 2010 YTD research and development spending is on technology focused innovationApproximately ~700,000 students use Cambium's web- based products weekly during the school yearSome products delivered as a software as a service (SaaS) subscriber modelContinued penetration of technology-based products will enhance margins 18 |
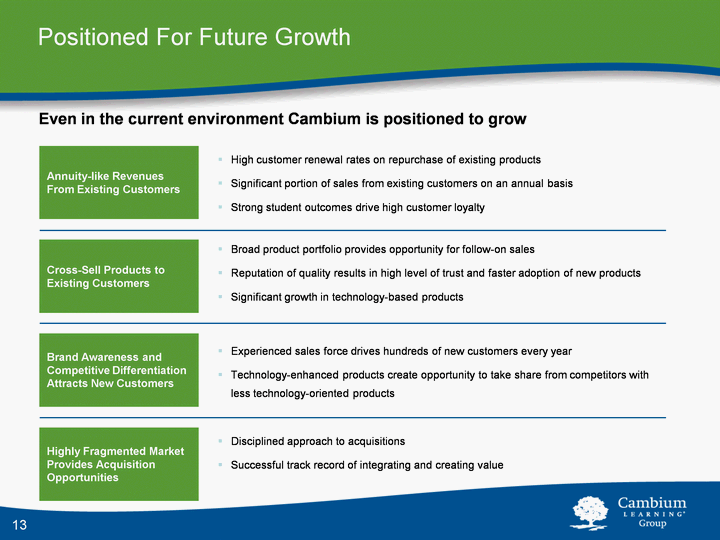
| Annuity-like Revenues From Existing Customers Positioned For Future Growth 13 High customer renewal rates on repurchase of existing productsSignificant portion of sales from existing customers on an annual basisStrong student outcomes drive high customer loyalty 18 Even in the current environment Cambium is positioned to grow Cross-Sell Products to Existing Customers Broad product portfolio provides opportunity for follow-on salesReputation of quality results in high level of trust and faster adoption of new productsSignificant growth in technology-based products Brand Awareness and Competitive Differentiation Attracts New Customers Experienced sales force drives hundreds of new customers every yearTechnology-enhanced products create opportunity to take share from competitors with less technology-oriented products Highly Fragmented Market Provides Acquisition Opportunities Disciplined approach to acquisitionsSuccessful track record of integrating and creating value |

| Funding Environment Update 20 |
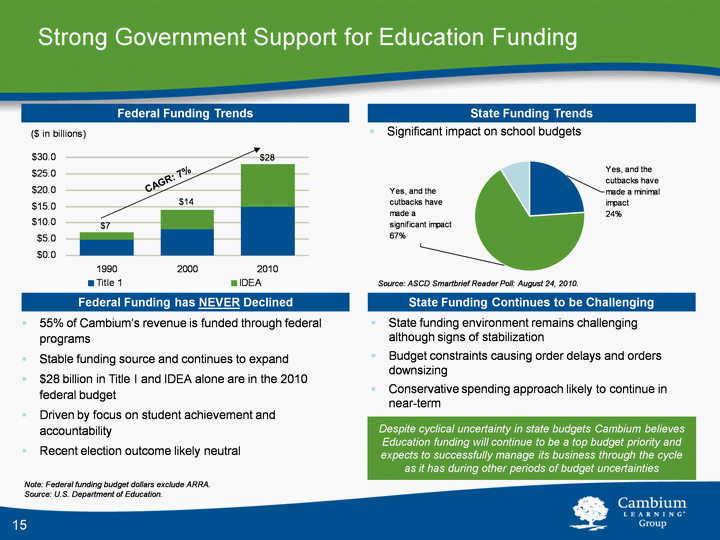
| 15 Note: Federal funding budget dollars exclude ARRA. Source: U.S. Department of Education. Strong Government Support for Education Funding 55% of Cambium's revenue is funded through federal programsStable funding source and continues to expand$28 billion in Title I and IDEA alone are in the 2010 federal budgetDriven by focus on student achievement and accountabilityRecent election outcome likely neutral Federal Funding has NEVER Declined State funding environment remains challenging although signs of stabilizationBudget constraints causing order delays and orders downsizingConservative spending approach likely to continue in near-term State Funding Continues to be Challenging State Funding Trends Title 1 IDEA 1990 4.8 2.4 2000 8 6 2010 15 13 Federal Funding Trends CAGR: 7% $7 $14 $28 Significant impact on school budgets Source: ASCD Smartbrief Reader Poll: August 24, 2010. Despite cyclical uncertainty in state budgets Cambium believes Education funding will continue to be a top budget priority and expects to successfully manage its business through the cycle as it has during other periods of budget uncertainties 13 |
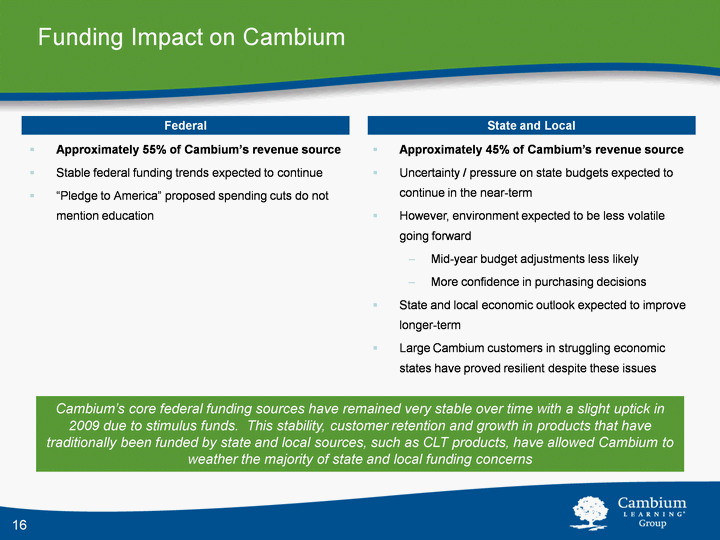
| 16 Approximately 55% of Cambium's revenue sourceStable federal funding trends expected to continue"Pledge to America" proposed spending cuts do not mention education Funding Impact on Cambium 21 Federal State and Local Approximately 45% of Cambium's revenue sourceUncertainty / pressure on state budgets expected to continue in the near-termHowever, environment expected to be less volatile going forwardMid-year budget adjustments less likelyMore confidence in purchasing decisionsState and local economic outlook expected to improve longer-termLarge Cambium customers in struggling economic states have proved resilient despite these issues Cambium's core federal funding sources have remained very stable over time with a slight uptick in 2009 due to stimulus funds. This stability, customer retention and growth in products that have traditionally been funded by state and local sources, such as CLT products, have allowed Cambium to weather the majority of state and local funding concerns |
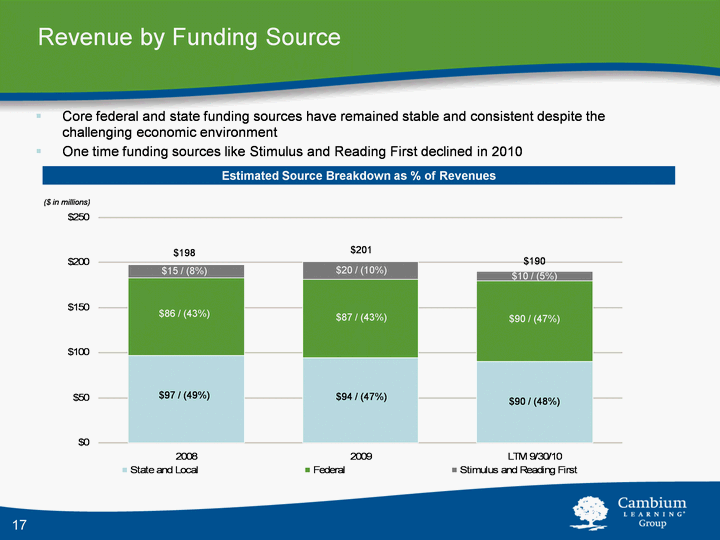
| State and Local Federal Stimulus and Reading First G&A 2008 97 86 15 27.556 2009 94 87 20 27.205 LTM 9/30/10 90 90 10 20.666 17 Revenue by Funding Source Estimated Source Breakdown as % of Revenues Core federal and state funding sources have remained stable and consistent despite the challenging economic environmentOne time funding sources like Stimulus and Reading First declined in 2010 $198 $201 $190 24 ($ in millions) $10 / (5%) $90 / (47%) $90 / (48%) $20 / (10%) $87 / (43%) $94 / (47%) $15 / (8%) $86 / (43%) $97 / (49%) |
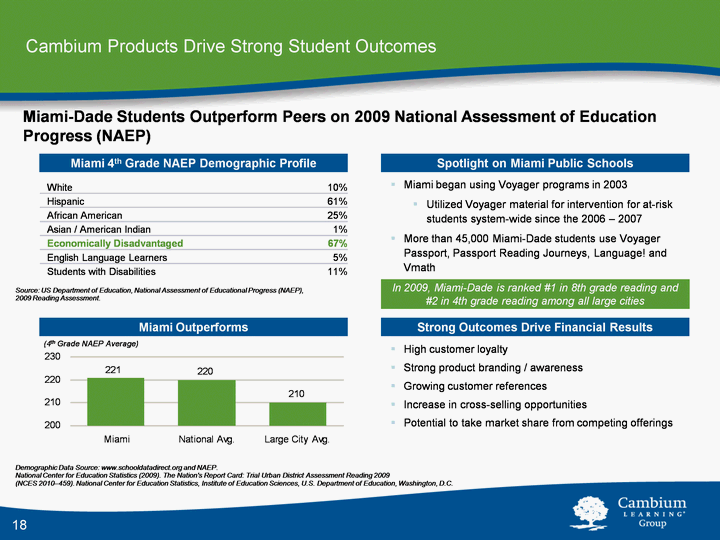
| High customer loyaltyStrong product branding / awarenessGrowing customer referencesIncrease in cross-selling opportunitiesPotential to take market share from competing offerings Demographic Data Source: www.schooldatadirect.org and NAEP.National Center for Education Statistics (2009). The Nation's Report Card: Trial Urban District Assessment Reading 2009 (NCES 2010-459). National Center for Education Statistics, Institute of Education Sciences, U.S. Department of Education, Washington, D.C. Cambium Products Drive Strong Student Outcomes Strong Outcomes Drive Financial Results Miami Outperforms Series 2 Series 3 Series 4 Series 5 Series 6 Series 7 Series 8 Miami 221 1100 233 3961 2876 1297 466 267 National Avg. 220 1100 269 3691 2876 1027 1333 303 Large City Avg. 210 White 10% Hispanic 61% African American 25% Asian / American Indian 1% Economically Disadvantaged 67% English Language Learners 5% Students with Disabilities 11% Miami 4th Grade NAEP Demographic Profile Miami-Dade Students Outperform Peers on 2009 National Assessment of Education Progress (NAEP) Miami began using Voyager programs in 2003Utilized Voyager material for intervention for at-risk students system-wide since the 2006 - 2007More than 45,000 Miami-Dade students use Voyager Passport, Passport Reading Journeys, Language! and Vmath Spotlight on Miami Public Schools (4th Grade NAEP Average) 18 In 2009, Miami-Dade is ranked #1 in 8th grade reading and #2 in 4th grade reading among all large cities 19 Source: US Department of Education, National Assessment of Educational Progress (NAEP), 2009 Reading Assessment. |
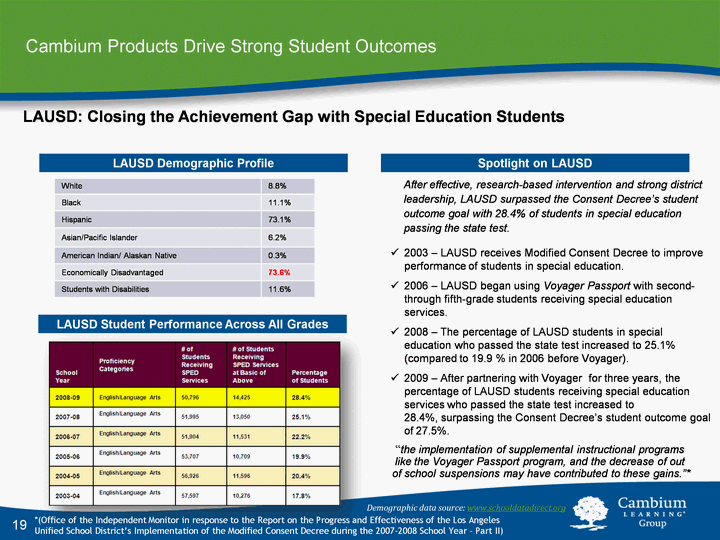
| Cambium Products Drive Strong Student Outcomes LAUSD Student Performance Across All Grades LAUSD Demographic Profile LAUSD: Closing the Achievement Gap with Special Education Students After effective, research-based intervention and strong district leadership, LAUSD surpassed the Consent Decree's student outcome goal with 28.4% of students in special education passing the state test.2003 - LAUSD receives Modified Consent Decree to improve performance of students in special education.2006 - LAUSD began using Voyager Passport with second- through fifth-grade students receiving special education services. 2008 - The percentage of LAUSD students in special education who passed the state test increased to 25.1% (compared to 19.9 % in 2006 before Voyager).2009 - After partnering with Voyager for three years, the percentage of LAUSD students receiving special education services who passed the state test increased to 28.4%, surpassing the Consent Decree's student outcome goal of 27.5%. Spotlight on LAUSD 19 19 White 8.8% Black 11.1% Hispanic 73.1% Asian/Pacific Islander 6.2% American Indian/ Alaskan Native 0.3% Economically Disadvantaged 73.6% Students with Disabilities 11.6% "the implementation of supplemental instructional programs like the Voyager Passport program, and the decrease of out of school suspensions may have contributed to these gains."* *(Office of the Independent Monitor in response to the Report on the Progress and Effectiveness of the Los Angeles Unified School District's Implementation of the Modified Consent Decree during the 2007-2008 School Year - Part II) Demographic data source: www.schooldatadirect.org |
| Financial Overview 20 |
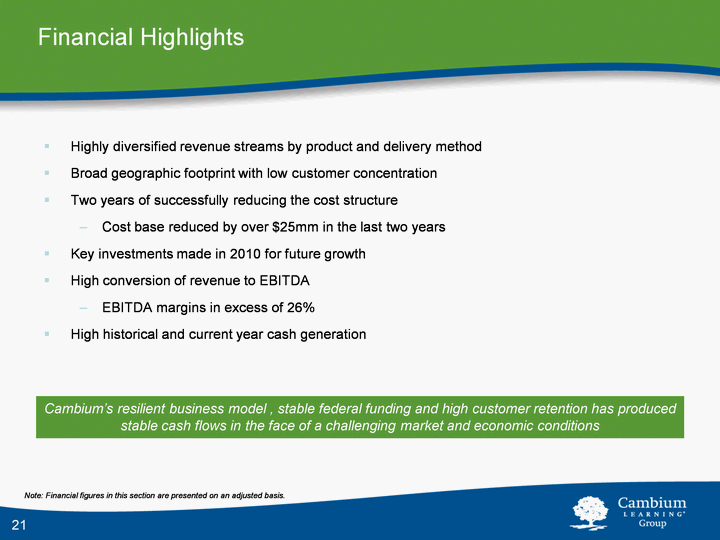
| 21 Highly diversified revenue streams by product and delivery methodBroad geographic footprint with low customer concentrationTwo years of successfully reducing the cost structureCost base reduced by over $25mm in the last two yearsKey investments made in 2010 for future growth High conversion of revenue to EBITDAEBITDA margins in excess of 26%High historical and current year cash generation Financial Highlights Cambium's resilient business model , stable federal funding and high customer retention has produced stable cash flows in the face of a challenging market and economic conditions 21 Note: Financial figures in this section are presented on an adjusted basis. |
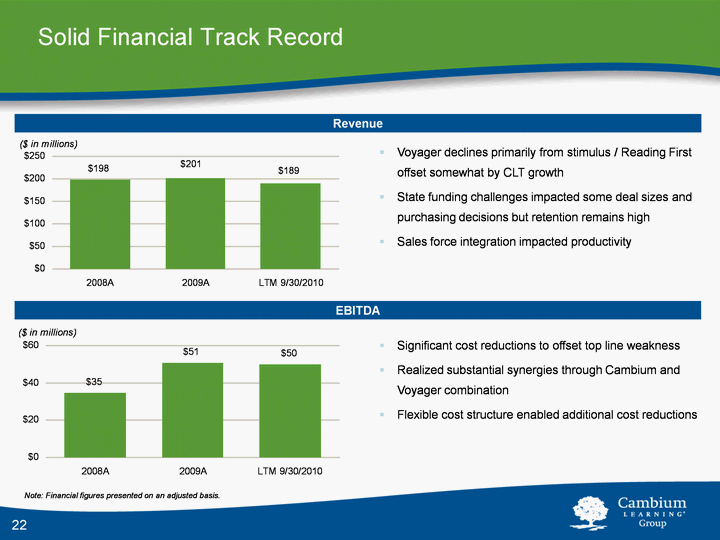
| Voyager declines primarily from stimulus / Reading First offset somewhat by CLT growthState funding challenges impacted some deal sizes and purchasing decisions but retention remains highSales force integration impacted productivity 22 Solid Financial Track Record July 2010 Projections Series 3 Series 4 Series 5 Series 6 Series 7 Series 8 2008A 198.3 269 3691 2876 1027 1333 303 2009A 201.2 LTM 9/30/2010 189.4 Revenue EBITDA October 2010 Projections Series 3 Series 4 Series 5 Series 6 Series 7 Series 8 2008A 34.6 269 3691 2876 1027 1333 303 2009A 50.8 LTM 9/30/2010 49.9 Significant cost reductions to offset top line weaknessRealized substantial synergies through Cambium and Voyager combinationFlexible cost structure enabled additional cost reductions 22 Note: Financial figures presented on an adjusted basis. |
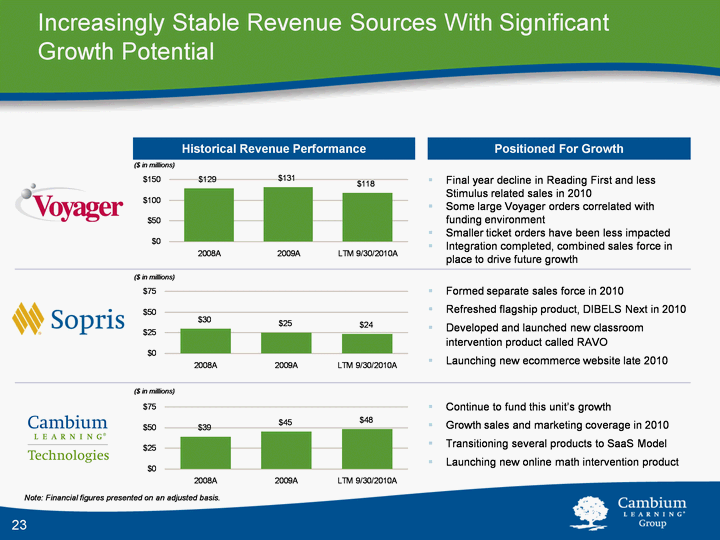
| 23 Increasingly Stable Revenue Sources With Significant Growth Potential Historical Revenue Performance Final year decline in Reading First and less Stimulus related sales in 2010 Some large Voyager orders correlated with funding environment Smaller ticket orders have been less impacted Integration completed, combined sales force in place to drive future growth Positioned For Growth Formed separate sales force in 2010Refreshed flagship product, DIBELS Next in 2010Developed and launched new classroom intervention product called RAVOLaunching new ecommerce website late 2010 Continue to fund this unit's growth Growth sales and marketing coverage in 2010Transitioning several products to SaaS ModelLaunching new online math intervention product ($ in millions) ($ in millions) ($ in millions) 23 Note: Financial figures presented on an adjusted basis. |
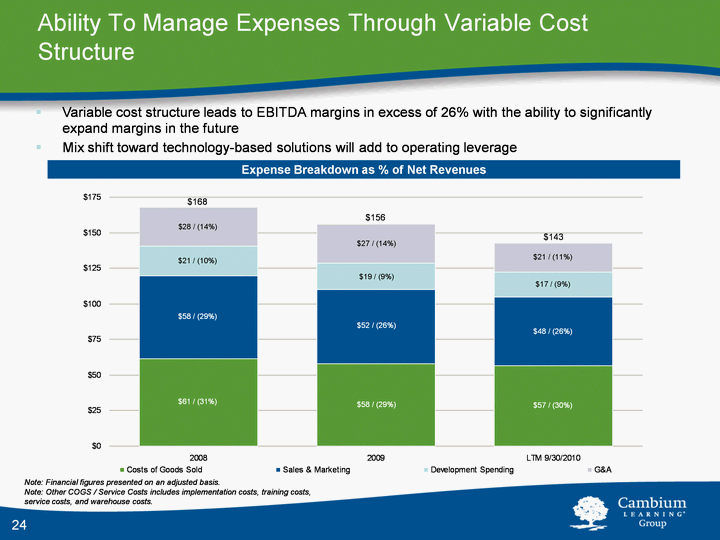
| 24 Ability To Manage Expenses Through Variable Cost Structure Expense Breakdown as % of Net Revenues Note: Financial figures presented on an adjusted basis. Note: Other COGS / Service Costs includes implementation costs, training costs, service costs, and warehouse costs. Variable cost structure leads to EBITDA margins in excess of 26% with the ability to significantly expand margins in the futureMix shift toward technology-based solutions will add to operating leverage $168 $156 $143 24 |
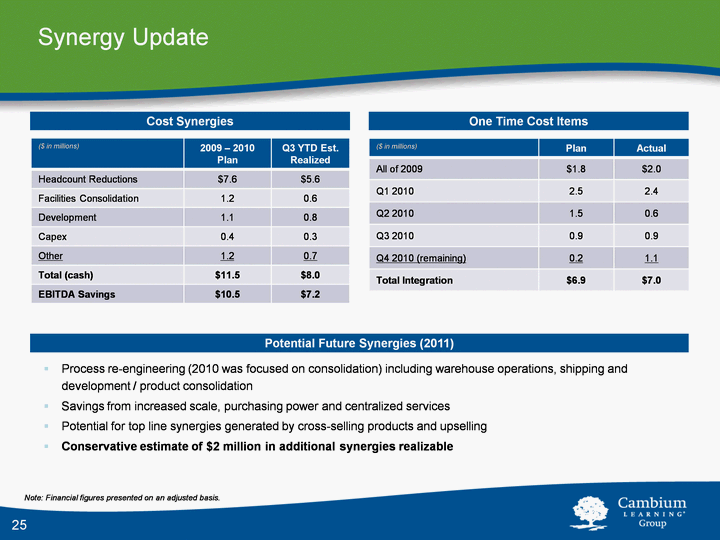
| 25 Synergy Update ($ in millions) 2009 - 2010 Plan Q3 YTD Est. Realized Headcount Reductions $7.6 $5.6 Facilities Consolidation 1.2 0.6 Development 1.1 0.8 Capex 0.4 0.3 Other 1.2 0.7 Total (cash) $11.5 $8.0 EBITDA Savings $10.5 $7.2 Cost Synergies Potential Future Synergies (2011) Process re-engineering (2010 was focused on consolidation) including warehouse operations, shipping and development / product consolidationSavings from increased scale, purchasing power and centralized servicesPotential for top line synergies generated by cross-selling products and upsellingConservative estimate of $2 million in additional synergies realizable One Time Cost Items ($ in millions) Plan Actual All of 2009 $1.8 $2.0 Q1 2010 2.5 2.4 Q2 2010 1.5 0.6 Q3 2010 0.9 0.9 Q4 2010 (remaining) 0.2 1.1 Total Integration $6.9 $7.0 25 Note: Financial figures presented on an adjusted basis. |
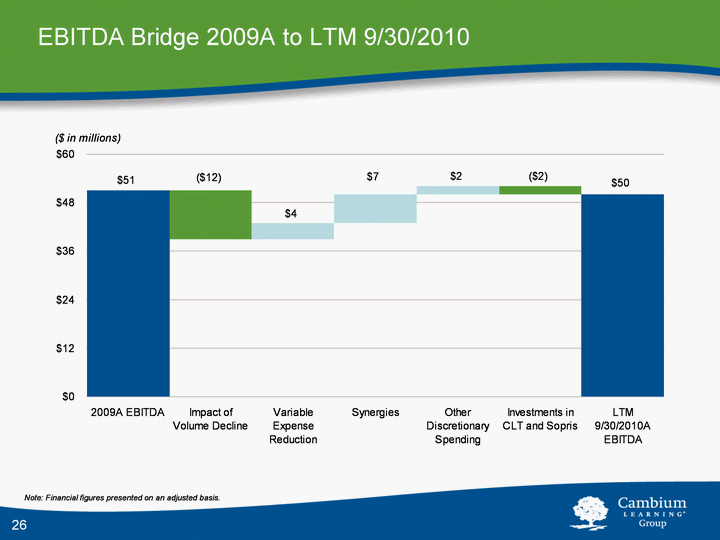
| 26 EBITDA Bridge 2009A to LTM 9/30/2010 Start Length Label 2009A EBITDA 0 51 51 Impact of Volume Decline 39 12 -12 Variable Expense Reduction 39 4 4 Synergies 43 7 7 Other Discretionary Spending 50 2 2 Investments in CLT and Sopris 50 2 -2 LTM 9/30/2010A EBITDA 0 50 50 26 Note: Financial figures presented on an adjusted basis. |
