Attached files
| file | filename |
|---|---|
| 8-K - FORM 8-K - UNITED AIRLINES, INC. | d8k.htm |
 Hudson Securities
2010 Airline Conference
United Continental Holdings
December 8, 2010
Exhibit 99.1 |
| Safe
Harbor Statement Certain statements included in this presentation are
forward-looking and thus reflect our current expectations and beliefs with
respect to certain current and future events and financial performance. Such forward-looking statements are and will be
subject to many risks and uncertainties relating to our operations and business
environment that may cause actual results to differ materially from any future
results expressed or implied in such forward-looking statements. Words such as
“expects,”
“will,”
“plans,”
“anticipates,”
“indicates,”
“believes,”
“forecast,”
“guidance,”
“outlook”
and similar expressions
are intended to identify forward-looking statements. Additionally,
forward-looking statements include statements which do not relate solely
to historical facts, such as statements which identify uncertainties or trends, discuss the possible future
effects of current known trends or uncertainties, or which indicate that the future
effects of known trends or uncertainties cannot be predicted, guaranteed or
assured. All forward-looking statements in this presentation are based upon information
available to us on the date of this presentation. We undertake no obligation to
publicly update or revise any forward-looking statement, whether as a
result of new information, future events, changed circumstances or otherwise, except as required by
applicable law. Our actual results could differ materially from these
forward-looking statements due to numerous factors including, without
limitation, the following: our ability to comply with the terms of our various financing arrangements; the
costs and availability of financing; our ability to maintain adequate liquidity; our
ability to execute our operational plans; our ability to control our costs,
including realizing benefits from our resource optimization efforts, cost reduction initiatives and
fleet replacement programs; our ability to utilize our net operating losses; our
ability to attract and retain customers; demand for transportation in the
markets in which we operate; an outbreak of a disease that affects travel demand or travel behavior;
demand
for
travel
and
the
impact
that
global
economic
conditions
have
on
customer
travel
patterns;
excessive
taxation
and
the inability to offset future taxable income; general economic conditions (including
interest rates, foreign currency exchange rates, investment or credit market
conditions, crude oil prices, costs of aviation fuel and energy refining capacity
in relevant markets); our ability to cost-effectively hedge against increases in
the price of aviation fuel; any potential realized or unrealized gains or
losses related to fuel or currency hedging programs; the effects of any hostilities, act of war or
terrorist
attack;
the
ability
of
other
air
carriers
with
whom
we
have
alliances
or
partnerships
to
provide
the
services
contemplated by the respective arrangements with such carriers; the costs and
availability of aviation and other insurance; the costs associated with
security measures and practices; industry consolidation or changes in airline alliances;
competitive pressures on pricing and on demand; our capacity decisions and the
capacity decisions of our competitors; U.S. or foreign governmental
legislation, regulation and other actions (including open skies agreements); labor costs; our ability
to maintain satisfactory labor relations and the results of the collective bargaining
agreement process with our union groups; any disruptions to operations due to
any potential actions by our labor groups; weather conditions; the possibility
that expected merger synergies will not be realized or will not be realized within
the expected time period; and other risks and uncertainties set forth under
Item 1A., Risk Factors of Annual Report on Form 10-K, as well as other risks and
uncertainties
set
forth
from
time
to
time
in
the
reports
we
file
with
the
SEC.
Consequently,
forward-looking
statements
should not be regarded as representations or warranties by us that such matters will
be realized. 2 |
 Jeff
Smisek President and Chief Executive Officer
United Continental Holdings, Inc. |
 United
– The world’s leading airline
4
Unparalleled Global Network
Strong Partnerships
Industry Leading Products & Services
Exceptional Coworkers |
 26
Destinations 13 Countries
62 Average Daily Departures
Trans-Pacific Service
69 Destinations
24 Countries
156 Average Daily Departures
Latin American & Caribbean Service
34 Destinations
21 Countries
74 Average Daily Departures
Trans-Atlantic Service
Global network with unsurpassed scope
5
Figures for destinations with regular service in 2010
Rankings by ASMs
as of TME 3Q10
Source: OAG, Full Year 2010
#1 across the
Pacific
#1 in US /
Canada
#2 to Latin
America
#2 across the
Atlantic |
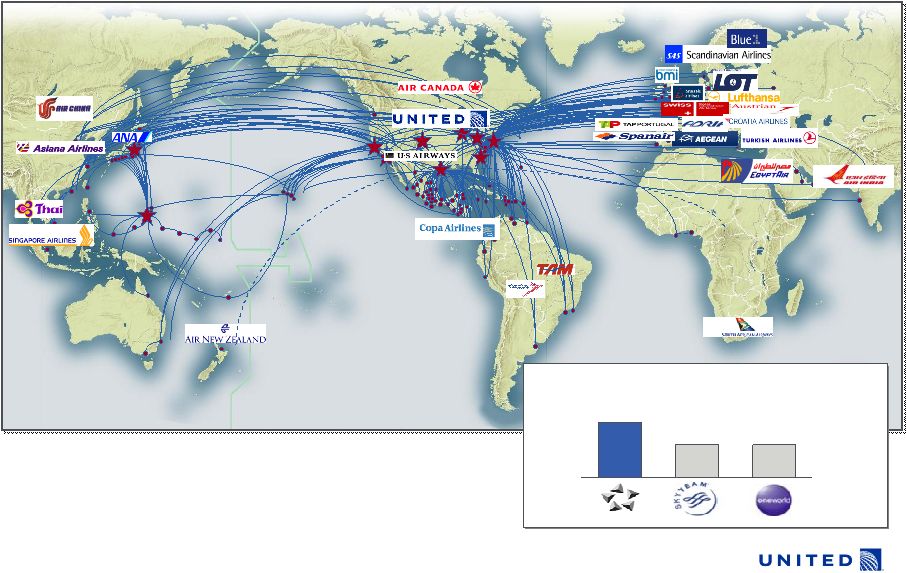 6
16%
16%
27%
Star –
The world’s leading alliance
Global Capacity
Share
By Alliance
* Future members
*
* |
 Industry leading loyalty program for customers
•
2011 program alignment is first step
towards consolidating loyalty of most
valued customers
•
Loyalty program of choice in key metro
areas
•
Vast array of travel and retail partners for
earning miles
•
Broad redemption opportunities on our
combined network and partners
7 |
  United’s goal is to be the airline of choice for the global
business traveler
8 |
      Employees
with a shared vision for the future 9 |
 Zane
Rowe Executive Vice President and CFO
United Continental Holdings, Inc. |
 Strong financial performance
40
10
20
30
0
Consolidated Revenue –
TME 3Q10
Note: Excludes specials, one-time items and non-cash MTM hedge
gains/losses. GAAP to non-GAAP reconciliation included in the
appendix. Source: Earnings releases and SEC filings.
-3.4%
3.5%
3.5%
3.9%
7.0%
Pre-tax Income Margin –
TME 3Q10
And $1.0 -
$1.2 billion of net annual synergies expected
11
$B |
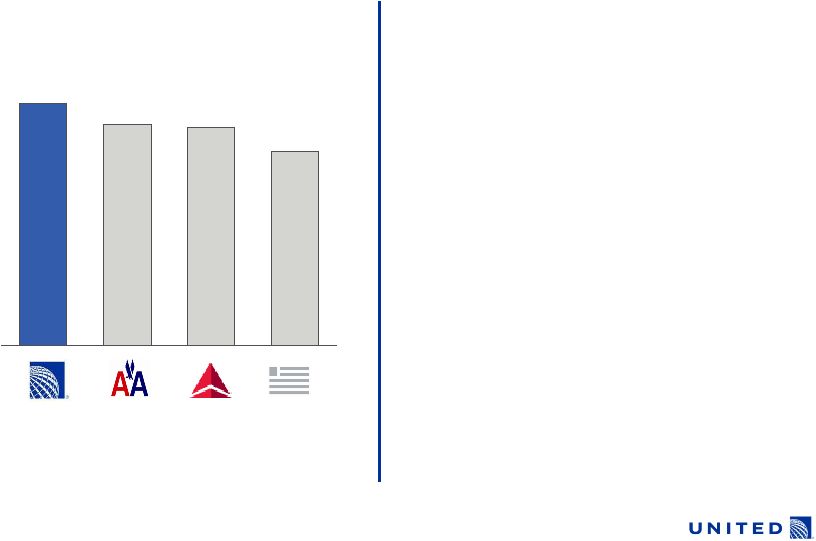 12
Industry leading revenue premium
9.26
10.38
10.52
11.52
Consolidated PRASM –
TME 3Q10
Consolidated PRASM numbers adjusted for length of haul.
Source: Earnings releases and SEC filings.
•
Carrier of choice for business and
premium travelers
•
Well diversified global network
•
Award winning products and services
and
industry leading operational
performance |
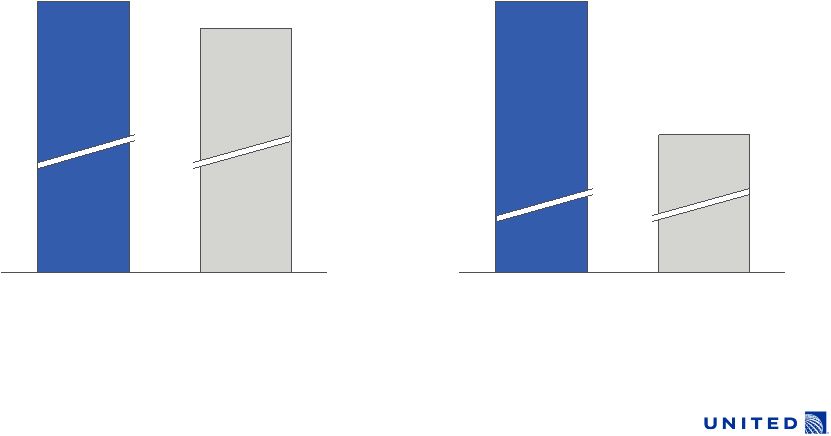 Strong
operational performance is the foundation for revenue performance and customer
satisfaction YTD October 2010 Domestic Mainline
Completion Factor
YTD October 2010 Domestic Mainline
Arrival :14
13
Industry Avg.
ex. UAL
98.2%
UAL
1
98.9%
Industry Avg.
ex. UAL
78.5%
UAL
1
82.3%
1. UAL operational performance calculated as weighted average of
United Airlines and Continental Airlines.
Source:
DOT
and
Exchange
data
for
completion
factor
and
Flightstats.com
for
A:14
information. |
 Range
737 & A320 Families
B757
B747
B777
B767
Combined fleet permits us to match the right aircraft to the
right markets
14
•
Current Aircraft:
•
Optimized Aircraft:
•
Results:
–
69 additional seats per departure
–
Better able to capture strong cargo demand
–
Downgauge
UA hub-to-hub flying (B767 to B757)
Houston-Lima
Starting February 2011
UA B767
Aircraft Range and Capacity
(Current Mainline Fleet)
CO B757 |
 United’s network strength and business traveler focus provide
additional revenue opportunities
15
•
Unparalleled global
reach and
concentration in key
business centers
•
Little overlap of
existing corporate
accounts
•
Well positioned for
corporate account
expansion
US Census Bureau populations estimates as of July 1, 2009
|
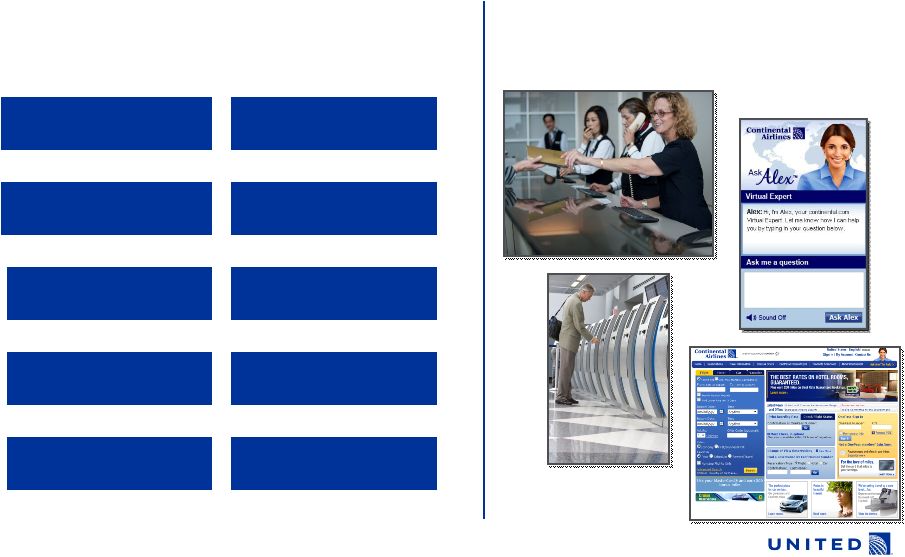   Expanding ancillary revenue streams
16
Creating products and services our
customers want and are willing to purchase
1
st
and 2
nd
Checked
Baggage Fees
Buy-on-Board Food
Premium Wines
for Purchase
Premium Cabin Upsell
(First & Business Class)
Preferred Economy
Seating
Premier®
For A Day
Premier Line
Improving when and how we offer these
products and services to our customers
Award Accelerator
Lounge Access
(One-time Pass)
Door-to-Door Baggage |
 Merger
provides near-term cost reduction opportunities 17
Elimination of Redundancies
Economies of Scale
•
Improve airport efficiencies
•
Distribution cost reductions
•
Immediate procurement
opportunities
•
Streamline corporate overhead
•
Co-locate airport facilities
–
~25 expected by 1H 2011, up to 50 by
YE 2011
•
Reduce IT overlap
Expect to achieve more than a third of cost related
synergies in 2011 |
 Real
US GDP Forecast (Year-Over-Year % Change)
3.0%
2012
2011
2.4%
2010
2.8%
Global Insight Estimate –
November
2010
18
United remains committed to capacity discipline
Consolidated
1.0% -
2.0%
International
3.0% -
4.0%
Domestic
(0.5)% -
0.5%
2011 Capacity Guidance
Guidance Range
In line
with
industry |
 19
Strong liquidity position and focus on strengthening the
balance sheet
Third Quarter Liquidity
(Percent of Last Twelve Months Revenue)
17.2%
17.8%
21.1%
27.7%
Liquidity
Balance (In $B)
$9.1
$4.8 $5.6 $2.0
1.
Liquidity is calculated based on 3Q10 ending unrestricted cash balance and TME
3Q10 Revenue. 2.
Net Liquidity is calculated as 3Q10 ending cash balance less 2011 debt and capital
lease obligations. Net Liquidity (Liquidity Less Obligations)
(Percent of Last Twelve Months Revenue)
9.2%
9.9%
14.2%
20.5%
Expect to end 2010 with between $8.6B and $8.7B in
unrestricted cash and short-term investments
1
2 |
 Jeff
Smisek President and Chief Executive Officer
United Continental Holdings, Inc. |
 21
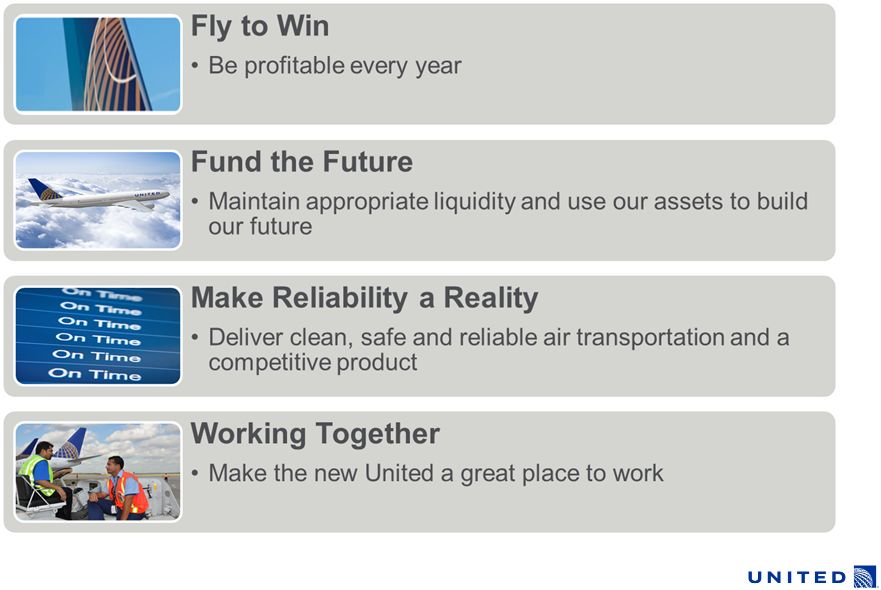
Go Forward Plan |
 22
GAAP To Non-GAAP Reconciliation
Twelve Months Ended
9/30/2010
PRE-TAX MARGIN
$ In Millions
Earnings before income taxes
1,010
Add: impairments, special items and other charges and non-cash, net
mark- to-market gains/losses
267
Adjusted Pre-Tax Income
1,277
Revenue
32,912
Adjusted Pre-Tax Margin
3.9% |