Attached files
| file | filename |
|---|---|
| 8-K - CURRENT REPORT OF MATERIAL EVENTS OR CORPORATE CHANGES - EAGLE ROCK ENERGY PARTNERS L P | a10-22552_18k.htm |
Exhibit 99.1
|
|
EAGLE ROCK ENERGY PARTNERS, L.P. Eagle Rock Energy Partners, L.P. “Moving Ahead” Wells Fargo Securities 9th Annual Pipeline/MLP Symposium December 2010 |
|
|
2 This document may include "forward-looking statements." All statements, other than statements of historical facts, included in this press release that address activities, events or developments that the Partnership expects, believes or anticipates will or may occur in the future are forward-looking statements and speak only as of the date on which such statement is made. These statements are based on certain assumptions made by the Partnership based on its experience and perception of historical trends, current conditions, expected future developments and other factors it believes are appropriate under the circumstances. Such statements are subject to a number of assumptions, risks and uncertainties, many of which are beyond the control of the Partnership. These include risks related to volatility of commodity prices; market demand for natural gas and natural gas liquids; the effectiveness of the Partnership's hedging activities; the Partnership's ability to retain key customers; the Partnership's ability to continue to obtain new sources of natural gas supply; the availability of local, intrastate and interstate transportation systems and other facilities to transport natural gas and natural gas liquids; competition in the oil and gas industry; the Partnership's ability to obtain credit and access the capital markets; general economic conditions; and the effects of government regulations and policies. Should one or more of these risks or uncertainties occur, or should underlying assumptions prove incorrect, the Partnership's actual results and plans could differ materially from those implied or expressed by any forward-looking statements. The Partnership assumes no obligation to update any forward-looking statement as of any future date. For a detailed list of the Partnership's risk factors, please consult the Partnership's Form 10-K, filed with the Securities and Exchange Commission ("SEC") for the year ended December 31, 2009, and the Partnership's Forms 10-Q, filed with the SEC for subsequent quarters, as well as any other public filings and press releases. Forward Looking Statements |
|
|
3 Joseph A. Mills Chairman & Chief Executive Officer Jeffrey P. Wood Senior Vice President & Chief Financial Officer Adam K. Altsuler Senior Financial Analyst Management Representatives |
|
|
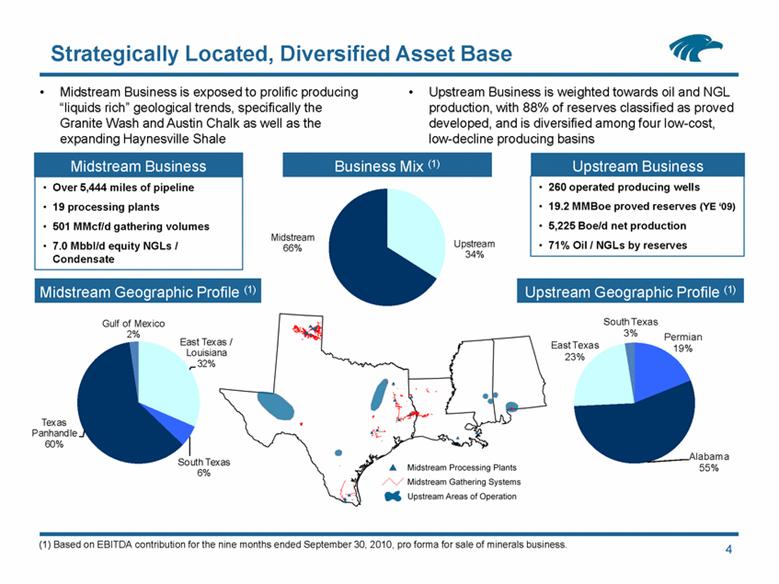
Midstream Business Strategically Located, Diversified Asset Base 4 Over 5,444 miles of pipeline 19 processing plants 501 MMcf/d gathering volumes 7.0 Mbbl/d equity NGLs / Condensate Midstream Business is exposed to prolific producing “liquids rich” geological trends, specifically the Granite Wash and Austin Chalk as well as the expanding Haynesville Shale Upstream Business is weighted towards oil and NGL production, with 88% of reserves classified as proved developed, and is diversified among four low-cost, low-decline producing basins Upstream Business 260 operated producing wells 19.2 MMBoe proved reserves (YE ‘09) 5,225 Boe/d net production 71% Oil / NGLs by reserves Business Mix (1) Upstream Geographic Profile (1) Midstream Geographic Profile (1) (1) Based on EBITDA contribution for the nine months ended September 30, 2010, pro forma for sale of minerals business. Permian 19% Alabama 55% East Texas 23% South Texas 3% East Texas / Louisiana 32% South Texas 6% Texas Panhandle 60% Gulf of Mexico 2% |
|
|
Moving Ahead: Creating Opportunity from Challenge 5 During the third quarter of 2010, Eagle Rock completed the final aspects of its recapitalization, which delivered a number of benefits: Greater financial flexibility More unitholder-friendly governance structure Simplified ownership structure to include only common units and warrants convertible to common units Acquired general partner entities Reconstituted and expanded board to include a majority of independent directors Provide for election of independent directors Structural modifications to enhance returns to common units in growth scenarios (elimination of incentive distribution rights) Continued support from Natural Gas Partners as largest unitholder Initial proposal received from NGP Amended Global Transaction Agreement executed Received unitholder approval; completed Sale of Minerals Business; eliminated sub units/IDRs Launched and completed Rights Offering Exercised GP Acquisition Option; announced intent to recommend $0.60/unit annualized by Q4 2010 Announced expectation to recommend $0.75/unit by Q4 2011 |
|
|
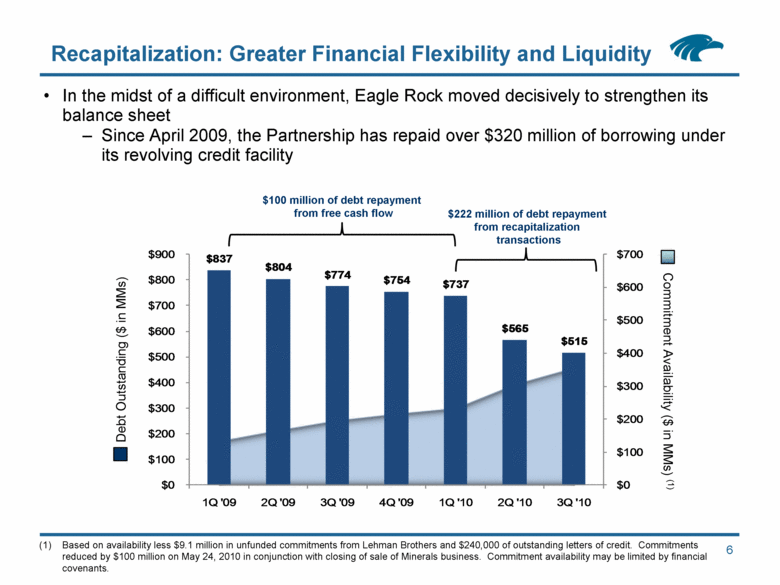
Recapitalization: Greater Financial Flexibility and Liquidity 6 In the midst of a difficult environment, Eagle Rock moved decisively to strengthen its balance sheet Since April 2009, the Partnership has repaid over $320 million of borrowing under its revolving credit facility $100 million of debt repayment from free cash flow $222 million of debt repayment from recapitalization transactions Debt Outstanding ($ in MMs) Commitment Availability ($ in MMs) (1) (1) Based on availability less $9.1 million in unfunded commitments from Lehman Brothers and $240,000 of outstanding letters of credit. Commitments reduced by $100 million on May 24, 2010 in conjunction with closing of sale of Minerals business. Commitment availability may be limited by financial covenants. $837 $804 $774 $754 $737 $565 $515 $0 $100 $200 $300 $400 $500 $600 $700 $0 $100 $200 $300 $400 $500 $600 $700 $800 $900 1Q '09 2Q '09 3Q '09 4Q '09 1Q '10 2Q '10 3Q '10 |
|
|
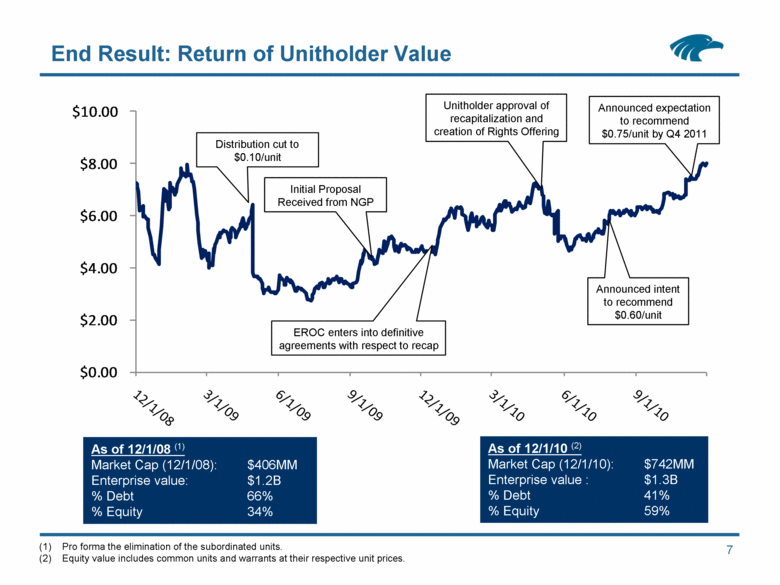
End Result: Return of Unitholder Value 7 Initial Proposal Received from NGP Unitholder approval of recapitalization and creation of Rights Offering EROC enters into definitive agreements with respect to recap Announced expectation to recommend $0.75/unit by Q4 2011 Distribution cut to $0.10/unit Announced intent to recommend $0.60/unit As of 12/1/08 (1) Market Cap (12/1/08): $406MM Enterprise value: $1.2B % Debt 66% % Equity 34% As of 12/1/10 (2) Market Cap (12/1/10): $742MM Enterprise value : $1.3B % Debt 41% % Equity 59% Pro forma the elimination of the subordinated units. Equity value includes common units and warrants at their respective unit prices. $0.00 $2.00 $4.00 $6.00 $8.00 $10.00 |
|
|
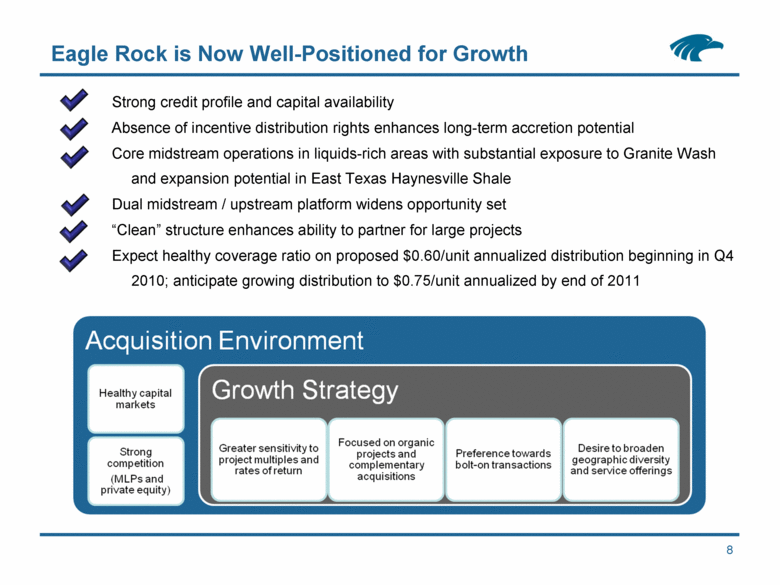
Eagle Rock is Now Well-Positioned for Growth 8 Strong credit profile and capital availability Absence of incentive distribution rights enhances long-term accretion potential Core midstream operations in liquids-rich areas with substantial exposure to Granite Wash and expansion potential in East Texas Haynesville Shale Dual midstream / upstream platform widens opportunity set “Clean” structure enhances ability to partner for large projects Expect healthy coverage ratio on proposed $0.60/unit annualized distribution beginning in Q4 2010; anticipate growing distribution to $0.75/unit annualized by end of 2011 |
|
|
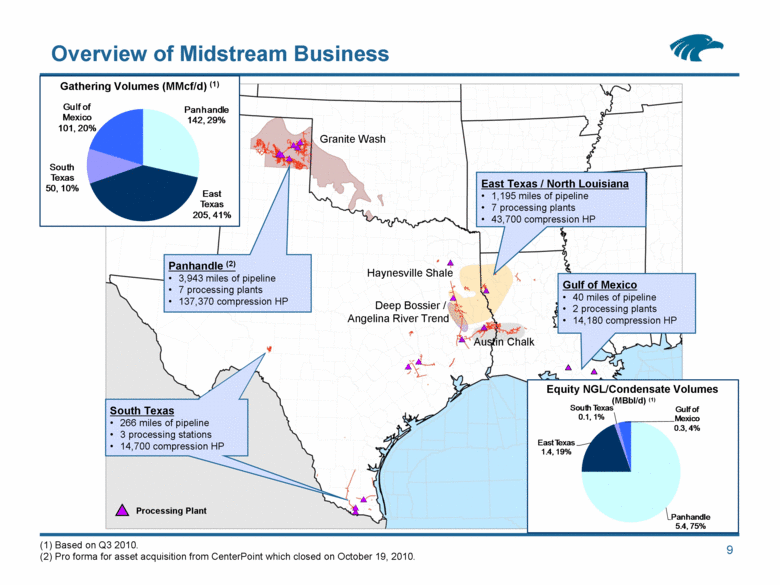
9 Overview of Midstream Business Panhandle (2) 3,943 miles of pipeline 7 processing plants 137,370 compression HP East Texas / North Louisiana 1,195 miles of pipeline 7 processing plants 43,700 compression HP Gulf of Mexico 40 miles of pipeline 2 processing plants 14,180 compression HP Processing Plant Haynesville Shale Austin Chalk Granite Wash South Texas 266 miles of pipeline 3 processing stations 14,700 compression HP Deep Bossier / Angelina River Trend (1) Based on Q3 2010. (2) Pro forma for asset acquisition from CenterPoint which closed on October 19, 2010. Equity NGL/Condensate Volumes (MBbl/d) (1) Gathering Volumes (MMcf/d) (1) Panhandle 5.4, 75% East Texas 1.4, 19% South Texas 0.1, 1% Gulf of Mexico 0.3, 4% Panhandle 142, 29% East Texas 205, 41% South Texas 50, 10% Gulf of Mexico 101, 20% |
|
|
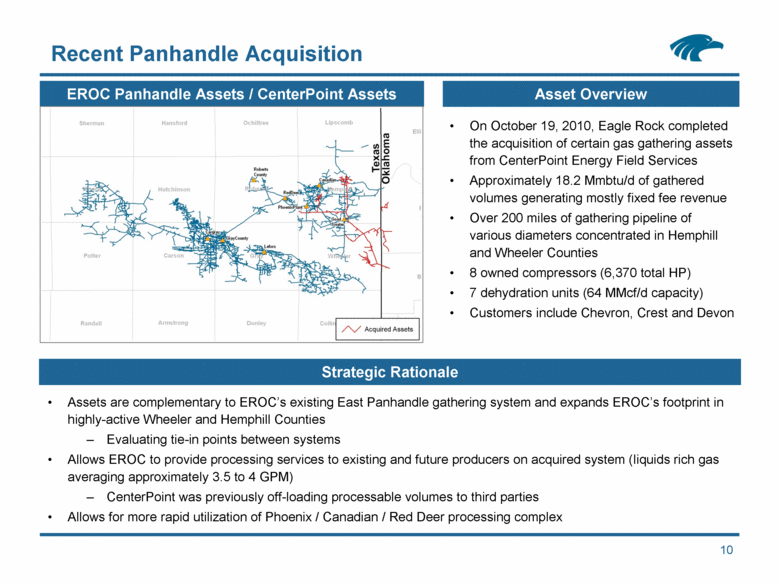
10 Recent Panhandle Acquisition On October 19, 2010, Eagle Rock completed the acquisition of certain gas gathering assets from CenterPoint Energy Field Services Approximately 18.2 Mmbtu/d of gathered volumes generating mostly fixed fee revenue Over 200 miles of gathering pipeline of various diameters concentrated in Hemphill and Wheeler Counties 8 owned compressors (6,370 total HP) 7 dehydration units (64 MMcf/d capacity) Customers include Chevron, Crest and Devon Asset Overview EROC Panhandle Assets / CenterPoint Assets Assets are complementary to EROC’s existing East Panhandle gathering system and expands EROC’s footprint in highly-active Wheeler and Hemphill Counties Evaluating tie-in points between systems Allows EROC to provide processing services to existing and future producers on acquired system (liquids rich gas averaging approximately 3.5 to 4 GPM) CenterPoint was previously off-loading processable volumes to third parties Allows for more rapid utilization of Phoenix / Canadian / Red Deer processing complex Strategic Rationale |
|
|
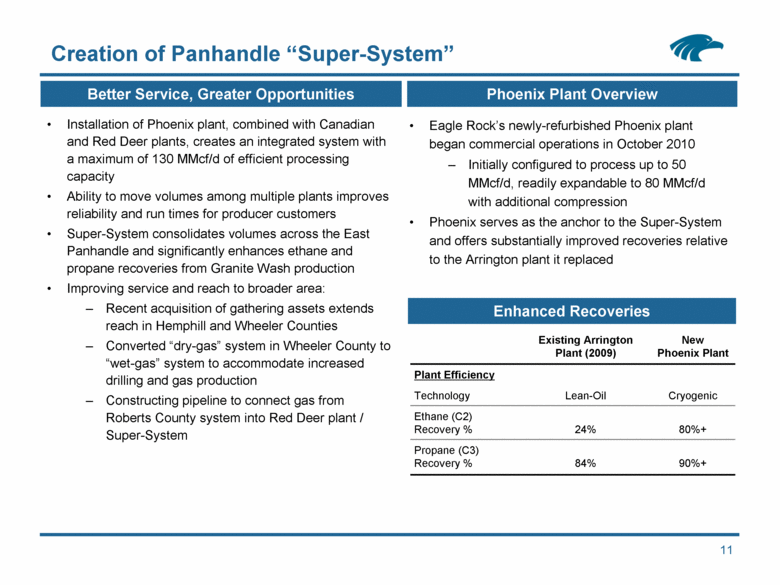
11 Creation of Panhandle “Super-System” Existing Arrington Plant (2009) New Phoenix Plant Plant Efficiency Technology Lean-Oil Cryogenic Ethane (C2) Recovery % 24% 80%+ Propane (C3) Recovery % 84% 90%+ Installation of Phoenix plant, combined with Canadian and Red Deer plants, creates an integrated system with a maximum of 130 MMcf/d of efficient processing capacity Ability to move volumes among multiple plants improves reliability and run times for producer customers Super-System consolidates volumes across the East Panhandle and significantly enhances ethane and propane recoveries from Granite Wash production Improving service and reach to broader area: Recent acquisition of gathering assets extends reach in Hemphill and Wheeler Counties Converted “dry-gas” system in Wheeler County to “wet-gas” system to accommodate increased drilling and gas production Constructing pipeline to connect gas from Roberts County system into Red Deer plant / Super-System Better Service, Greater Opportunities Enhanced Recoveries Phoenix Plant Overview Eagle Rock’s newly-refurbished Phoenix plant began commercial operations in October 2010 Initially configured to process up to 50 MMcf/d, readily expandable to 80 MMcf/d with additional compression Phoenix serves as the anchor to the Super-System and offers substantially improved recoveries relative to the Arrington plant it replaced |
|
|
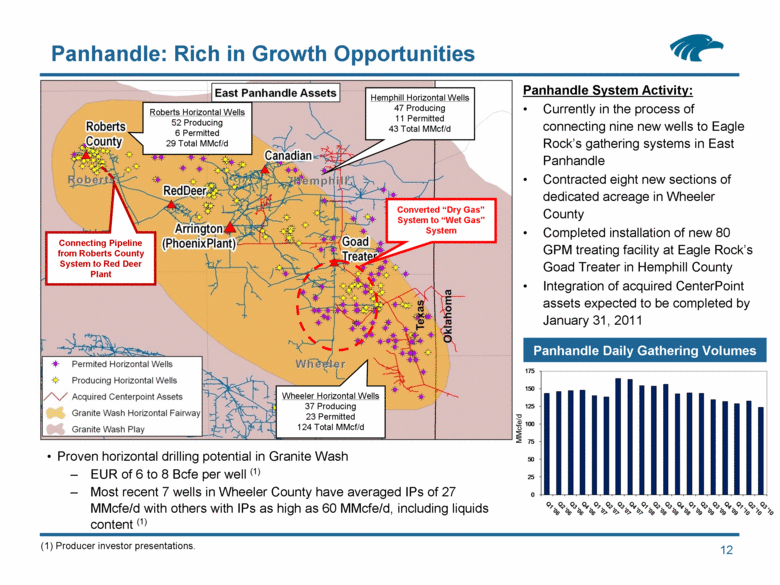
12 Panhandle: Rich in Growth Opportunities Hemphill Horizontal Wells 47 Producing 11 Permitted 43 Total MMcf/d Roberts Horizontal Wells 52 Producing 6 Permitted 29 Total MMcf/d Wheeler Horizontal Wells 37 Producing 23 Permitted 124 Total MMcf/d Panhandle System Activity: Currently in the process of connecting nine new wells to Eagle Rock’s gathering systems in East Panhandle Contracted eight new sections of dedicated acreage in Wheeler County Completed installation of new 80 GPM treating facility at Eagle Rock’s Goad Treater in Hemphill County Integration of acquired CenterPoint assets expected to be completed by January 31, 2011 Panhandle Daily Gathering Volumes MMcfe/d Converted “Dry Gas” System to “Wet Gas” System Proven horizontal drilling potential in Granite Wash EUR of 6 to 8 Bcfe per well (1) Most recent 7 wells in Wheeler County have averaged IPs of 27 MMcfe/d with others with IPs as high as 60 MMcfe/d, including liquids content (1) Connecting Pipeline from Roberts County System to Red Deer Plant (1) Producer investor presentations. 0 25 50 75 100 125 150 175 |
|
|
13 System Update: Austin Chalk: Large independents staking 20 potential sites dedicated to Eagle Rock Currently, three rigs running on acreage dedicated to Eagle Rock Last two producer wells reported average IP of approximately 16 MMcf/d Deep and Middle Bossier: Producers planning wildcats this year for the play – Middle Bossier IP’s in the 15-30 MMcf/d range Haynesville Shale: Continue to monitor drilling activity as it continues to move closer to our acreage Strategic Footprint in East Texas Source: SEC filings, industry investor presentations and DrillingInfo. Brookeland System Tyler County System East Texas Main Line Rosewood Bellebower Panola Sligo Indian Springs Brookeland |
|
|
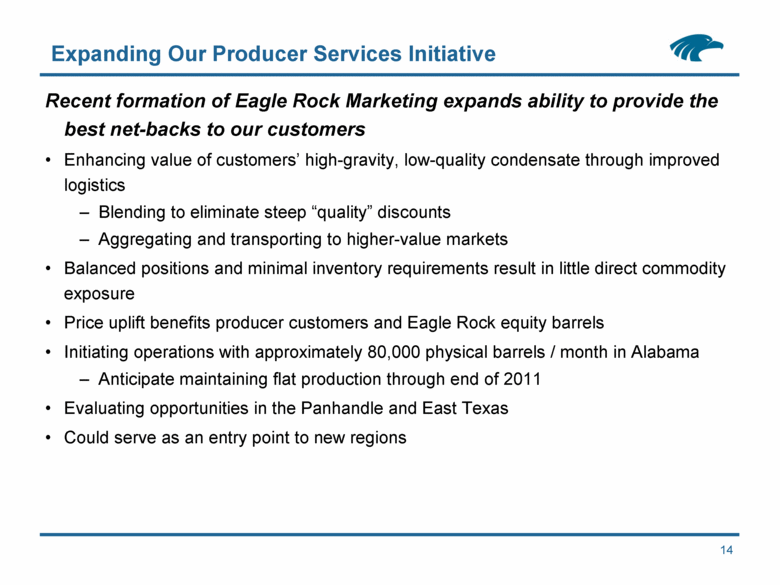
14 Recent formation of Eagle Rock Marketing expands ability to provide the best net-backs to our customers Enhancing value of customers’ high-gravity, low-quality condensate through improved logistics Blending to eliminate steep “quality” discounts Aggregating and transporting to higher-value markets Balanced positions and minimal inventory requirements result in little direct commodity exposure Price uplift benefits producer customers and Eagle Rock equity barrels Initiating operations with approximately 80,000 physical barrels / month in Alabama Anticipate maintaining flat production through end of 2011 Evaluating opportunities in the Panhandle and East Texas Could serve as an entry point to new regions Expanding Our Producer Services Initiative |
|
|
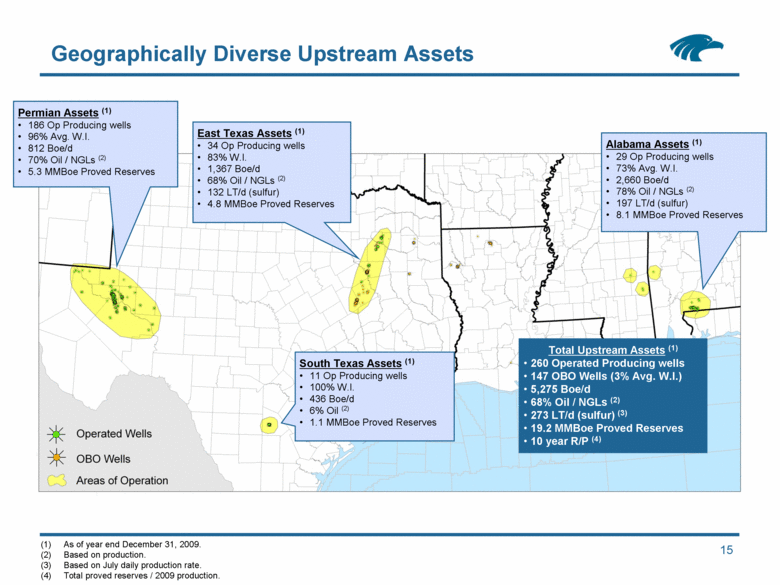
15 Alabama Assets (1) 29 Op Producing wells 73% Avg. W.I. 2,660 Boe/d 78% Oil / NGLs (2) 197 LT/d (sulfur) 8.1 MMBoe Proved Reserves Permian Assets (1) 186 Op Producing wells 96% Avg. W.I. 812 Boe/d 70% Oil / NGLs (2) 5.3 MMBoe Proved Reserves South Texas Assets (1) 11 Op Producing wells 100% W.I. 436 Boe/d 6% Oil (2) 1.1 MMBoe Proved Reserves East Texas Assets (1) 34 Op Producing wells 83% W.I. 1,367 Boe/d 68% Oil / NGLs (2) 132 LT/d (sulfur) 4.8 MMBoe Proved Reserves Total Upstream Assets (1) 260 Operated Producing wells 147 OBO Wells (3% Avg. W.I.) 5,275 Boe/d 68% Oil / NGLs (2) 273 LT/d (sulfur) (3) 19.2 MMBoe Proved Reserves 10 year R/P (4) (1) As of year end December 31, 2009. Based on production. Based on July daily production rate. Total proved reserves / 2009 production. Geographically Diverse Upstream Assets |
|
|
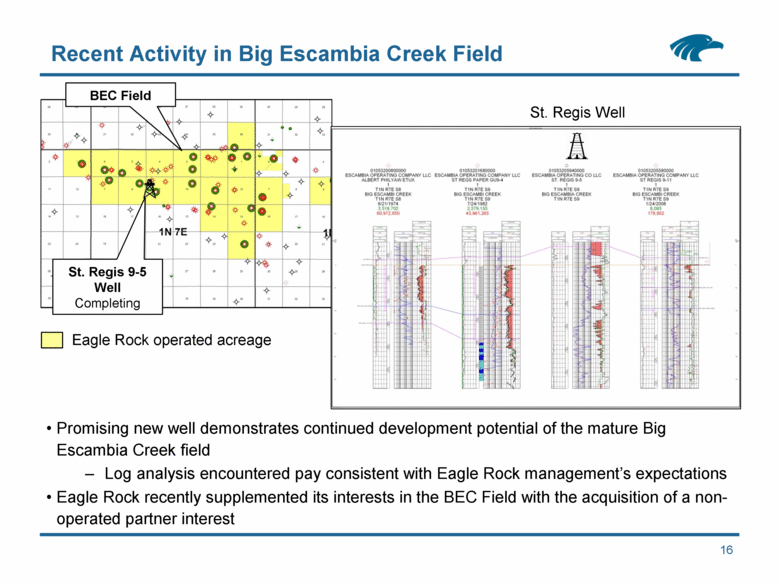
16 Recent Activity in Big Escambia Creek Field Eagle Rock operated acreage St. Regis 9-5 Well Completing BEC Field St. Regis Well Promising new well demonstrates continued development potential of the mature Big Escambia Creek field Log analysis encountered pay consistent with Eagle Rock management’s expectations Eagle Rock recently supplemented its interests in the BEC Field with the acquisition of a non-operated partner interest |
|
|
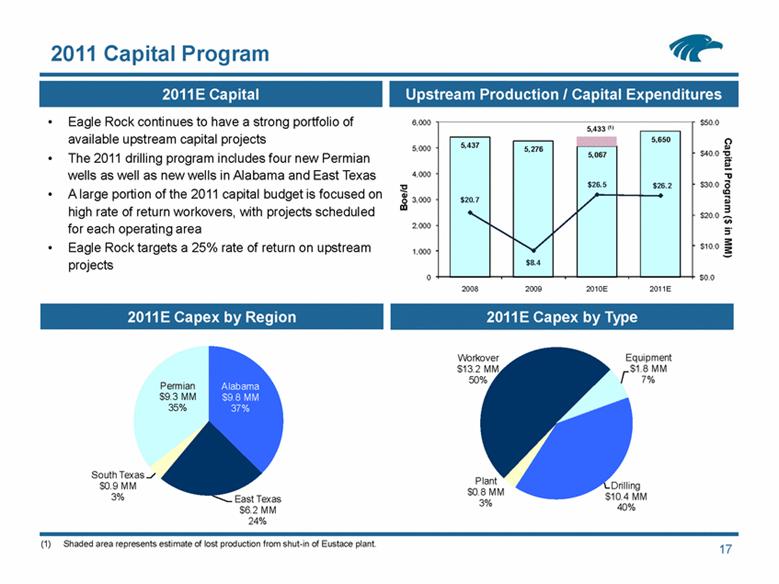
17 2011 Capital Program Boe/d Capital Program ($ in MM) Eagle Rock continues to have a strong portfolio of available upstream capital projects The 2011 drilling program includes four new Permian wells as well as new wells in Alabama and East Texas A large portion of the 2011 capital budget is focused on high rate of return workovers, with projects scheduled for each operating area Eagle Rock targets a 25% rate of return on upstream projects 2011E Capex by Region 2011E Capex by Type 2011E Capital Upstream Production / Capital Expenditures 5,433 (1) Shaded area represents estimate of lost production from shut-in of Eustace plant. Alabama $9.8 MM 37% East Texas $6.2 MM 24% South Texas $0.9 MM 3% Permian $9.3 MM 35% 5,437 5,276 5,067 5,650 $20.7 $8.4 $26.5 $26.2 $0.0 $10.0 $20.0 $30.0 $40.0 $50.0 0 1,000 2,000 3,000 4,000 5,000 6,000 2008 2009 2010E 2011E Drilling $10.4 MM 40% Plant $0.8 MM 3% Workover $13.2 MM 50% Equipment $1.8 MM 7% |
|
|
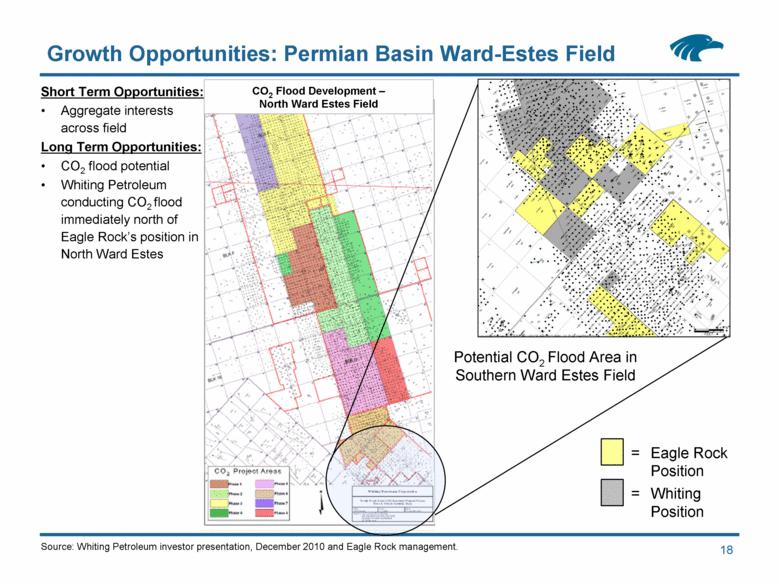
Potential CO2 Flood Area in Southern Ward Estes Field 18 Growth Opportunities: Permian Basin Ward-Estes Field Short Term Opportunities: Aggregate interests across field Long Term Opportunities: CO2 flood potential Whiting Petroleum conducting CO2 flood immediately north of Eagle Rock’s position in North Ward Estes = Whiting Position Source: Whiting Petroleum investor presentation, December 2010 and Eagle Rock management. CO2 Flood Development – North Ward Estes Field = Eagle Rock Position |
|
|
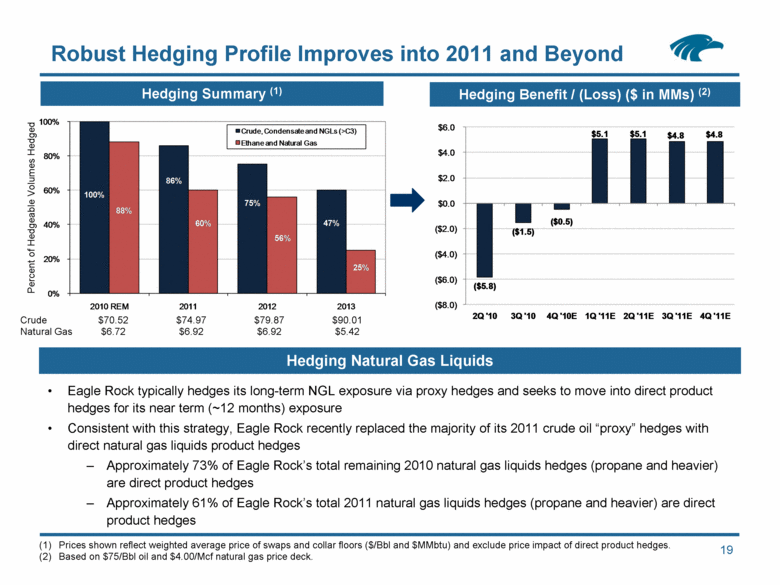
Robust Hedging Profile Improves into 2011 and Beyond Hedging Summary (1) Percent of Hedgeable Volumes Hedged Prices shown reflect weighted average price of swaps and collar floors ($/Bbl and $MMbtu) and exclude price impact of direct product hedges. Based on $75/Bbl oil and $4.00/Mcf natural gas price deck. 19 Hedging Benefit / (Loss) ($ in MMs) (2) Eagle Rock typically hedges its long-term NGL exposure via proxy hedges and seeks to move into direct product hedges for its near term (~12 months) exposure Consistent with this strategy, Eagle Rock recently replaced the majority of its 2011 crude oil “proxy” hedges with direct natural gas liquids product hedges Approximately 73% of Eagle Rock’s total remaining 2010 natural gas liquids hedges (propane and heavier) are direct product hedges Approximately 61% of Eagle Rock’s total 2011 natural gas liquids hedges (propane and heavier) are direct product hedges Hedging Natural Gas Liquids Crude $70.52 $74.97 $79.87 $90.01 Natural Gas $6.72 $6.92 $6.92 $5.42 ($5.8) ($1.5) ($0.5) $5.1 $5.1 $4.8 $4.8 ($8.0) ($6.0) ($4.0) ($2.0) $0.0 $2.0 $4.0 $6.0 2Q '10 3Q '10 4Q '10E 1Q '11E 2Q '11E 3Q '11E 4Q '11E 100% 86% 75% 47% 88% 60% 56% 25% 0% 20% 40% 60% 80% 100% 2010 REM 2011 2012 2013 Crude, Condensate and NGLs (>C3) Ethane and Natural Gas |
|
|
20 Partnership Highlights Strong Credit Profile and Simplified Structure Enhance Growth Potential Excellent Organic Growth Opportunities in Core Areas $50 to $100 million in identified organic growth potential in Midstream Business in 2011 Acquisition Opportunities in Multiple Business Segments Well-positioned Asset Base Located in Mature, Growing Basins Diversified Business Model Contributions from dual business lines across energy value chain Strong, Experienced Management Team |
|
|
Appendix Investor Presentation December 2010 Eagle Rock Energy Partners, L.P. |
|
|
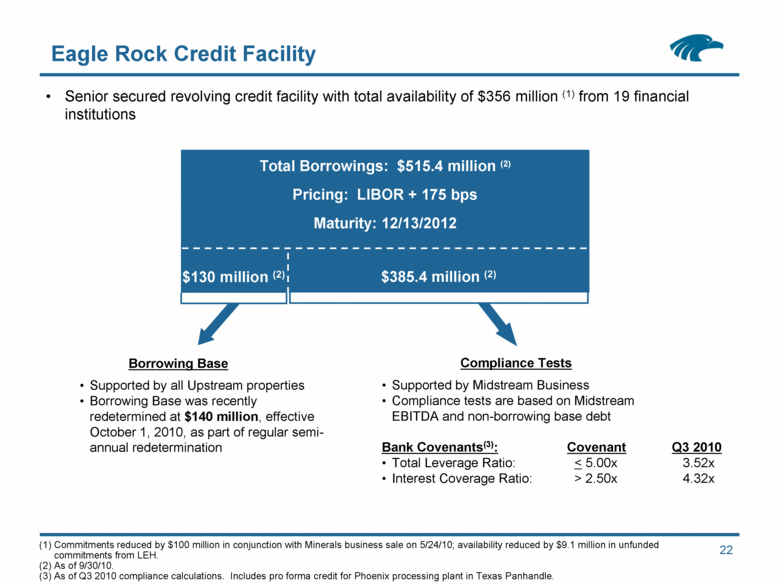
22 Eagle Rock Credit Facility Senior secured revolving credit facility with total availability of $356 million (1) from 19 financial institutions Borrowing Base Compliance Tests Supported by all Upstream properties Borrowing Base was recently redetermined at $140 million, effective October 1, 2010, as part of regular semi-annual redetermination Supported by Midstream Business Compliance tests are based on Midstream EBITDA and non-borrowing base debt Bank Covenants(3): Covenant Q3 2010 Total Leverage Ratio: < 5.00x 3.52x Interest Coverage Ratio: > 2.50x 4.32x Total Borrowings: $515.4 million (2) Pricing: LIBOR + 175 bps Maturity: 12/13/2012 $130 million (2) $385.4 million (2) (1) Commitments reduced by $100 million in conjunction with Minerals business sale on 5/24/10; availability reduced by $9.1 million in unfunded commitments from LEH. (2) As of 9/30/10. (3) As of Q3 2010 compliance calculations. Includes pro forma credit for Phoenix processing plant in Texas Panhandle. |
|
|
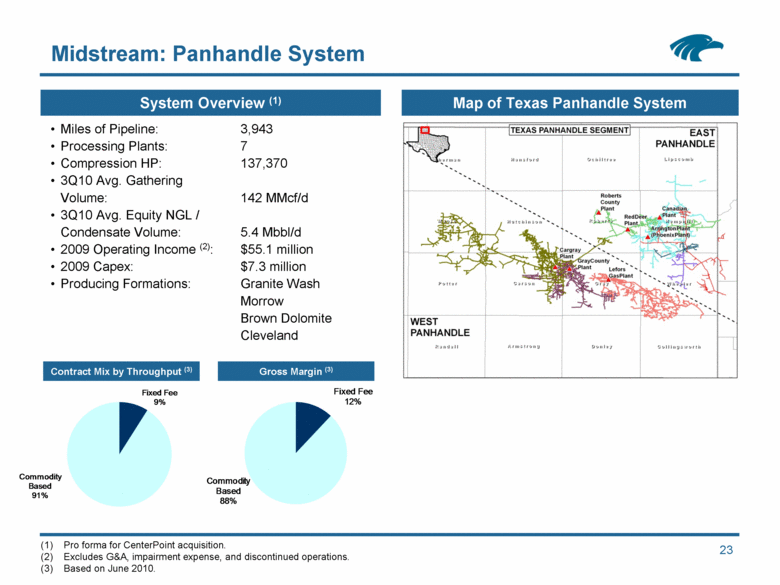
23 System Overview (1) Map of Texas Panhandle System Midstream: Panhandle System Miles of Pipeline: 3,943 Processing Plants: 7 Compression HP: 137,370 3Q10 Avg. Gathering Volume: 142 MMcf/d 3Q10 Avg. Equity NGL / Condensate Volume: 5.4 Mbbl/d 2009 Operating Income (2): $55.1 million 2009 Capex: $7.3 million Producing Formations: Granite Wash Morrow Brown Dolomite Cleveland (1) Pro forma for CenterPoint acquisition. Excludes G&A, impairment expense, and discontinued operations. Based on June 2010. Contract Mix by Throughput (3) Gross Margin (3) Fixed Fee 9% Commodity Based 91% Fixed Fee 12% Commodity Based 88% |
|
|
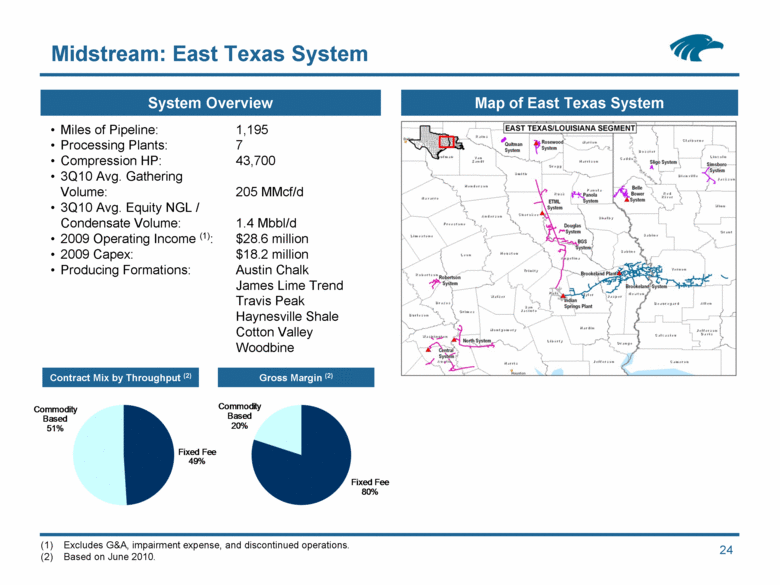
24 System Overview Map of East Texas System Midstream: East Texas System Miles of Pipeline: 1,195 Processing Plants: 7 Compression HP: 43,700 3Q10 Avg. Gathering Volume: 205 MMcf/d 3Q10 Avg. Equity NGL / Condensate Volume: 1.4 Mbbl/d 2009 Operating Income (1): $28.6 million 2009 Capex: $18.2 million Producing Formations: Austin Chalk James Lime Trend Travis Peak Haynesville Shale Cotton Valley Woodbine (1) Excludes G&A, impairment expense, and discontinued operations. Based on June 2010. Contract Mix by Throughput (2) Gross Margin (2) Fixed Fee 80% Commodity Based 20% Commodity Based 51% Fixed Fee 49% |
|
|
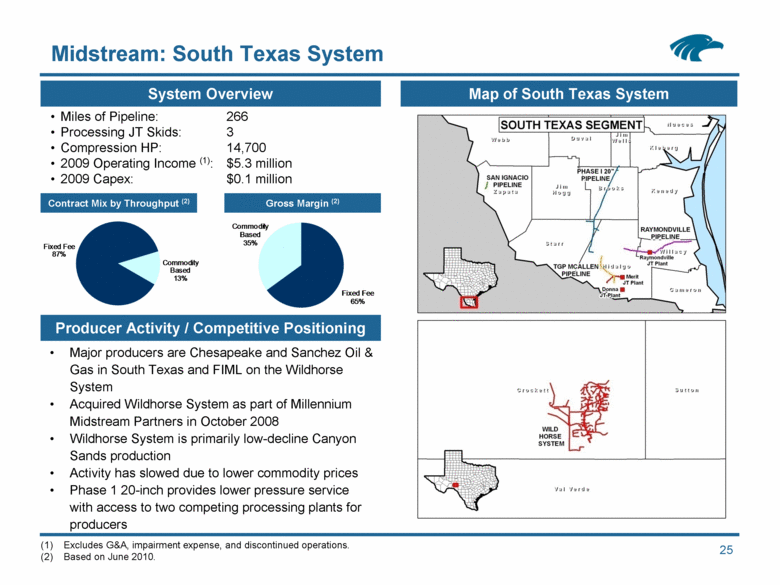
25 System Overview Map of South Texas System Producer Activity / Competitive Positioning Midstream: South Texas System Major producers are Chesapeake and Sanchez Oil & Gas in South Texas and FIML on the Wildhorse System Acquired Wildhorse System as part of Millennium Midstream Partners in October 2008 Wildhorse System is primarily low-decline Canyon Sands production Activity has slowed due to lower commodity prices Phase 1 20-inch provides lower pressure service with access to two competing processing plants for producers Miles of Pipeline: 266 Processing JT Skids: 3 Compression HP: 14,700 2009 Operating Income (1): $5.3 million 2009 Capex: $0.1 million (1) Excludes G&A, impairment expense, and discontinued operations. Based on June 2010. Contract Mix by Throughput (2) Gross Margin (2) Fixed Fee 65% Commodity Based 35% Fixed Fee 87% Commodity Based 13% |
|
|
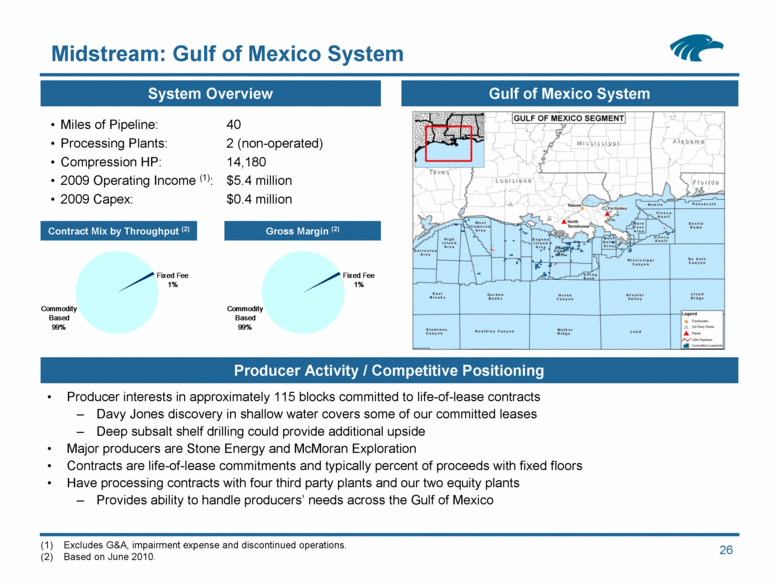
26 System Overview Gulf of Mexico System Midstream: Gulf of Mexico System Miles of Pipeline: 40 Processing Plants: 2 (non-operated) Compression HP: 14,180 2009 Operating Income (1): $5.4 million 2009 Capex: $0.4 million Producer interests in approximately 115 blocks committed to life-of-lease contracts Davy Jones discovery in shallow water covers some of our committed leases Deep subsalt shelf drilling could provide additional upside Major producers are Stone Energy and McMoran Exploration Contracts are life-of-lease commitments and typically percent of proceeds with fixed floors Have processing contracts with four third party plants and our two equity plants Provides ability to handle producers’ needs across the Gulf of Mexico (1) Excludes G&A, impairment expense and discontinued operations. Based on June 2010. Contract Mix by Throughput (2) Gross Margin (2) Producer Activity / Competitive Positioning Fixed Fee 1% Commodity Based 99% Fixed Fee 1% Commodity Based 99% |
|
|
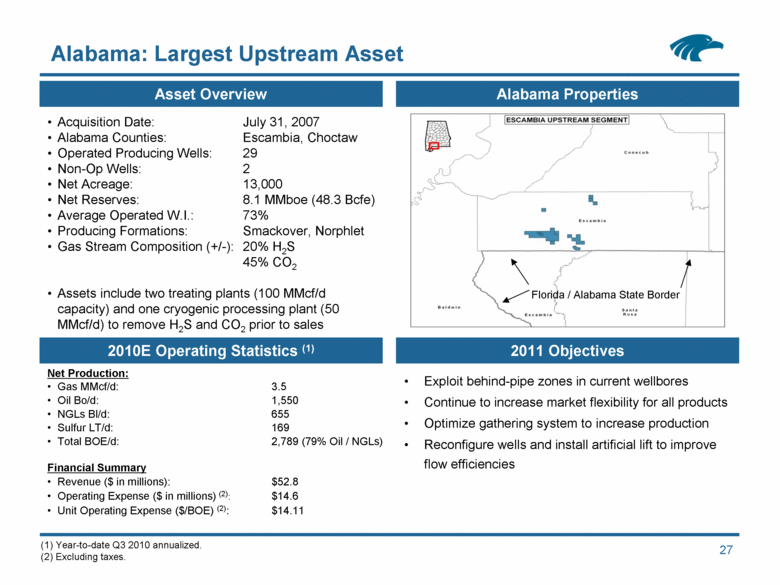
27 Alabama: Largest Upstream Asset Acquisition Date: July 31, 2007 Alabama Counties: Escambia, Choctaw Operated Producing Wells: 29 Non-Op Wells: 2 Net Acreage: 13,000 Net Reserves: 8.1 MMboe (48.3 Bcfe) Average Operated W.I.: 73% Producing Formations: Smackover, Norphlet Gas Stream Composition (+/-): 20% H2S 45% CO2 Assets include two treating plants (100 MMcf/d capacity) and one cryogenic processing plant (50 MMcf/d) to remove H2S and CO2 prior to sales Net Production: Gas MMcf/d: 3.5 Oil Bo/d: 1,550 NGLs Bl/d: 655 Sulfur LT/d: 169 Total BOE/d: 2,789 (79% Oil / NGLs) Financial Summary Revenue ($ in millions): $52.8 Operating Expense ($ in millions) (2): $14.6 Unit Operating Expense ($/BOE) (2): $14.11 Florida / Alabama State Border (1) Year-to-date Q3 2010 annualized. (2) Excluding taxes. Exploit behind-pipe zones in current wellbores Continue to increase market flexibility for all products Optimize gathering system to increase production Reconfigure wells and install artificial lift to improve flow efficiencies Asset Overview Alabama Properties 2010E Operating Statistics (1) 2011 Objectives |
|
|
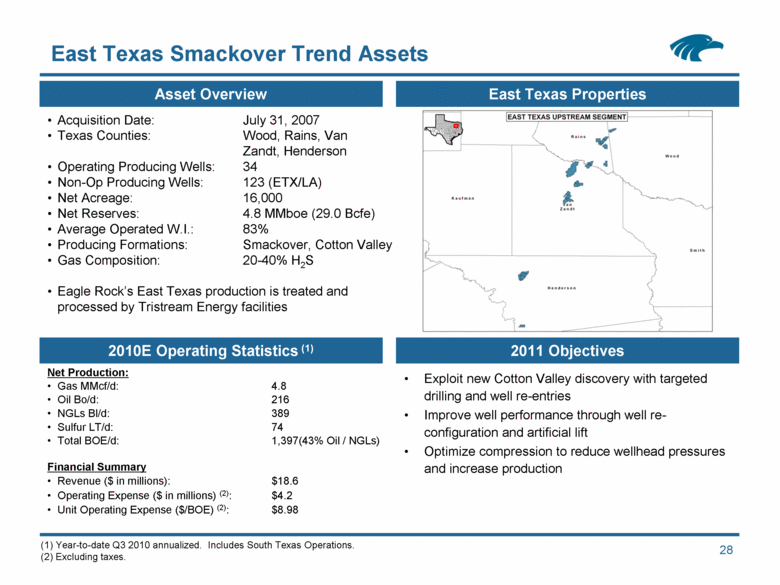
28 East Texas Smackover Trend Assets Acquisition Date: July 31, 2007 Texas Counties: Wood, Rains, Van Zandt, Henderson Operating Producing Wells: 34 Non-Op Producing Wells: 123 (ETX/LA) Net Acreage: 16,000 Net Reserves: 4.8 MMboe (29.0 Bcfe) Average Operated W.I.: 83% Producing Formations: Smackover, Cotton Valley Gas Composition: 20-40% H2S Eagle Rock’s East Texas production is treated and processed by Tristream Energy facilities Net Production: Gas MMcf/d: 4.8 Oil Bo/d: 216 NGLs Bl/d: 389 Sulfur LT/d: 74 Total BOE/d: 1,397(43% Oil / NGLs) Financial Summary Revenue ($ in millions): $18.6 Operating Expense ($ in millions) (2): $4.2 Unit Operating Expense ($/BOE) (2): $8.98 (1) Year-to-date Q3 2010 annualized. Includes South Texas Operations. (2) Excluding taxes. Exploit new Cotton Valley discovery with targeted drilling and well re-entries Improve well performance through well re-configuration and artificial lift Optimize compression to reduce wellhead pressures and increase production Asset Overview East Texas Properties 2010E Operating Statistics (1) 2011 Objectives |
|
|
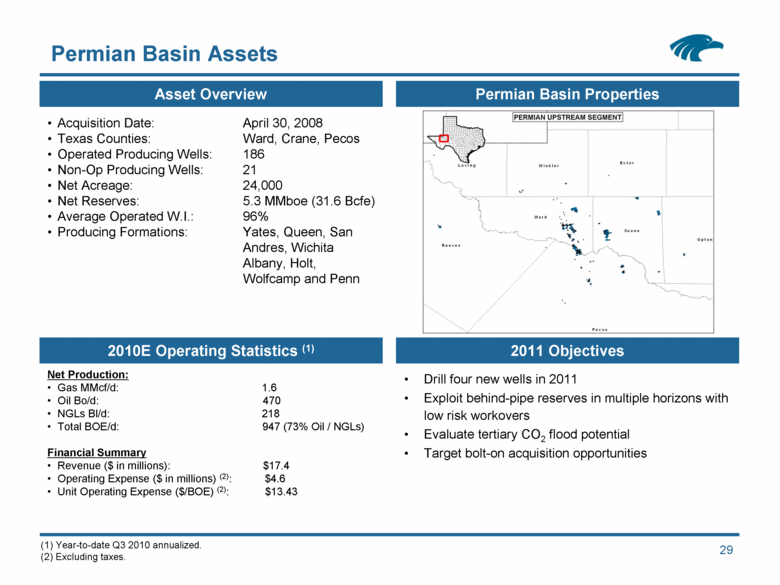
29 Asset Overview Permian Basin Properties 2010E Operating Statistics (1) Permian Basin Assets Acquisition Date: April 30, 2008 Texas Counties: Ward, Crane, Pecos Operated Producing Wells: 186 Non-Op Producing Wells: 21 Net Acreage: 24,000 Net Reserves: 5.3 MMboe (31.6 Bcfe) Average Operated W.I.: 96% Producing Formations: Yates, Queen, San Andres, Wichita Albany, Holt, Wolfcamp and Penn Net Production: Gas MMcf/d: 1.6 Oil Bo/d: 470 NGLs Bl/d: 218 Total BOE/d: 947 (73% Oil / NGLs) Financial Summary Revenue ($ in millions): $17.4 Operating Expense ($ in millions) (2): $4.6 Unit Operating Expense ($/BOE) (2): $13.43 (1) Year-to-date Q3 2010 annualized. (2) Excluding taxes. 2011 Objectives Drill four new wells in 2011 Exploit behind-pipe reserves in multiple horizons with low risk workovers Evaluate tertiary CO2 flood potential Target bolt-on acquisition opportunities |
|
|
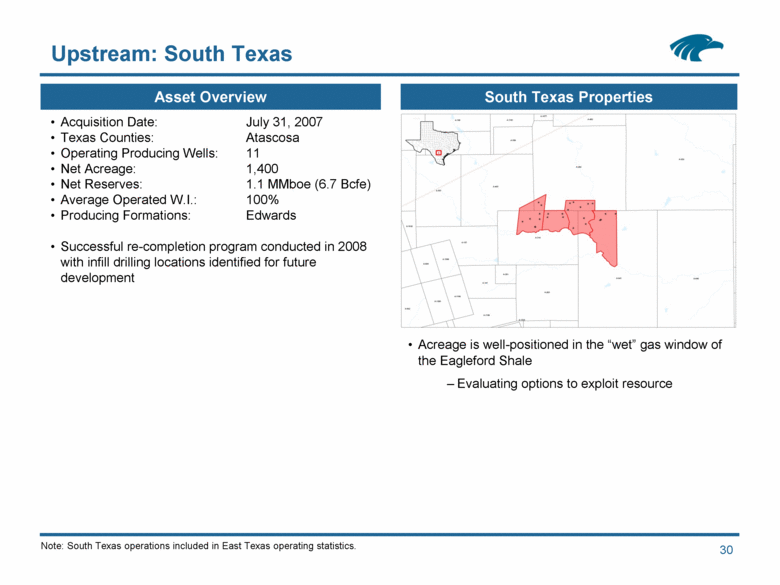
30 Asset Overview South Texas Properties Upstream: South Texas Acquisition Date: July 31, 2007 Texas Counties: Atascosa Operating Producing Wells: 11 Net Acreage: 1,400 Net Reserves: 1.1 MMboe (6.7 Bcfe) Average Operated W.I.: 100% Producing Formations: Edwards Successful re-completion program conducted in 2008 with infill drilling locations identified for future development Acreage is well-positioned in the “wet” gas window of the Eagleford Shale Evaluating options to exploit resource Note: South Texas operations included in East Texas operating statistics. |
|
|
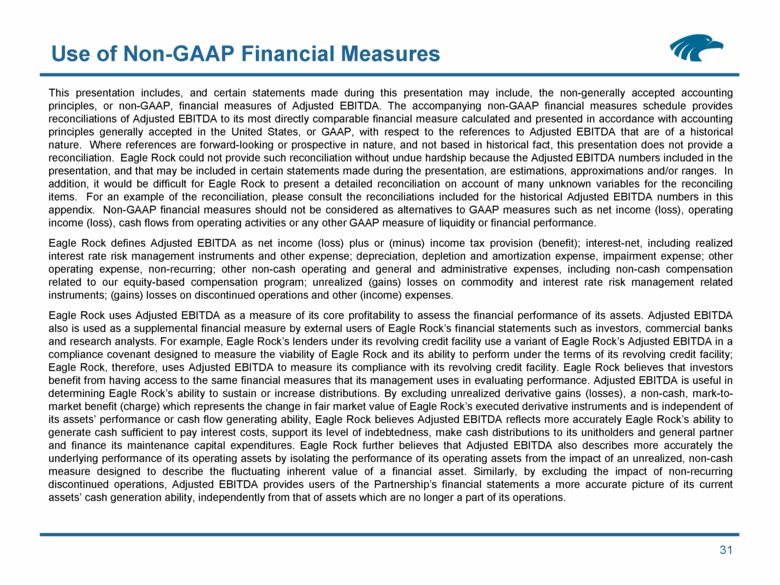
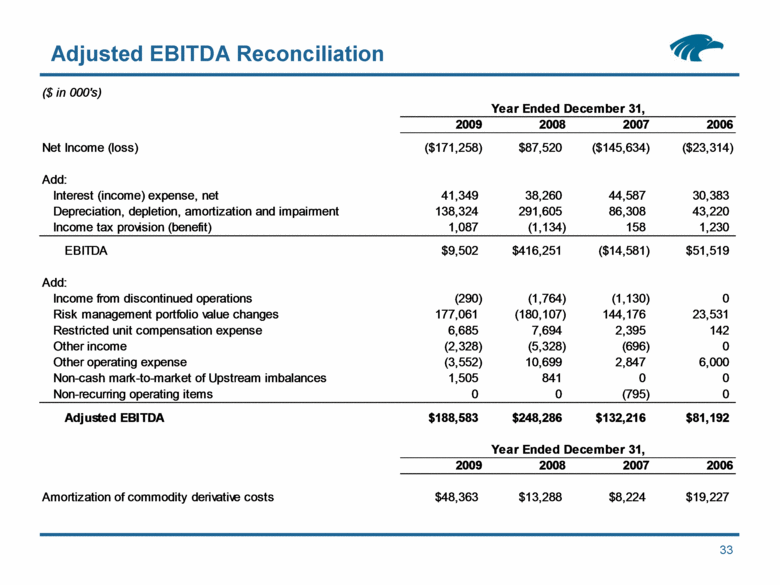
31 This presentation includes, and certain statements made during this presentation may include, the non-generally accepted accounting principles, or non-GAAP, financial measures of Adjusted EBITDA. The accompanying non-GAAP financial measures schedule provides reconciliations of Adjusted EBITDA to its most directly comparable financial measure calculated and presented in accordance with accounting principles generally accepted in the United States, or GAAP, with respect to the references to Adjusted EBITDA that are of a historical nature. Where references are forward-looking or prospective in nature, and not based in historical fact, this presentation does not provide a reconciliation. Eagle Rock could not provide such reconciliation without undue hardship because the Adjusted EBITDA numbers included in the presentation, and that may be included in certain statements made during the presentation, are estimations, approximations and/or ranges. In addition, it would be difficult for Eagle Rock to present a detailed reconciliation on account of many unknown variables for the reconciling items. For an example of the reconciliation, please consult the reconciliations included for the historical Adjusted EBITDA numbers in this appendix. Non-GAAP financial measures should not be considered as alternatives to GAAP measures such as net income (loss), operating income (loss), cash flows from operating activities or any other GAAP measure of liquidity or financial performance. Eagle Rock defines Adjusted EBITDA as net income (loss) plus or (minus) income tax provision (benefit); interest-net, including realized interest rate risk management instruments and other expense; depreciation, depletion and amortization expense, impairment expense; other operating expense, non-recurring; other non-cash operating and general and administrative expenses, including non-cash compensation related to our equity-based compensation program; unrealized (gains) losses on commodity and interest rate risk management related instruments; (gains) losses on discontinued operations and other (income) expenses. Eagle Rock uses Adjusted EBITDA as a measure of its core profitability to assess the financial performance of its assets. Adjusted EBITDA also is used as a supplemental financial measure by external users of Eagle Rock’s financial statements such as investors, commercial banks and research analysts. For example, Eagle Rock’s lenders under its revolving credit facility use a variant of Eagle Rock’s Adjusted EBITDA in a compliance covenant designed to measure the viability of Eagle Rock and its ability to perform under the terms of its revolving credit facility; Eagle Rock, therefore, uses Adjusted EBITDA to measure its compliance with its revolving credit facility. Eagle Rock believes that investors benefit from having access to the same financial measures that its management uses in evaluating performance. Adjusted EBITDA is useful in determining Eagle Rock’s ability to sustain or increase distributions. By excluding unrealized derivative gains (losses), a non-cash, mark-to-market benefit (charge) which represents the change in fair market value of Eagle Rock’s executed derivative instruments and is independent of its assets’ performance or cash flow generating ability, Eagle Rock believes Adjusted EBITDA reflects more accurately Eagle Rock’s ability to generate cash sufficient to pay interest costs, support its level of indebtedness, make cash distributions to its unitholders and general partner and finance its maintenance capital expenditures. Eagle Rock further believes that Adjusted EBITDA also describes more accurately the underlying performance of its operating assets by isolating the performance of its operating assets from the impact of an unrealized, non-cash measure designed to describe the fluctuating inherent value of a financial asset. Similarly, by excluding the impact of non-recurring discontinued operations, Adjusted EBITDA provides users of the Partnership’s financial statements a more accurate picture of its current assets’ cash generation ability, independently from that of assets which are no longer a part of its operations. Use of Non-GAAP Financial Measures |
|
|
32 Eagle Rock’s Adjusted EBITDA definition may not be comparable to Adjusted EBITDA or similarly titled measures of other entities, as other entities may not calculate Adjusted EBITDA in the same manner as Eagle Rock. For example, Eagle Rock includes in Adjusted EBITDA the actual settlement revenue created from its commodity hedges by virtue of transactions undertaken by it to reset commodity hedges to prices higher than the then-current forward strip price for such future period or purchase puts or other similar floors despite the fact that Eagle Rock excludes from Adjusted EBITDA any charge for amortization of the cost of such commodity hedge reset transactions or puts. Eagle Rock has reconciled historical Adjusted EBITDA numbers to the GAAP financial measure of net income (loss) in the appendix to this presentation but has not reconciled prospective Adjusted EBITDA numbers. Use of Non-GAAP Financial Measures (Continued) |
|
|
33 Adjusted EBITDA Reconciliation ($ in 000's) Year Ended December 31, 2009 2008 2007 2006 Net Income (loss) ($171,258) $87,520 ($145,634) ($23,314) Add: Interest (income) expense, net 41,349 38,260 44,587 30,383 Depreciation, depletion, amortization and impairment 138,324 291,605 86,308 43,220 Income tax provision (benefit) 1,087 (1,134) 158 1,230 EBITDA $9,502 $416,251 ($14,581) $51,519 Add: Income from discontinued operations (290) (1,764) (1,130) 0 Risk management portfolio value changes 177,061 (180,107) 144,176 23,531 Restricted unit compensation expense 6,685 7,694 2,395 142 Other income (2,328) (5,328) (696) 0 Other operating expense (3,552) 10,699 2,847 6,000 Non-cash mark-to-market of Upstream imbalances 1,505 841 0 0 Non-recurring operating items 0 0 (795) 0 Adjusted EBITDA $188,583 $248,286 $132,216 $81,192 Year Ended December 31, 2009 2008 2007 2006 Amortization of commodity derivative costs $48,363 $13,288 $8,224 $19,227 |


