Attached files
| file | filename |
|---|---|
| 8-K - THIS IS OUR CURRENT REPORT ON FORM 8K - PROASSURANCE CORP | bodyoffiling.htm |

December 6-8, 2010
New York Investor Meetings
W. Stancil Starnes
Chairman & CEO
Chairman & CEO
Edward L. Rand, Jr.
Chief Financial Officer
Chief Financial Officer
Frank B. O’Neil
Investor Relations Officer
Investor Relations Officer
arranged by Stifel, Nicolaus & Co.

Forward Looking Statements
This presentation contains Forward Looking Statements and other information designed to convey
our projections and expectations regarding future results. There are a number of factors which
could cause our actual results to vary materially from those projected in this presentation. The
principal risk factors that may cause these differences are described in various documents we file
with the Securities and Exchange Commission, such as our Current Reports on Form 8-K, and our
regular reports on Forms 10-Q and 10-K, particularly in “Item 1A, Risk Factors.” Please review
this presentation in conjunction with a thorough reading and understanding of these risk factors.
We especially identify statements concerning our recently-completed acquisition of American
Physicians Service Group (NASDAQ: AMPH) as forward looking statements and direct your
attention to our news release and Current Report on Form 8K, issued on November 30, 2010
for a discussion of risk factors pertaining to this transaction and subsequent integration into
ProAssurance.
Physicians Service Group (NASDAQ: AMPH) as forward looking statements and direct your
attention to our news release and Current Report on Form 8K, issued on November 30, 2010
for a discussion of risk factors pertaining to this transaction and subsequent integration into
ProAssurance.
This presentation contains Non-GAAP measures, and we may reference Non-GAAP measures in
our remarks. A reconciliation of these measures to GAAP measures is available in our latest
quarterly news release, which is available in the Investor Relations section of our website,
www.ProAssurance.com, and in the related Current Reports on Form 8K disclosing that release.
our remarks. A reconciliation of these measures to GAAP measures is available in our latest
quarterly news release, which is available in the Investor Relations section of our website,
www.ProAssurance.com, and in the related Current Reports on Form 8K disclosing that release.
2
Non-GAAP Measures
ProAssurance: Corporate Profile
Specialty writer of professional liability insurance, primarily Medical Professional Liability (MPL)
Market Cap : ~$1.9 billion
Total Assets: $4.8 billion
Shareholders’ Equity: $1.8 billion
Founded in 1975 / Demutualized to a public company in 1991
Successful across the insurance cycles in a variety of market conditions
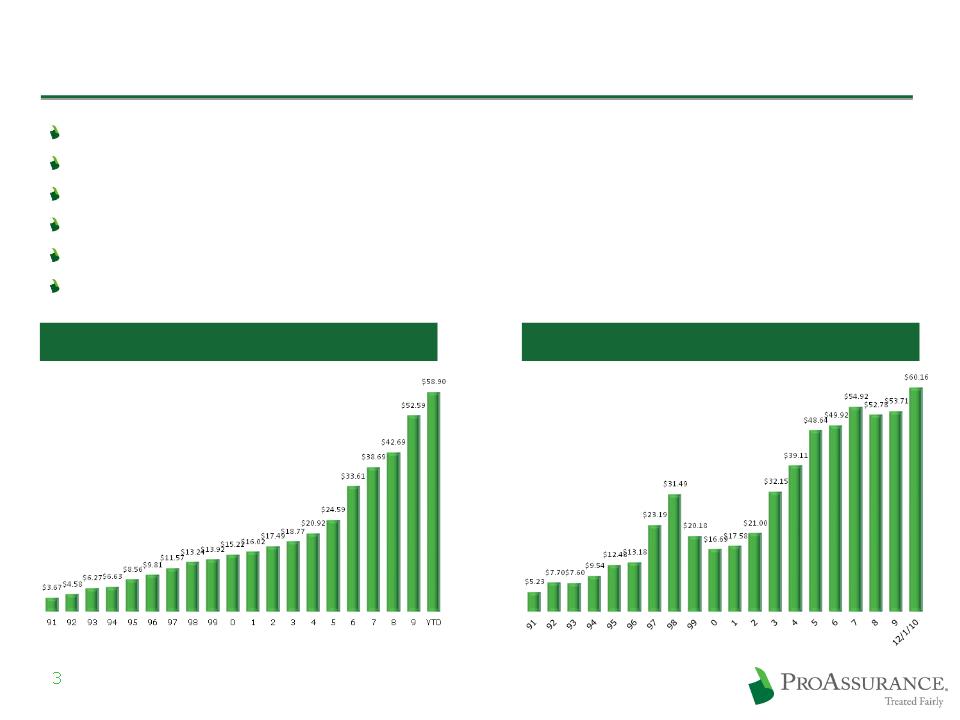
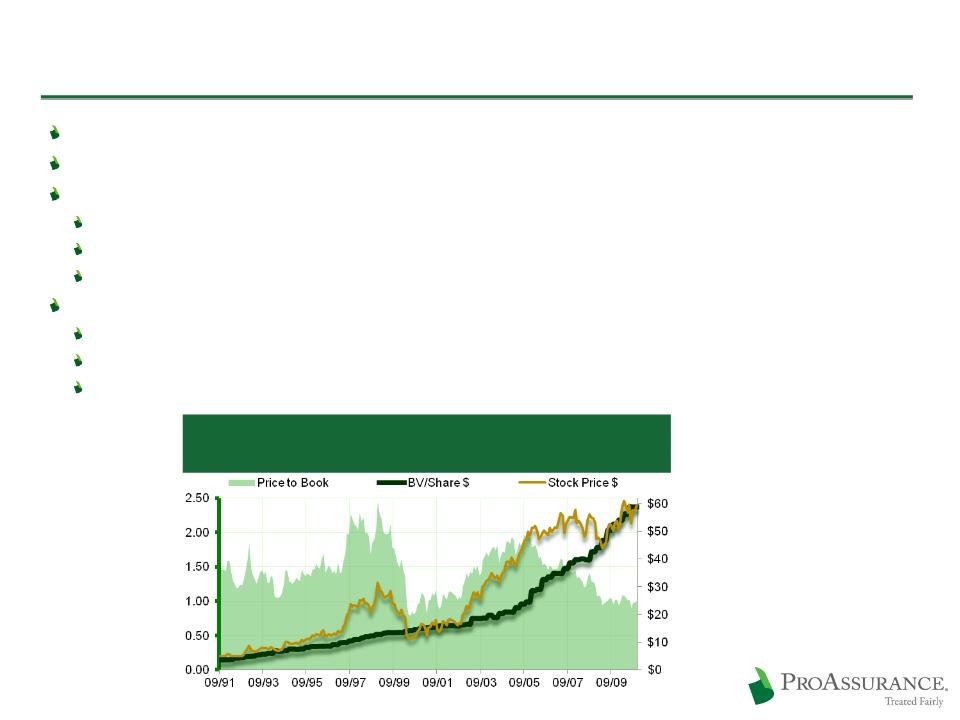
Historical Book Value Per Share
10 Year Summary
CAGR: 14%
CAGR: 14%
Cumulative: 276%
Historical Stock Price
10 Year Summary
CAGR: 10%
CAGR: 10%
Cumulative: 166%
ProAssurance: Business Profile
Largest independent publicly traded writer of MPL insurance
Fourth largest overall writer
Fragmented market
Top 20 writers have just 64% of the market
More than 100 writers with some share of the market
Majority of companies are mutual or similar
Few operate in more than two or three states
4
|
|
Company
|
2009 DPW
(000’s) |
Share
|
Comments
|
|
1
|
Medical Liability Mutual
|
$ 756,844
|
7.0%
|
78% in NY, 22% in NJ
|
|
2
|
Medical Protective
|
$ 727,160
|
6.8%
|
Berkshire subsidiary
Direct competitor |
|
3
|
Doctors Company
|
$ 601,223
|
5.6%
|
Non-public
Direct competitor |
|
4
|
ProAssurance
|
$ 541,033
|
5.0%
|
|
|
5
|
AIG
|
$ 524,252
|
4.9%
|
Not a direct competitor
Primarily excess writer |
|
Total DPW: $10.2 billion
|
||||
|
ProAssurance as Top Overall Writer
|
||
|
State
|
2009 Share
|
2009 Rank
|
|
Alabama
|
60%
|
1
|
|
Delaware
|
42%
|
1
|
|
DC
|
50%
|
1
|
|
Wisconsin
|
32%
|
1
|
|
ProAssurance as Overall Writer 2 - 4
|
||
|
State
|
2009 Share
|
2009 Rank
|
|
Indiana
|
24%
|
2
|
|
Texas1
|
19%
|
2
|
|
Ohio
|
17%
|
2
|
|
Iowa
|
16%
|
2
|
|
Maryland
|
5%
|
2
|
|
Michigan
|
15%
|
3
|
|
Kentucky
|
12%
|
3
|
|
Missouri
|
8%
|
3
|
|
Nevada
|
11%
|
4
|
|
Nebraska
|
8%
|
4
|
|
Arkansas
|
7%
|
4
|
|
Illinois
|
5%
|
4
|
|
Kansas
|
5%
|
4
|
|
1 Proforma, ProAssurance and American Physicians
|
||
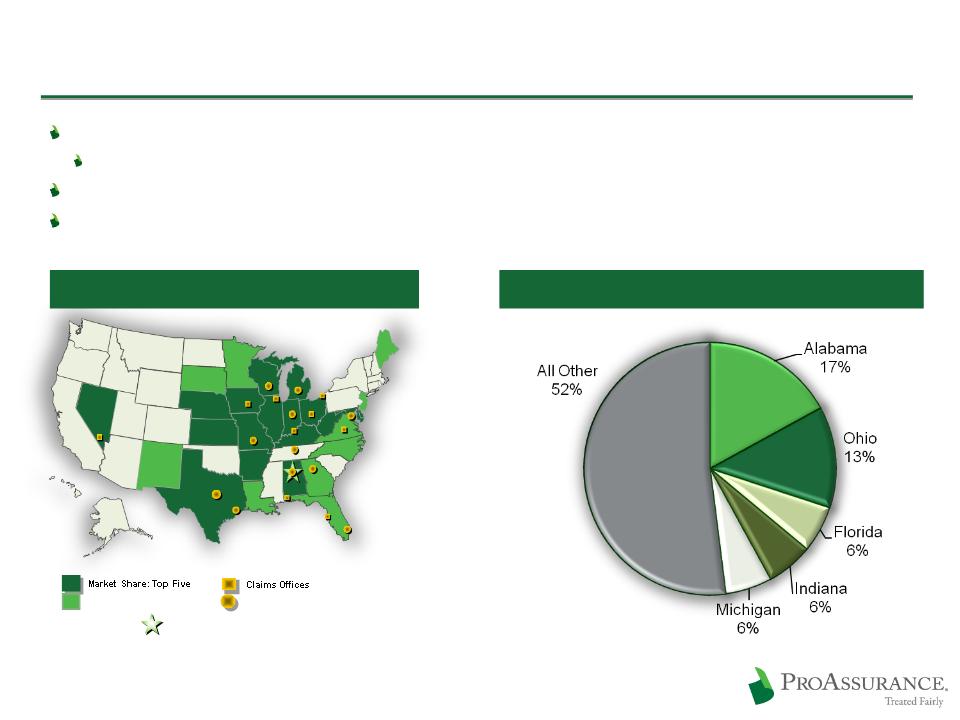
ProAssurance: Geographic Profile
Writing in 49 states and DC, ProAssurance has broad geographic diversification
2009 market share of 5% by DPW
Each state presents unique medical and legal challenges
Local offices provide the local knowledge that differentiates ProAssurance
5
Corporate Headquarters
Corporate Headquarters
Claims / Underwriting Offices
Claims / Underwriting Offices
(Birmingham)
Market Share: Six-Ten
Market Share: Six-Ten
Top States (2009 Premium)
ProAssurance Footprint
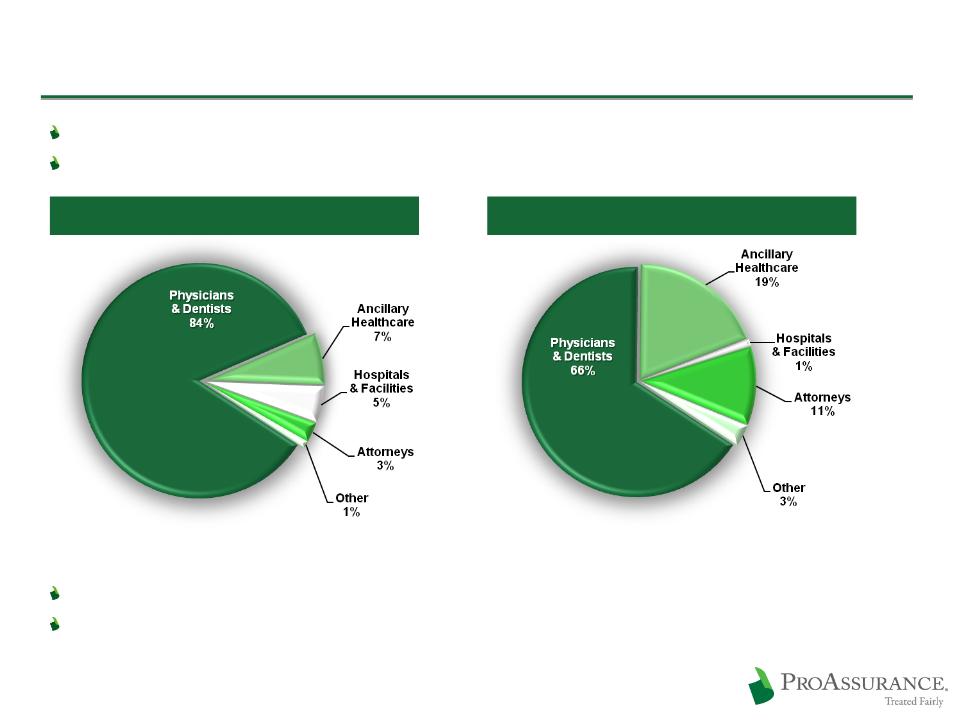
ProAssurance: Risk and Distribution Profile
We insure a broad range of healthcare risks, from individual providers to 800 bed hospitals
Rated “A” by A.M. Best and Fitch
Direct in Alabama, Florida and in all states for Podiatric business
Dual distribution in DC, Texas and parts of Missouri
6
Premium: $415 million
Direct: 40% / Agents: 60%
Policyholders: ~63,000
Direct: 35% / Agents: 65%
M & A Update
Financial Highlights
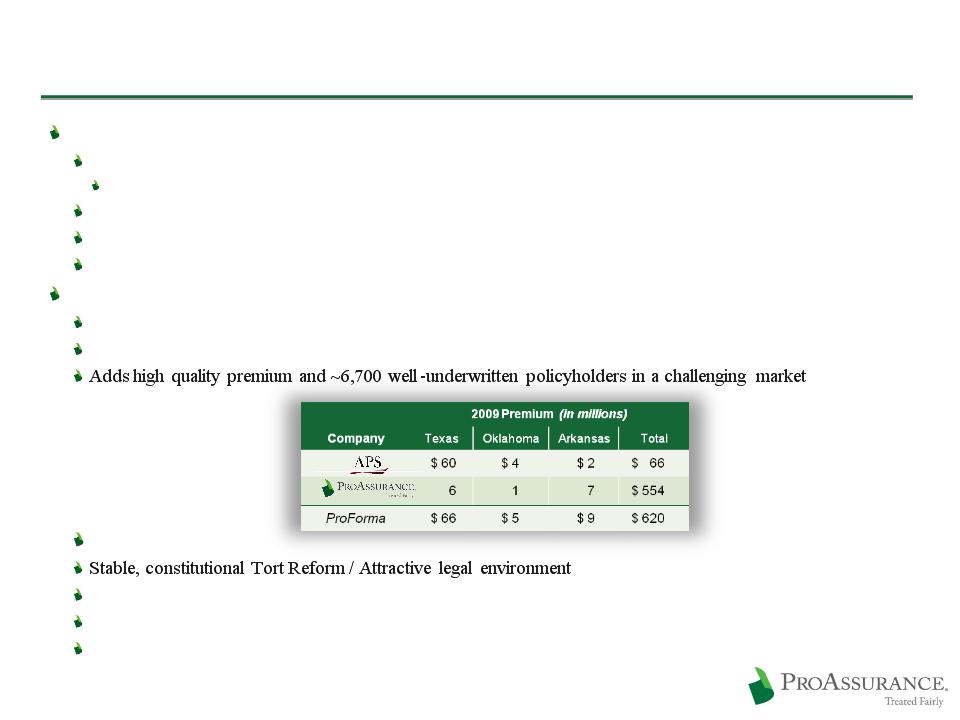
Acquisition of American Physicians Services Group (APS) closed November 30, 2010
Announced September 1, 2010
Valued AMPH at $32.50/share / Approximately $233 million payments to AMPH shareholders
1.3x Book Value or 11x First Call EPS estimate
Modestly accretive to earnings in 2011, after one-time charges and restructuring costs
Insurance Highlights
We are now the second leading writer in Texas
Also adds to business in Arkansas and Oklahoma
Texas Highlights
One of the fastest growing medical populations
Strong, resilient economy
APS headquarters becomes our Texas regional office
7

2009: Consolidation of:
Mid-Continent General Agency
Mid-Continent General Agency
2009: Consolidation of:
Mid-Continent General Agency
Mid-Continent General Agency
Georgia Lawyers Insurance Co.
Georgia Lawyers Insurance Co.
2004: Purchased Selected Renewal Rights from:
OHIC Insurance Company
OHIC Insurance Company
2004: Purchased Selected Renewal Rights from:
OHIC Insurance Company
OHIC Insurance Company
We Expect to Continue Growing Through M&A
We are skilled at finding M & A opportunities, conducting in-depth due diligence and integrating
resulting acquisitions
resulting acquisitions
8
1994: Consolidation of:
West Virginia Hosp. Ins Co.
West Virginia Hosp. Ins Co.
1994: Consolidation of:
West Virginia Hosp. Ins Co.
West Virginia Hosp. Ins Co.
1995: Consolidation of;
1995: Consolidation of;
Physicians Ins Co of Indiana
Physicians Ins Co of Indiana
Assumed business of:
Physicians Ins Co of Ohio
Physicians Ins Co of Ohio
Assumed business of:
Physicians Ins Co of Ohio
Physicians Ins Co of Ohio
1996: Consolidation of:
1996: Consolidation of:
Missouri Medical Ins Co
Missouri Medical Ins Co
1995: Assumed business of:
Associated Physicians Ins Co. (IL)
Associated Physicians Ins Co. (IL)
1995: Assumed business of:
Associated Physicians Ins Co. (IL)
Associated Physicians Ins Co. (IL)
1998: Consolidation of:
Physicians Protective Trust Fund (FL)
Physicians Protective Trust Fund (FL)
1998: Consolidation of:
Physicians Protective Trust Fund (FL)
Physicians Protective Trust Fund (FL)
1996: Assumed business of:
American Medical Ins Exchange (IN)
American Medical Ins Exchange (IN)
1996: Assumed business of:
American Medical Ins Exchange (IN)
American Medical Ins Exchange (IN)
Founding in the 1970’s
Founding in the 1970’s
1999: Assumed business of:
Medical Defense Associates (MO)
Medical Defense Associates (MO)
1999: Assumed business of:
Medical Defense Associates (MO)
Medical Defense Associates (MO)
Mutual Assurance
Physicians Ins. Co. of Michigan
Professionals Group
Creation of:
Creation of:
2005: Consolidation of:
NCRIC Group
NCRIC Group
2005: Consolidation of:
NCRIC Group
NCRIC Group
2006: Consolidation of:
PIC Wisconsin Group
PIC Wisconsin Group
2006: Consolidation of:
PIC Wisconsin Group
PIC Wisconsin Group
2007: PRI renewal rights deal
2002: SERTA renewal rights deal
2001: OUM renewal rights deal
2000: DPM Merger
1999: PACO Acquisition
Completed
11/30/10
11/30/10
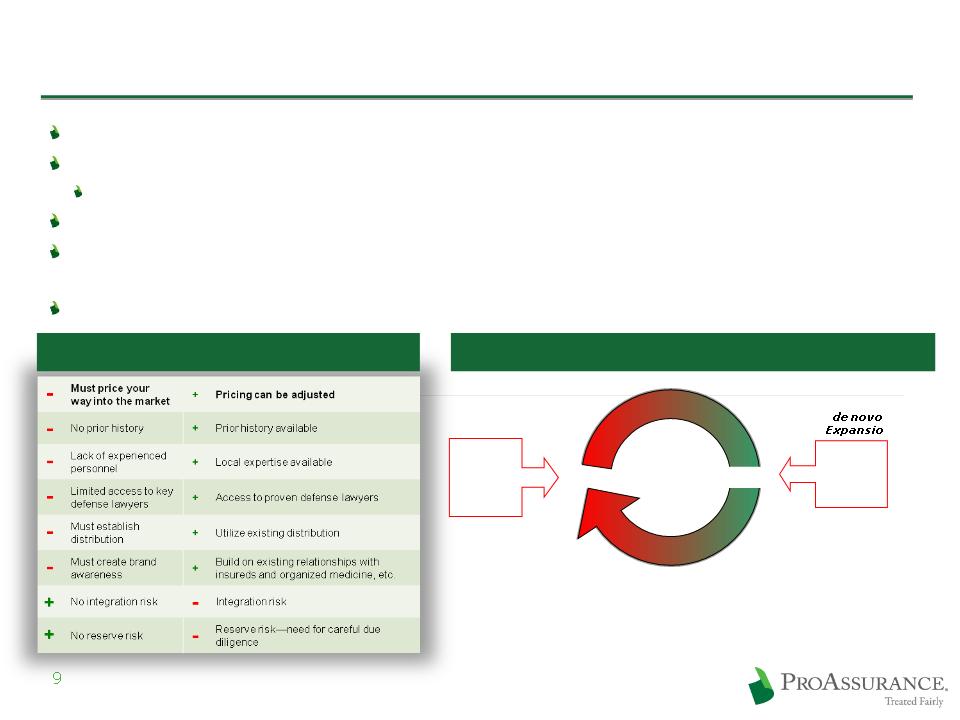
The Case for Growing Through M&A
Legal and regulatory environment must be favorable
Not all M&A opportunities should be pursued
The key is understanding why companies are available
We don’t “bet the farm” and can acquire without “breaking the bank”
We prefer “health care centric” but look for closely related liability lines to leverage expertise
(attorneys E&O for example)
(attorneys E&O for example)
Our strategy adapts to the available opportunities for profitable growth
De Novo vs. Acquisition
Soft Market
Hard Market
M & A
Internal
Growth
Growth
All avenues
open
because of
pricing
power
open
because of
pricing
power
M & A is
preferable
because of
pricing
pressure
preferable
because of
pricing
pressure
M&A and the Insurance Cycle

Strategy & Operations: Differentiation is the Key

Current Industry Status
We are in a period of “benign profitability”
Prices have been falling yet profitability remains at attractive levels
We have seen no new large scale market entry from larger commercial competitors
Some consolidation among “mid-decade” start-ups
11
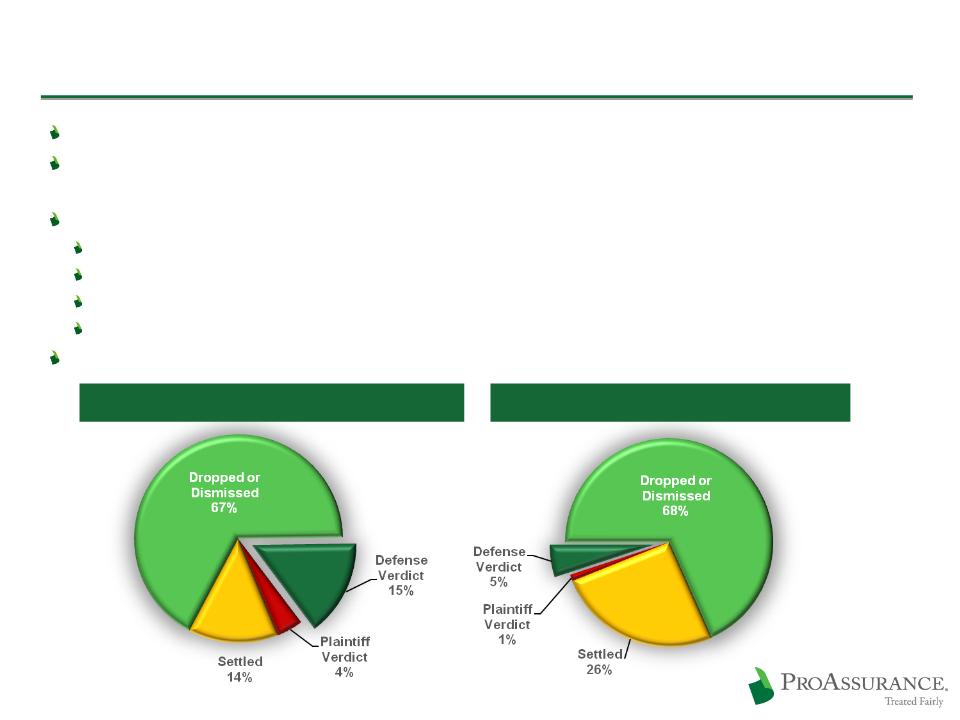
Differentiate Through Claims Defense
Our deep expertise in claims defense has always set us apart
Our financial strength gives our insureds the opportunity for an uncompromising defense of their
claim
claim
Our successful approach to claims establishes a unique competitive advantage
Differentiates our product
Provides long-term financial and marketing advantages
Ensures retention
Deters future lawsuits
Our insureds increasingly value reputational defense as claims data becomes public
12
ProAssurance: 81% Favorable Outcomes
Industry: 74% Favorable Outcomes
Source: The PIAA
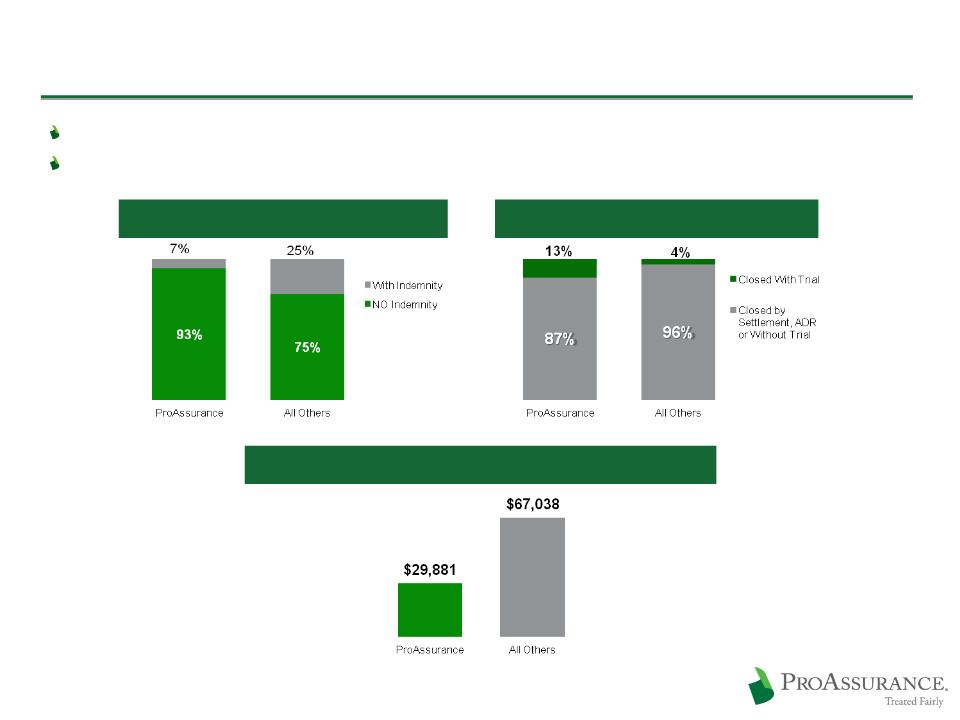
The Ohio Example: 2005 - 2008 Data
Exhaustive, reliable data provided by the Ohio Department of Insurance
Broad range of competitors and business approaches
13
www.insurance.ohio.gov/Legal/Reports/Documents/MedMal_Closed_Claim_2008.pdf
Fewer Claims Closed With Indemnity
More Claims Defended in Court
Lower Average Indemnity Payment per Closed Claim
Claims Trends Remain Favorable
With frequency down compared to mid-decade the result is fewer cases to try
Severity trends steady and manageable
Trends are much the same in states with or without Tort Reform
14
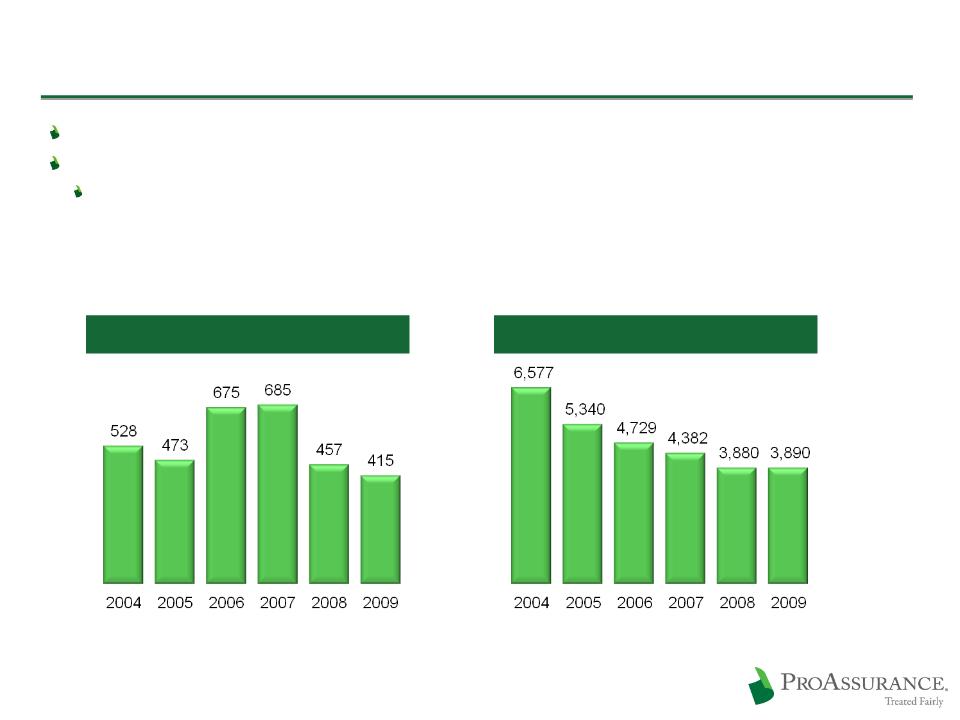
ProAssurance Claims Tried to a Verdict
New Claims Opened Each Year
Loss Trends and Rate Actions
Rates on renewing physician business down less than 12% from peak pricing in 2006
Improved frequency trends are reflected in recent rate declines
Improvement in frequency has outweighed a steady, manageable rise in severity of 3% -5% per year
Loss trends have improved in states with and without tort reforms
Rate changes (up or down) in 2011 will likely be low-to-mid single digits
Despite competitors’ concessions on pricing and terms, we are retaining existing business and
writing some new business that meets our long-term profitability goals
writing some new business that meets our long-term profitability goals
15
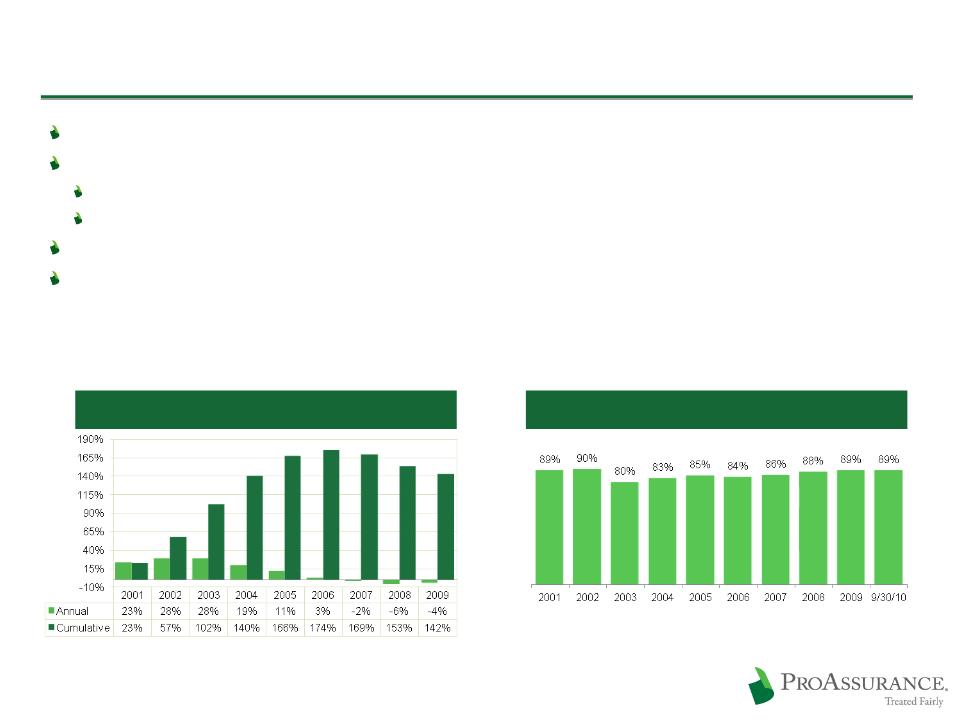
Rate Change History
Insured Retention History

Demonstrated Underwriting Performance
We enforce stringent underwriting standards to maintain rate structure and enhance profitability
Underwriting process driven by individual risk selection and assessment of loss history, areas of practice,
and location
and location
Rate filings consider the results of the past five-to-seven years to ensure a single year does not
unduly influence results
unduly influence results
ProAssurance Average: 95.3% Industry Average: 108.8%
Source: A.M. Best Aggregates and Averages, Medical Malpractice Lines of Business
16
Conservative Approach to Reserves
No change in the historic reserving practices that have produced favorable net reserve
development in each of the last seven years and YTD 2010
development in each of the last seven years and YTD 2010
Conservative reserve strategy provides protection against a loss trend reversal
Reviewed at least quarterly by internal actuarial staff
Regular outside reviews
Independent consulting actuaries (Towers Watson) conduct full review twice per year
Actuaries associated with independent auditor (E&Y) review once per year
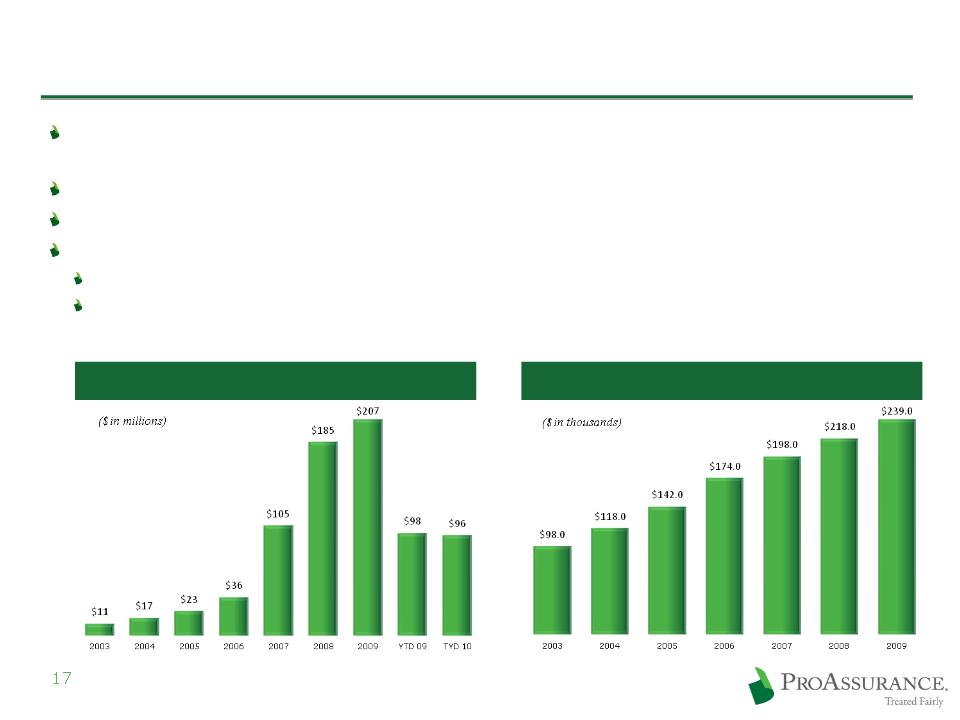
Net Reserve Development
Average Reserve per Open MPL Claim

The Effect of Legislative Changes
National: Healthcare Reform
No immediate effect—no meaningful Tort Reform in the bill
Demonstration projects do not provide meaningful reform or immediate data
More patients will ultimately require more physicians and ancillary providers
Known: More customers for us
We have enhanced our ability to write new classes of business through the acquisition
of PICA and ProAssurance Mid-Continent General Underwriters
of PICA and ProAssurance Mid-Continent General Underwriters
Unknown: Effect on the medical/legal environment
Increase patient frustration with the system
Possibility of more unexpected outcomes
May accelerate the movement of insureds into hospitals-owned practices and
larger groups
larger groups
Likely to hasten M&A amongst smaller insurers
Local: Tort Reforms
Reforms enacted in the early part of the decade are now be adjudicated before state Supreme Courts
Upheld in Maryland
Overturns in Georgia and Illinois
Split decision in Missouri
We are prepared, operationally and financially, if Tort Reforms are struck down in our states
We never give advance credit for untested reforms unless required by law or regulation
Prices are set and reserves established as if there is no tort reform, until results reflect otherwise
18
1Bureau of Labor Statistics 2008 to 2018 Projections
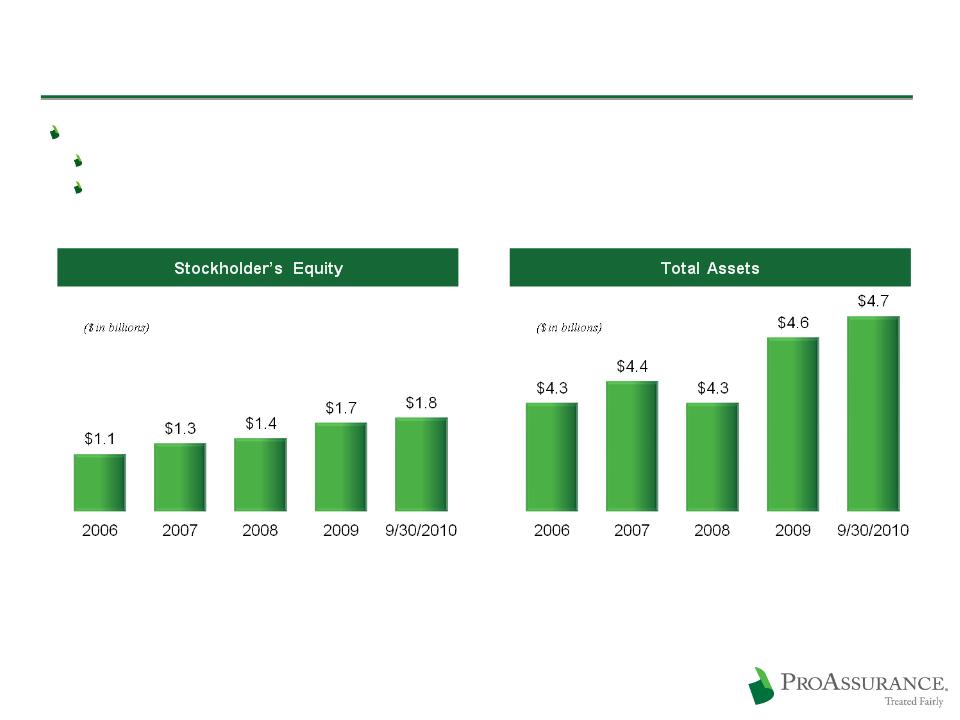
Long-Term Financial Strength Sets Us Apart
Ensuring the strength of our balance sheet is our top financial priority
Financial strength differentiates us in the market
The claims defense philosophy that differentiates us in the market leverages our financial strength
19
Up Over >60% Since 12/31/06

Financial Performance and Investments
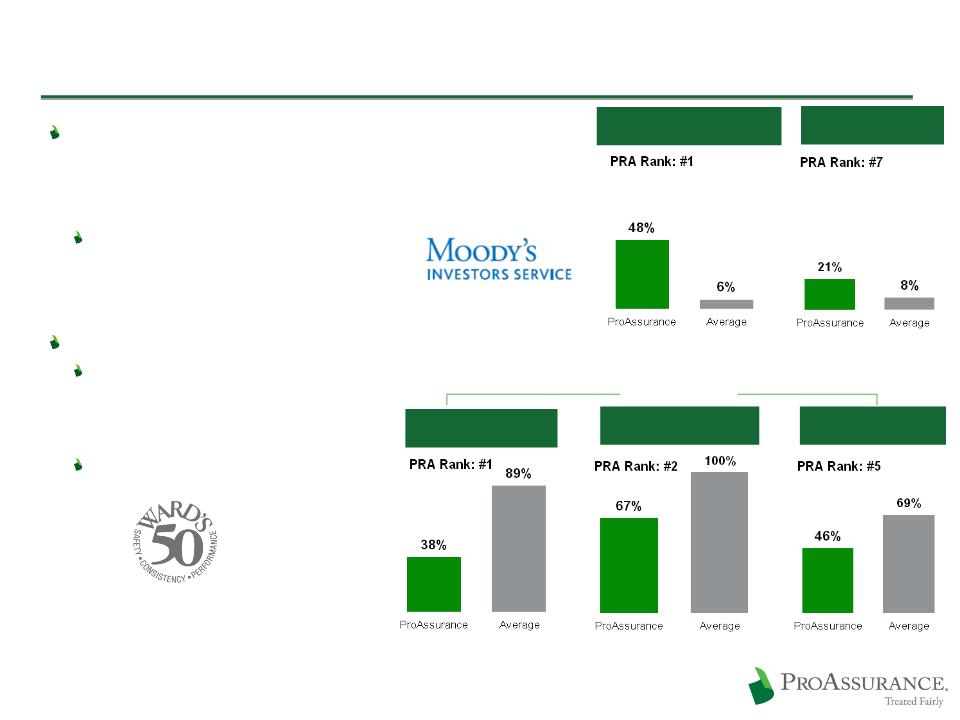
Performance Recognition
Leading industry operating
performance in 2009, ranked by
Moody’s top 100 property & casualty
insurers
performance in 2009, ranked by
Moody’s top 100 property & casualty
insurers
ProAssurance ranks 79th by premium,
but outperforms in key financial
measures
but outperforms in key financial
measures
Fourth straight year in the Ward’s 50
Recognition as one of the 50 top
performing
property & casualty insurance
companies
performing
property & casualty insurance
companies
Top 3% of all P&C companies
21
Source: Moody’s - Statistical Handbook, Ward Group’s - 2010 Ward’s 50
Lower is better
Operating Ratio
2009 Rank: #1
Combined Ratio
2009 Rank: #2
Loss & LAE Ratio
2009 Rank: #5
Return on Core Premium
2009 Rank: #1
Return on Surplus
2009 Rank: #5
22
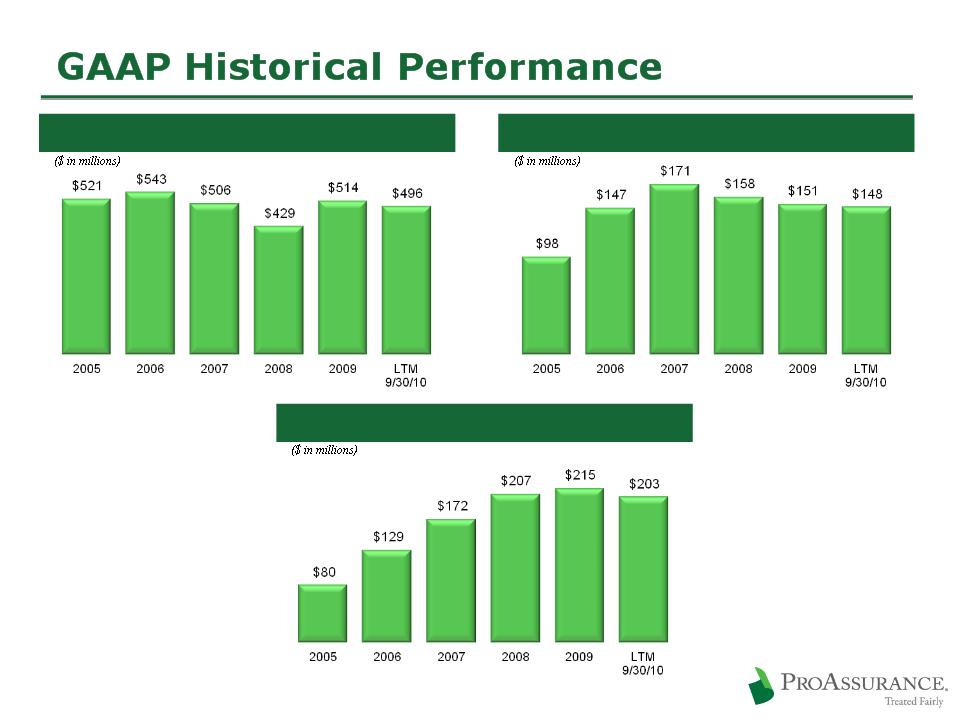
Consolidated Operating Net Income1
Net Investment Income
Net Premiums Written
1 Excludes the after-tax effects of net realized gains or losses and guaranty fund assessments or recoupments
CUSIP-level portfolio disclosure on our website:
www.proassurance.com/investorrelations/supplemental.aspx
www.proassurance.com/investorrelations/supplemental.aspx
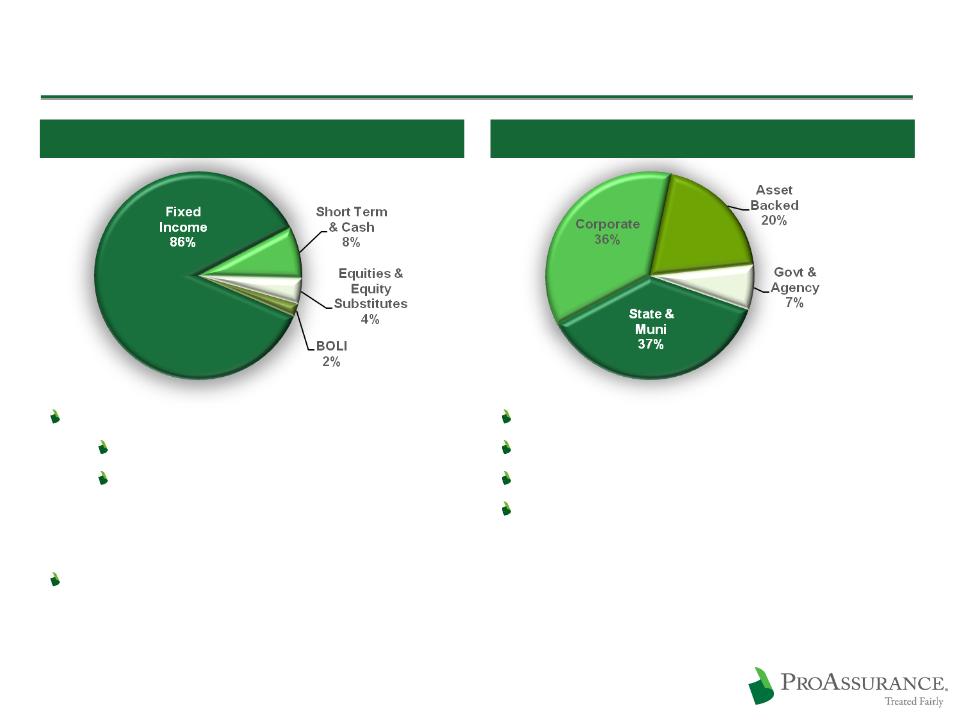
Investments Balance Risk vs. Return
23
$4 Billion Overall Portfolio
$3.5 Billion Fixed Income Portfolio
Average duration: 4.1 years
Average tax-equivalent yield: 5.0%
Investment grade: 97%
Weighted average: AA-
Key Actions in Q3
Reduced exposure to municipal bonds
Increased cash for APS purchase
9/30/10

The Importance of Investment Income
Investment income compounds significantly due to the long-tail nature of the MPL claims cycle
Lower investment results place greater emphasis on quality underwriting to achieve a combined
ratio below 100%
ratio below 100%
24
Year
1
1
Year
2
2
Year
3
3
Year
4
4
Year
5
5
Year
6
6
Year
7
7
Year
8
8
Incident
Occurs
Occurs
Discovery
and
Preparation
and
Preparation
Claim
Reported
Reported
Trial
and
Appeals
Appeals
Resolution
5-6 Years
After
Claim
Reported
After
Claim
Reported
Life Cycle of a Typical Claim
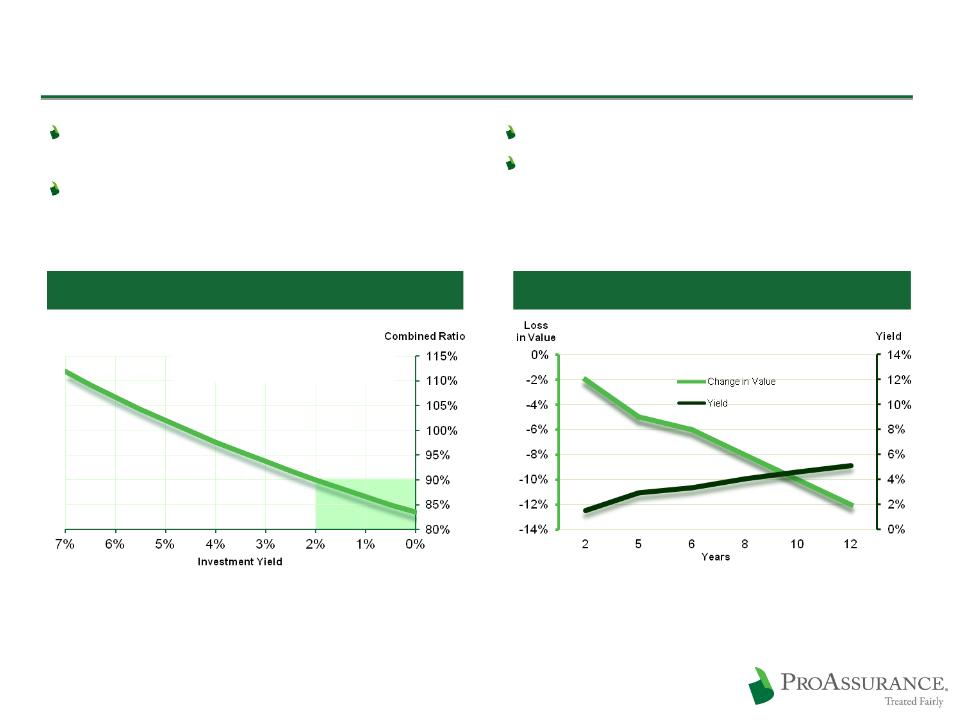
Pricing discipline becomes even more
critical in a low interest rate environment
critical in a low interest rate environment
Lack of investment yield may be a hard
market catalyst
market catalyst
Return on Equity and Investment Returns
25
Assumes a 1:1 premium to surplus ratio for physicians professional liability claims-made coverages
Combined Ration Required to
Generate a 13% Return on Equity
Generate a 13% Return on Equity
Long-Term ROE Target is 13%
The choice: chase yield or extend duration
We are maintaining duration, looking for
opportunities
opportunities
The Yield Trap
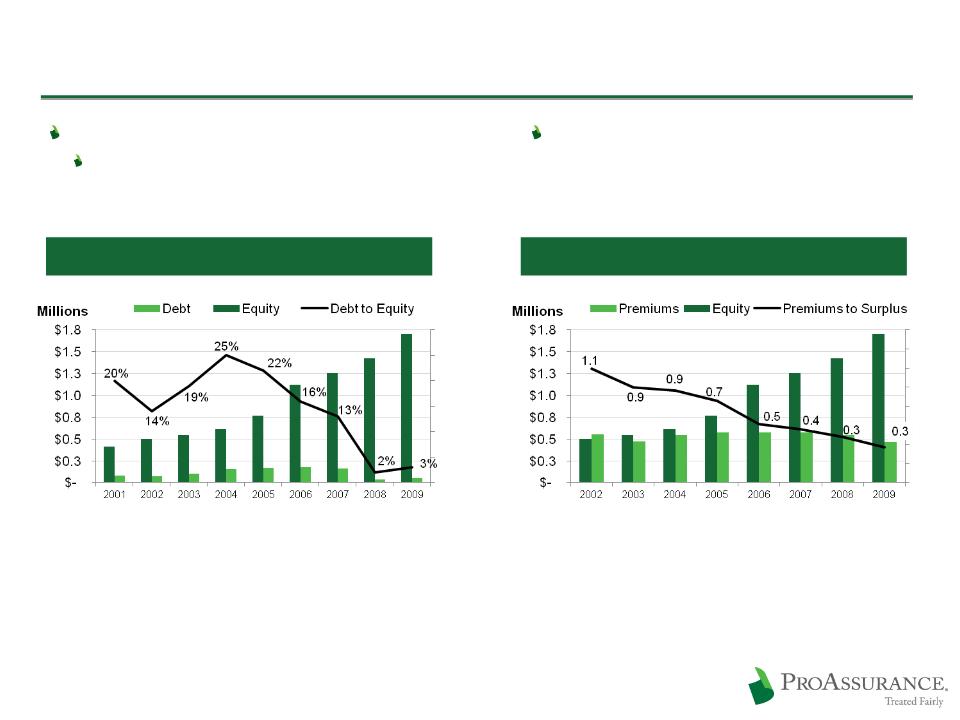
Conservative Use of Debt and Low Leverage
Low Debt to Cap Ratio
No strain on cash flow
26
Debt to Equity
No Debt Prior to 2001
Strong Capital Position
Prepared for an improving market

Capital Management
Dividends
No current dividend to shareholders
Regular evaluation by Board/Management
Ongoing commitment of cash is a key consideration
Uncertainty about future tax treatment
27
Share Repurchase
$105 million spent to date in 2010 to buy
1.8 million shares
1.8 million shares
$297 million spent to repurchase 5.7 million shares
since 2005
since 2005
Proven discipline in prudently deploying
capital
capital
Building the company and enhancing return
through M&A
through M&A
Enhancing shareholder value by repurchasing
shares at prices that build Book Value
shares at prices that build Book Value
Share Repurchase History
Conceptual Model of Projected A. M. Best BCAR Scores if
Premiums Increase
Surplus is Reduced
Excess Capital vs. Excess Capacity

Investing in ProAssurance
Driven to Excel / Focused on Shareholder Value
Maintaining our profitability and book value growth
Outstanding performance in a challenging financial market and a demanding line of insurance
Producing sustainable shareholder value
Finding the right M & A opportunities
Growing Book Value per Share
Significant share ownership at all levels
Focusing on long-term
Preparing for a changing market while maintaining our leading position in the current market
Protecting the balance sheet
Preparing for the market turn
29
Current Prices Present a Compelling Buying Opportunity
Current Price to Book: ~1.0x Average Since Inception: 1.4x

Supplemental Discussion Materials

Effective & Experienced Management
|
W. Stancil Starnes, J.D.
Chairman & Chief Executive Officer
sstarnes@proassurance.com
(205) 877-4400
Company Tenure: 3 Years
Prior MPL Experience: 29 Years
Industry & Related Experience: 32 Years
Formerly in the private practice of law in MPL defense and
complex corporate litigation. |
Victor T. Adamo, J.D., CPCU
President
vadamo@proassurance.com
(205) 877-4400
Company Tenure: 25 Years
Prior MPL Experience: 5 Years
Industry & Related Experience: 30 Years
Formerly in the private practice of corporate law.
|
Jeffrey L. Bowlby, A.R.M.
Sr. Vice-President & Chief Marketing Office
jbowlby@proassurance.com
(517) 347-6306
Company Tenure: 12 Years
Prior MPL Experience: -
Industry & Related Experience: 26 Years
Career-long experience in insurance sales and marketing,
most recently as SVP for Marketing with Meadowbrook. |
|
Howard H. Friedman, A.C.A.S.
Sr. Vice-President & Chief Underwriting Officer
hfriedman@proassurance.com
(205) 802-4796
Company Tenure: 14 Years
Prior MPL Experience: 16 Years
Industry & Related Experience: 30 Years
Career-long experience in MPL company operations
and management. Former ProAssurance CFO. |
Jeffrey P. Lisenby, J.D.
Sr. Vice-President, General Counsel &
Secretary jlisenby@proassurance.com
(205) 445-2668
Company Tenure: 9 Years
Prior MPL Experience: -
Industry & Related Experience: 9 Years
Formerly in the private practice of law.
|
Frank B. O’Neil
Sr. Vice-President & Chief Communications Officer
foneil@proassurance.com
(205) 877-4461
Company Tenure: 23 Years
Prior MPL Experience: -
Industry & Related Experience: 23 Years
Formerly a television news executive and anchor.
|
|
Edward L. Rand, Jr., CPA
Sr. Vice-President & Chief Financial Officer
erand@proassurance.com
(205) 802-4718
Company Tenure: 6 Years
Prior MPL Experience: -
Industry & Related Experience: 18 Years
Career-long experience in insurance finance and
accounting. Most recently Chief Accounting Officer for Partner Re. |
Darryl K. Thomas, J.D.
Sr. Vice-President & Chief Claims Officer
dthomas@proassurance.com
(205) 445-2668
Company Tenure: 12 Years
Prior MPL Experience: 10 Years
Industry & Related Experience: 22 Years
Career-long experience in MPL claims
management. |
Hayes V. Whiteside, M.D.
Sr. Vice-President & Chief Medical Officer
hwhiteside@proassurance.com
(205) 445-2670
Company Tenure: 6 Years
MPL Experience: -
Industry & Related Experience: 27 Years
Formerly in the private practice of Urology.
|
31
Average executive tenure through VP level is 16 years

YTD 2010 Financial Highlights
32
in millions, except per share data
Q3 12/31
2010 2009 2009 2008
Gross Premiums Written $ 415 $ 435 $ 554 $ 471
Net Investment Income 110 113 151 158
Net Income (Includes Investment Losses) 130 137 222 178
Operating Income 123 136 215 207
Net Income/Diluted Share $ 3.99 $ 4.13 $6.70 $ 5.22
Operating Income/Diluted Share $ 3.80 $ 4.08 $6.49 $ 6.07
Total Assets $ 4,771 $ 4,647 $ 4,281
Shareowners’ Equity $ 1,818 $ 1,705 $ 1,424
9/30/10 12/31/09 12/31/08
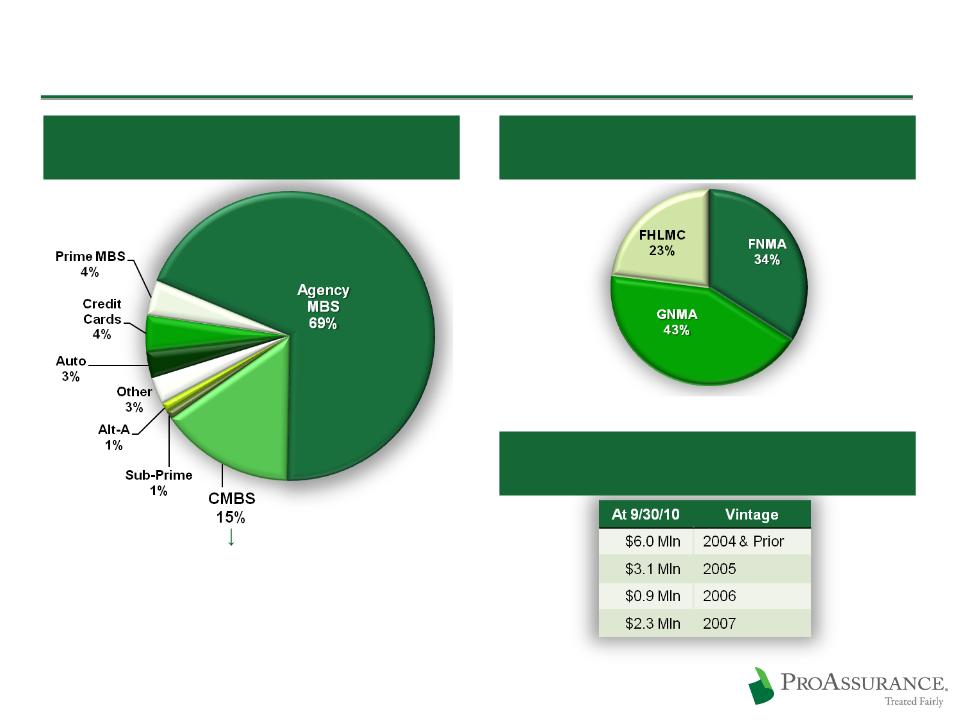
ProAssurance Portfolio Detail: Asset Backed
33
Bloomberg Data
9/30/10
9/30/10
Asset Backed: $719 Million
Weighted Average Rating: “AA+”
Breakdown of Agency MBS Holdings
CMBS Details Provided on Page 33
Sub-Prime: $12.3 Market Value (AFS)
$826,000 unrealized loss
$826,000 unrealized loss

ProAssurance Portfolio Detail: CMBS
$105 million Fair Value in non-agency CMBS
Book Value: $100 million (3% of fixed income portfolio)
No cumulative losses in our CMBS portfolio
34
9/30/10
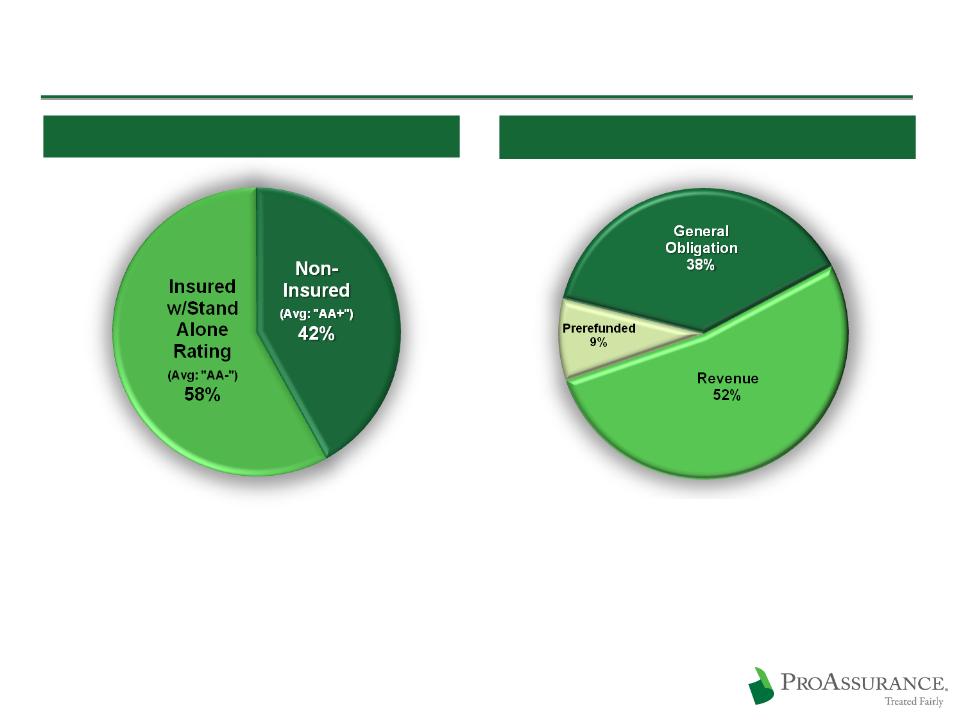
ProAssurance Portfolio Detail: Municipals
35
9/30/10
Municipals: $1.3 Billion
Sources of Revenue Backing Municipals
Investment policy has always required
investment grade rating prior to applying the
effect of insurance
investment grade rating prior to applying the
effect of insurance
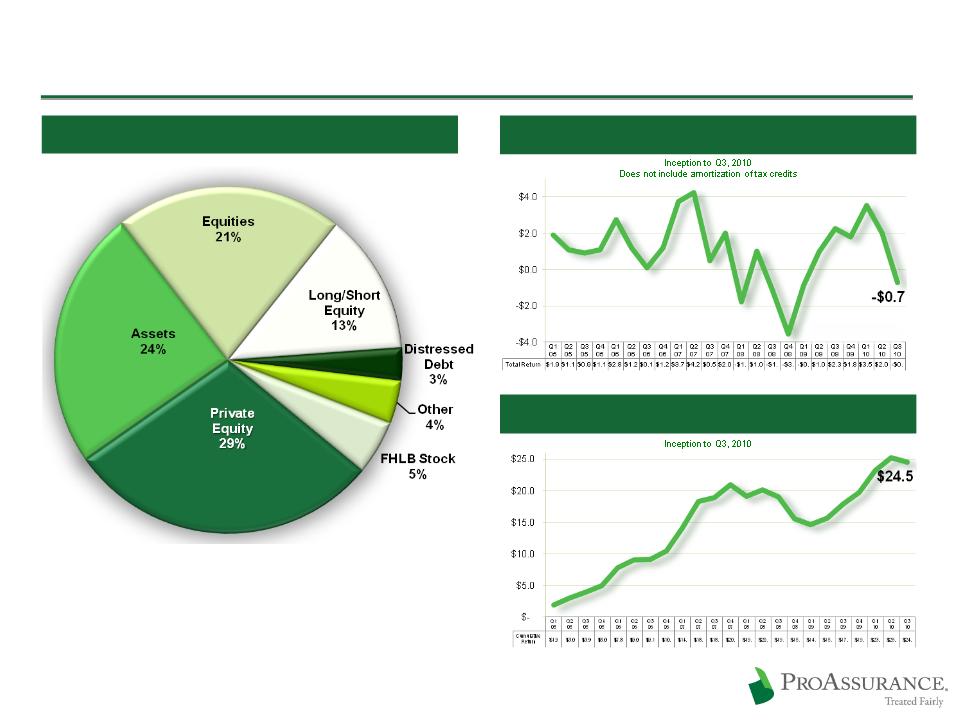
ProAssurance Portfolio Detail: Equities & Other
36
9/30/10
Equities & Other: $142 Million
Return by Quarter
Does not sum to 100% due to rounding
Cumulative Return
In millions
In millions
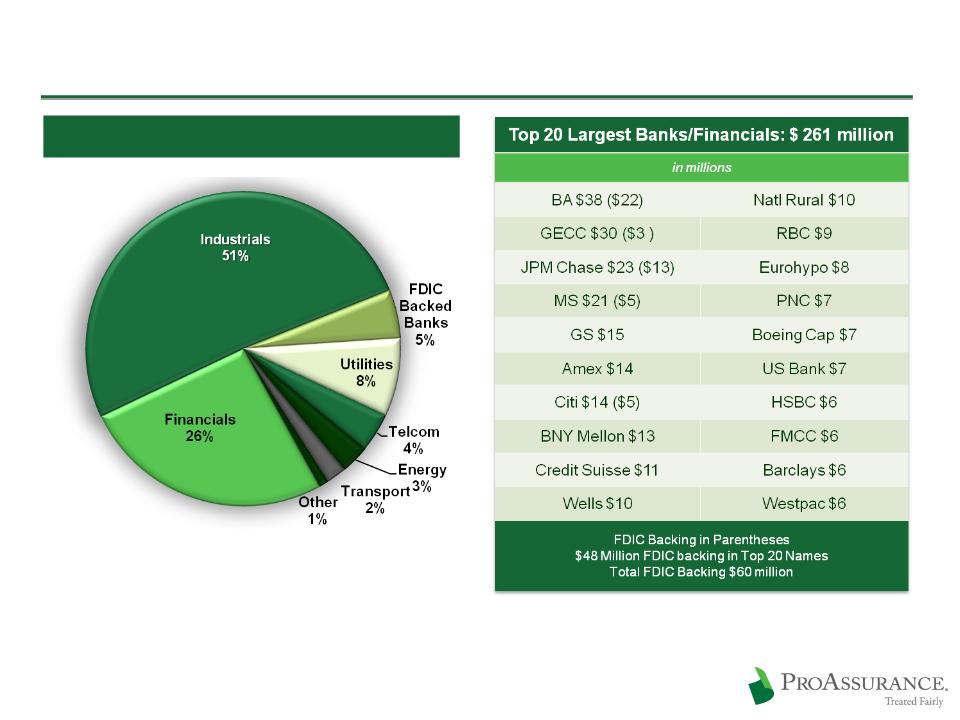
ProAssurance Portfolio Detail: Corporate
37
9/30/10
Corporates: $1.1 Billion
Weighted Average Rating: A
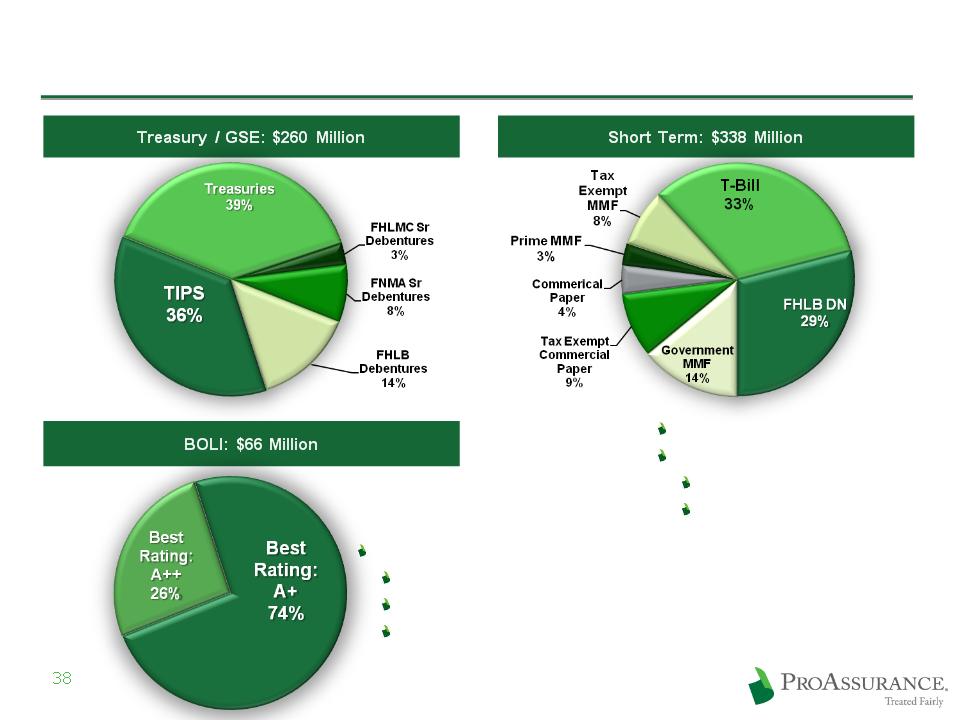
ProAssurance Portfolio Detail: Various
All 9/30/10
Rated A1/P1 or better
Money Markets:
Moody’s: Aaa
S&P: AAA
Weighted average rating
Moody’s: AA3
S&P: AA-
A. M. Best: A+