Attached files
| file | filename |
|---|---|
| 8-K - FORM 8-K - Westmoreland Resource Partners, LP | c09325e8vk.htm |
| EX-99.2 - EXHIBIT 99.2 - Westmoreland Resource Partners, LP | c09325exv99w2.htm |
Exhibit 99.1
| Jeff Gutman, SVP & CFO Brian Meilton, Investor Relations December 7, 2010 2010 Wells Fargo Securities 9th Annual Pipeline, MLP and E&P, Services & Utility Symposiums |

| 2 Forward-Looking Statements, Risk Factors and Non-GAAP Financial Measures Some of the information in this presentation may contain forward-looking statements. These statements can be identified by the use of forward-looking terminology including "will," "may," "believe," "expect," "anticipate," "estimate," "continue," or other similar words. These statements discuss future expectations, contain projections of financial condition or of results of operations, or state other "forward-looking" information. These forward-looking statements involve risks and uncertainties. When considering these forward-looking statements, you should keep in mind the risk factors and other cautionary statements in our prospectus dated July 13, 2010. Forward-looking statements are not guarantees of future performance or an assurance that our current assumptions or projections are valid. Actual results may differ materially from those projected. You are strongly encouraged to closely consider the additional disclosures contained in our prospectus, including the risk factors beginning on page 23 thereof. You may access a copy of our prospectus at www.oxfordresources.com. From time to time in our presentations, we present Adjusted EBITDA, a non-GAAP financial measure that we use in our business as it is an important supplemental measure of our performance. We believe Adjusted EBITDA provides useful information to investors to assess (i) our financial performance without regard to financing methods, capital structure or income taxes; (ii) our ability to generate cash sufficient to pay interest on our indebtedness and to make distributions to our unitholders and our general partner; (iii) our compliance with certain financial covenants applicable to our credit facility; and (iv) our ability to fund capital expenditure projects from operating cash flow. Adjusted EBITDA represents net income (loss) attributable to our unitholders before interest, taxes, DD&A, gain from purchase of business, contract termination and amendment expenses, net, amortization of below-market coal sales contracts, non-cash equity compensation expense, non-cash gain or loss on asset disposals and the change in the fair value of our future ARO. Adjusted EBITDA should not be considered an alternative to net income (loss) attributable to our unitholders, income from operations, cash flows from operating activities or any other measure of performance presented in accordance with GAAP. Adjusted EBITDA excludes some, but not all, items that affect net income (loss) attributable to our unitholders, income from operations and cash flows, and these measures may vary among other companies. Therefore, Adjusted EBITDA as presented in this presentation may not be comparable to similarly titled measures of other companies. |

| 3 We are a Leading Producer of Surface Mined Coal in NAPP and ILB Successful operating history since 1985 Among lowest cost producers in region Diverse asset base with 8 mining complexes comprised of 18 individual mines 92 million tons of reserves located in eastern Ohio (NAPP) and western Kentucky (ILB) Annual production of ~8 mt of thermal coal Strategically located in close proximity to customers in 6-state region OH IN IL KY PA WV Illinois Basin (ILB) 1 complex 4 mines ~2 mt annual production Northern App (NAPP) 7 complexes 14 mines ~6 mt annual production |

| 4 How We Got Here: Oxford's Growth Story Successful history of consolidating Ohio surface coal mining assets Expanding footprint and business model to ILB 1985 1989 1990 1993 1999 2000 2003 2007 2009 Ohio Mining Operations Kentucky Mining Operations 2006 Note: Timeline reflects date Oxford began mining operations at each respective complex. Oxford formed initially as a contract miner Harrison Plainfield Belmont Tuscarawas Acquired Phoenix Coal assets Oxford transitions to independent producer New Lexington Cadiz AIM Investment (Private equity sponsor) Noble ~92mt 0mt $162MM IPO $175MM Credit Facility NYSE: OXF 2010 |

| Our Investment Thesis Surface mining only Low cost producer Long-term customer relationships Highly contracted sales portfolio Diverse operations Strategic position in key growth markets 5 ? ? ? ? ? ? |

| 6 Lower Risk / Cost Surface Mining 1. Data as of 9/30/10. Source: EVA. Cash costs are defined as cost of coal sales (excluding DD&A) plus cost of purchased coal divided by coal sales. OXF Company A Company B Company C Company D East 29.13 33.74 37.13 53.1 55.25 39 39 39 39 39 Peer Average |
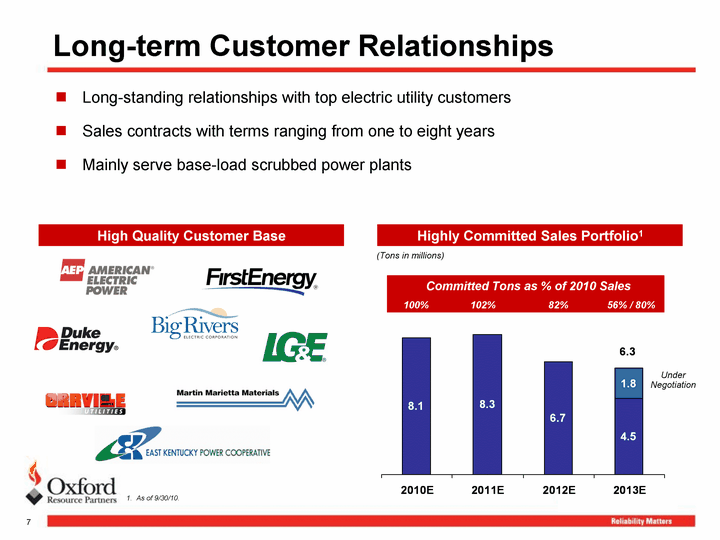
| Long-term Customer Relationships Long-standing relationships with top electric utility customers Sales contracts with terms ranging from one to eight years Mainly serve base-load scrubbed power plants High Quality Customer Base Highly Committed Sales Portfolio1 (Tons in millions) 1. As of 9/30/10. 2010E 2011E 2012E 2013E Committed Tons 8.1 8.3 6.7 4.5 1.8 6.3 100% 102% 82% 56% / 80% Under Negotiation Committed Tons as % of 2010 Sales 7 |

| Diverse Operations Transportation Regional Production Production by Mining Complex Data as of 9/30/10. ILB NAPP YTD 0.22 0.78 Cadiz Tuscarawas Belmont Plainfield New Lexington Harrison Nobile Muhlenberg YTD 0.18 0.15 0.14 0.04 0.08 0.13 0.06 0.22 Barge Rail Truck YTD 0.59 0.02 0.39 8 |
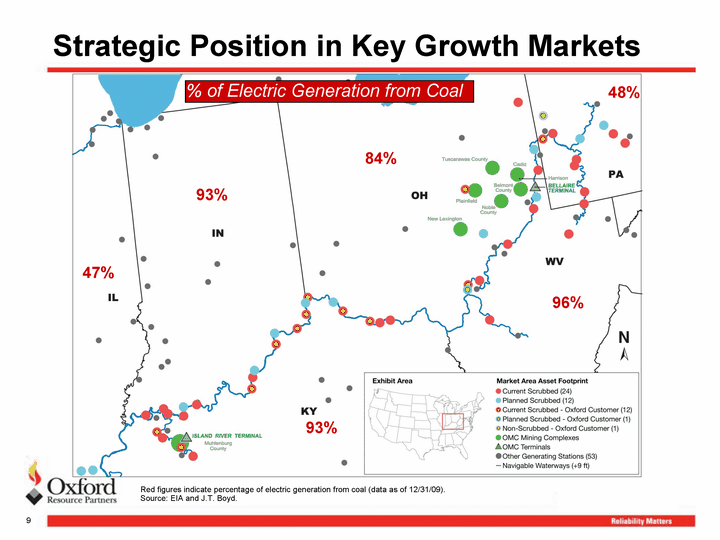
| 9 Strategic Position in Key Growth Markets 84% 96% 48% 93% 47% 93% Red figures indicate percentage of electric generation from coal (data as of 12/31/09). Source: EIA and J.T. Boyd. % of Electric Generation from Coal |

| 10 Our Region Expected to Offset CAPP Declines Central Appalachia ("CAPP") steam coal supply declines due to: Regulatory / permitting environment Increased operating costs Reserve depletion Increasingly complex geology Increased exports Steam-to-met switching Regional Production Forecasts CAPP Coal Shipments to Power Plants Source: EIA and J.T. Boyd. (Tons in millions) Down 54% Up 36% Up 43% |

| Our Long-Term Growth Strategy Organic Growth Opportunities Maximize cash flow from existing operations Contracting strategy with embedded escalators Re-pricing of below-market ILB contracts Capital investments to drive per unit costs lower Acquire adjacent reserves to existing mining complexes Acquisitions Expand footprint in NAPP and ILB primarily through acquisition of undeveloped reserves Focus on long-lived assets with low operational, regulatory and geological risk Acquire regional players as appropriate 11 |

| 12 Acquisition Methodology and Target Markets Current Operations Targeting 60 million tons of reserves in NAPP and ILB Reserve Acquisition Methodology Prudently Grow Distribution |
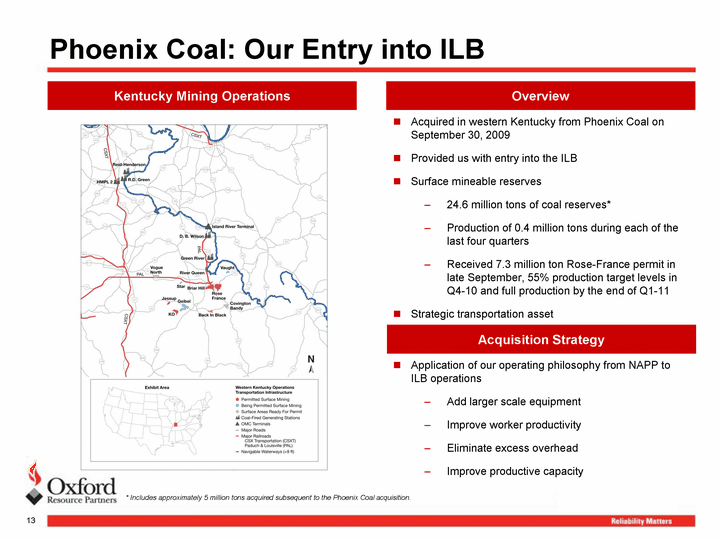
| 13 Phoenix Coal: Our Entry into ILB Acquired in western Kentucky from Phoenix Coal on September 30, 2009 Provided us with entry into the ILB Surface mineable reserves 24.6 million tons of coal reserves* Production of 0.4 million tons during each of the last four quarters Received 7.3 million ton Rose-France permit in late September, 55% production target levels in Q4-10 and full production by the end of Q1-11 Strategic transportation asset Overview Kentucky Mining Operations * Includes approximately 5 million tons acquired subsequent to the Phoenix Coal acquisition. Application of our operating philosophy from NAPP to ILB operations Add larger scale equipment Improve worker productivity Eliminate excess overhead Improve productive capacity Acquisition Strategy |

| Phoenix Coal: Initial Results of Our Acquisition Strategy Driving Costs Lower (Cost per Ton)1 Phoenix Cost Structure Oxford Cost Structure $6.49 per ton Without major capital investments Portfolio Repricing (35%-45% Executed) (Committed ASP Increase of 54%) Phoenix ASP Contracted ASP2 $17.50 per ton 55% to 65% open tons in 2012 1.4 million to 1.6 million open tons 14 1. Defined as cost of coal sales (excluding DD&A) / clean tons mined. 2. Contracted ASP represents 800,000 to 1,000,000 tons annually, which represents approximately 35% to 45% of 2010 estimated sales. |
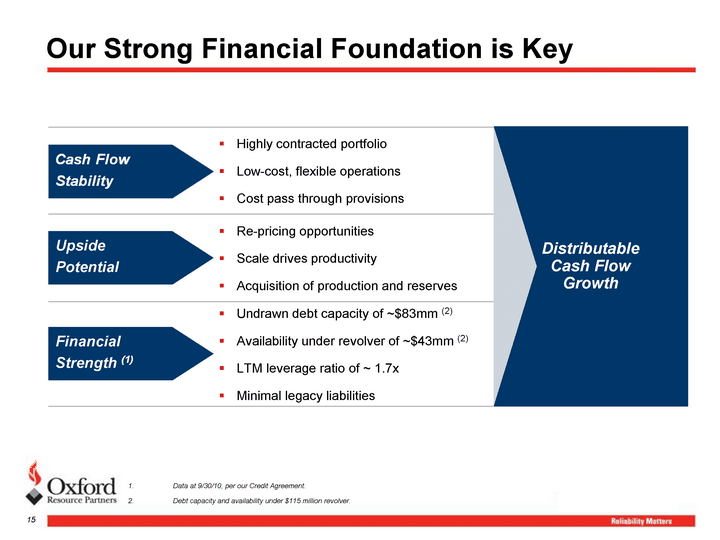
| 15 15 Our Strong Financial Foundation is Key Highly contracted portfolio Low-cost, flexible operations Cost pass through provisions Re-pricing opportunities Scale drives productivity Acquisition of production and reserves Undrawn debt capacity of ~$83mm (2) Availability under revolver of ~$43mm (2) LTM leverage ratio of ~ 1.7x Minimal legacy liabilities Cash Flow Stability Upside Potential Cash Flow Stability Financial Strength (1) Data at 9/30/10, per our Credit Agreement. Debt capacity and availability under $115 million revolver. Distributable Cash Flow Growth |

| 16 Summary Financial Profile Revenue Coal Sales Coal Production 1. Historical Adjusted EBITDA as stated in our Company filings, LTM Adjusted EBITDA as defined in our Credit Agreement. 2. Excludes a $13.2 million non-recurring price increase as discussed in our Company filings. Recurring Adjusted EBITDA 1 ($ in millions) ($ in millions) (Tons in millions) (Tons in millions) 2 |
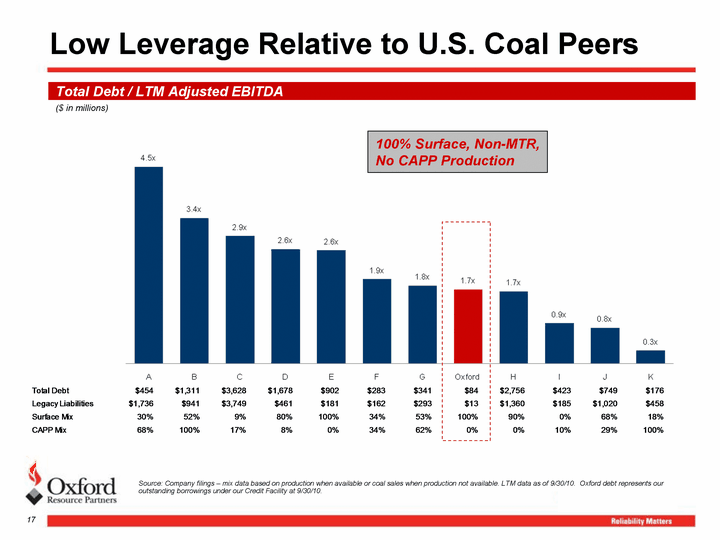
| Low Leverage Relative to U.S. Coal Peers Source: Company filings - mix data based on production when available or coal sales when production not available. LTM data as of 9/30/10. Oxford debt represents our outstanding borrowings under our Credit Facility at 9/30/10. 100% Surface, Non-MTR, No CAPP Production Total Debt / LTM Adjusted EBITDA ($ in millions) 17 |
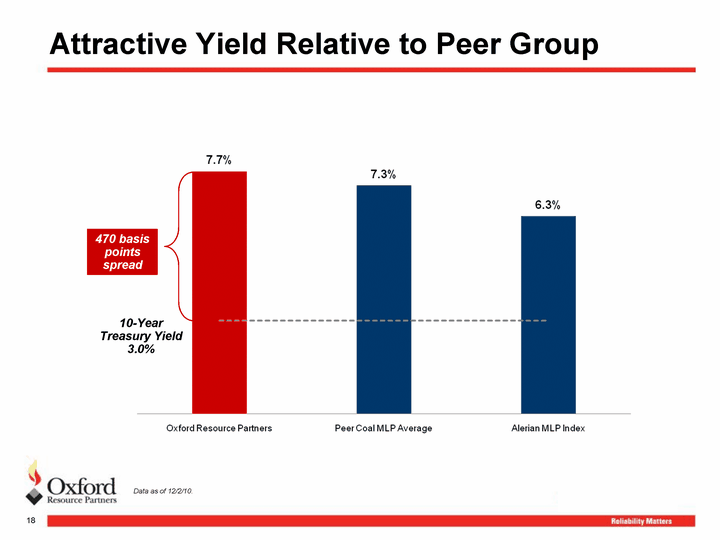
| Attractive Yield Relative to Peer Group Data as of 12/2/10. 18 10-Year Treasury Yield 3.0% 470 basis points spread |

| 19 In Summary, OXF offers... ? ? ? ? Cash Flow Stability Through Significantly Contracted Tonnage Diverse Asset Base with Strategically Located Infrastructure Low Cost Producer Status with Large Scale Equipment and Non-union Workforce Successful History of Reserve Base and Production Growth |

| 20 Oxford is a Top 20 Domestic Coal Producer *Source: Boyd and MSHA; 2009 production data, Oxford is pro forma Phoenix Coal acquisition. #14 - U.S. Surface #18 - Total U.S. #14 - U.S. Surface Mining Only #11 - Total East of Mississippi River #5 - East of Mississippi River Surface Only |

| Oxford Resource Partners, LP NYSE: OXF ir@oxfordresources.com www.oxfordresources.com |
