Attached files
| file | filename |
|---|---|
| 8-K - CURRENT REPORT ON FORM 8-K - Expedia Group, Inc. | d8k.htm |
 EXPEDIA, INC.
A complete travel commerce experience
Exhibit 99.1 |
 EXPEDIA, INC.
Forward-Looking Statements
This presentation contains “forward-looking statements” within the meaning of the
Private Securities Litigation Reform Act of 1995, including statements about the future
financial and operational performance of the Company. These statements are not guarantees of future performance.
These forward-looking statements are based on management’s expectations as of December 6,
2010, and assumptions which are inherently subject to uncertainties, risks and changes in
circumstances that are difficult to predict. The use of words such as “believe,” “forecast,”
“opportunity,” “intends,” “anticipates,” and “expects,” among
others, generally identifies forward-looking statements. However, these words are not the
exclusive means of identifying such statements. In addition, any statements that refer to expectations, projections or other characterizations of
future events or circumstances are forward-looking statements and may include statements relating
to future revenues, expenses, margins, profitability, net income, earnings per share and other
measures of results of operations and the prospects for future growth of Expedia, Inc.’s
business.
Actual results and the timing and outcome of events may differ materially from those expressed or
implied in the forward-looking statements for a variety of reasons, including, among
others: continued or prolonged adverse economic conditions leading to decreased consumer and business
spending; changes in our relationships and contractual agreements with travel suppliers or global
distribution system partners; adverse changes in senior management; the rate of growth of online
travel; our inability to recognize the benefits of our investment in technologies; changes in the
competitive environment, the e-commerce industry and broadband access and our ability to respond
to such changes; declines or disruptions in the travel industry (including those caused by
adverse weather, bankruptcies, health risks, war and/or terrorism); the rate of online migration in the
various geographies and markets in which Expedia, Inc. operates, including Eastern Europe and Asia,
fluctuations in foreign exchange rates, risks related to our long term indebtedness, including
the ability to access funds as and when needed; changing laws, rules and regulations and legal
uncertainties relating to our business; Expedia, Inc.’s ability to expand successfully in
international markets; possible charges resulting from, among other events, platform migration;
failure to realize cost efficiencies; the successful completion of any future corporate transactions or
acquisitions; the integration of current and acquired businesses; and other risks detailed in
Expedia’s, Inc.’s public filings with the SEC, including Expedia, Inc.’s annual
report on Form 10-K for the year ended December 31, 2009 and subsequent Forms 10-Q. Except as required by law, Expedia, Inc. undertakes no obligation to update any
forward-looking or other statements in this presentation, whether as a result of new
information, future events or otherwise. Reconciliations of non-GAAP measures included in this presentation to the most comparable GAAP
measures are included in Appendix A. Trademarks and logos are the property of their respective owners. © Expedia, Inc. All rights
reserved. CST: #2029030-50 |
 Expedia, Inc. is building the world’s largest
and most intelligent travel marketplace.
We generate revenue by addressing the entire
travel commerce experience, enabling travelers to
research, plan and book their trip, offering service
while they travel, and providing the online forums
to review hotels, discuss destinations and share
experiences. |
 Number of unique
visitors to Expedia, Inc. sites
worldwide each month
73+
million
The world’s largest
travel marketplace
Source: comScore Sept. 2010, unduplicated |
 Serving travelers in over
60
countries
The world’s largest
travel marketplace |
 160+
booking and travel media sites
The world’s largest
travel marketplace |
 Offering hotels in over
200
countries
The world’s largest
travel marketplace |
 EXPEDIA, INC.
Where to go
Pricing and deals
Where to stay
Best airplane seat
Things to do
Research &
Planning
Addressing the entire travel commerce experience |
 EXPEDIA, INC.
Air
Hotel
Vacation packages
Cruise
Rental car
Insurance
Activities
Booking
Research &
Planning
Addressing the entire travel commerce experience |
 EXPEDIA, INC.
Concierge services
Destination guides
Mobile apps
24-hour customer service
Booking
Research &
Planning
Addressing the entire travel commerce experience
Traveler forums
Hotel reviews
Destination videos
Travel &
Sharing |
 |
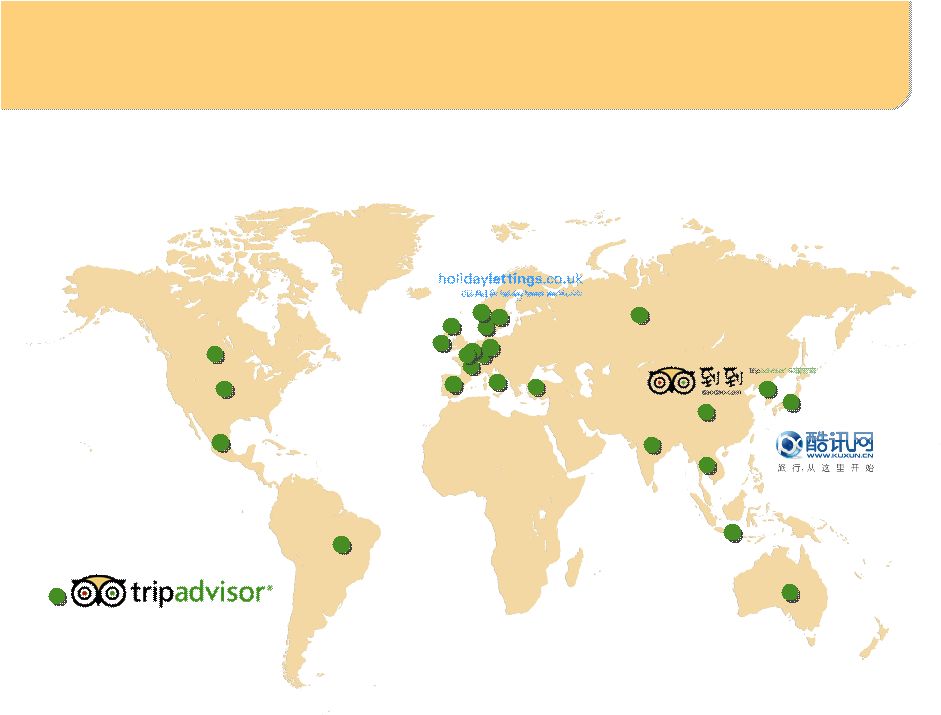
 TripAdvisor
®
is the world’s
largest travel community,
with the largest collection of
traveler reviews and content
on destinations and travel
accommodations.
TripAdvisor Media Network
40
million
monthly unique visitors
Source: comScore August 2010, unduplicated |
 TripAdvisor is the world’s
largest travel community,
with the largest collection of
traveler reviews and content
on destinations and travel
accommodations.
TripAdvisor Media Network
20
million
registered users |
 18
TripAdvisor Media
Network brands
TripAdvisor is the world’s
largest travel community,
with the largest collection of
traveler reviews and content
on destinations and travel
accommodations.
TripAdvisor Media Network |
 Operating in
24
countries
TripAdvisor is the world’s
largest travel community,
with the largest collection of
traveler reviews and content
on destinations and travel
accommodations.
TripAdvisor Media Network |
 TripAdvisor is the world’s
largest travel community,
with the largest collection of
traveler reviews and content
on destinations and travel
accommodations.
TripAdvisor Media Network
40
million
hotel reviews |
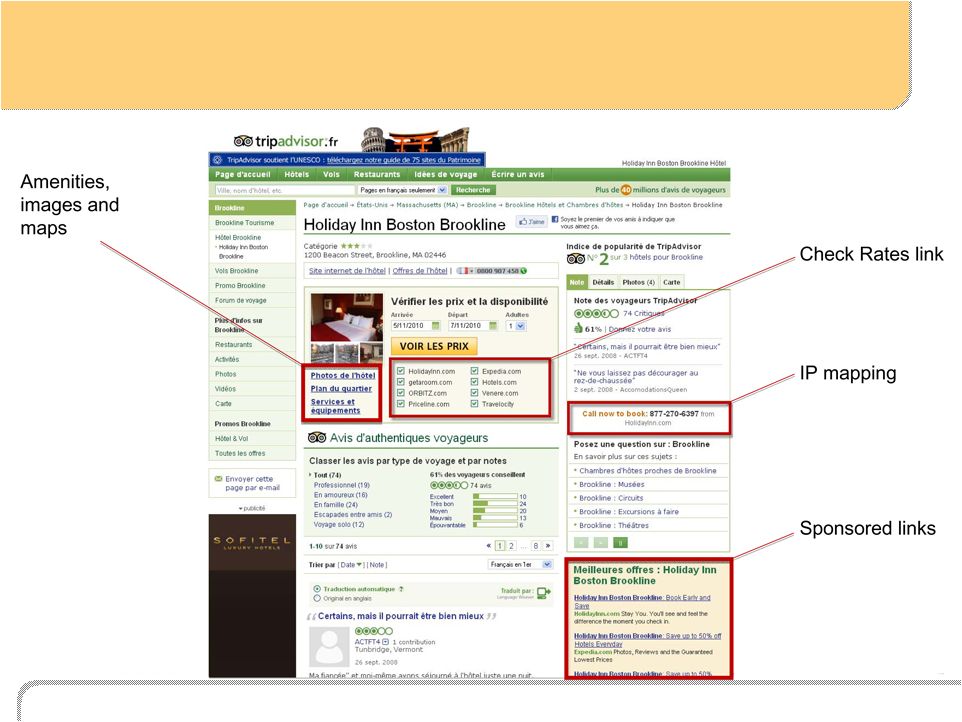
 EXPEDIA, INC.
Content and advice for all aspects of travel
World’s largest travel community
Air travel content & community |
 EXPEDIA, INC.
Content and advice for all aspects of travel
Traveler content and community sites |
 EXPEDIA, INC.
Content and advice for all aspects of travel
Travel deals and price comparison |
 EXPEDIA, INC.
77%
58%
22%
+10%
+11%
+15%
54%
37%
21%
Internet penetration
Estimated online advertising growth
Estimated online share of consumer travel spending
Global online ad market expected to reach
~$100 billion by 2014
Global market opportunity for online travel media
Sources: www.internetworldstats.com
Online Advertising growth = CAGR 2010 - 2014 estimated using eMarketer Sept.
2010 report as the primary source PhoCusWright studies spanning 2009 and 2010
Online Advertising market eMarketer September 2010 report
|
 EXPEDIA, INC.
Serving travelers across the globe
100% YOY growth in each of the last four quarters
TripAdvisor international third-party revenue now ~40%
|
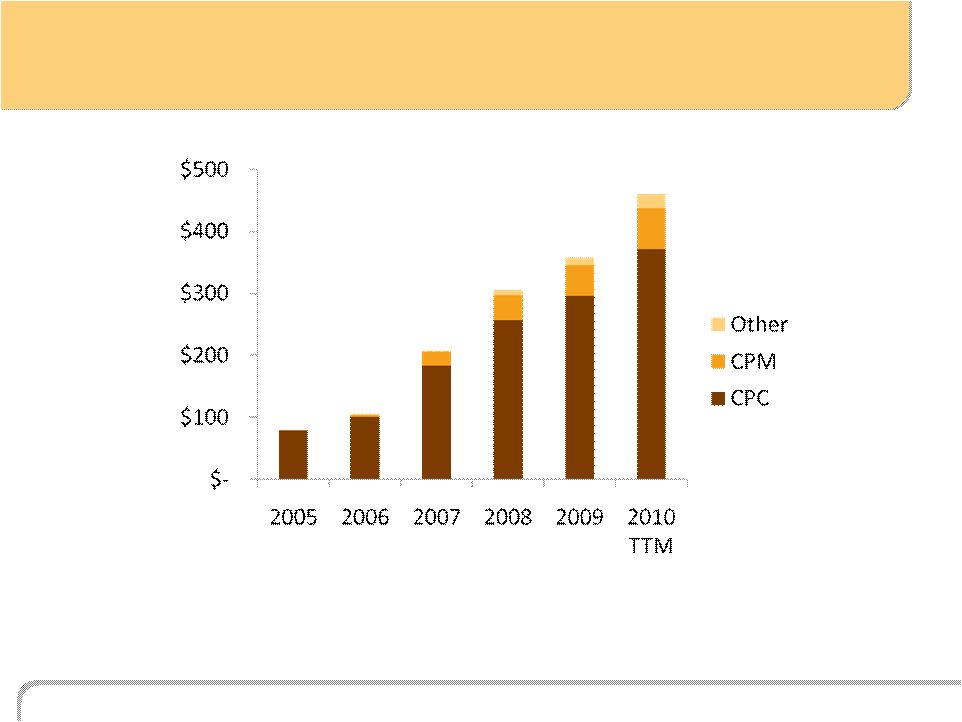
 TTM revenue of
$401
million
Monetizing travel media
Expedia’s robust and fast-
growing advertising and
media businesses make us
unique in the industry, and
allow us maximum flexibility
as the industry evolves.
As of Sept. 30, 2010 |
 Monetizing travel media
Expedia’s robust and fast-
growing advertising and
media businesses make us
unique in the industry, and
allow us maximum flexibility
as the industry evolves.
An increase of
+34%
year over year |
 Monetizing travel media
Expedia’s robust and fast-
growing advertising and
media businesses make us
unique in the industry, and
allow us maximum flexibility
as the industry evolves.
Percent of EI revenue TTM
12% |
 Monetizing travel media
Expedia’s robust and fast-
growing advertising and
media businesses make us
unique in the industry, and
allow us maximum flexibility
as the industry evolves.
OIBA margins of
>50% |
 We believe this can be a
$1 Billion
business.
Monetizing travel media |
 TripAdvisor Media Network
A range of opportunities for travel advertisers |
 EXPEDIA, INC.
Cost-Per-Click (CPC) |
     EXPEDIA, INC.
Display (CPM) |
 EXPEDIA, INC.
Subscription-based Business Listings |
 EXPEDIA, INC.
A
range
of
opportunities
for
travel
advertisers
Total TripAdvisor
Gross Revenue
(in millions) |
       EXPEDIA, INC.
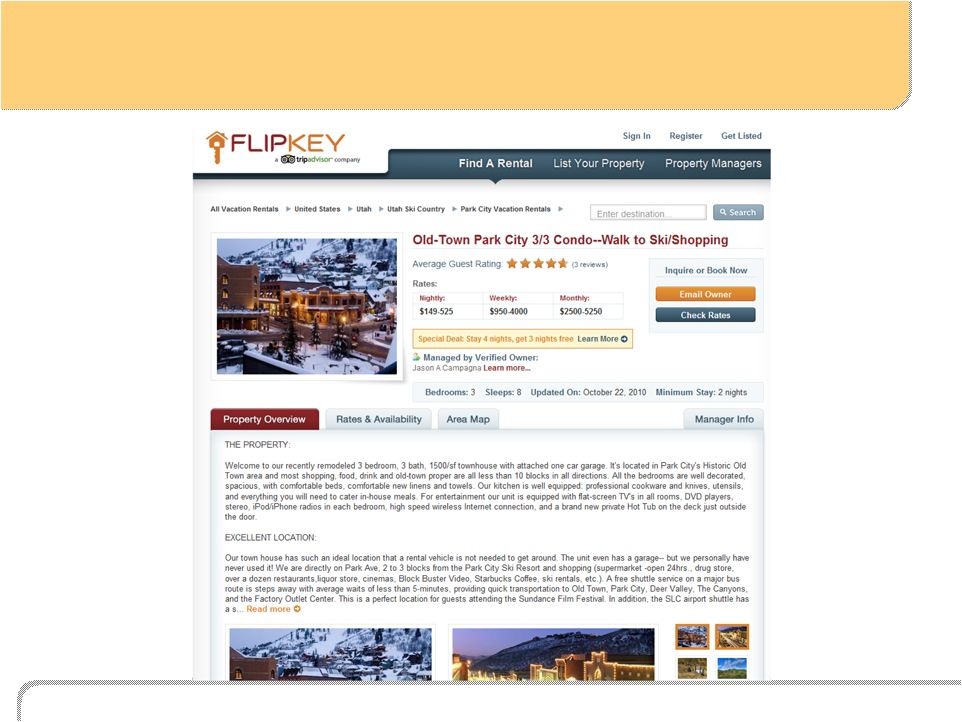
Media products on booking sites |
 |
 96
leisure booking sites
Nobody matches supply
with demand on a global
basis at our scale.
Booking the trip |
 Nobody matches supply
with demand on a global
basis at our scale.
Booking the trip
Serving travelers in over
60
countries |
 Nobody matches supply
with demand on a global
basis at our scale.
Booking the trip
300+
airlines |
 130K
hotels
Nobody matches supply
with demand on a global
basis at our scale.
Booking the trip |
 EXPEDIA, INC.
Unpublished rate booking site
Hotel specialist with over 70 sites
in over 60 countries
Booking the trip
World’s largest OTA, focusing
on the whole trip
5
th
largest full-service corporate travel
management company in the world |
 EXPEDIA, INC.
Booking the trip
Luxury travel provider
Offline cruise travel agency
with retail presence
Leading Chinese OTA
Italy-based agency
hotel bookings provider
Online car rentals consolidator |
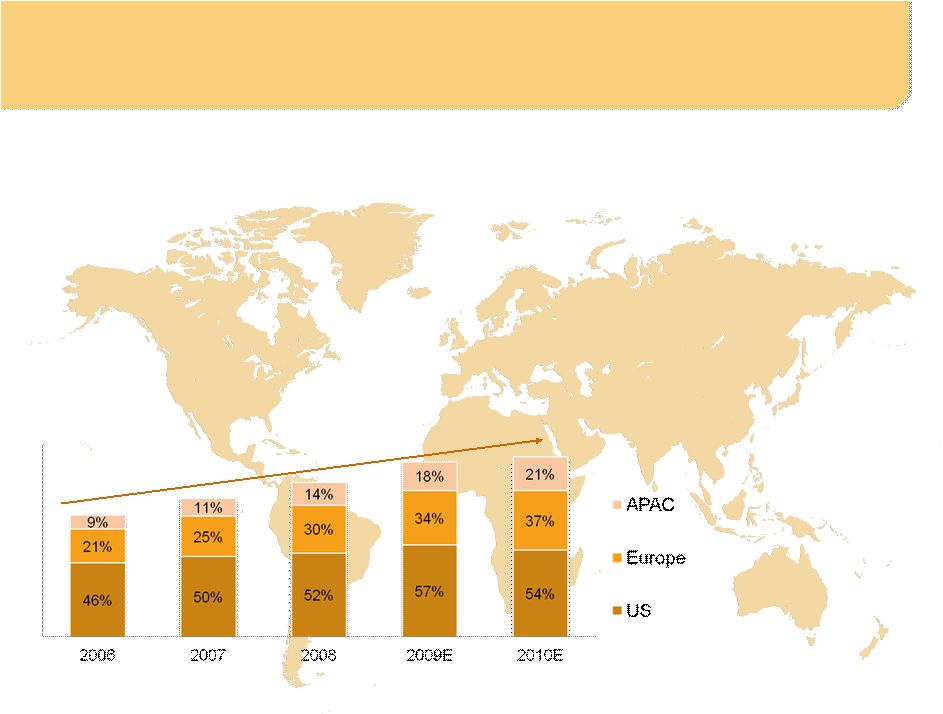 EXPEDIA, INC.
$255B
$293B
$212B
Size of travel market
Online penetration
54%
37%
21%
Source: PhoCusWright studies
spanning 2009 and 2010
Global market opportunity for online travel bookings
Estimated Online Penetration
Estimated Online Penetration |
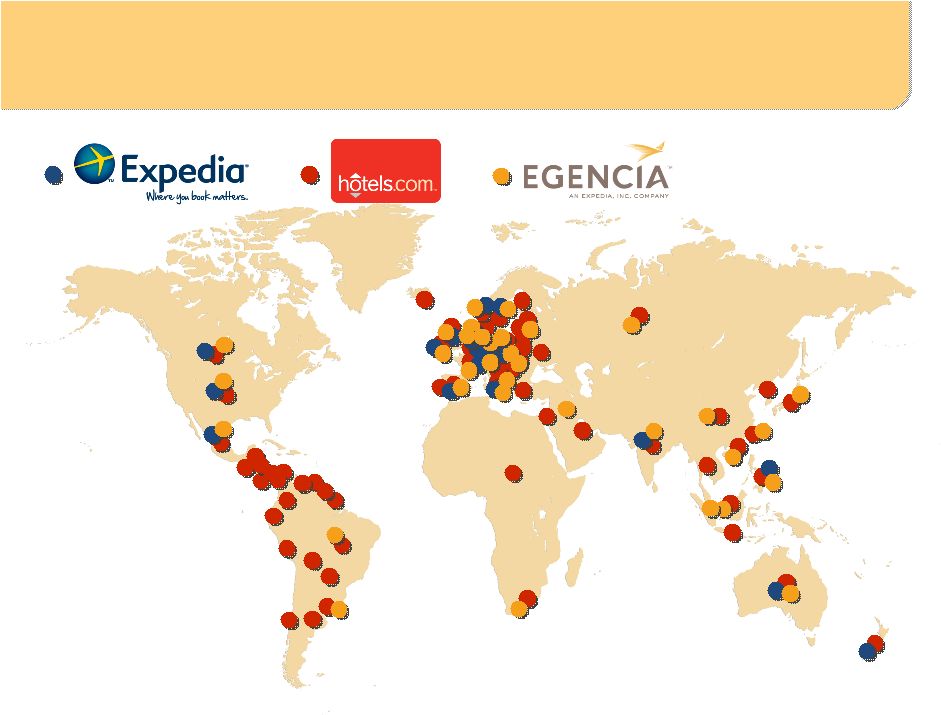 EXPEDIA, INC.
Serving travelers across the globe |
 EXPEDIA, INC.
Maintaining the broadest supply portfolio
Hotel
•
>130,000 hotels offered making up ~60% of EXPE worldwide annual
revenue (TTM)
•
~55% merchant model hotels
•
~25% agency model hotels
•
Expedia accounts for 7% of room nights in the Top 20 U.S. markets
Air
•
Air revenue ~12% of EXPE worldwide annual revenue (TTM)
•
Revenue largely unit / volume driven
Cruise, Car and Destination Services comprise >10% worldwide
annual revenue (TTM)
>15% of EXPE gross bookings are package or multi-component transactions
for same itinerary (TTM)
Source for 7% room night share stat = STR YTD through Sept. 2010
|
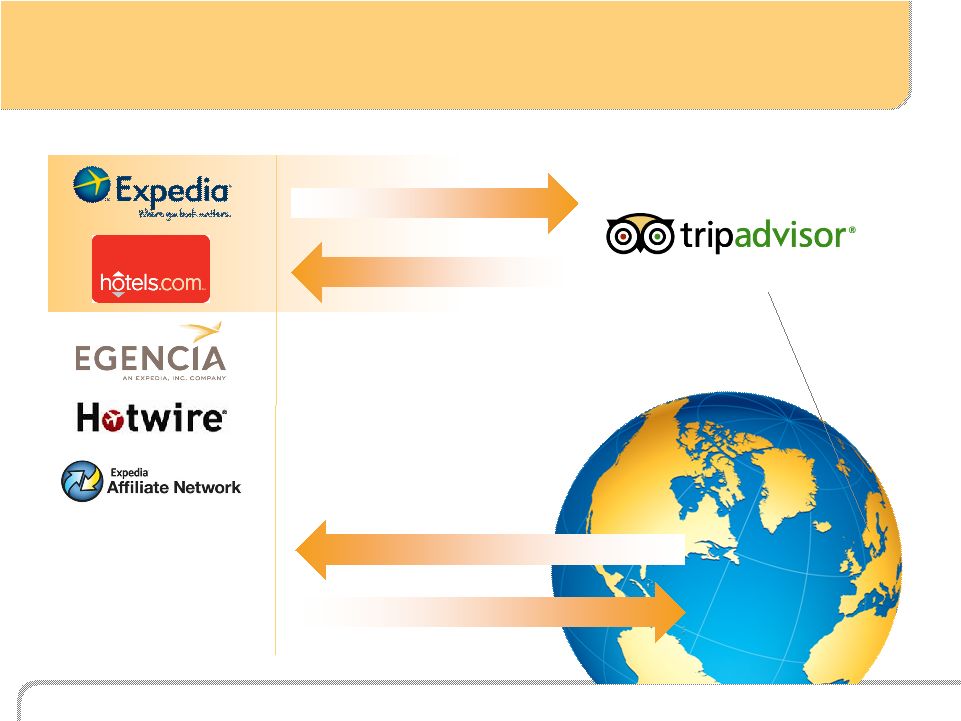 EXPEDIA, INC.
Collaboration & Integration = Growth
Global supply team serves booking brands
Booking sites in
over 60 countries
Enters new markets
TripAdvisor’s first advertisers
Drives traffic to booking sites
Customer volume and reach = value to suppliers |
 EXPEDIA, INC.
There is a huge worldwide market opportunity as additional
travel dollars move online around the world.
Taking flight off an extended runway
Worldwide travel market
$>760
billion
<40%
online
penetration
Worldwide Internet penetration
29%
445%
growth rate
Expedia 9.30 TTM leisure revenue
$2.8
billion
9%
growth rate
Expedia 9.30 TTM media revenue
$401
million
34%
growth rate
Sources: PhoCusWright studies spanning 2009 and 2010,
www.internetworldstats.com |
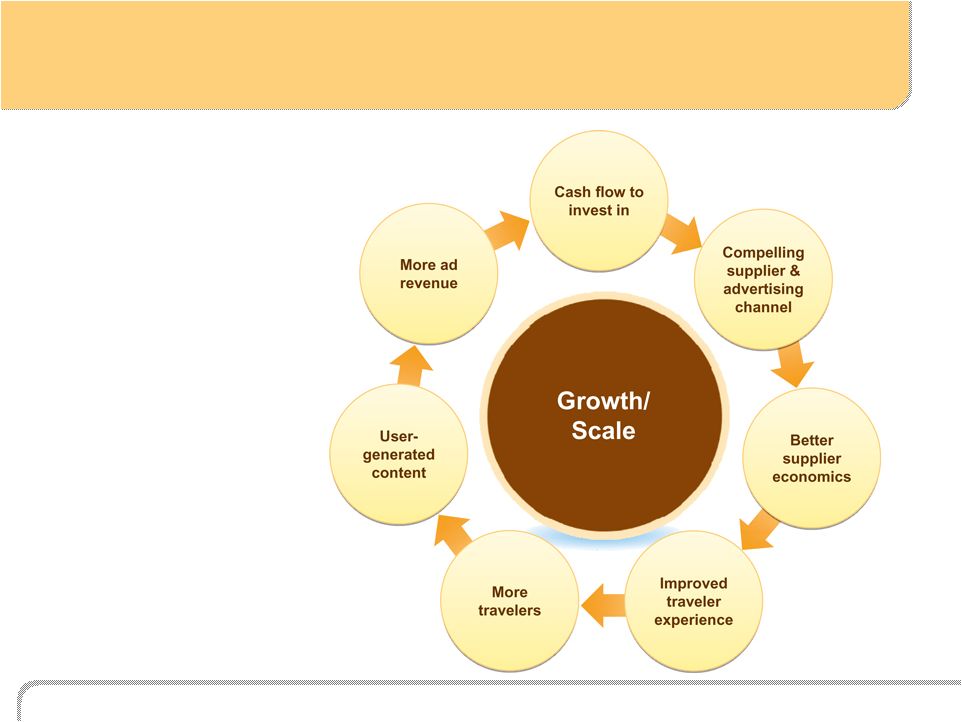 EXPEDIA, INC.
Virtuous Cycle
The bigger and
better we get,
the bigger and
better we get. |
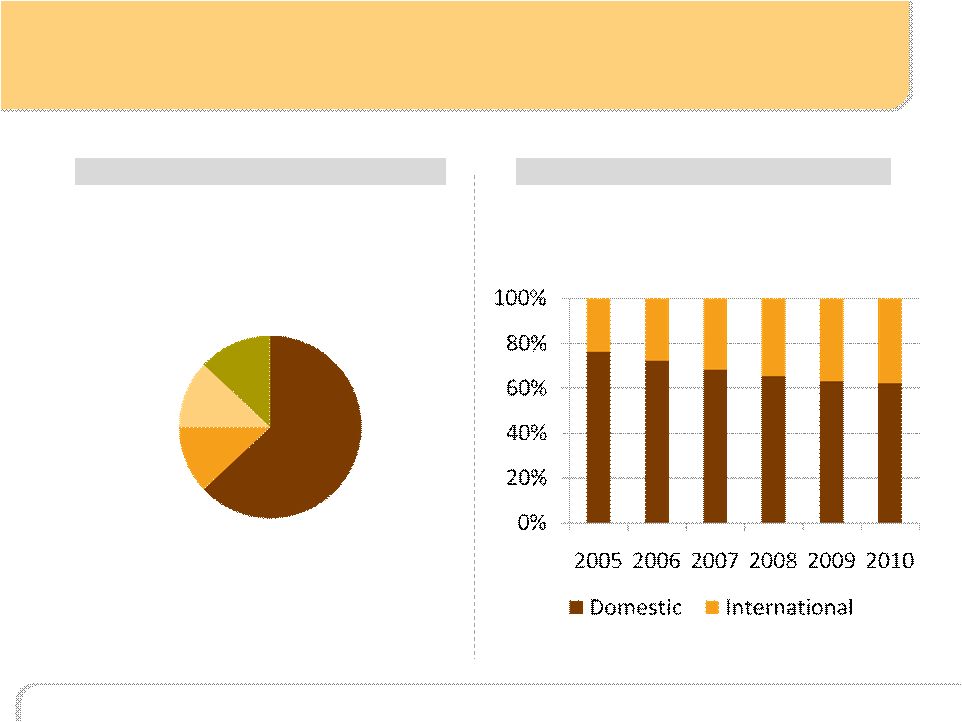 EXPEDIA, INC.
Diverse revenue streams
Geographic Split (TTM 9.30.10)
Revenue
Product Categories (TTM 9.30.10)
Hotel
63%
Revenue
Air
12%
Advertising & Media
12%
Car, Cruise & Other
13% |
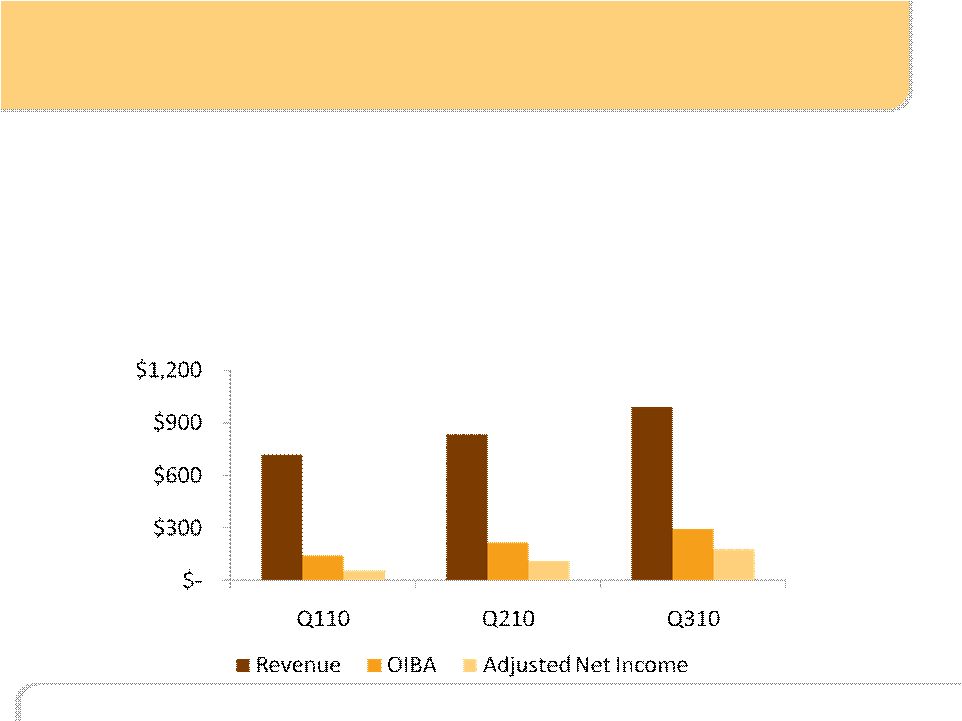 EXPEDIA, INC.
Solid performance…
•
Positive top-line growth
•
3Q10 YOY revenue growth two times faster than 2Q10 YOY revenue
growth
•
Continue to generate substantial revenue, profits and free cash flow
13%
8%
16%
10%
24%
3%
15%
14%
32%
See Appendix A for reconciliation to GAAP number |
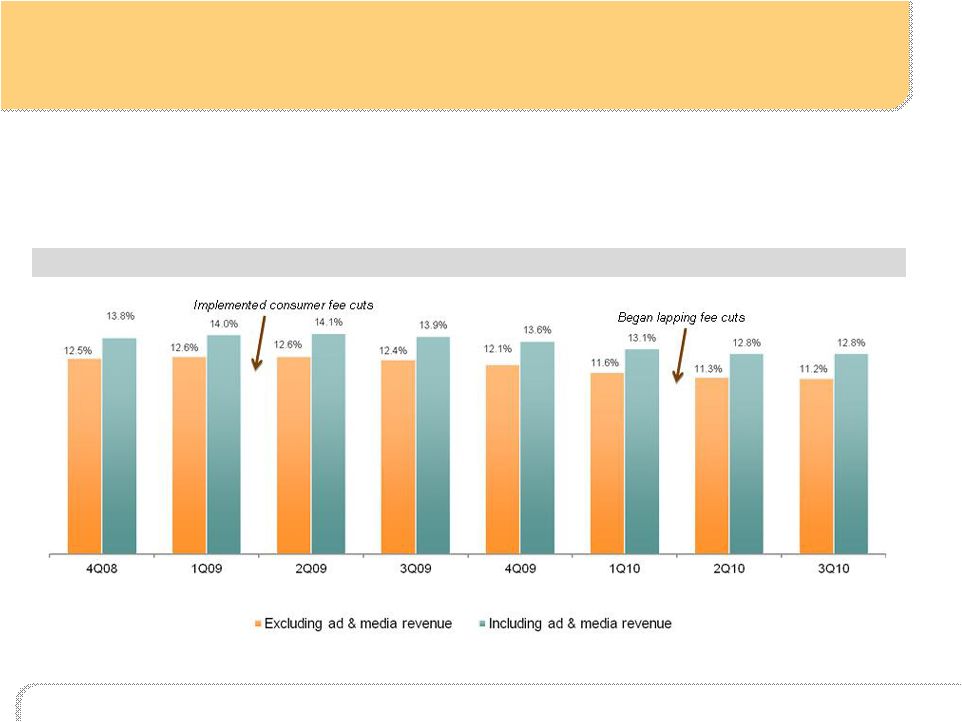 EXPEDIA, INC.
Stable supplier economics
Trended Revenue Margin (TTM) |
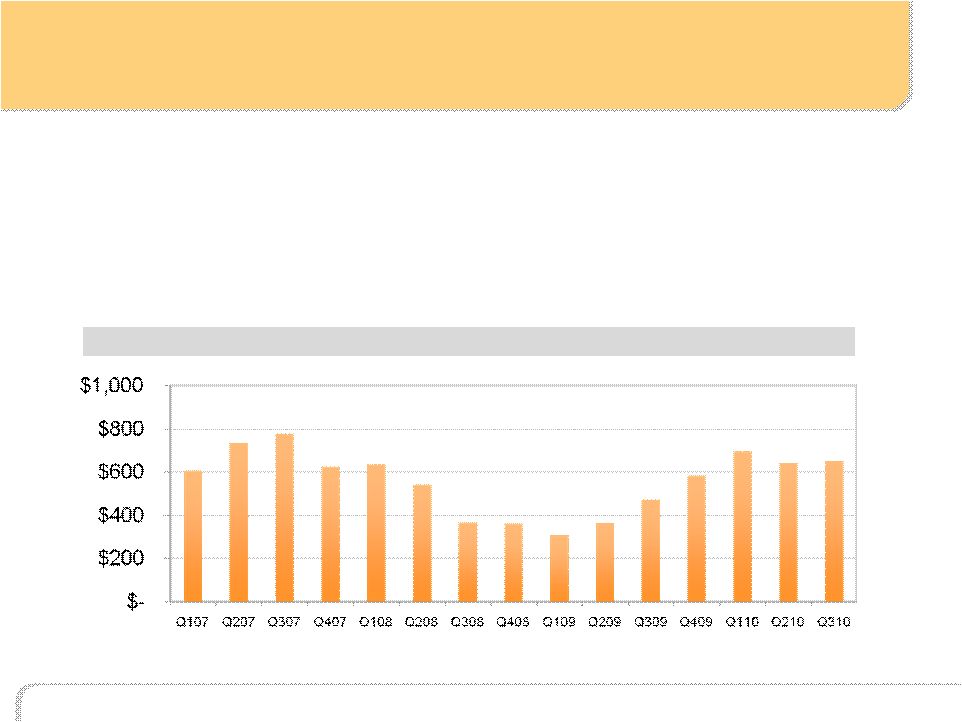 EXPEDIA, INC.
Since 2006 generated $2.9B in free cash flow and
returned $2.1B to shareholders through share
repurchases and dividends
Generating cash, returning it to shareholders
Trended Free Cash Flow (TTM) |
 |
 EXPEDIA, INC.
Appendix A -
Non-GAAP Items
Operating Income Before Amortization (“OIBA”) is defined as operating income plus: (1)
stock-based compensation expense, including compensation expense related to certain
subsidiary equity plans; (2) acquisition-related impacts, including (i) amortization of intangible assets and
goodwill and intangible asset impairment, and (ii) gains (losses) recognized on changes in the value
of contingent consideration arrangements; (3) certain infrequently occurring items, including
restructuring; (4) charges incurred, if any, for monies that may be required to be paid in advance of
litigation in certain occupancy tax proceedings; and (5) gains (losses) realized on revenue hedging
activities that are included in other, net. OIBA margin is OIBA divided by net revenue.
Adjusted Net Income generally captures all items on the statements of operations that occur in normal
course operations and have been, or ultimately will be, settled in cash and is defined as net
income/(loss) attributable to Expedia, Inc. plus net of tax: (1) stock-based compensation
expense, including compensation expense related to certain subsidiary equity plans; (2)
acquisition-related impacts, including (i) amortization of intangible assets, including as
part of equity-method investments, and goodwill and intangible asset impairment, (ii) gains (losses) recognized on
changes in the value of contingent consideration arrangements, and (iii) gains (losses) recognized on
noncontrolling investment basis adjustments when we acquire controlling interests; (3) mark to
market gains and losses on derivative instruments assumed at Spin-off; (4) currency gains or
losses on U.S. dollar denominated cash or investments held by eLong; (5) certain other infrequently
occurring items, including restructuring charges; (6) charges incurred, if any, for monies that
may be required to be paid in advance of litigation in certain occupancy tax proceedings; (7)
discontinued operations; and (8) the noncontrolling interest impact of the aforementioned adjustment
items. We believe Adjusted Net Income is useful to investors because it represents Expedia,
Inc.’s combined results, taking into account depreciation, which management believes is an
ongoing cost of doing business, but excluding the impact of other non-cash expenses, infrequently
occurring items and items not directly tied to the core operations of our businesses.
|
 EXPEDIA, INC.
Appendix A -
Non-GAAP Items
(figures in $000s)
3 Months
Ended
3 Months
Ended
3 Months
Ended
31-Mar-10
30-Jun-10
30-Sep-10
OIBA
$142,544
$219,472
$293,650
Amortization of intangible assets
(9,028)
(8,344)
(8,126)
Stock-based compensation
(18,892)
(14,651)
(13,021)
Restructuring charges
-
-
-
Occupancy tax assessments and legal reserves
-
-
Realized loss (gain) on revenue hedges
(2,450)
(2,787)
4,301
Operating income
112,174
193,690
276,804
Interest expense, net
(20,608)
(18,988)
(24,539)
Other, net
568
817
(13,657)
Provision for income taxes
(31,535)
(60,166)
(60,584)
Net income attributable to noncontrolling interests
(1,204)
(1,091)
(1,474)
Net income attributable to Expedia, Inc.
$59,395
$114,262
$176,550
Source: Company reports
OIBA (Operating Income Before Amortization) |
 EXPEDIA, INC.
Appendix A -
Non-GAAP Items
Source: Company reports
(figures in $000s)
3 Months
Ended
3 Months
Ended
3 Months
Ended
31-Mar-10
30-Jun-10
30-Sep-10
Net income attributable to Expedia, Inc.
$ 59,395
$ 114,261
$ 176,550
Amortization of intangible assets
9,028
8,344
8,126
Stock-based compensation
18,892
14,651
13,021
Restructuring charges
-
-
-
Foreign currency gain on U.S. dollar
cash balances held by eLong
(125)
873
1,358
Amortization of intangible assets as part
of equity method investments
-
-
-
Noncontrolling interests
(436)
(783)
(954)
Provision for income taxes
(9,023)
(8,061)
(6,838)
Adjusted net income
$ 77,731
$ 129,285
$ 191,263
Adjusted Net Income |
 EXPEDIA, INC.
Appendix A -
Non-GAAP Items
Free Cash Flow
(figures in $000s)
31-Dec-06
31-Dec-07
31-Dec-08
31-Dec-09
30-Sep-10
Total
Net cash provided by operating activities
$617,440
$712,069
$520,688
$676,004
$937,717
$3,463,918
Less: capital expenditures
(92,631)
(86,658)
(159,827)
(92,017)
(113,324)
(544,457)
Free cash flow
$524,809
$625,411
$360,861
$583,987
$824,393
$2,919,461
Source: Company reports |