Attached files
| file | filename |
|---|---|
| 8-K - FORM 8-K - OLD NATIONAL BANCORP /IN/ | c09223e8vk.htm |
EXHIBIT 99.1
| Investment Thesis Financial Data as of 9-30-2010 NYSE: ONB Old National Bancorp |

| Additional Information for Shareholders In connection with the proposed merger, Old National Bancorp has filed with the Securities and Exchange Commission a Registration Statement on Form S-4 that will include a Proxy Statement of Monroe Bancorp and a Prospectus of Old National, as well as other relevant documents concerning the proposed transaction. Old National and Monroe have mailed the definitive Proxy Statement/Prospectus to shareholders of Monroe (which mailings were first made on or about November 15, 2010). Shareholders are urged to read the Registration Statement and the Proxy Statement/Prospectus regarding the merger and any other relevant documents filed with the SEC, as well as any amendments or supplements to those documents, because they will contain important information. A free copy of the Proxy Statement/Prospectus, as well as other filings containing information about Old National and Monroe, may be obtained at the SEC's Internet site (http://www.sec.gov). You can also obtain these documents, free of charge, from Old National at www.oldnational.com under the tab "Investor Relations" and then under the heading "Financial Information" or from Monroe by accessing Monroe's website at www.monroebank.com under the tab "Shareholder Relations" and then under the heading "Financial Reports." Old National and Monroe and certain of their directors and executive officers may be deemed to be participants in the solicitation of proxies from the shareholders of Monroe in connection with the proposed merger. Information about the directors and executive officers of Old National is set forth in the proxy statement for Old National's 2010 annual meeting of shareholders, as filed with the SEC on a Schedule 14A on March 19, 2010. Information about the directors and executive officers of Monroe is set forth in the proxy statement for Monroe's 2010 annual meeting of shareholders, as filed with the SEC on a Schedule 14A on March 29, 2010. Additional information regarding the interests of those participants and other persons who may be deemed participants in the transaction may be obtained by reading the Proxy Statement/Prospectus regarding the proposed merger. Free copies of this document may be obtained as described in the preceding paragraph. |

| Forward-Looking Statement This presentation contains certain forward-looking statements within the meaning of the Private Securities Litigation Reform Act of 1995. These statements include, but are not limited to, descriptions of Old National's financial condition, results of operations, asset and credit quality trends and profitability and statements about the expected timing, completion, financial benefits and other effects of the proposed merger. Forward-looking statements can be identified by the use of the words "anticipate," "believe," "expect," "intend," "could" and "should," and other words of similar meaning. These forward-looking statements express management's current expectations or forecasts of future events and, by their nature, are subject to risks and uncertainties and there are a number of factors that could cause actual results to differ materially from those in such statements. Factors that might cause such a difference include, but are not limited to; market, economic, operational, liquidity, credit and interest rate risks associated with Old National's business, competition, government legislation and policies (including the impact of the Dodd-Frank Wall Street Reform and Consumer Protection Act and its related regulations), ability of Old National to execute its business plan (including the proposed acquisition of Monroe Bancorp), changes in the economy which could materially impact credit quality trends and the ability to generate loans and gather deposits, failure or circumvention of Old National's internal controls, failure or disruption of our information systems, significant changes in accounting, tax or regulatory practices or requirements, new legal obligations or liabilities or unfavorable resolutions of litigations, other matters discussed in this presentation and other factors identified in the Company's Annual Report on Form 10-K and other periodic filings with the Securities and Exchange Commission. These forward-looking statements are made only as of the date of this presentation, and Old National undertakes no obligation to release revisions to these forward-looking statements to reflect events or conditions after the date of this presentation. |

| Non-GAAP Financial Measures These slides contain non-GAAP financial measures. For purposes of Regulation G, a non-GAAP financial measure is a numerical measure of the registrant's historical or future financial performance, financial position or cash flows that excludes amounts, or is subject to adjustments that have the effect of excluding amounts, that are included in the most directly comparable measure calculated and presented in accordance with GAAP in the statement of income, balance sheet or statement of cash flows (or equivalent statements) of the issuer; or includes amounts, or is subject to adjustments that have the effect of including amounts, that are excluded from the most directly comparable measure so calculated and presented. In this regard, GAAP refers to generally accepted accounting principles in the United States. Pursuant to the requirements of Regulation G, Old National Bancorp has provided reconciliations within the slides, as necessary, of the non-GAAP financial measure to the most directly comparable GAAP financial measure. |

| The Old National Distinction Through execution of a sound strategy, ONB is well positioned for the future Improve the risk profile Consistent application of conservative underwriting standards has lead to strong loan quality relative to peers 3Q10 NPL's/Loans of 1.89% vs. 3Q10 peer average of 2.99% 3Q10 Loans 90+ days of .04% vs. 3Q10 peer average of .57% Enhance management discipline Strongly capitalized, liquid balance sheet with the flexibility to take advantage of opportunities in the market place September 2009 equity offering significantly boosts capital levels at 3Q10 Tangible common equity to 9.58% Tier 1 to 15.4% and total risk-based capital to 17.3% Loan to deposit ratio at 3Q10 of 68.1% vs. 3Q10 peer average of 81.3% Achieve consistent, quality earnings Management and board focus Long-term return vs. short-term gain Transparency in communications CONSISTENCY |

| Corporate Summary MARKET STATISTICS AND SUMMARY OVERVIEW ($ in millions) MARKET STATISTICS AND SUMMARY OVERVIEW ($ in millions) MARKET STATISTICS AND SUMMARY OVERVIEW ($ in millions) MARKET STATISTICS AND SUMMARY OVERVIEW ($ in millions) MARKET STATISTICS AND SUMMARY OVERVIEW ($ in millions) MARKET STATISTICS AND SUMMARY OVERVIEW ($ in millions) MARKET STATISTICS AND SUMMARY OVERVIEW ($ in millions) Headquarters Headquarters Headquarters Evansville, Indiana Evansville, Indiana Evansville, Indiana Stock Exchange/Symbol Stock Exchange/Symbol Stock Exchange/Symbol NYSE: ONB NYSE: ONB Market Capitalization@ 9-30-10 Market Capitalization@ 9-30-10 Market Capitalization@ 9-30-10 $.9 billion $.9 billion Quarterly Cash Dividend Quarterly Cash Dividend Quarterly Cash Dividend $.07 $.07 Cash Dividend Yield @ 11-29-10 Cash Dividend Yield @ 11-29-10 Cash Dividend Yield @ 11-29-10 2.7% 2.7% Book Value Per Common Share Book Value Per Common Share Book Value Per Common Share $10.27 $10.27 Price (at 11-29-10) / 2010 Consensus Estimate Price (at 11-29-10) / 2010 Consensus Estimate Price (at 11-29-10) / 2010 Consensus Estimate 21.38x 21.38x Institutional Ownership @ 9/30/2010 Institutional Ownership @ 9/30/2010 Institutional Ownership @ 9/30/2010 62.0% 62.0% YTD 11-29-2010 Average Trading Volume YTD 11-29-2010 Average Trading Volume YTD 11-29-2010 Average Trading Volume 606,020 shares 606,020 shares FINANCIAL DATA (at/for the quarter ended 9/30/10) ($ in millions) FINANCIAL DATA (at/for the quarter ended 9/30/10) ($ in millions) FINANCIAL DATA (at/for the quarter ended 9/30/10) ($ in millions) FINANCIAL DATA (at/for the quarter ended 9/30/10) ($ in millions) FINANCIAL DATA (at/for the quarter ended 9/30/10) ($ in millions) FINANCIAL DATA (at/for the quarter ended 9/30/10) ($ in millions) FINANCIAL DATA (at/for the quarter ended 9/30/10) ($ in millions) FINANCIAL DATA (at/for the quarter ended 9/30/10) ($ in millions) Total Assets $7,506.1 $7,506.1 $7,506.1 Total Core Deposits (Excluding Brokered CDs) $5,419.2 $5,419.2 $5,419.2 Return on Average Assets .64% .64% .64% Return on Average Common Equity 5.40% 5.40% 5.40% Net Interest Margin 3.42% 3.42% 3.42% Efficiency Ratio 76.64% 76.64% 76.64% Tangible Common Equity Ratio* 9.58% 9.58% 9.58% Assets Under Management $3,405.4 $3,405.4 $3,405.4 COMPANY DESCRIPTION >Old National Bancorp (NYSE: ONB), which celebrated its 175th anniversary in 2009, is the largest financial services bank holding company headquartered in the state of Indiana, with corporate offices in Evansville, IN -164 financial centers and 217 ATM's located throughout Indiana, Western Kentucky and Southern Illinois -ONB also owns one of the largest independent insurance agencies headquartered in the state of Indiana and the 10th largest bank-owned insurance agency in the country >Focused on true community banking, ONB provides a full range of traditional financial services to both retail and small business clients, including cash management, wealth management, leasing, investment services, capital markets and insurance >Since late 2004, ONB has been guided by three strategic imperatives -Strengthen the Risk Profile >Early identification and aggressive resolution of deteriorating credits >Proactive risk management -Enhance Management Discipline >Disciplined pricing of loans and deposits using market share presence >Optimize balance sheet >Hold managers accountable for their results -Achieve Consistent Quality Earnings >Targeting 6% to 8% annual earnings per share growth *See appendix for Non-GAAP reconciliation Investor Inquiries: Lynell J. Walton, CPA SVP - Director of Investor Relations 812-464-1366 lynell.walton@oldnational.com TOP 15 Institutional Holders (9/30/2010 13F Filings) Shares Held (in 000s) % Ownership BlackRock Fund Advisors 6,020.9 6.91 The Vanguard Group 4,174.0 4.79 Capital World Investors 4,077.0 4.68 State Street Global Advisors 3,029.8 3.48 Guggenheim Partners Asset Management 2,121.5 2.43 Heartland Advisors 1,974.4 2.26 Dimensional Fund Advisors 1,970.5 2.26 Northern Trust Invesment 1,965.0 2.25 Forest Hill Capital 1,538.7 1.77 Wells Capital Management 1,177.2 1.35 Russell Investment Group 1,154.7 1.32 DePrince Race & Zollo 1,108.8 1.27 ClearBridge Advisors 1,069.2 1.23 Schroeder Investment Management 1,053.1 1.21 APG - All Pensions Group 1,038.8 1.19 |

| The Old National Footprint The Old National Footprint ONB Headquarters |

| Local Unemployment Local Unemployment 50.9% / 7.8% 2.2% / 9.7% 3.2% / 10.9% 0% / 10.1% 43.6% / 8.8% .1% / 9.3% % of ONB's Indiana deposits* / Regional unemployment Unemployment data provided by Indiana Department of Workforce Development and Bureau of Labor Statistics October 2010 Unemployment: Indiana = 9.9% Illinois = 9.8% Kentucky = 10.0% Ohio = 9.9% Michigan = 12.8% USA = 9.6% *Deposits based on 6-30-10 FDIC data 75% of ONB deposits* are in Indiana--over half are in region with lowest unemployment |

| Asset/Liability Composition Investments Commercial Loans Commercial Real Estate Loans Consumer Loans* Residential Real Estate Other Asset 0.3749 0.18253 0.13689 0.14116 0.05432 0.1102 NOW & Savings Demand Deposits Money Markets Other Time Borrowings Brokered CDs Other Liability 0.334 0.192 0.052 0.242 0.143 0.003 0.034 Investments Commercial Loans Commercial Real Estate Loans Consumer Loans* Residential Real Estate Other Asset 0.403 0.169 0.131 0.129 0.065 0.103 *Consumer Loans consist of 29% direct, 46% indirect and 25% HELOC. Period-End 9-30-09 *Consumer Loans consist of 28% direct, 45% indirect and 27% HELOC. Period-End 9-30-10 NOW & Savings Demand Deposits Money Markets Other Time Borrowings Brokered CDs Other Liability 0.30834 0.14714 0.05892 0.27685 0.15963 0.00983 0.03928 |

| Loan Concentrations At September 30, 2010 Commercial Commercial Real Estate |
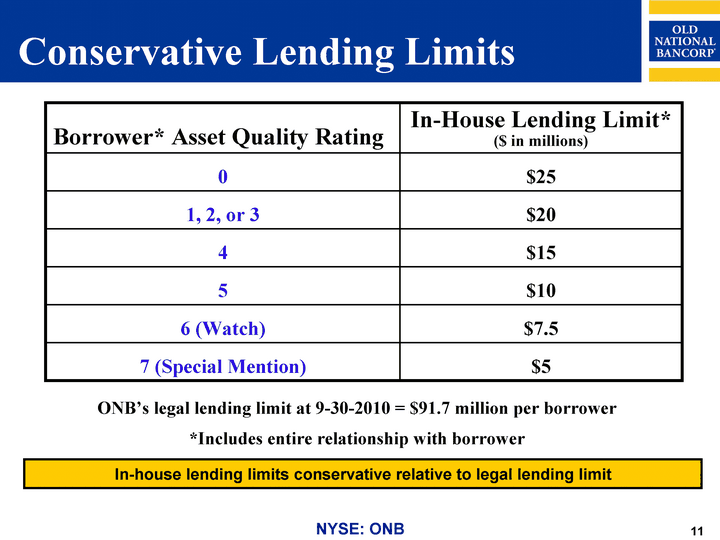
| Conservative Lending Limits Borrower* Asset Quality Rating In-House Lending Limit* ($ in millions) 0 $25 1, 2, or 3 $20 4 $15 5 $10 6 (Watch) $7.5 7 (Special Mention) $5 In-house lending limits conservative relative to legal lending limit ONB's legal lending limit at 9-30-2010 = $91.7 million per borrower *Includes entire relationship with borrower |

| Proactive Risk Management No subprime business line Conservative stance on commercial real estate Starting mid-year 2006 Reduction in higher-risk residential loans Sold $405.6 million in 2004 Sale of credit card portfolio June 2000 Minimal construction and land loan exposure 3Q10 at 3.10% vs. 3Q10 peer average of 8.71% Not participating in new shared national credits Well-staffed experienced special assets area |
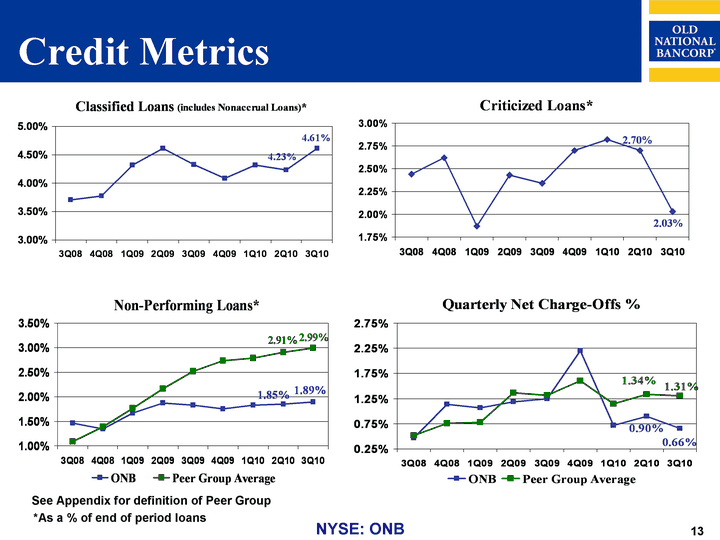
| Credit Metrics 3Q08 4Q08 1Q09 2Q09 3Q09 4Q09 1Q10 2Q10 3Q10 Problem Loans 0.0371 0.0378 0.0432 0.0461 0.0433 0.0409 0.0432 0.0423 0.0461 3Q08 4Q08 1Q09 2Q09 3Q09 4Q09 1Q10 2Q10 3Q10 Criticized Loans 0.0244 0.0262 0.0187 0.0243 0.0234 0.027 0.0282 0.027 0.0203 3Q08 4Q08 1Q09 2Q09 3Q09 4Q09 1Q10 2Q10 3Q10 ONB 0.0146 0.0135 0.0167 0.0187 0.0183 0.0175 0.0183 0.0185 0.0189 Peer Group Average 0.0109 0.0139 0.0176 0.0216 0.0252 0.0273 0.0279 0.0291 0.0299 3Q08 4Q08 1Q09 2Q09 3Q09 4Q09 1Q10 2Q10 3Q10 ONB 0.0047 0.0114 0.0107 0.0119 0.0125 0.022 0.0072 0.009 0.0066 Peer Group Average 0.0052 0.0076 0.0078 0.0137 0.0132 0.016 0.0115 0.0134 0.0131 *As a % of end of period loans See Appendix for definition of Peer Group |
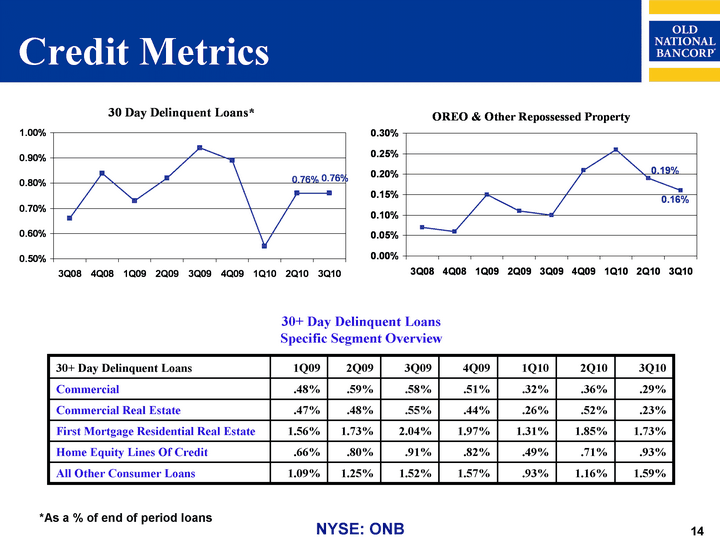
| Credit Metrics 3Q08 4Q08 1Q09 2Q09 3Q09 4Q09 1Q10 2Q10 3Q10 As a % of end of period total loans 0.0066 0.0084 0.0073 0.0082 0.0094 0.0089 0.0055 0.0076 0.0076 3Q08 4Q08 1Q09 2Q09 3Q09 4Q09 1Q10 2Q10 3Q10 As a % of end of period total loans 0.0007 0.0006 0.0015 0.0011 0.001 0.0021 0.0026 0.0019 0.0016 30+ Day Delinquent Loans Specific Segment Overview 30+ Day Delinquent Loans 1Q09 2Q09 3Q09 4Q09 1Q10 2Q10 3Q10 Commercial .48% .59% .58% .51% .32% .36% .29% Commercial Real Estate .47% .48% .55% .44% .26% .52% .23% First Mortgage Residential Real Estate 1.56% 1.73% 2.04% 1.97% 1.31% 1.85% 1.73% Home Equity Lines Of Credit .66% .80% .91% .82% .49% .71% .93% All Other Consumer Loans 1.09% 1.25% 1.52% 1.57% .93% 1.16% 1.59% *As a % of end of period loans |
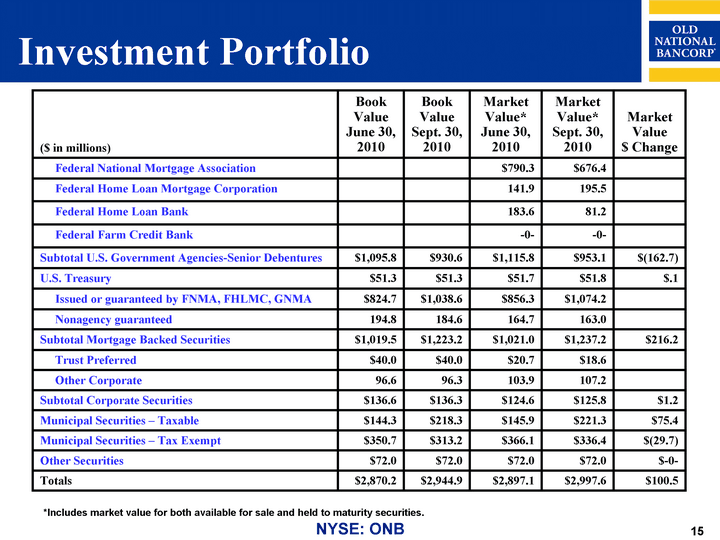
| Investment Portfolio ($ in millions) Book Value June 30, 2010 Book Value Sept. 30, 2010 Market Value* June 30, 2010 Market Value* Sept. 30, 2010 Market Value $ Change Federal National Mortgage Association $790.3 $676.4 Federal Home Loan Mortgage Corporation 141.9 195.5 Federal Home Loan Bank 183.6 81.2 Federal Farm Credit Bank -0- -0- Subtotal U.S. Government Agencies-Senior Debentures $1,095.8 $930.6 $1,115.8 $953.1 $(162.7) U.S. Treasury $51.3 $51.3 $51.7 $51.8 $.1 Issued or guaranteed by FNMA, FHLMC, GNMA $824.7 $1,038.6 $856.3 $1,074.2 Nonagency guaranteed 194.8 184.6 164.7 163.0 Subtotal Mortgage Backed Securities $1,019.5 $1,223.2 $1,021.0 $1,237.2 $216.2 Trust Preferred $40.0 $40.0 $20.7 $18.6 Other Corporate 96.6 96.3 103.9 107.2 Subtotal Corporate Securities $136.6 $136.3 $124.6 $125.8 $1.2 Municipal Securities - Taxable $144.3 $218.3 $145.9 $221.3 $75.4 Municipal Securities - Tax Exempt $350.7 $313.2 $366.1 $336.4 $(29.7) Other Securities $72.0 $72.0 $72.0 $72.0 $-0- Totals $2,870.2 $2,944.9 $2,897.1 $2,997.6 $100.5 *Includes market value for both available for sale and held to maturity securities. |
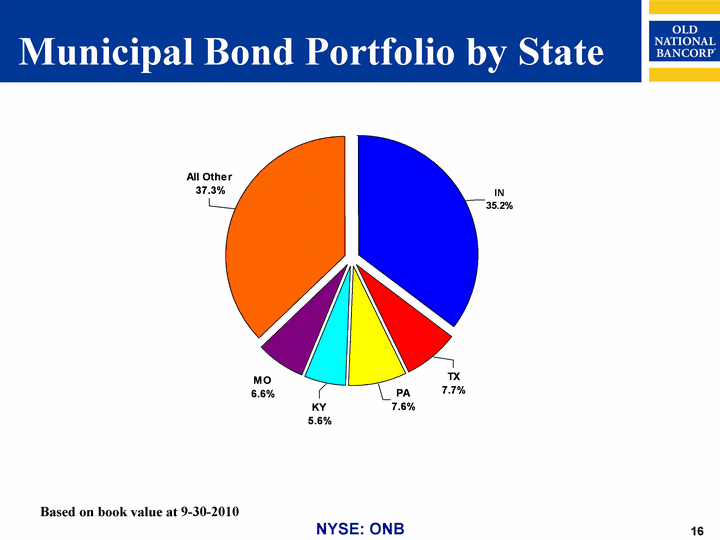
| Municipal Bond Portfolio by State IN TX PA KY MO All Other 0.352 0.077 0.076 0.056 0.066 0.373 Based on book value at 9-30-2010 |

| Monthly Net Interest Margin* 10/1/2009 11/1/2009 12/1/2009 1/1/2010 2/1/2010 3/1/2010 4/1/2010 5/1/2010 6/1/2010 7/1/2010 8/1/2010 9/1/2010 ONB 0.0328 0.0323 0.0333 0.0339 0.0327 0.0333 0.0341 0.0343 0.0336 0.0344 0.0342 0.0341 *Fully taxable-equivalent basis 1Q10 = 3.33% 2Q10 = 3.40% 3Q10 = 3.42% |

| Focus on Capital Management Common stock offering completed September, 2009 Issued 20.7 million shares, including over-allotment Net proceeds of $196 million Significantly improved capital ratios - at 9-30-2010 Tangible common equity to 9.58% Tier 1 to 15.4% Total risk-based capital to 17.3% Allows ONB to prudently take advantage of opportunities as a result of market disruption and the difficult economic climate |

| 3Q08 4Q08 1Q09 2Q09 3Q09 4Q09 1Q10 2Q10 3Q10 ONB 0.0606 0.0581 0.0523 0.0551 0.0853 0.0825 0.0862 0.0903 0.0958 Peer Group Average 0.0679 0.0668 0.0672 0.0694 0.0715 0.0715 0.0782 0.079 0.0799 The Company's calculation of tangible common equity includes other comprehensive income. See Appendix for Non-GAAP reconciliation and definition of Peer Group Tangible Common Equity |
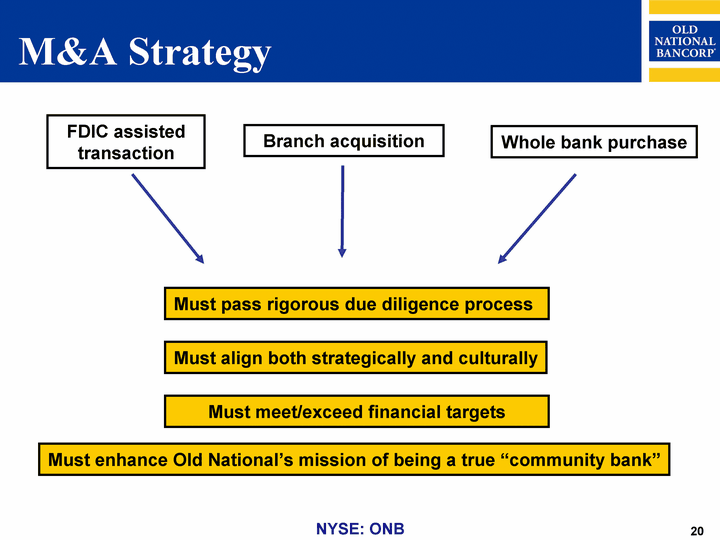
| M&A Strategy Branch acquisition FDIC assisted transaction Whole bank purchase Must enhance Old National's mission of being a true "community bank" Must align both strategically and culturally Must meet/exceed financial targets Must pass rigorous due diligence process |

| M&A Strategy Focus on community banking, client relationships and consistent quality earnings Target geographic markets Mid-sized markets within or near existing franchise with average to above average growth rates In market community banks where significant cost saves could be achieved |

| ONB to Acquire Monroe Bancorp Deal announced October 6, 2010 Targeted to close 1-1-2011 $845 million total assets* $790 million total liabilities* $336 million in trust assets* 15 branch locations *At June 30, 2010 Data per SNL Financial and Company Reports |

| APPENDIX |

| Non-GAAP Reconciliations 3Q08 4Q08 1Q09 2Q09 3Q09 4Q09 1Q10 2Q10 3Q10 Total Shareholders' Equity $635.4 $730.9 $631.8 $634.6 $865.4 $843.8 $855.5 $874.7 $895.7 Deduct: Goodwill and Intangible Assets (187.8) (186.8) (205.6) (204.0) (202.4) (200.2) (198.6) (197.1) (195.6) Tangible Shareholders' Equity 447.6 544.1 426.2 430.6 663.0 643.6 657.0 677.7 700.1 Deduct: Preferred Stock - 97.4 - - - - - - - Tangible Common Shareholders' Equity $447.6 $446.7 $426.2 $430.6 $663.0 $643.6 $657.0 $677.7 $700.1 Total Assets $7,568.3 $7,873.9 $8,356.1 $8,012.2 $7,973.5 $8,005.3 $7,818.3 $7,701.1 $7,506.1 Add: Trust Overdrafts .3 1.0 .1 - .4 .2 .3 .1 .1 Deduct: Goodwill and Intangible Assets (187.8) (186.8) (205.6) (204.0) (202.4) (200.2) (198.6) (197.1) (195.6) Tangible Assets $7,380.9 $7,688.1 $8,150.6 $7,808.2 $7,771.6 $7,805.4 $7,620.0 $7,504.1 $7,310.6 Tangible Common Equity to Tangible Assets 6.06% 5.81% 5.23% 5.51% 8.53% 8.25% 8.62% 9.03% 9.58% End of period balances - $ in millions |

| The Old National Peer Group Name Ticker Name Ticker 1st Source Corporation SRCE Heartland Financial USA, Inc. HTLF BancFirst Corporation BANF IBERIABANK Corporation IBKC BancorpSouth, Inc. BXS MB Financial, Inc. MBFI Bank of Hawaii Corporation BOH Park National Corporation PRK Chemical Financial Corporation CHFC Pinnacle Financial Partners, Inc. PNFP Commerce Bancshares, Inc. CBSH Prosperity Bancshares, Inc. PRSP Cullen/Frost Bankers, Inc. CFR S&T Bancorp, Inc. STBA F.N.B. Corporation FNB Sterling Bancshares, Inc. SBIB First Commonwealth Financial Corporation FCF Susquehanna Bancshares, Inc. SUSQ First Financial Bancorp. FFBC Trustmark Corporation TRMK First Interstate BancSystem, Inc. FIBK UMB Financial Corporation UMBF First Merchants Corporation FRME United Bankshares, Inc. UBSI First Midwest Bancorp, Inc. FMBI Valley National Bancorp VLY FirstMerit Corporation FMER WesBanco, Inc. WSBC Glacier Bancorp, Inc. GBCI Whitney Holding Corporation WTNY Hancock Holding Company HBHC Wintrust Financial Corporation WTFC Like-size, publicly-traded financial services companies, generally in the Midwest, serving comparable demographics with comparable services as ONB *Peer group changed 3Q10 |

| Minimal Shared National Credits *All but one in ONB footprint of Indiana, Kentucky or Illinois **ONB risk grade scale is 0 (investment grade) to 9 (nonaccrual) ($ in millions) 1Q10 2Q10 3Q10 Count (#)* 12 12 10 Total exposure $134.6 $133.2 $118.2 Dollar outstanding $54.4 $50.8 $38.7 Largest exposure ($0 outstanding) $20.0 $20.0 $20.0 Weighted average risk grade** 1.7 1.7 1.7 |

| ($ in millions) Book Value June 30, 2010 Market Value June 30, 2010 Book Value Sept. 30, 2010 Market Value Sept. 30, 2010 Corporate Bonds $3.3 $2.5 $3.4 $2.5 Pooled Trust Preferred Securities $28.2 $10.5 $28.1 $8.4 Non-Agency Mortgage Backed Securities $120.8 $96.0 $116.5 $97.8 Totals $152.3 $109.0 $148.0 $108.7 Other Classified Assets |

| Securities with OTTI $ in Thousands *Lowest credit rating provided by any nationally recognized credit rating agency. Vintage Lowest Credit Rating* Book Value at Sept. 30, 2010 OTTI 3Q10 OTTI YTD 2010 OTTI Life to Date BAFC Ser 4 2007 CCC $14,026 $- $79 $142 CWALT Ser 73CB 2005 CCC 6,606 - 207 290 CWALT Ser 73CB 2005 CCC 6,923 - 427 609 CWHL 2006-10 2006 C 10,030 - 309 1,071 CWHL 2005-20 2005 B- 9,734 - 39 111 FHASI Ser 4 2007 CCC 21,617 37 629 852 RFMSI Ser S9 2006 CC 32,070 - 923 2,803 RFMSI Ser S10 2006 CC 4,360 2 76 325 RALI QS2 2006 C 6,565 - 278 1,017 RFMSI S1 2006 CCC 5,127 - 30 206 Totals Non-Agency Mortgage Backed Securities $117,058 $39 $2,997 $7,426 TROPC 2003 C 1,283 $- $146 $3,663 MM Community Funding IX 2003 C 2,107 - 165 2,777 Reg Div Funding 2004 D 4,563 - - 5,199 PRETSL XII 2003 C 2,886 - - 1,897 PRETSL XV 2004 C 1,695 - - 3,374 Reg Div Funding 2005 C 311 - - 3,767 Totals Pooled Trust Preferred Securities $12,845 $- $311 $20,677 Grand Totals $129,903 $39 $3,308 $28,103 |

| Deposit Costs vs. Peer Group Peer Group data per SNL Financial See Appendix for definition of Peer Group 3Q08 4Q08 1Q09 2Q09 3Q09 4Q09 1Q10 2Q10 3Q10 ONB (Including Brokered CDs) 0.0204 0.0183 0.0158 0.0148 0.014 0.0132 0.0123 0.0113 0.0106 Peer Group Average 0.0219 0.0204 0.0174 0.0157 0.0144 0.0129 0.0115 0.0107 0.01 |

| Loan Yields Vs. Peer Group 3Q08 4Q08 1Q09 2Q09 3Q09 4Q09 1Q10 2Q10 3Q10 ONB 0.0611 0.0597 0.0521 0.0514 0.0514 0.0508 0.0507 0.0508 0.0502 Peer Group Average 0.0616 0.0596 0.0548 0.0542 0.0545 0.0546 0.0547 0.0548 0.0544 Peer Group data per SNL Financial See Appendix for definition of Peer Group Diversified portfolio with strong credit quality and pricing opportunities relative to peers |

| Investor Contact Additional information can be found on the Investor Relations web pages at www.oldnational.com Investor Inquiries: Lynell J. Walton, CPA SVP - Director of Investor Relations 812-464-1366 lynell.walton@oldnational.com |
