Attached files
| file | filename |
|---|---|
| 8-K - FORM 8-K - TPC Group Inc. | d8k.htm |
 Annual Meeting of Shareholders
December 2, 2010
Exhibit 99.1 |
 »
Certain statements in this presentation may contain “forward-looking
statements” within the meaning of
Section
27A of the Securities Act of 1933, as amended, and Section
21E of the Securities Exchange Act of 1934,
as amended. These statements include assumptions, expectations, predictions,
intentions or beliefs about future events, particularly statements that may
relate to market outlook and trends in our industry, availability of raw
materials and inventories, future operating results, potential returns of capital to
stockholders, plans related to strategic initiatives or future expansion
activities, growth opportunities and capital expenditures. Although TPC Group
Inc. (the “Company” or “TPC Group”) believes that such
statements are based on reasonable assumptions, no assurance can be given that
such statements will prove to have been correct. A number of
factors could cause actual results to vary materially from those
expressed or implied in any forward-looking
statements, including risks and uncertainties such as volatility
in the petrochemicals industry, limitations on the
Company’s access to capital, the effects of competition, leverage and debt
service, general economic conditions, litigation and governmental
investigations, and extensive environmental, health and safety laws and regulations.
More information about the risks and uncertainties relating to TPC Group and the
forward-looking statements are found in the Company’s SEC filings,
including the Annual Report on Form 10-K, as amended, which are available
free of charge on the SEC’s website at http://www.sec.gov . TPC Group expressly
disclaims any obligation to update any forward-looking statements
contained in this presentation to reflect events or circumstances that may
arise after the date of this presentation, except as otherwise required by applicable law.
»
This presentation may also contain non-GAAP financial measures. Provided
herein is a reconciliation, for each period presented, of such non-GAAP
financial information to the most directly comparable GAAP measures. 2
Forward-Looking Statements &
Non-GAAP Financial Measures |
 Our
Past Year “Strengthening Our Business”
»
Continued Investment in Operating Excellence Initiatives
•
Record setting Environmental / Health / Safety Performance
•
No Process Safety Incidents
•
Accelerated investment in High Return / Low Risk Capital Projects
•
Excellent Operating Performance through 2010 year to date
•
Capital Spending at $22 MM (CY’10)
»
Continued Growth of Performance Products
•
Gross profit from $61.5 MM in FY’09 to $73.5 MM FY’10 and sustained (19.5%
increase)
•
Polyisobutylene Volumes grew by 50% (to 182 MM) during FY’10, averaging over
80% of capacity during CY’10
»
Executed our Strategic Initiatives to increase Liquidity of Equity and
Strengthen Capital Structure
•
Public company listing in January
•
Initiated trading on NASDAQ in April (TPCG)
•
Amend / Extend Asset Based Revolver ($175MM) in May
•
Placed $350 MM 8¼
% Sr. Secured Bonds (Replacing Term Loan) in October
•
Initiated Dutch Auction Tender for $130 MM of public shares in November
3 |
 Current
Business Environment
“Stable, Consistent Markets”
»
Butadiene markets balanced
•
Global supply remains limited with light feed cracking by ethylene producers
•
Overall global rubber demand stable and improving with economic recovery
•
Natural rubber pricing above synthetic (leading the way on price)
•
Asia capacity additions helping to balance
»
Stable gas, oil and feedstock prices allowing for predictable end
product margins
•
Butene-1, Isobutylene, Raffinates gasoline based
•
Performance Products tied to propylene and butane
»
Butene –
1 market (co-monomer in polyethylene manufacturing)
strong due to North America ethylene cost position
»
Fuel / Lube / Surfactants additives markets for HPIB, PIB, Nonene,
Tetramer are steady and growing outside of North America
4 |
 Where
We Are Headed “Investing in our Future”
»
Continue to build on Operating Excellence Efforts
•
Investment in Environmental, Health, Safety
•
New Technical Center in Houston
•
High Return / Low Risk Capital (>50% IRR)
•
Reliability and operability enhancements
»
Targeting EBITDA Growth to $150MM by end of 2012
•
Increased margins in C4 Processing Segment
•
Continued ramp up on Polyisobutylene, Nonene volumes
•
High return projects implementation
•
Capital Spending targeted at $25 -
$30 MM for 2011
•
CY 2011 EBITDA expected to be up from FY’10 and LTM (through September)
»
Strategic Initiatives
•
Continued long term margin expansion across products and services
•
Drive next steps of growth (isobutylene / polyisobutylene) for 2013 and beyond
•
Continue to seek additional CC4 supply / additional processing opportunities
•
Investor relations visibility
5 |
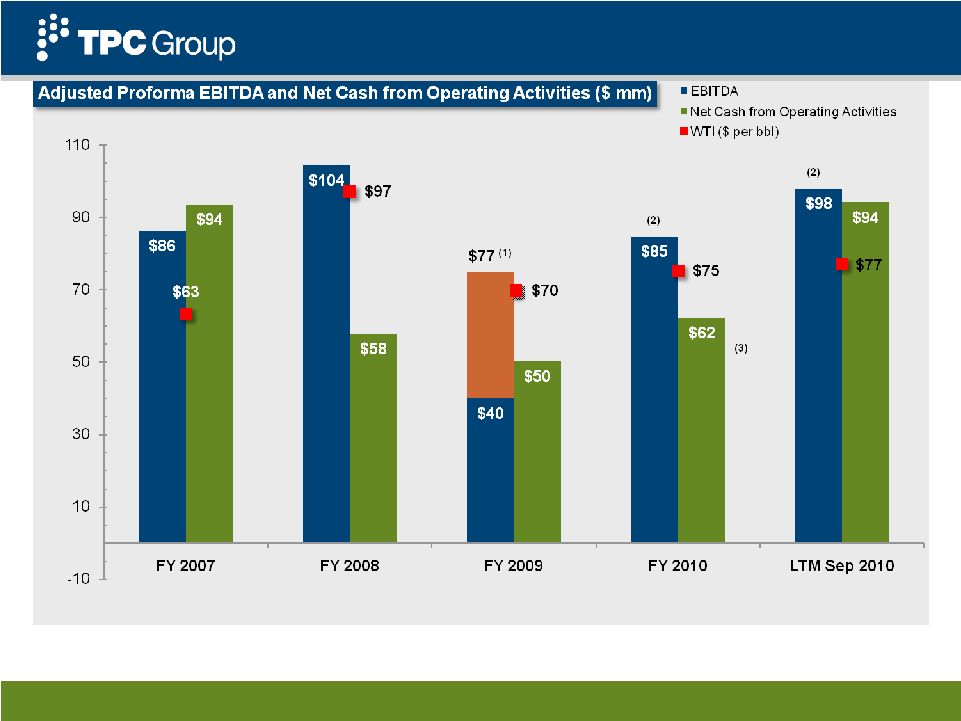 6
(1)
Includes Hurricane Ike loss
(2)
Excludes $17 million insurance recoveries from Hurricane Ike loss
(3)
Excludes $65 million for year end AR collections effort
Adjusted EBITDA and Operating Cash Flow
FY 2007 –
FY 2010 & LTM Sep 2010 |
 7
TPC Group Inc
Annual Shareholder Meeting Presentation
Reconciliation
of
Adjusted
Proforma
EBITDA
to
Net
Income
(Loss)
(in
millions)
Fiscal Year Ended June 30,
LTM Sep
2007
2008
2009
2010
2010
Adjusted Proforma
EBITDA
$ 86
$ 104
$ 77
$ 85
$ 98
Proforma Adjustments (1) (2)
-
-
(37)
17
17
Adjusted EBITDA as Reported
86
104
40
102
115
Reconciliation to Net Income (Loss)
Income taxes
(14)
(15)
12
(19)
(23)
Interest expense, net
(17)
(19)
(17)
(15)
(15)
Depreciation and amortization
(29)
(36)
(42)
(40)
(39)
Loss on sale of assets
-
(1)
-
-
-
Asset impairment
-
-
(6)
-
-
Non-cash stock-based compensation
(5)
(6)
(6)
(1)
(1)
Unrealized gain (loss) on derivatives
-
-
(4)
4
3
Net income (loss)
$ 21
$
27 $ (23)
$ 31
$ 40
(1)
FY 2009 reflects proforma adjustment for Hurricane Ike loss.
(2)
FY 2010 and LTM September 30, 2010 reflect proforma adjustment for insurance
recoveries from Hurricane Ike loss. |