Attached files
| file | filename |
|---|---|
| 8-K - 8-K - CubeSmart | a10-21989_18k.htm |
Exhibit 99.1
|
|
FBR Capital Markets Fall Investor Conference November 30, 2010 |
|
|
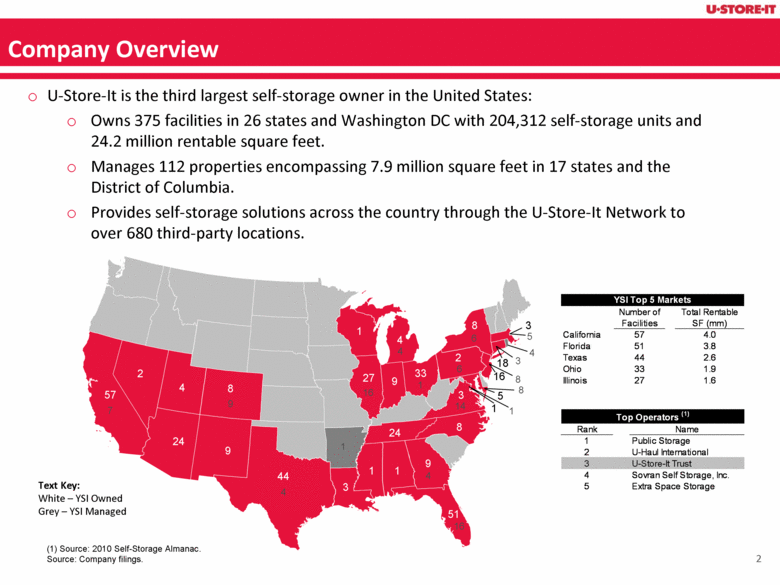
(1) Source: 2010 Self-Storage Almanac. Source: Company filings. Company Overview U-Store-It is the third largest self-storage owner in the United States: Owns 375 facilities in 26 states and Washington DC with 204,312 self-storage units and 24.2 million rentable square feet. Manages 112 properties encompassing 7.9 million square feet in 17 states and the District of Columbia. Provides self-storage solutions across the country through the U-Store-It Network to over 680 third-party locations. 16 51 9 27 4 57 33 24 44 8 1 3 8 9 5 3 2 9 2 18 24 4 3 1 1 8 1 7 9 1 3 1 16 4 16 5 8 4 8 6 1 6 4 4 14 Text Key: White – YSI Owned Grey – YSI Managed 57 YSI Top 5 Markets Number of Total Rentable Facilities SF (mm) California 57 4.0 Florida 51 3.8 Texas 44 2.6 Ohio 33 1.9 Illinois 27 1.6 Top Operators (1) Rank Name 1 Public Storage 2 U-Haul International 3 U-Store-It Trust 4 Sovran Self Storage, Inc. 5 Extra Space Storage |
|
|
Company Highlights Diversified Portfolio of High-Quality Assets YSI’s geographic and tenant diversity limits exposure to any single tenant or market. Experienced Management Team The top three executives, Dean Jernigan, Chris Marr, and Tim Martin have an average of approximately 21 years of real estate experience and have worked in the self-storage industry for an average of approximately 14 years. Favorable Trends in the Self-Storage Sector The self-storage sector has performed better than most sectors during the recent downturn and is poised to outperform other asset classes as the economy improves. Successful Execution of Management’s Deleveraging Plan YSI executed on a deleveraging plan reducing debt to total assets from 49.5% at 6/30/09 to 36.0% at 9/30/10 and decreased debt outstanding by 29% during the same period. Demonstrated Access to Capital YSI has well-established contacts with institutional, public and private sources for both equity and debt capital. During the third quarter of 2009, the Company raised over $875 million through its capital raising efforts. Stated Growth Plan Maintains a Conservative Capital Structure YSI plans to accretively acquire properties on a leverage neutral basis while pursuing an investment grade rating. |
|
|
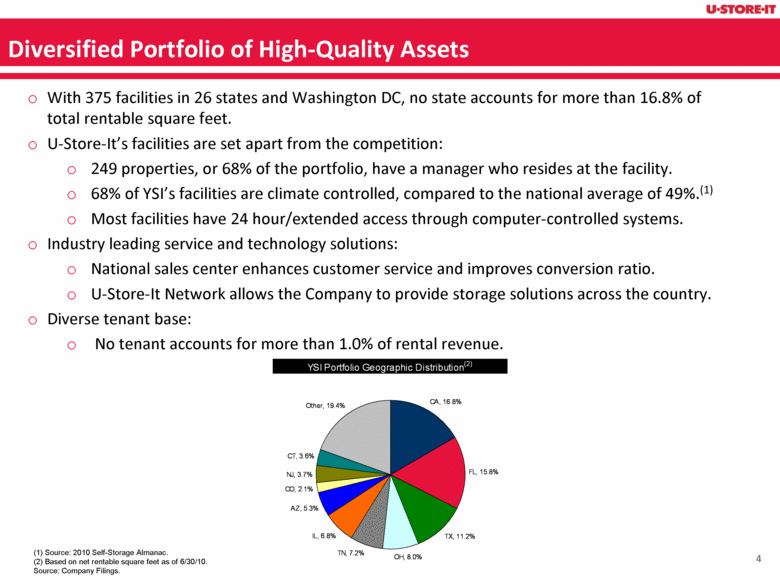
(1) Source: 2010 Self-Storage Almanac. (2) Based on net rentable square feet as of 6/30/10. Source: Company Filings. Diversified Portfolio of High-Quality Assets With 375 facilities in 26 states and Washington DC, no state accounts for more than 16.8% of total rentable square feet. U-Store-It’s facilities are set apart from the competition: 249 properties, or 68% of the portfolio, have a manager who resides at the facility. 68% of YSI’s facilities are climate controlled, compared to the national average of 49%.(1) Most facilities have 24 hour/extended access through computer-controlled systems. Industry leading service and technology solutions: National sales center enhances customer service and improves conversion ratio. U-Store-It Network allows the Company to provide storage solutions across the country. Diverse tenant base: No tenant accounts for more than 1.0% of rental revenue. YSI Portfolio Geographic Distribution (2) CA, 16.8% FL, 15.8% TX, 11.2% OH, 8.0% TN, 7.2% IL, 6.8% AZ, 5.3% CO, 2.1% NJ, 3.7% CT, 3.6% Other, 19.4% |
|
|
High-Quality Assets Since current management initiated its repositioning strategy, YSI has dramatically increased the quality of its portfolio. Capital Expenditure Plan Completed significant capital expenditure program. Painted 158 facilities. Remodeled 65 offices. Standardized branding across the portfolio with consistent signage, colors, and professional appearance. As a result of its portfolio repositioning, YSI projects that its capital expenditures will consist primarily of maintenance capital expenditures. Portfolio Repositioning Graded and ranked all properties with the intention of disposing of lower quality assets. Disposed of 25 assets during 2008 and 2009. 68% of these dispositions were in the bottom quartile of YSI’s portfolio. Identified select properties in target markets and markets for expansion. |
|
|
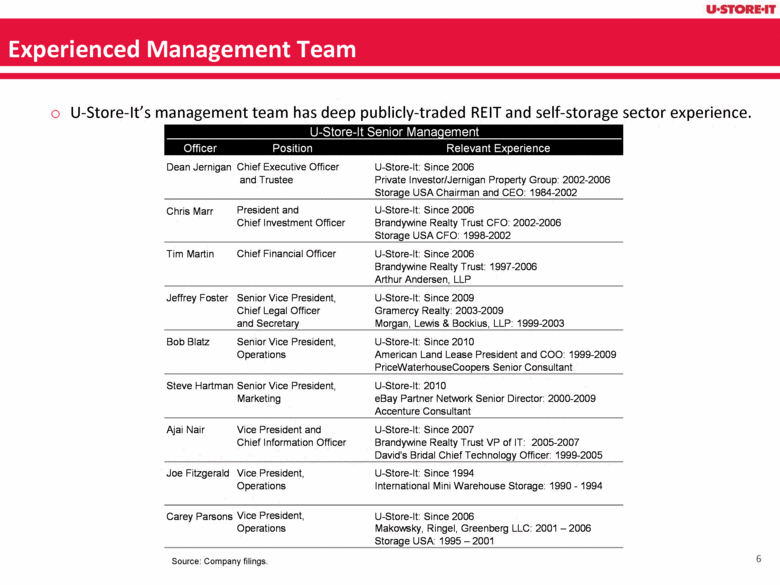
Source: Company filings. Experienced Management Team U-Store-It’s management team has deep publicly-traded REIT and self-storage sector experience. U-Store-It Senior Management Officer Position Relevant Experience Dean Jernigan Chief Executive Officer U-Store-It: Since 2006 and Trustee Private Investor/Jernigan Property Group: 2002-2006 Storage USA Chairman and CEO: 1984-2002 Chris Marr U-Store-It: Since 2006 Brandywine Realty Trust CFO: 2002-2006 Storage USA CFO: 1998-2002 Tim Martin Chief Financial Officer U-Store-It: Since 2006 Brandywine Realty Trust: 1997-2006 Arthur Andersen, LLP Jeffrey Foster U-Store-It: Since 2009 Gramercy Realty: 2003-2009 Morgan, Lewis & Bockius, LLP: 1999-2003 Bob Blatz U-Store-It: Since 2010 American Land Lease President and COO: 1999-2009 PriceWaterhouseCoopers Senior Consultant Steve Hartman U-Store-It: 2010 eBay Partner Network Senior Director: 2000-2009 Accenture Consultant Ajai Nair U-Store-It: Since 2007 Brandywine Realty Trust VP of IT: 2005-2007 David's Bridal Chief Technology Officer: 1999-2005 Joe Fitzgerald U-Store-It: Since 1994 International Mini Warehouse Storage: 1990 - 1994 Carey Parsons U-Store-It: Since 2006 Makowsky, Ringel, Greenberg LLC: 2001 – 2006 Storage USA: 1995 – 2001 President and Chief Investment Officer Vice President, Operations Senior Vice President, Operations Vice President and Chief Information Officer Senior Vice President, Chief Legal Officer and Secretary Vice President, Operations Senior Vice President, Marketing |
|
|
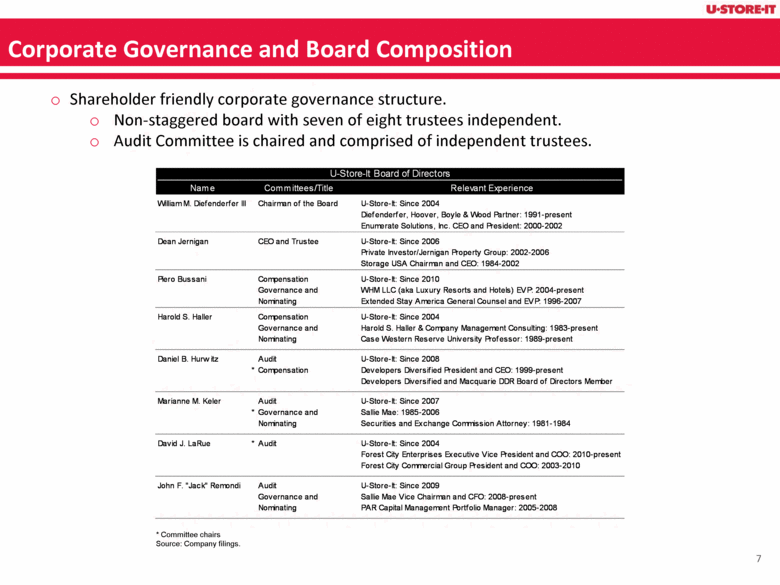
* Committee chairs Source: Company filings. Corporate Governance and Board Composition Shareholder friendly corporate governance structure. Non-staggered board with seven of eight trustees independent. Audit Committee is chaired and comprised of independent trustees. U-Store-It Board of Directors Name Committees/Title Relevant Experience William M. Diefenderfer III Chairman of the Board U-Store-It: Since 2004 Diefenderfer, Hoover, Boyle & Wood Partner: 1991-present Enumerate Solutions, Inc. CEO and President: 2000-2002 Dean Jernigan CEO and Trustee U-Store-It: Since 2006 Private Investor/Jernigan Property Group: 2002-2006 Storage USA Chairman and CEO: 1984-2002 Piero Bussani Compensation U-Store-It: Since 2010 WHM LLC (aka Luxury Resorts and Hotels) EVP: 2004-present Extended Stay America General Counsel and EVP: 1996-2007 Harold S. Haller Compensation U-Store-It: Since 2004 Harold S. Haller & Company Management Consulting: 1983-present Case Western Reserve University Professor: 1989-present Daniel B. Hurwitz Audit U-Store-It: Since 2008 * Compensation Developers Diversified President and CEO: 1999-present Developers Diversified and Macquarie DDR Board of Directors Member Marianne M. Keler Audit U-Store-It: Since 2007 * Sallie Mae: 1985-2006 Securities and Exchange Commission Attorney: 1981-1984 David J. LaRue * Audit U-Store-It: Since 2004 Forest City Enterprises Executive Vice President and COO: 2010-present Forest City Commercial Group President and COO: 2003-2010 John F. "Jack" Remondi Audit U-Store-It: Since 2009 Sallie Mae Vice Chairman and CFO: 2008-present PAR Capital Management Portfolio Manager: 2005-2008 Governance and Nominating Governance and Nominating Governance and Nominating Governance and Nominating |
|
|
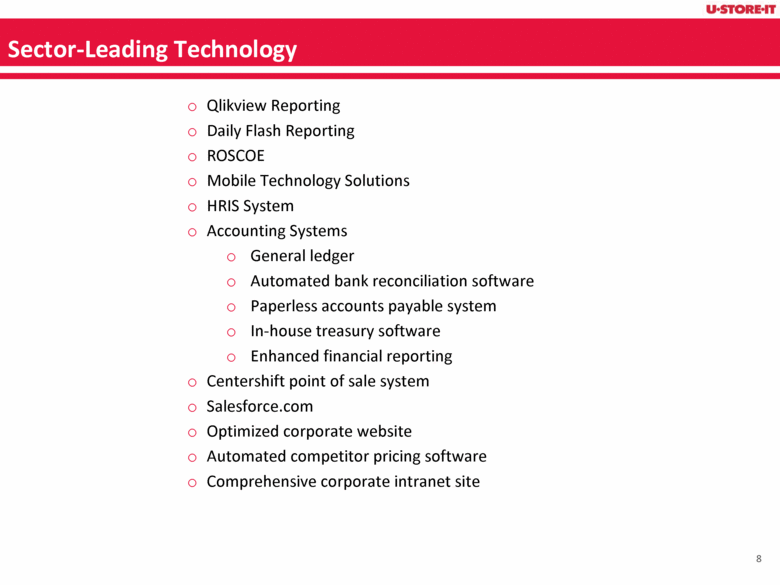
Sector-Leading Technology Qlikview Reporting Daily Flash Reporting ROSCOE Mobile Technology Solutions HRIS System Accounting Systems General ledger Automated bank reconciliation software Paperless accounts payable system In-house treasury software Enhanced financial reporting Centershift point of sale system Salesforce.com Optimized corporate website Automated competitor pricing software Comprehensive corporate intranet site |
|
|
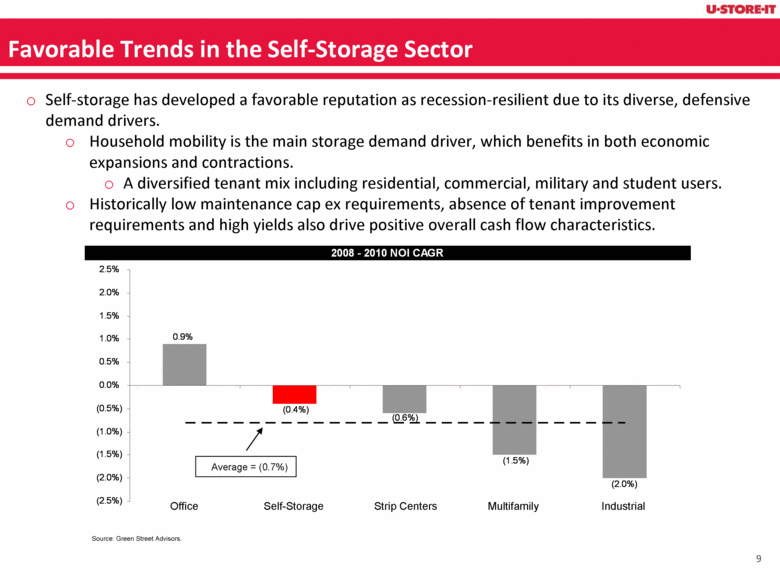
Favorable Trends in the Self-Storage Sector Self-storage has developed a favorable reputation as recession-resilient due to its diverse, defensive demand drivers. Household mobility is the main storage demand driver, which benefits in both economic expansions and contractions. A diversified tenant mix including residential, commercial, military and student users. Historically low maintenance cap ex requirements, absence of tenant improvement requirements and high yields also drive positive overall cash flow characteristics. Source: Green Street Advisors. Average = (0.7%) Office Self-Storage Strip Centers Multifamily Industrial 2008 - 2010 NOI CAGR (2.0%) (0.4%) 0.9% (0.6%) (1.5%) (2.5%) (2.0%) (1.5%) (1.0%) (0.5%) 0.0% 0.5% 1.0% 1.5% 2.0% 2.5% |
|
|
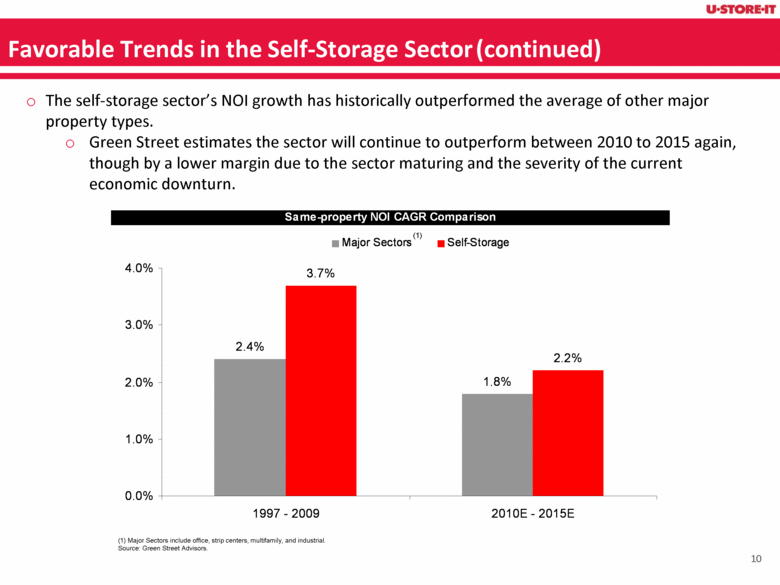
Favorable Trends in the Self-Storage Sector (continued) The self-storage sector’s NOI growth has historically outperformed the average of other major property types. Green Street estimates the sector will continue to outperform between 2010 to 2015 again, though by a lower margin due to the sector maturing and the severity of the current economic downturn. (1) Major Sectors include office, strip centers, multifamily, and industrial. Source: Green Street Advisors. Same-property NOI CAGR Comparison 2.4% 1.8% 3.7% 2.2% 0.0% 1.0% 2.0% 3.0% 4.0% 1997 - 2009 2010E - 2015E Major Sectors (1) Self-Storage |
|
|
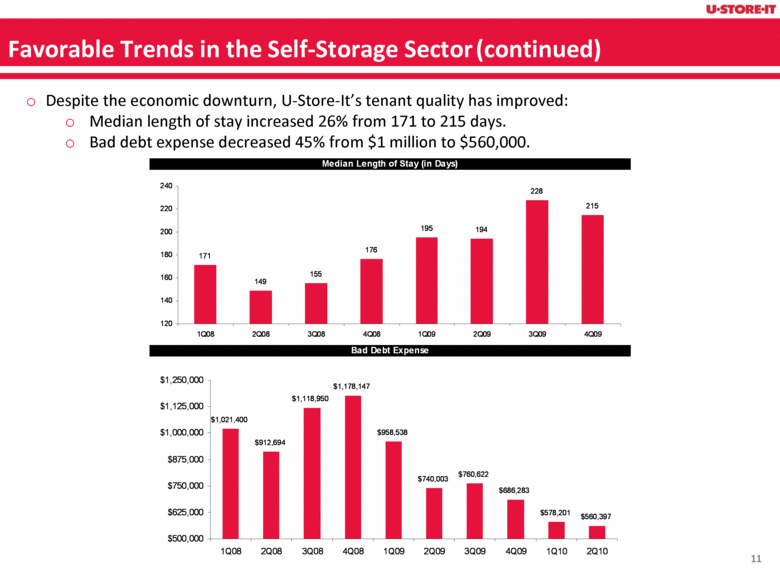
Favorable Trends in the Self-Storage Sector (continued) Despite the economic downturn, U-Store-It’s tenant quality has improved: Median length of stay increased 26% from 171 to 215 days. Bad debt expense decreased 45% from $1 million to $560,000. Bad Debt Expense $1,021,400 $1,118,950 $1,178,147 $958,538 $740,003 $760,622 $686,283 $578,201 $560,397 $912,694 $500,000 $625,000 $750,000 $875,000 $1,000,000 $1,125,000 $1,250,000 1Q08 2Q08 3Q08 4Q08 1Q09 2Q09 3Q09 4Q09 1Q10 2Q10 |
|
|
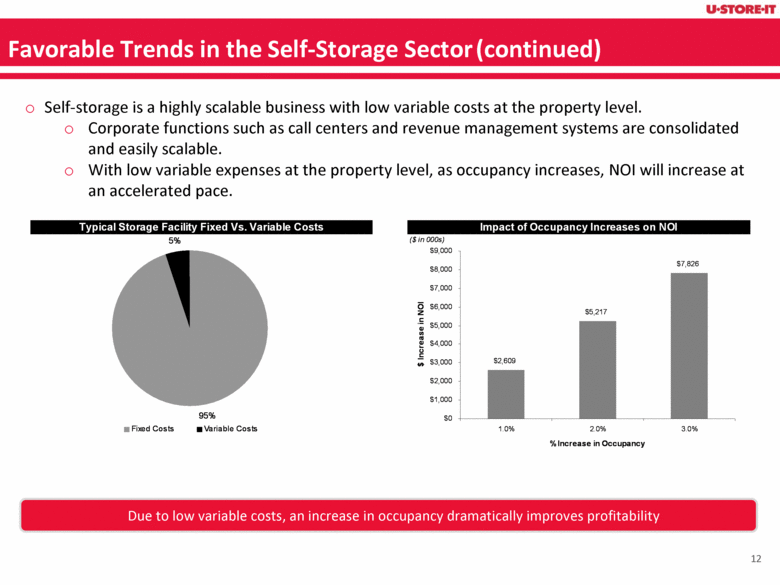
Favorable Trends in the Self-Storage Sector (continued) Self-storage is a highly scalable business with low variable costs at the property level. Corporate functions such as call centers and revenue management systems are consolidated and easily scalable. With low variable expenses at the property level, as occupancy increases, NOI will increase at an accelerated pace. Due to low variable costs, an increase in occupancy dramatically improves profitability Typical Storage Facility Fixed Vs. Variable Costs Impact of Occupancy Increases on NOI ($ in 000s) 95% 5% Fixed Costs Variable Costs $2,609 $5,217 $7,826 $0 $1,000 $2,000 $3,000 $4,000 $5,000 $6,000 $7,000 $8,000 $9,000 1.0% 2.0% 3.0% % Increase in Occupancy $ Increase in NOI |
|
|
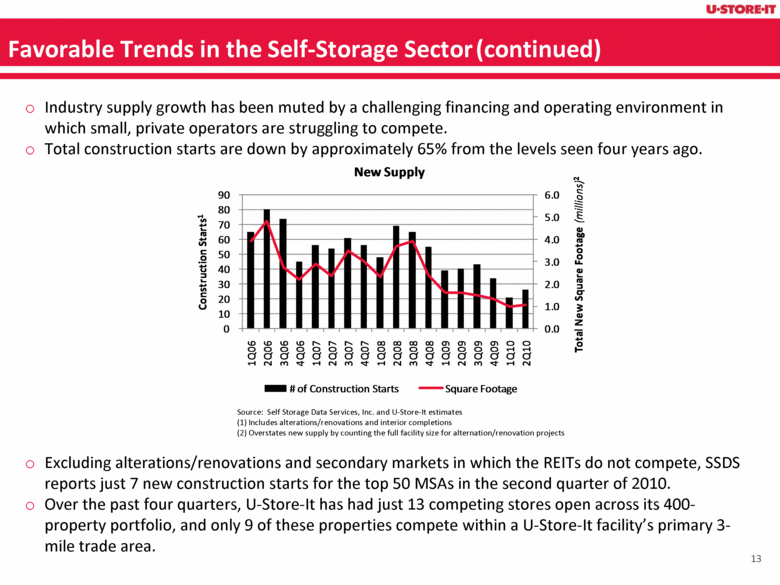
Favorable Trends in the Self-Storage Sector (continued) Industry supply growth has been muted by a challenging financing and operating environment in which small, private operators are struggling to compete. Total construction starts are down by approximately 65% from the levels seen four years ago. Source: Self Storage Data Services, Inc. and U-Store-It estimates (1) Includes alterations/renovations and interior completions (2) Overstates new supply by counting the full facility size for alternation/renovation projects Excluding alterations/renovations and secondary markets in which the REITs do not compete, SSDS reports just 7 new construction starts for the top 50 MSAs in the second quarter of 2010. Over the past four quarters, U-Store-It has had just 13 competing stores open across its 400-property portfolio, and only 9 of these properties compete within a U-Store-It facility’s primary 3-mile trade area. 0.0 1.0 2.0 3.0 4.0 5.0 6.0 0 10 20 30 40 50 60 70 80 90 1Q06 2Q06 3Q06 4Q06 1Q07 2Q07 3Q07 4Q07 1Q08 2Q08 3Q08 4Q08 1Q09 2Q09 3Q09 4Q09 1Q10 2Q10 Total New Square Footage (millions) 2 Construction Starts 1 New Supply # of Construction Starts Square Footage |
|
|
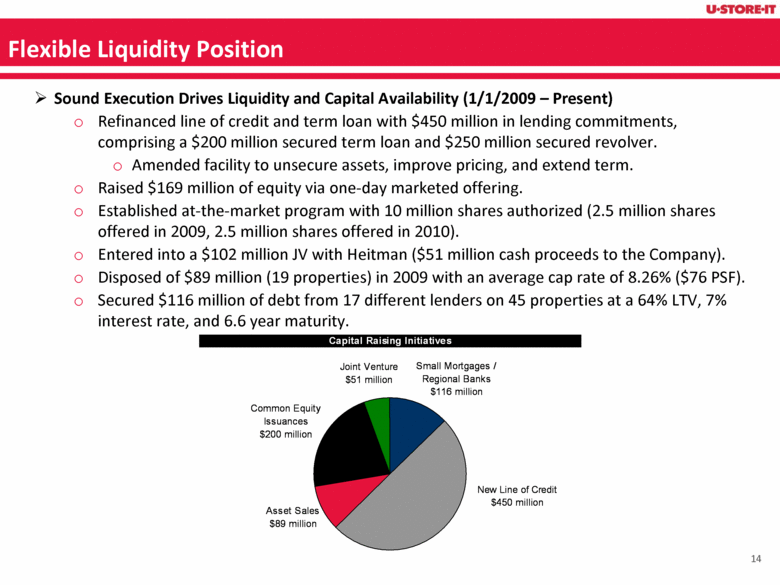
Flexible Liquidity Position Sound Execution Drives Liquidity and Capital Availability (1/1/2009 – Present) Refinanced line of credit and term loan with $450 million in lending commitments, comprising a $200 million secured term loan and $250 million secured revolver. Amended facility to unsecure assets, improve pricing, and extend term. Raised $169 million of equity via one-day marketed offering. Established at-the-market program with 10 million shares authorized (2.5 million shares offered in 2009, 2.5 million shares offered in 2010). Entered into a $102 million JV with Heitman ($51 million cash proceeds to the Company). Disposed of $89 million (19 properties) in 2009 with an average cap rate of 8.26% ($76 PSF). Secured $116 million of debt from 17 different lenders on 45 properties at a 64% LTV, 7% interest rate, and 6.6 year maturity. Capital Raising Initiatives Asset Sales $89 million Common Equity Issuances $200 million Joint Venture $51 million Small Mortgages / Regional Banks $116 million New Line of Credit $450 million |
|
|
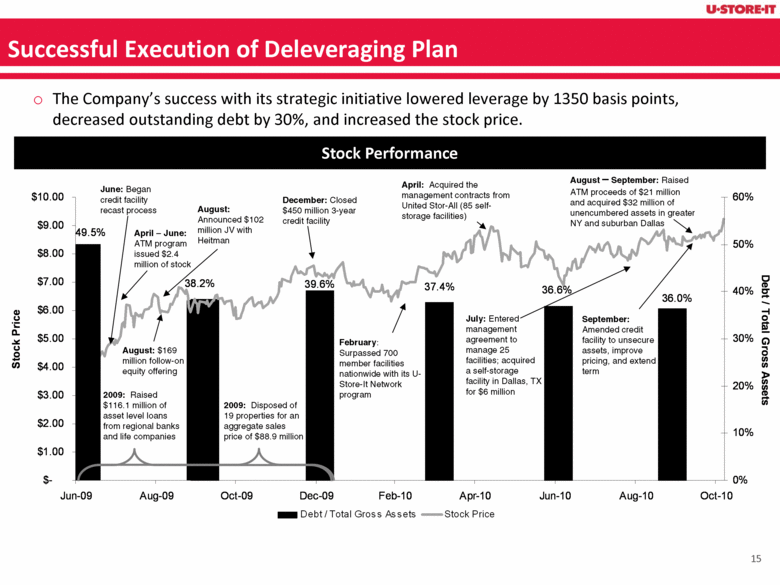
Successful Execution of Deleveraging Plan December: Closed $450 million 3-year credit facility August: $169 million follow-on equity offering June: Began credit facility recast process Stock Performance July: Entered management agreement to manage 25 facilities; acquired a self-storage facility in Dallas, TX for $6 million April: Acquired the management contracts from United Stor-All (85 self-storage facilities) February: Surpassed 700 member facilities nationwide with its U-Store-It Network program 2009: Disposed of 19 properties for an aggregate sales price of $88.9 million August: Announced $102 million JV with Heitman April – June: ATM program issued $2.4 million of stock The Company’s success with its strategic initiative lowered leverage by 1350 basis points, decreased outstanding debt by 30%, and increased the stock price. 2009: Raised $116.1 million of asset level loans from regional banks and life companies August – September: Raised ATM proceeds of $21 million and acquired $32 million of unencumbered assets in greater NY and suburban Dallas September: Amended credit facility to unsecure assets, improve pricing, and extend term 36.0% 36.6% 37.4% 39.6% 38.2% 49.5% $9.25 $- $1.00 $2.00 $3.00 $4.00 $5.00 $6.00 $7.00 $8.00 $9.00 $10.00 Jun-09 Aug-09 Oct-09 Dec-09 Feb-10 Apr-10 Jun-10 Aug-10 Oct-10 Stock Price 0% 10% 20% 30% 40% 50% 60% Debt / Total Gross Assets Debt / Total Gross Assets Stock Price |
|
|
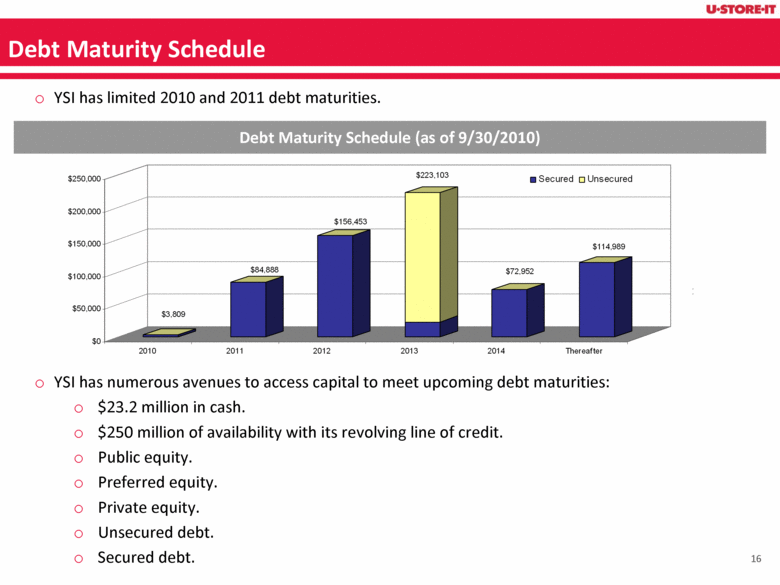
Debt Maturity Schedule Debt Maturity Schedule (as of 9/30/2010) YSI has limited 2010 and 2011 debt maturities. YSI has numerous avenues to access capital to meet upcoming debt maturities: $23.2 million in cash. $250 million of availability with its revolving line of credit. Public equity. Preferred equity. Private equity. Unsecured debt. Secured debt. $3,809 $84,888 $156,453 $223,103 $72,952 $114,989 $0 $50,000 $100,000 $150,000 $200,000 $250,000 2010 2011 2012 2013 2014 Thereafter Secured Unsecured |
|
|
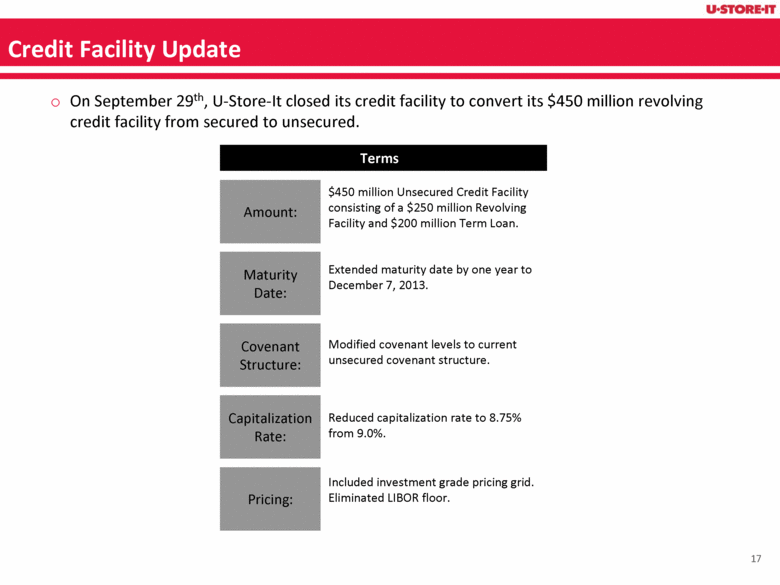
Credit Facility Update On September 29th, U-Store-It closed its credit facility to convert its $450 million revolving credit facility from secured to unsecured. Terms Amount: Maturity Date: Covenant Structure: Capitalization Rate: Pricing: $450 million Unsecured Credit Facility consisting of a $250 million Revolving Facility and $200 million Term Loan. Extended maturity date by one year to December 7, 2013. Modified covenant levels to current unsecured covenant structure. Reduced capitalization rate to 8.75% from 9.0%. Included investment grade pricing grid. Eliminated LIBOR floor. |
|
|
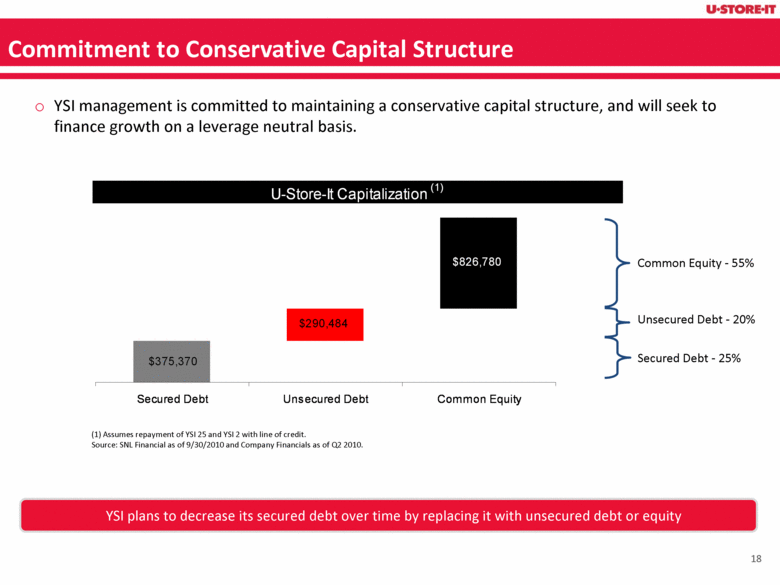
Commitment to Conservative Capital Structure Common Equity - 55% Unsecured Debt - 20% Secured Debt - 25% (1) Assumes repayment of YSI 25 and YSI 2 with line of credit. Source: SNL Financial as of 9/30/2010 and Company Financials as of Q2 2010. YSI management is committed to maintaining a conservative capital structure, and will seek to finance growth on a leverage neutral basis. YSI plans to decrease its secured debt over time by replacing it with unsecured debt or equity U-Store-It Capitalization (1) $375,370 $290,484 $826,780 Secured Debt Unsecured Debt Common Equity |
|
|
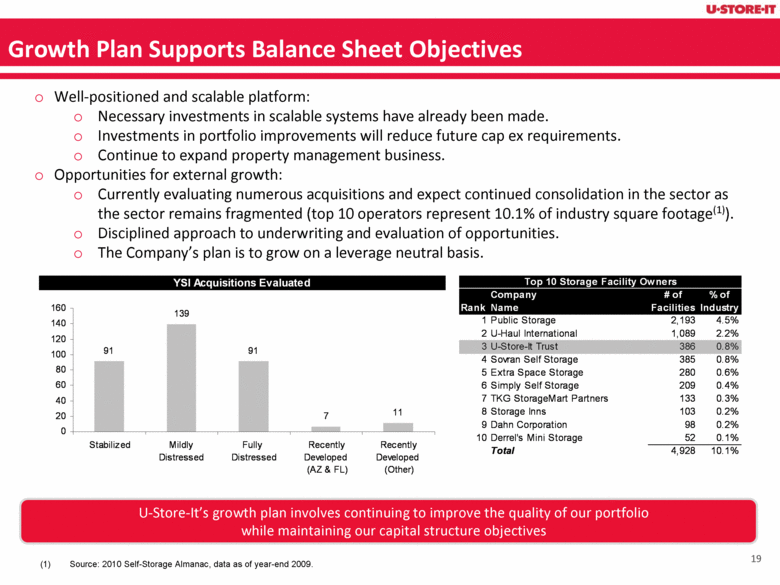
Well-positioned and scalable platform: Necessary investments in scalable systems have already been made. Investments in portfolio improvements will reduce future cap ex requirements. Continue to expand property management business. Opportunities for external growth: Currently evaluating numerous acquisitions and expect continued consolidation in the sector as the sector remains fragmented (top 10 operators represent 10.1% of industry square footage(1)). Disciplined approach to underwriting and evaluation of opportunities. The Company’s plan is to grow on a leverage neutral basis. Growth Plan Supports Balance Sheet Objectives Source: 2010 Self-Storage Almanac, data as of year-end 2009. U-Store-It’s growth plan involves continuing to improve the quality of our portfolio while maintaining our capital structure objectives Top 10 Storage Facility Owners Company # of % of Rank Name Facilities Industry 1 Public Storage 2,193 4.5% 2 U-Haul International 1,089 2.2% 3 U-Store-It Trust 386 0.8% 4 Sovran Self Storage 385 0.8% 5 Extra Space Storage 280 0.6% 6 Simply Self Storage 209 0.4% 7 TKG StorageMart Partners 133 0.3% 8 Storage Inns 103 0.2% 9 Dahn Corporation 98 0.2% 10 Derrel's Mini Storage 52 0.1% Total 4,928 10.1% |

