Attached files
| file | filename |
|---|---|
| EX-99.1 - EX-99.1 - MEADOWBROOK INSURANCE GROUP INC | k49861exv99w1.htm |
| 8-K - FORM 8-K - MEADOWBROOK INSURANCE GROUP INC | k49861e8vk.htm |
Exhibit 99.2

| Investor Supplement November 2010 |

| 2 Forward-Looking Statements Certain statements made by Meadowbrook Insurance Group, Inc. in this presentation may constitute forward-looking statements including, but not limited to, those statements that include the words "believes," "expects," "anticipates," "estimates," or similar expressions. Please refer to the Company's most recent 10-K, 10-Q, and other Securities and Exchange Commission filings for more information on risk factors. Actual results could differ materially. These forward- looking statements involve risks and uncertainties including, but not limited to the following: the frequency and severity of claims; uncertainties inherent in reserve estimates; catastrophic events; a change in the demand for, pricing of, availability or collectability of reinsurance; increased rate pressure on premiums; obtainment of certain rate increases in current market conditions; investment rate of return; changes in and adherence to insurance regulation; actions taken by regulators, rating agencies or lenders; obtainment of certain processing efficiencies; changing rates of inflation; and general economic conditions. Meadowbrook is not under any obligation to (and expressly disclaims any such obligation to) update or alter its forward-looking statements whether as a result of new information, future events or otherwise. |

| 3 Expense Reclassification During the first quarter of 2010, the Company made certain reclassifications to the expense classifications on the Consolidated Statement of Income. These reclassifications were made to enable the user of the financial statements to calculate the GAAP combined ratio directly from the Consolidated Statement of Income. As a result, the Consolidated Statement of Income for the nine months ended September 30, 2009 has been reclassified to conform to this revised presentation. These reclassifications do not change total expenses or consolidated net income as originally reported for the nine months ended September 30, 2009. Please refer to Form 8-k filed on May 3, 2010 for further detail. For the nine months ended September 30, 2010, this refinement resulted in a 2.4 percentage point increase in the expense ratio, a 1.0 percentage point decrease in the loss and LAE ratio and a decrease of $6.2 million in general selling and administrative costs. |
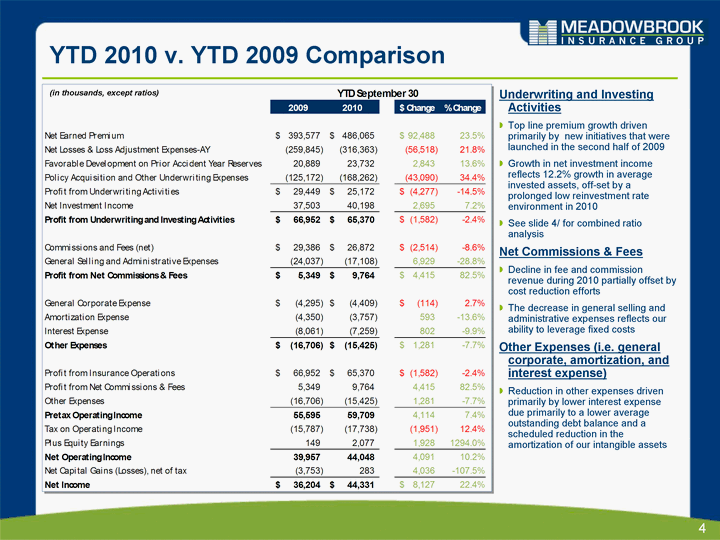
| 4 YTD 2010 v. YTD 2009 Comparison (in thousands, except ratios) Underwriting and Investing Activities Top line premium growth driven primarily by new initiatives that were launched in the second half of 2009 Growth in net investment income reflects 12.2% growth in average invested assets, off-set by a prolonged low reinvestment rate environment in 2010 See slide 4/ for combined ratio analysis Net Commissions & Fees Decline in fee and commission revenue during 2010 partially offset by cost reduction efforts The decrease in general selling and administrative expenses reflects our ability to leverage fixed costs Other Expenses (i.e. general corporate, amortization, and interest expense) Reduction in other expenses driven primarily by lower interest expense due primarily to a lower average outstanding debt balance and a scheduled reduction in the amortization of our intangible assets |
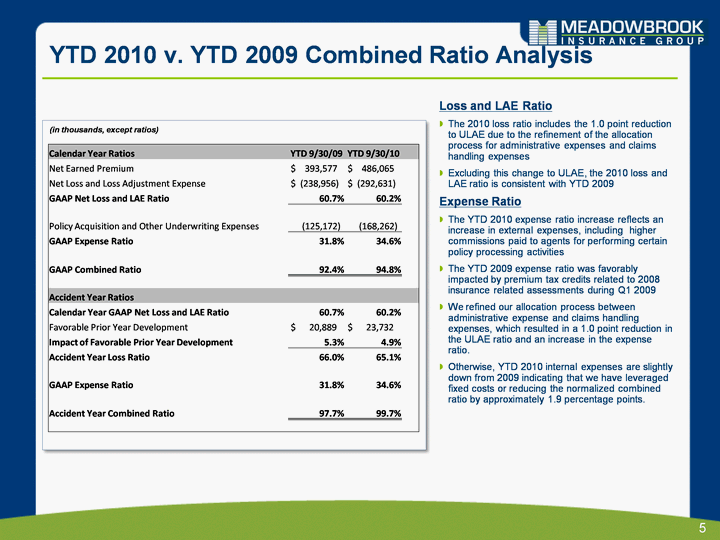
| 5 YTD 2010 v. YTD 2009 Combined Ratio Analysis Loss and LAE Ratio The 2010 loss ratio includes the 1.0 point reduction to ULAE due to the refinement of the allocation process for administrative expenses and claims handling expenses Excluding this change to ULAE, the 2010 loss and LAE ratio is consistent with YTD 2009 Expense Ratio The YTD 2010 expense ratio increase reflects an increase in external expenses, including higher commissions paid to agents for performing certain policy processing activities The YTD 2009 expense ratio was favorably impacted by premium tax credits related to 2008 insurance related assessments during Q1 2009 We refined our allocation process between administrative expense and claims handling expenses, which resulted in a 1.0 point reduction in the ULAE ratio and an increase in the expense ratio. Otherwise, YTD 2010 internal expenses are slightly down from 2009 indicating that we have leveraged fixed costs or reducing the normalized combined ratio by approximately 1.9 percentage points. (in thousands, except ratios) Calendar Year Ratios YTD 9/30/09 YTD 9/30/10 Net Earned Premium $ 393,577 $ 486,065 Net Loss and Loss Adjustment Expense $ (238,956) $ (292,631) GAAP Net Loss and LAE Ratio 60.7% 60.2% Policy Acquisition and Other Underwriting Expenses (125,172) (168,262) GAAP Expense Ratio 31.8% 34.6% GAAP Combined Ratio 92.4% 94.8% Accident Year Ratios Calendar Year GAAP Net Loss and LAE Ratio 60.7% 60.2% Favorable Prior Year Development $ 20,889 $ 23,732 Impact of Favorable Prior Year Development 5.3% 4.9% Accident Year Loss Ratio 66.0% 65.1% GAAP Expense Ratio 31.8% 34.6% Accident Year Combined Ratio 97.7% 99.7% |
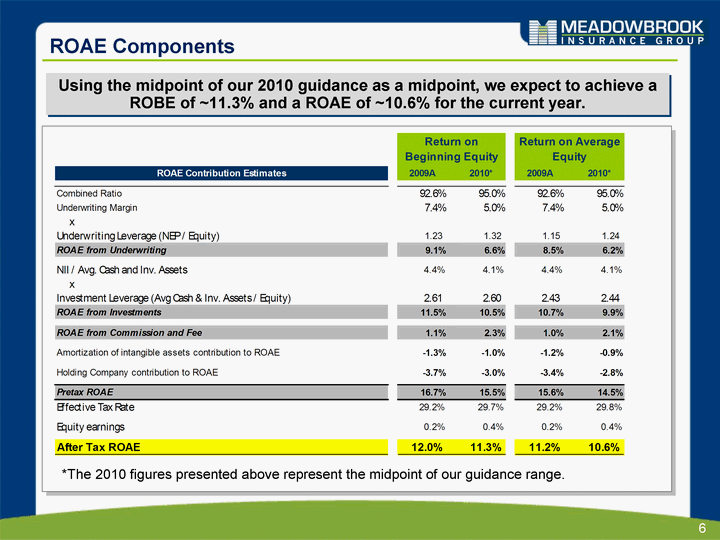
| 6 ROAE Components Using the midpoint of our 2010 guidance as a midpoint, we expect to achieve a ROBE of ~11.3% and a ROAE of ~10.6% for the current year. *The 2010 figures presented above represent the midpoint of our guidance range. |

| 7 Investment Portfolio Appendix |

| 8 We Maintain a High Quality, Low Risk Investment Portfolio We maintain a conservative investment portfolio Portfolio Allocation and Quality Allocation based on market value Low equity risk exposure 98% fixed income and cash 2% equity High credit quality 98% of bonds are investment grade Average S&P rating of AA / Moody's of Aa2 The effective duration of our $1.3 billion portfolio is 4.8 years The duration on net reserves of $727 million is approximately 3.2 years NOTE: Data above as of September 30, 2010 |

| 9 Municipal Bonds Municipals v. Entire Portfolio Quality Indicators State Profile Credit Enhancements* $557M market value; 44% of the investment portfolio September 30, 2010 net unrealized gain was $40.7M Tax exempt unrealized gain $37.0M Taxable unrealized gain $ 3.7M Average tax equivalent yield: 5.57% *Consistent with our conservative investment philosophy, we consider the underlying credit quality of securities excluding credit enhancements when making investment decisions. The credit enhancement ratings listed above are the ratings of the bond insurers and not the ratings of the underlying securities. |

| 10 Structured Securities Structured Relative to Entire Portfolio Quality Indicators RMBS Profile $254.0M market value; 20% of the managed portfolio September 30, 2010 unrealized gain was $16.2M RMBS unrealized gain $13.4M CMBS unrealized loss $ 1.9M ABS unrealized loss $ 0.9M Average investment yield: 5.48% |
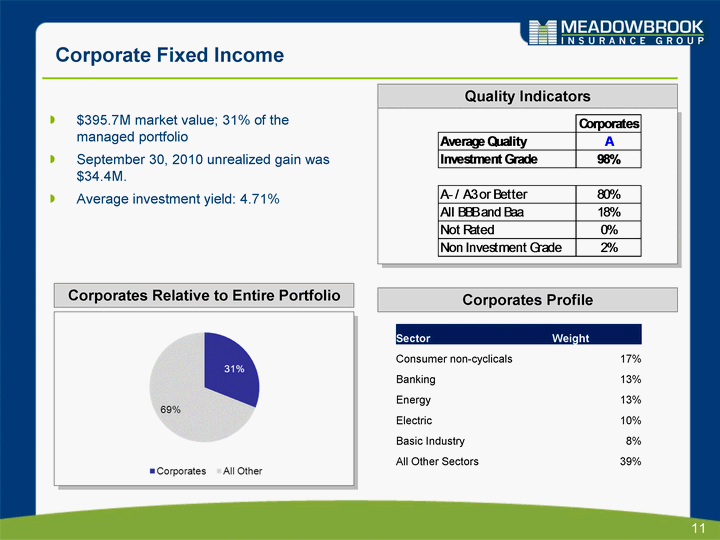
| 11 Corporate Fixed Income Corporates Profile Corporates Relative to Entire Portfolio Quality Indicators Sector Weight Consumer non-cyclicals 17% Banking 13% Energy 13% Electric 10% Basic Industry 8% All Other Sectors 39% $395.7M market value; 31% of the managed portfolio September 30, 2010 unrealized gain was $34.4M. Average investment yield: 4.71% |
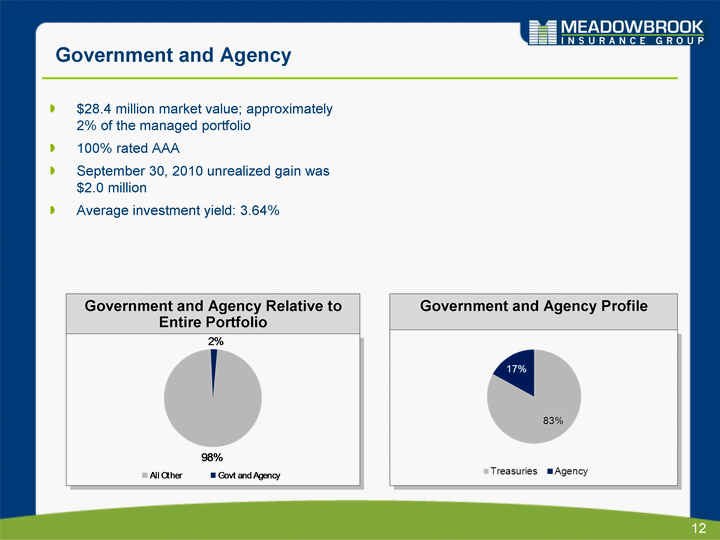
| 12 Government and Agency Government and Agency Profile Government and Agency Relative to Entire Portfolio $28.4 million market value; approximately 2% of the managed portfolio 100% rated AAA September 30, 2010 unrealized gain was $2.0 million Average investment yield: 3.64% |
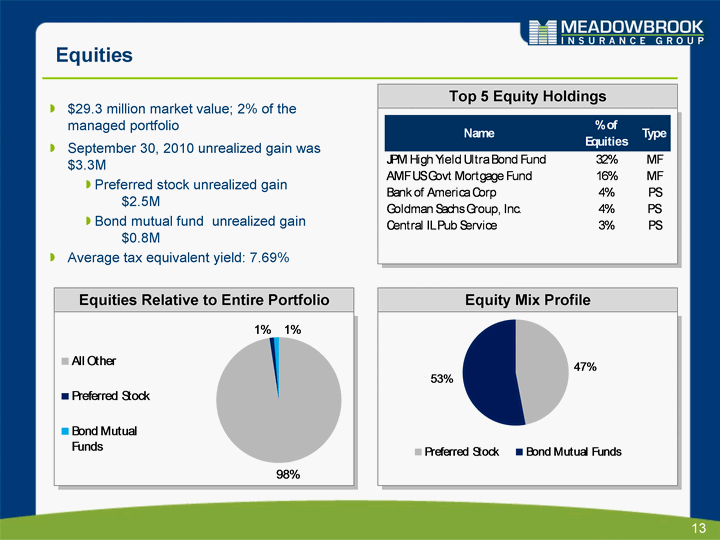
| 13 Equities Equity Mix Profile Equities Relative to Entire Portfolio Top 5 Equity Holdings $29.3 million market value; 2% of the managed portfolio September 30, 2010 unrealized gain was $3.3M Preferred stock unrealized gain $2.5M Bond mutual fund unrealized gain $0.8M Average tax equivalent yield: 7.69% |

