Attached files
Table of Contents
Index to Financial Statements
As filed with the Securities and Exchange Commission on November 30, 2010
Registration No. 333-166092
UNITED STATES
SECURITIES AND EXCHANGE COMMISSION
Washington, D.C. 20549
AMENDMENT NO. 6
TO
FORM S-1
REGISTRATION STATEMENT
UNDER
THE SECURITIES ACT OF 1933
FLEETCOR TECHNOLOGIES, INC.
(Exact name of Registrant as specified in its charter)
| Delaware | 7389 | 72-1074903 | ||
| (State or other jurisdiction of incorporation or organization) |
(Primary Standard Industrial Classification Code Number) |
(I.R.S. Employer Identification No.) |
655 Engineering Drive, Suite 300
Norcross, Georgia 30092-2830
(770) 449-0479
(Address, including zip code, and telephone number, including area code, of Registrant’s principal executive offices)
Sean Bowen
Senior Vice President and General Counsel
655 Engineering Drive, Suite 300
Norcross, Georgia 30092-2830
(770) 449-0479
(Name, address, including zip code, and telephone number, including area code, of agent for service)
with copies to:
| Jon R. Harris, Jr., Esq. Alan J. Prince, Esq. King & Spalding LLP 1180 Peachtree Street, N.E. Atlanta, Georgia 30309 (404) 572-4600 |
John W. White, Esq. Andrew J. Pitts, Esq. Cravath, Swaine & Moore LLP Worldwide Plaza 825 Eighth Avenue New York, New York 10019 (212) 474-1000 |
Approximate date of commencement of proposed sale to the public: As soon as practicable after the effective date of this Registration Statement.
If any of the securities being registered on this Form are to be offered on a delayed or continuous basis pursuant to Rule 415 under the Securities Act of 1933, check the following box. ¨
If this Form is filed to register additional securities for an offering pursuant to Rule 462(b) under the Securities Act, please check the following box and list the Securities Act registration statement number of the earlier effective registration statement for the same offering. ¨
If this Form is a post-effective amendment filed pursuant to Rule 462(c) under the Securities Act, check the following box and list the Securities Act registration statement number of the earlier effective registration statement for the same offering. ¨
If this Form is a post-effective amendment filed pursuant to Rule 462(d) under the Securities Act, check the following box and list the Securities Act registration statement number of the earlier effective registration statement for the same offering. ¨
Indicate by check mark whether Registrant is a large accelerated filer, an accelerated filer, a non-accelerated filer, or a smaller reporting company. See the definitions of “large accelerated filer,” “accelerated filer” and “smaller reporting company” in Rule 12b-2 of the Exchange Act.
| Large accelerated filer ¨ | Accelerated filer ¨ | |||
| Non-accelerated filer x |
(Do not check if a smaller reporting company) | Smaller reporting company ¨ |
CALCULATION OF REGISTRATION FEE
| Title of each class of securities to be registered |
Amount to be registered (1) |
Proposed maximum offering price per |
Proposed maximum aggregate offering price (1)(2) |
Amount of registration fee | ||||
| Common Stock, $0.001 par value per share |
14,576,250 shares | $26.00 | $378,982,500 | $27,022(3) | ||||
| (1) | Includes shares issuable upon exercise of the underwriters’ over-allotment options. See “Underwriting.” |
| (2) | Estimated solely for the purpose of calculating the registration fee pursuant to Rule 457(a) under the Securities Act. |
| (3) | Previously paid. |
The Registrant hereby amends this Registration Statement on such date or dates as may be necessary to delay its effective date until the Registrant shall file a further amendment which specifically states that this Registration Statement shall thereafter become effective in accordance with Section 8(a) of the Securities Act of 1933 or until the Registration Statement shall become effective on such date as the Commission, acting pursuant to said Section 8(a), may determine.
Table of Contents
Index to Financial Statements
The information in this preliminary prospectus is not complete and may be changed. These securities may not be sold until the registration statement filed with the Securities and Exchange Commission is effective. This preliminary prospectus is not an offer to sell nor does it seek an offer to buy these securities in any jurisdiction where the offer or sale is not permitted.
Preliminary Prospectus
Subject to Completion. Dated November 30, 2010
12,675,000 Shares

Common Stock
This is an initial public offering of the common stock of FleetCor Technologies, Inc.
FleetCor Technologies, Inc. is offering 430,961 of the shares to be sold in the offering. The selling stockholders identified in this prospectus are offering an additional 12,244,039 shares. FleetCor will not receive any proceeds from the sale of the shares being sold by the selling stockholders.
Prior to this offering, there has been no public market for the common stock. It is currently estimated that the initial public offering price per share will be between $23.00 and $26.00. FleetCor’s common stock has been approved for listing on the New York Stock Exchange, subject to official notice of issuance, under the symbol “FLT”.
See “Risk factors” beginning on page 11 to read about risks you should consider before buying shares of common stock.
Neither the Securities and Exchange Commission nor any state securities commission has approved or disapproved of these securities or passed upon the accuracy or adequacy of this prospectus. Any representation to the contrary is a criminal offense.
| Per Share | Total | |||||||
| Initial public offering price |
$ | $ | ||||||
| Underwriting discount |
$ | $ | ||||||
| Proceeds, before expenses, to us |
$ | $ | ||||||
| Proceeds, before expenses, to the selling stockholders |
$ | $ | ||||||
To the extent the underwriters sell more than 12,675,000 shares of common stock, the underwriters have the option to purchase up to an additional 1,901,250 shares from the selling stockholders at the initial public offering price less the underwriting discount.
Delivery of the shares of common stock will be made on or about , 2010.
| J.P. Morgan |
Goldman, Sachs & Co. | |||
| Barclays Capital |
Morgan Stanley | |||
| PNC Capital Markets LLC |
Raymond James |
Wells Fargo Securities | ||
Prospectus dated , 2010.
Table of Contents
Index to Financial Statements
| Page | ||||
| 1 | ||||
| 11 | ||||
| 29 | ||||
| 30 | ||||
| 31 | ||||
| 32 | ||||
| 34 | ||||
| Unaudited pro forma condensed consolidated financial information |
36 | |||
| 39 | ||||
| Management’s discussion and analysis of financial condition and results of operations |
41 | |||
| 75 | ||||
| 92 | ||||
| 101 | ||||
| 124 | ||||
| 130 | ||||
| 135 | ||||
| 140 | ||||
| 143 | ||||
| 145 | ||||
| 149 | ||||
| 156 | ||||
| 156 | ||||
| 156 | ||||
| F-1 | ||||
No dealer, salesperson or other person is authorized by us or the selling stockholders to give any information or to represent anything not contained in this prospectus. You must not rely on any unauthorized information or representations. This prospectus is an offer to sell only the shares offered hereby, but only under circumstances and in jurisdictions where it is lawful to do so. The information contained in this prospectus is current only as of the date on the front of this prospectus.
i
Table of Contents
Index to Financial Statements
This summary highlights significant aspects of our business and this offering that appear later in this prospectus, but it is not complete and does not contain all of the information that you should consider before making your investment decision. You should read carefully the entire prospectus, including the section entitled “Risk factors” and the information presented in the historical financial data and related notes, before making an investment decision. This summary contains forward-looking statements, which involve risks and uncertainties. Our actual results may differ significantly from the results discussed in the forward-looking statements as a result of certain factors, including those set forth in this prospectus under the headings “Risk factors” and “Special note regarding forward-looking statements.” In this prospectus, unless indicated otherwise or the context otherwise requires, “we,” “us,” “our” and “FleetCor” refer to FleetCor Technologies, Inc., the issuer of the common stock, and its subsidiaries.
Overview
FleetCor is a leading independent global provider of specialized payment products and services to commercial fleets, major oil companies and petroleum marketers. We serve more than 530,000 commercial accounts in 18 countries in North America, Europe, Africa and Asia, and we had approximately 2.5 million commercial cards in use during the month of December 2009. Through our proprietary payment networks, our cards are accepted at approximately 83,000 locations in North America and internationally. In 2009, we processed approximately $14 billion in purchases on our proprietary networks and third-party networks. We believe that our size and scale, geographic reach, advanced technology and our expansive suite of products, services, brands and proprietary networks contribute to our leading industry position.
We provide our payment products and services in a variety of combinations to create customized payment solutions for our customers and partners. Our payment programs enable businesses to better manage and control employee spending and provide card-accepting merchants with a high volume customer base that can increase their sales and customer loyalty. In order to deliver our payment programs and services and process transactions, we own and operate six proprietary “closed-loop” networks through which we electronically connect to merchants and capture, analyze and report customized information. We also use third-party networks to deliver our payment programs and services in order to broaden our card acceptance and use. To support our payment products, we also provide a range of services, such as issuing and processing, as well as specialized information services that provide our customers with value-added functionality and data. Our customers can use this data to track important business productivity metrics, combat fraud and employee misuse, streamline expense administration and lower overall fleet operating costs.
We market our payment products directly to a broad range of commercial fleet customers, including vehicle fleets of all sizes and government fleets. Among these customers, we provide our products and services predominantly to small and medium commercial fleets. We believe these fleets represent an attractive segment of the global commercial fleet market given their relatively high use of less efficient payment products, such as cash and general purpose credit cards. We also manage commercial fleet card programs for major oil companies, such as British Petroleum (BP) (including its subsidiary Arco), Chevron and Citgo, and over 800 petroleum marketers. These companies collectively maintain hundreds of thousands of end-customer relationships with commercial fleets. We refer to these major oil companies and petroleum marketers with whom we have strategic relationships as our “partners.”
FleetCor benefits from an attractive business model, which is characterized by our recurring revenue, significant operating margins and low capital expenditure requirements. Our revenue is recurring in nature because we
1
Table of Contents
Index to Financial Statements
generate fees every time a card is used, customers rely on our payment programs to control their own recurring operating expenses and our partners and customers representing a substantial portion of our revenue enter into multi-year service contracts. Our highly-scalable business model creates significant operating efficiencies, which enable us to generate strong cash flow that may be used to repay indebtedness, make acquisitions and fund the future growth of our business. In addition, this business model enables us to continue to grow our business organically without significant additional capital expenditures.
We believe the fleet card industry is positioned for further consolidation because it is served by a fragmented group of suppliers, few with the size and scale to adequately invest to keep pace with industry advancements. For example, there is significant time and investment required to establish the “closed-loop” networks and technology solutions that address the diverse requirements of customers and partners across various geographic markets. We believe this dynamic will continue to shift market share to larger scale vendors with advanced technology platforms and drive further consolidation globally.
FleetCor’s predecessor company was organized in the United States in 1986. In 2000, our current chief executive officer joined us and we changed our name to FleetCor Technologies, Inc. Since 2000, we have grown significantly through a combination of organic initiatives, product and service innovation and over 40 acquisitions of businesses and commercial account portfolios. We have grown our revenue from $30.7 million in 2001 to $381.3 million on a “managed basis” (as defined in “Management’s discussion and analysis of financial condition and results of operations”) in 2009, representing a compound annual growth rate of 37.0%. In 2009, we generated 35.8% of our revenue from our international operations, compared to none in 2005. For the years ended December 31, 2005, 2006, 2007, 2008 and 2009, our consolidated revenue was $143.3 million, $186.2 million, $264.1 million, $341.1 million and $354.1 million, respectively. In the same periods, we generated operating income of $59.0 million, $71.8 million, $105.8 million, $152.5 million and $146.0 million, respectively. In addition, we have grown our net income from a net loss of $12.6 million in 2000 to net income of $89.1 million in 2009.
Industry background
| • | The electronic payments industry is a large and fast-growing sector that is benefiting from favorable trends around the world. Packaged Facts, a research firm, estimates that total global card purchase volumes reached $6.8 trillion in 2009, growing at a compound annual growth rate of 10.8% from 2005 to 2009. |
| • | Commercial cards provide specialized capabilities and are among the fastest growing segments of the electronic payments industry. Commercial card products are typically charge cards, which are paid in full every month and provide businesses with control over the types of authorized purchases, integration with accounting systems, detailed reporting, and the ability to incorporate and transmit additional data with a payment transaction. Packaged Facts estimates that total global commercial card purchase volumes reached $916.5 billion in 2009, growing at a compound annual growth rate of 8.2% from 2005 to 2009, and will reach $1.5 trillion in 2014, growing at a compound annual growth rate of 10.6% from 2009 to 2014. |
| • | Fleet cards typically provide differentiated services that help commercial fleet operators operate their businesses more effectively. Fleet cards are specialized commercial cards that fleet operators provide to their drivers to pay for fuel, maintenance, repairs and other approved purchases. Fleet cards typically provide differentiated services, which include significant cost controls (managed through business rules implemented at the point of sale) and access to “level 3” data regarding transactions, such as the amount of the expenditure, the identification of the driver and vehicle, the odometer reading, the identity of the fuel or vehicle maintenance provider and the items purchased. |
2
Table of Contents
Index to Financial Statements
| • | Fleets represent a large customer base around the world. Fleets are composed of one or more vehicles, including automobiles, vans, SUVs, trucks and buses, used by businesses and governments. We believe small and medium commercial fleets represent a significant market opportunity for growth. |
| • | Packaged Facts estimates that there were approximately 41.9 million fleet vehicles in the United States in 2008 and that total U.S. closed-loop fleet card purchase volumes reached $50.8 billion in 2009, growing at a compound annual growth rate of 6.0% from 2005 to 2009. Based on research by Packaged Facts, 35% of U.S. fleet vehicle fuel volume in 2009 was purchased utilizing closed-loop fleet cards. |
| • | Based on our analysis of data from several sources, we believe there were approximately 68 million fleet vehicles in 30 European and Eurasian countries in 2007. Datamonitor, a research firm, estimates that the total value of fuel sold on commercial fuel cards in 16 major European countries reached approximately €68 billion in 2006. Based on our analysis of data available for several of the largest European countries, including France, Germany, Italy, the Netherlands, Spain and the United Kingdom, we estimate that during 2005, approximately 59% of fleet vehicle fuel volume in Europe was purchased with some form of fleet card product. |
| • | Industry characteristics provide an attractive growth opportunity. The fleet card industry is served by a fragmented group of participants with varying distribution models, including oil companies, petroleum marketers, third-party independent fleet card issuers and network operators, transaction processors and software service providers. We believe there is a significant amount of aging technology, legacy systems, and “dated” business practices within the fleet card industry, which we believe will continue to shift market share to larger scale vendors with advanced technology platforms and create significant barriers to entry. Given the generally rising levels of fuel prices and the continued increase in the number and size of commercial fleets, we believe the use of fleet cards will continue to increase around the world. We believe increasing penetration could accelerate the growth of the fleet card sector relative to alternative payment methods, and we believe larger scale participants may be able to grow at a faster rate than the sector due to the fragmented nature of the industry. We believe there will be an increasingly limited number of vendors that can serve the fleet card market effectively and even fewer with the ability to provide products and network services on a global scale. |
Our competitive strengths
We believe our competitive strengths include the following:
| • | Global leadership. We are a leading independent global provider of specialized commercial payment products and services to fleets, major oil companies and petroleum marketers. We believe that our deep and diverse relationships, geographic reach, strong brands and scale contribute to our leading industry position. |
| • | Broad distribution capabilities. We target new customers across different markets by using multiple distribution channels and tailored sales and marketing efforts designed to address the unique characteristics of individual market segments. By targeting and effectively marketing our products to several different customer segments, we are able to address a variety of growth opportunities and diversify our revenue base. |
| • | Proprietary closed-loop networks. We operate six proprietary closed-loop networks which, as of December 31, 2009, served approximately 83,000 acceptance locations in North America and internationally. We believe that the significant time and investment required to establish a large-scale network with mass merchant acceptance makes our model extremely difficult to replicate and creates a significant barrier to entry in our industry. |
3
Table of Contents
Index to Financial Statements
| • | Advanced, reliable technology systems. We operate proprietary and industry-leading technology systems that use modern, scalable and standardized architecture. Our business models and best practices are codified in our technology systems, allowing us to take advantage of revenue-enhancing and cost-saving opportunities across our different businesses and geographies. |
| • | Superior products and services. We provide products and services tailored to the specific needs of our fleet customers, which we believe makes them more attractive than alternative payment methods such as cash, house accounts and general purpose credit cards, as well as many other fleet card products. We believe we are also able to achieve a competitive advantage over many other fleet card vendors by designing products targeting the unique needs of our customers and partners in different markets. |
| • | Strong execution capabilities. Our leadership team has a long and demonstrated track record of growing our business. We have achieved our growth through a strategy combining operational initiatives, strategic relationships and acquisitions. |
Our growth strategy
Our strategy is to grow our revenue and profits by further penetrating our target markets, expanding our product and service offerings, entering new geographic markets and acquiring companies that meet our strategic criteria. The key elements of our growth strategy are to:
| • | Penetrate our target markets further. We intend to expand our presence in target markets by adding more customers, cross-selling additional products and services to existing customers, entering into additional strategic relationships and making acquisitions. |
| • | Expand our products and services. We will seek to grow revenue by introducing new product features and functionality to our fleet card products, including additional maintenance, lodging and travel and entertainment capabilities. We aim to extend our network offerings in order to help major oil companies and petroleum marketers compete more effectively with other fleet cards and alternative payment methods. |
| • | Enter new geographic markets. We intend to continue expanding in areas of Europe and the United States where we currently do not have a significant presence. We are also evaluating other opportunities in markets we believe to be under-penetrated, such as Latin America and parts of Asia. |
| • | Pursue growth through strategic acquisitions. Since 2002, we have completed over 40 acquisitions of companies and commercial account portfolios. In certain international markets, where fleet card penetration is below levels observed in the United States, we will seek opportunities to increase our customer base through further strategic acquisitions. |
Our products and services
We sell a range of customized fleet and lodging payment programs directly and indirectly through partners, such as major oil companies and petroleum marketers. We provide our customers with various card products that typically function like a charge card to purchase fuel, lodging and related products and services at participating locations. We support these cards with specialized issuing, processing and information services that enable us to manage card accounts, facilitate the routing, authorization, clearing and settlement of transactions, and provide value-added functionality and data including customizable card-level controls and productivity analysis tools. Depending on our customer’s and partner’s needs, we provide these services in a variety of outsourced solutions
4
Table of Contents
Index to Financial Statements
ranging from a comprehensive “end-to-end” solution (encompassing issuing, processing and network services) to limited back office processing services. In order to deliver our payment programs and services, we own and operate six proprietary closed-loop networks in North America and internationally. Our networks have well-established brands in local markets and proprietary technology that enable us to capture, transact, analyze and report value-added information pertinent to managing and controlling employee spending.
Risk factors
Investing in our common stock involves substantial risk, and our ability to successfully operate our business is subject to numerous risks, including those that are generally associated with our industry. Any of the risks set forth in this prospectus under the heading “Risk factors” may limit our ability to successfully execute our business strategy. You should carefully consider all of the information set forth in this prospectus and, in particular, should evaluate the specific risks set forth in this prospectus under the heading “Risk factors” in deciding whether to invest in our common stock.
Our principal executive offices are located at 655 Engineering Drive, Suite 300, Norcross, Georgia 30092-2830, and our telephone number at that address is (770) 449-0479. Our website is located at www.fleetcor.com. The information on our website is not part of this prospectus.
Certain data included in this prospectus regarding our industry is derived from our internal assessments, which are based on a variety of sources, including publicly available data and information obtained from customers, other industry sources and management estimates. Independent consultant reports, industry publications and other published industry sources generally indicate that the information contained therein was obtained from sources believed to be reliable but do not guarantee the accuracy and completeness of such information. Our internal data and estimates are based upon information obtained from our investors, customers, suppliers, trade and business organizations, contacts in the markets in which we operate and management’s understanding of industry conditions. Although we believe that such information is reliable, we cannot give you any assurance that any projections or estimates will be achieved.
5
Table of Contents
Index to Financial Statements
The offering
| Shares of common stock offered by us |
430,961 shares |
| Shares of common stock offered by the selling stockholders |
12,244,039 shares |
| Shares of our common stock to be outstanding after this offering |
78,719,146 shares |
| Option to purchase additional shares of common stock |
The selling stockholders have granted the underwriters a 30-day option to purchase up to 1,901,250 additional shares of common stock at the initial public offering price. |
| Voting rights |
Each share of common stock will entitle its holder to one vote. |
| Use of proceeds |
We estimate that the net proceeds we will receive from this offering, after deducting underwriting discounts and other estimated offering expenses payable by us, will be approximately $6.3 million, assuming the shares are offered at $24.50 per share, which is the mid-point of the price range set forth on the cover page of this prospectus. |
| We intend to use approximately $3.1 million of the net proceeds we will receive from this offering to repay a portion of our outstanding term loans under the 2005 Credit Facility. We intend to use the remaining net proceeds for working capital and other general corporate purposes. |
| We will not receive any proceeds from the sale of shares of our common stock by the selling stockholders. |
| Dividend policy |
We currently expect to retain all future earnings, if any, for use in the operation and expansion of our business and debt repayment; therefore, we do not anticipate paying cash dividends on our common stock in the foreseeable future. See “Dividend policy” below. |
| Proposed New York Stock Exchange ticker symbol |
“FLT”. |
| Risk factors |
You should carefully read and consider the information set forth under the heading “Risk factors” beginning on page 11 of this prospectus and all other information set forth in this prospectus before investing in our common stock. |
The common stock to be outstanding after this offering is based on 77,700,311 shares outstanding as of September 30, 2010, and excludes the following:
| • | as of September 30, 2010, 7,348,344 shares issuable upon the exercise of outstanding stock options at a weighted-average exercise price of $8.11 per share (which amount excludes 587,874 shares in respect of options to be exercised by selling stockholders in connection with this offering); and |
6
Table of Contents
Index to Financial Statements
| • | 6,750,000 shares reserved for future issuance under our 2010 Equity Compensation Plan. |
Except as otherwise indicated, the information in this prospectus:
| • | assumes the automatic conversion of all outstanding shares of our preferred stock into 43,575,148 shares of our common stock immediately prior to the closing of this offering; |
| • | assumes the underwriters do not exercise their option to purchase up to 1,901,250 additional shares from the selling stockholders, which would also include the exercise of additional options by selling stockholders in connection with this offering; |
| • | reflects the two and one-half-for-one stock split of shares of our common stock effected on November 29, 2010; and |
| • | assumes that our shares of common stock will be sold at $24.50 per share, which is the mid-point of the price range set forth on the cover page of this prospectus. |
7
Table of Contents
Index to Financial Statements
Summary consolidated data for FleetCor Technologies, Inc.
The table below summarizes our consolidated financial information for the periods indicated and has been derived from our consolidated financial statements and presents certain other financial information. You should read the following information together with the more detailed information contained in “Selected consolidated financial data,” “Management’s discussion and analysis of financial condition and results of operations” and our consolidated financial statements and the accompanying notes, each appearing elsewhere in this prospectus. The consolidated statement of income data for the years ended December 31, 2006 and 2005 as well as the consolidated balance sheet data as of December 31, 2007, 2006 and 2005 are derived from our audited consolidated financial statements not included in this prospectus. The unaudited consolidated financial statements include, in the opinion of management, all adjustments, which include only normal recurring adjustments, that management considers necessary for the fair presentation of the financial information set forth in those statements. Our historical results are not necessarily indicative of the results to be expected in any future period.
| (in thousands, except per share data) | Nine months ended September 30, |
Year ended December 31, | ||||||||||||||||||||||||||
| 2010 | 2009 | 2009 | 2008 | 2007 | 2006 | 2005 | ||||||||||||||||||||||
| (unaudited) | ||||||||||||||||||||||||||||
| Statement of income data(1): |
||||||||||||||||||||||||||||
| Revenues, net |
$ | 327,294 | $ | 256,761 | $ | 354,073 | $ | 341,053 | $ | 264,086 | $ | 186,209 | $ | 143,334 | ||||||||||||||
| Expenses: |
||||||||||||||||||||||||||||
| Merchant commissions |
39,549 | 28,860 | 39,709 | 38,539 | 39,358 | 32,784 | 24,247 | |||||||||||||||||||||
| Processing |
52,608 | 43,099 | 57,997 | 51,406 | 34,060 | 26,388 | 18,360 | |||||||||||||||||||||
| Selling |
23,155 | 21,470 | 30,579 | 23,778 | 22,625 | 19,464 | 13,740 | |||||||||||||||||||||
| General and administrative |
40,025 | 38,251 | 51,375 | 47,635 | 41,986 | 23,175 | 20,562 | |||||||||||||||||||||
| Depreciation and amortization |
25,238 | 20,235 | 28,368 | 27,240 | 20,293 | 12,571 | 7,448 | |||||||||||||||||||||
| Operating income |
146,719 | 104,846 | 146,045 | 152,455 | 105,764 | 71,827 | 58,977 | |||||||||||||||||||||
| Other (income) expense, net |
(767 | ) | (369 | ) | (933 | ) | (2,488 | ) | (1,554 | ) | 39 | 1,997 | ||||||||||||||||
| Interest expense, net |
16,352 | 13,023 | 17,363 | 20,256 | 19,735 | 11,854 | 7,564 | |||||||||||||||||||||
| Total other expense |
15,585 | 12,654 | 16,430 | 17,768 | 18,181 | 11,893 | 9,561 | |||||||||||||||||||||
| Income before income taxes |
131,134 | 92,192 | 129,615 | 134,687 | 87,583 | 59,934 | 49,416 | |||||||||||||||||||||
| Provision for income taxes |
40,752 | 28,088 | 40,563 | 37,405 | 25,998 | 21,957 | 18,748 | |||||||||||||||||||||
| Net income |
$ | 90,382 | $ | 64,104 | $ | 89,052 | $ | 97,282 | $ | 61,585 | $ | 37,977 | $ | 30,668 | ||||||||||||||
| Pro forma earnings per share (unaudited)(2): |
||||||||||||||||||||||||||||
| Earnings per share, basic |
$ | .89 | $ | .78 | $ | 1.10 | $ | 1.36 | $ | .87 | $ | .58 | $ | .46 | ||||||||||||||
| Earnings per share, diluted |
.93 | .82 | 1.13 | 1.35 | .86 | .57 | .44 | |||||||||||||||||||||
| Weighted average shares outstanding, basic |
77,600 | 74,548 | 75,253 | 68,108 | 67,271 | 61,892 | 65,812 | |||||||||||||||||||||
| Weighted average shares outstanding, diluted |
82,045 | 77,978 | 78,854 | 71,913 | 71,720 | 66,660 | 69,852 | |||||||||||||||||||||
| Balance sheet data (at end of period) |
||||||||||||||||||||||||||||
| Cash and cash equivalents |
$ | 110,773 | $ | 69,019 | $ | 84,701 | $ | 70,355 | $ | 68,864 | $ | 18,191 | $ | — | ||||||||||||||
| Restricted cash (3) |
65,927 | 73,485 | 67,979 | 71,222 | 76,797 | 64,016 | — | |||||||||||||||||||||
| Total assets |
1,503,527 | 1,201,655 | 1,209,545 | 929,062 | 875,106 | 657,925 | 266,359 | |||||||||||||||||||||
| Total debt |
501,326 | 360,250 | 351,551 | 370,747 | 341,851 | 255,032 | 127,543 | |||||||||||||||||||||
| Total stockholders’ equity |
571,929 | 445,005 | 474,049 | 273,264 | 192,009 | 158,482 | 58,179 | |||||||||||||||||||||
| Other financial information (unaudited): |
||||||||||||||||||||||||||||
| EBITDA(4) |
$ | 172,724 | (5) | $ | 125,450 | $ | 175,346 | $ | 182,183 | $ | 127,611 | $ | 84,359 | $ | 64,428 | |||||||||||||
| Adjusted EBITDA(4) |
172,724 | (5) | 129,506 | 180,646 | 197,983 | 143,811 | 97,494 | 71,411 | ||||||||||||||||||||
| Adjusted net income(4) |
103,566 | 74,807 | 103,938 | 112,732 | 71,139 | 42,756 | 33,127 | |||||||||||||||||||||
8
Table of Contents
Index to Financial Statements
| (1) | In June 2009, the Financial Accounting Standards Board, or FASB, issued authoritative guidance limiting the circumstances in which a financial asset may be derecognized when the transferor has not transferred the entire financial asset or has continuing involvement with the transferred asset. This guidance was effective for us as of January 1, 2010. As a result of the adoption of such guidance, effective January 1, 2010, our statements of income will no longer include securitization activities in revenue. Rather, we will report interest income, provision for bad debts and interest expense associated with the debt securities issued from our securitization facility. |
| (2) | Pro forma to give effect to (1) the conversion of all outstanding shares of our convertible preferred stock into 43,575,148 shares of our common stock immediately prior to the closing of this offering as though the conversion had occurred at the beginning of the indicated fiscal period, (2) the forgiveness of all cumulative dividends on our convertible preferred stock, except for a portion of the dividends related to the Series D-3 convertible preferred stock where holders will receive cash dividends of approximately $7.3 million calculated as of September 30, 2010, (3) a two and one-half-for-one stock split of shares of our common stock effected on November 29, 2010 and (4) compensation expense of approximately $14.1 million related to 1,631,805 shares of restricted stock which will vest upon the closing of this offering (assuming the price to the public is at the midpoint of the estimated price range set forth on the cover page of this prospectus). |
| (3) | Restricted cash represents customer deposits repayable on demand. |
| (4) | EBITDA is calculated as net income before the provision for income taxes, interest expense, net and depreciation and amortization. Adjusted EBITDA is calculated as EBITDA adjusted for the incremental interest expense attributable to our securitization facility. Adjusted net income is calculated as net income, adjusted to eliminate (a) stock-based compensation expense related to share-based compensation awards, (b) amortization of deferred financing costs and intangible assets and (c) amortization of the premium recognized on the purchase of receivables. We prepare adjusted net income to eliminate the effect of items that we do not consider indicative of our core operating performance. EBITDA, adjusted EBITDA and adjusted net income are supplemental measures of operating performance that do not represent and should not be considered as an alternative to net income or cash flow from operations, as determined by U.S. generally accepted accounting principles, or U.S. GAAP, and our calculation thereof may not be comparable to that reported by other companies. EBITDA, Adjusted EBITDA and adjusted net income have limitations as analytical tools, and you should not consider them in isolation, or as a substitute for analysis of our results as reported under U.S. GAAP. Some of the limitations are: |
| • | EBITDA, adjusted EBITDA and adjusted net income do not reflect our cash expenditures or future requirements for capital expenditures or contractual commitments; |
| • | EBITDA, adjusted EBITDA and adjusted net income do not reflect changes in, or cash requirements for, our working capital needs; |
| • | adjusted net income does not reflect the non-cash component of employee compensation; |
| • | EBITDA and adjusted EBITDA do not reflect the significant interest expense, or the cash requirements necessary to service interest or principal payments, on our debt; and |
| • | although depreciation and amortization are non-cash charges, the assets being depreciated and amortized will often have to be replaced in the future, and EBITDA and adjusted EBITDA do not reflect any cash requirements for such replacements. |
We compensate for these limitations by relying primarily on our U.S. GAAP results and using EBITDA, adjusted EBITDA and adjusted net income only supplementally. We also compensate for these limitations by disclosing such limitations and reconciling EBITDA, adjusted EBITDA and adjusted net income to the most directly comparable U.S. GAAP measure, net income. Further, we also review U.S. GAAP measures and evaluate individual measures that are not included in EBITDA, adjusted EBITDA and adjusted net income. We believe that our presentation of these U.S. GAAP and non-GAAP financial measurements provides information that is useful to analysts and investors because they are important indicators of the strength of our operations and the performance of our core business. We believe it is useful to exclude stock-based compensation expense from adjusted net income because non-cash equity grants made at a certain price and point in time do not necessarily reflect how our business is performing at any particular time and stock-based compensation expense is not a key measure of our core operating performance. We also believe that amortization expenses can vary substantially from company to company and from period to period depending upon their financing and accounting methods, the fair value and average expected life of their acquired intangible assets, their capital structures and the method by which their assets were acquired; therefore, we have excluded amortization expense from our adjusted net income.
Management uses EBITDA, adjusted EBITDA and adjusted net income:
| • | as measurements of operating performance because they assist us in comparing our operating performance on a consistent basis; |
| • | for planning purposes, including the preparation of our internal annual operating budget; |
| • | to allocate resources to enhance the financial performance of our business; and |
| • | to evaluate the performance and effectiveness of our operational strategies. |
In addition, management uses EBITDA and adjusted EBITDA to calculate incentive compensation for our employees.
We believe these measurements are used by investors as supplemental measures to evaluate the overall operating performance of companies in our industry. By providing these non-GAAP financial measures, together with reconciliations, we believe we are enhancing investors’ understanding of our business and our results of operations, as well as assisting investors in evaluating how well we are executing strategic initiatives.
9
Table of Contents
Index to Financial Statements
The following table reconciles net income to EBITDA and adjusted EBITDA:
| Nine Months ended September 30, |
Year ended December 31, | |||||||||||||||||||||||||||
| (in thousands) | 2010 | 2009 | 2009 | 2008 | 2007 | 2006 | 2005 | |||||||||||||||||||||
| Net income |
$ | 90,382 | $ | 64,104 | $ | 89,052 | $ | 97,282 | $ | 61,585 | $ | 37,977 | $ | 30,668 | ||||||||||||||
| Provision for income taxes |
40,752 | 28,088 | 40,563 | 37,405 | 25,998 | 21,957 | 18,748 | |||||||||||||||||||||
| Interest expense, net |
16,352 | 13,023 | 17,363 | 20,256 | 19,735 | 11,854 | 7,564 | |||||||||||||||||||||
| Depreciation and amortization |
25,238 | 20,235 | 28,368 | 27,240 | 20,293 | 12,571 | 7,448 | |||||||||||||||||||||
| EBITDA |
172,724 | (5) | 125,450 | 175,346 | 182,183 | 127,611 | 84,359 | 64,428 | ||||||||||||||||||||
| Incremental interest expense(a) |
N/A | (5) | 4,056 | 5,300 | 15,800 | 16,200 | 13,135 | 6,983 | ||||||||||||||||||||
| Adjusted EBITDA(a) |
$ | 172,724 | (5) | $ | 129,506 | $ | 180,646 | $ | 197,983 | $ | 143,811 | $ | 97,494 | $ | 71,411 | |||||||||||||
| (a) | We utilize an off-balance sheet securitization facility in the ordinary course of our business to finance a portion of our accounts receivable. Accounts receivable that we sell under the securitization facility are reported in our consolidated financial statements in accordance with relevant authoritative literature. Trade accounts receivable sold under this program are excluded from accounts receivable in our consolidated financial statements. In June 2009, the Financial Accounting Standards Board, or FASB, issued authoritative guidance limiting the circumstances in which a financial asset may be derecognized when the transferor has not transferred the entire financial asset or has continuing involvement with the transferred asset. This guidance was effective for us as of January 1, 2010. As a result of the adoption of such guidance, effective January 1, 2010, our statements of income no longer include securitization activities in revenue. Rather, we report interest income, provision for bad debts and interest expense associated with the debt securities issued from our securitization facility. Although the provision for bad debts and interest expense related to our securitization facility are currently reported in revenue, we monitor these costs on a managed basis. Our revenue, processing expense, provision for bad debts and interest expense on a managed basis are set forth and reconciled under “Management’s Discussion and Analysis of Financial Condition and Results of Operations—Accounts Receivable Securitization” . The incremental interest expense represents the additional amount of interest expense that would have been reported if the new authoritative guidance discussed herein was applied to all years presented. |
The following table reconciles net income to adjusted net income:
| Twelve Months ended September 30, |
Nine Months ended September 30, |
Year ended December 31, | ||||||||||||||||||||||||||||||
| (in thousands) | 2010 | 2010 | 2009 | 2009 | 2008 | 2007 | 2006 | 2005 | ||||||||||||||||||||||||
| Net income |
$115,330 | $ | 90,382 | $ | 64,104 | $ | 89,052 | $ | 97,282 | $ | 61,585 | $ | 37,977 | $ | 30,668 | |||||||||||||||||
| Stock-based compensation expense |
3,120 | 2,453 | 1,999 | 2,666 | 2,758 | 1,165 | 139 | 93 | ||||||||||||||||||||||||
| Amortization of intangible assets |
16,867 | 12,749 | 9,782 | 13,900 | 12,038 | 9,825 | 4,978 | 2,060 | ||||||||||||||||||||||||
| Amortization of premium on receivables |
3,262 | 2,447 | 2,442 | 3,257 | 5,471 | 1,702 | 1,443 | 581 | ||||||||||||||||||||||||
| Amortization of deferred financing costs |
2,153 | 1,480 | 1,169 | 1,842 | 1,123 | 895 | 982 | 1,229 | ||||||||||||||||||||||||
| Total pre-tax adjustments |
25,402 | 19,129 | 15,392 | 21,665 | 21,390 | 13,587 | 7,542 | 3,963 | ||||||||||||||||||||||||
| Income tax impact of pre-tax adjustments at the effective tax rate |
(7,856) | (5,945 | ) | (4,689 | ) | (6,779 | ) | (5,940 | ) | (4,033 | ) | (2,763 | ) | (1,504 | ) | |||||||||||||||||
| Adjusted net income |
$132,876 | $ | 103,566 | $ | 74,807 | $ | 103,938 | $ | 112,732 | $ | 71,139 | $ | 42,756 | $ | 33,127 | |||||||||||||||||
In addition, adjusted net income (loss) was $24,579, $11,734, $(12,492) and $(1,455) for the years ended December 31, 2004, 2003, 2002 and 2001, respectively. The following table reconciles net income to adjusted net income (loss) for these periods.
| Year ended December 31, | ||||||||||||||||
| (in thousands) | 2004 | 2003 | 2002 | 2001 | ||||||||||||
| Net income (loss) |
$ | 22,708 | $ | 10,806 | $ | (18,956 | ) | $ | (3,680 | ) | ||||||
| Stock based compensation expense |
244 | 523 | — | — | ||||||||||||
| Amortization of goodwill and intangible assets |
376 | 178 | — | 990 | ||||||||||||
| Goodwill impairment |
— | — | 4,305 | — | ||||||||||||
| Amortization of discount on related-party notes |
119 | — | 1,664 | 732 | ||||||||||||
| Amorization of deferred financing costs |
1,132 | 238 | 513 | 503 | ||||||||||||
| Total pre-tax adjustments |
1,871 | 939 | 6,482 | 2,225 | ||||||||||||
| Income tax impact of pre-tax adjustments at the effective tax rate |
— | (11 | ) | (18 | ) | — | ||||||||||
| Adjusted net income (loss) |
$ | 24,579 | $ | 11,734 | $ | (12,492 | ) | $ | (1,455 | ) | ||||||
| (5) | For periods ended subsequent to January 1, 2010 interest expense, net includes incremental interest expense attributable to our securitization facility. Had we continued to include the incremental interest expense attributable to the securitization facility of $3.7 million within revenue for the nine months ended September 30, 2010, EBITDA would have been $169.0 million. |
10
Table of Contents
Index to Financial Statements
This offering involves a high degree of risk. In addition to the other information contained in this prospectus, prospective investors should carefully consider the following risks before investing in our common stock. If any of the following risks actually occur, our business, operating results and financial condition could be materially adversely affected. As a result, the trading price of our common stock could decline, and you may lose all or part of your investment in our common stock. The risks discussed below also include forward-looking statements, and our actual results may differ substantially from those discussed in these forward-looking statements. See “Special note regarding forward-looking statements” in this prospectus.
Risks related to our business
A decline in retail fuel prices could adversely affect our revenue and operating results.
Our fleet customers use our products and services primarily in connection with the purchase of fuel. Accordingly, our revenue is affected by fuel prices, which are subject to significant volatility. A decline in retail fuel prices could cause a decrease in our revenue from fees paid to us by merchants based on a percentage of each transaction purchase amount. We believe that in 2009, approximately 19.1% of our consolidated revenue, as adjusted for the impact of the new accounting guidance related to our securitization facility as described under the heading “Management’s discussion and analysis of financial condition and results of operations—Accounts receivable securitization”, was directly influenced by the absolute price of fuel. In this prospectus, for the periods between January 1, 2005 and December 31, 2009, we refer to our consolidated revenue as adjusted for the impact of the new accounting guidance related to our securitization facility as our “consolidated revenue on a managed basis”. For the periods prior to January 1, 2005, we did not maintain a securitization facility. Changes in the absolute price of fuel may also impact unpaid account balances and the late fees and charges based on these amounts. A decline in retail fuel prices could adversely affect our revenue and operating results.
Fuel prices are dependent on several factors, all of which are beyond our control. These factors include, among others:
| • | supply and demand for oil and gas, and market expectations regarding supply and demand; |
| • | actions by members of OPEC and other major oil-producing nations; |
| • | political conditions in oil-producing and gas-producing nations, including insurgency, terrorism or war; |
| • | oil refinery capacity; |
| • | weather; |
| • | the prices of foreign exports; |
| • | the implementation of fuel efficiency standards and the adoption by our fleet customers of vehicles with greater fuel efficiency or alternative fuel sources; |
| • | general worldwide economic conditions; and |
| • | governmental regulations, taxes and tariffs. |
A portion of our revenue is derived from fuel-price spreads. As a result, a contraction in fuel-price spreads could adversely affect our operating results.
Approximately 18.6% of our consolidated revenue on a managed basis in 2009 was derived from transactions where our revenue is tied to fuel-price spreads. Fuel-price spreads equal the difference between the fuel price we charge to the fleet customer and the fuel price paid to the fuel merchant. In transactions where we derive revenue
11
Table of Contents
Index to Financial Statements
from fuel-price spreads, the fuel price paid to the fuel merchant is calculated as the merchant’s wholesale cost of fuel plus a commission. The merchant’s wholesale cost of fuel is dependent on several factors including, among others, the factors described above affecting fuel prices. The fuel price that we charge to our fleet customer is dependent on several factors including, among others, the fuel price paid to the fuel merchant, posted retail fuel prices and competitive fuel prices. We experience fuel-price spread contraction when the merchant’s wholesale cost of fuel increases at a faster rate than the fuel price we charge to our fleet customers, or the fuel price we charge to our fleet customers decreases at a faster rate than the merchant’s wholesale cost of fuel. Accordingly, when fuel-price spreads contract, we generate less revenue, which could adversely affect our operating results.
If we fail to adequately assess and monitor credit risks of our customers, we could experience an increase in credit loss.
We are subject to the credit risk of our customers, many of which are small to mid-sized businesses. We use various methods to screen potential customers and establish appropriate credit limits, but these methods cannot eliminate all potential credit risks and may not always prevent us from approving customer applications that are fraudulently completed. Changes in our industry and movement in fuel prices may result in periodic increases to customer credit limits and spending and, as a result, increased credit losses. We may also fail to detect changes to the credit risk of customers over time. Further, during a declining economic environment, we experience increased customer defaults. If we fail to adequately manage our credit risks, our bad debt expense could be significantly higher than historic levels and adversely affect our business, operating results and financial condition. Although the provision for bad debts and interest expense related to our securitization facility were included as a component of net revenue for the periods prior to January 1, 2010 in accordance with then-prevailing accounting guidance, we considered such amounts an expense for the periods prior to January 1, 2010. Accordingly, for internal reporting purposes, we included such amount as a component of operating expense, which we refer to as on a “managed basis.” As further described under the heading “Management’s discussion and analysis of financial condition and results of operations—Accounts receivable securitization”, on a managed basis, our provision for bad debts equaled $32.6 million for the year ended December 31, 2009. For the nine months ended September 30, 2010, our provision for bad debts equaled $15.1 million.
We derive a portion of our revenue from program fees and charges paid by the users of our cards. Any decrease in our receipt of such fees and charges, or limitations on our fees and charges, could adversely affect our business, results of operations and financial condition.
Our card programs include a variety of fees and charges associated with transactions, cards, reports, late payments and optional services. We derived approximately 54.0% of our consolidated revenue on a managed basis from these fees and charges during the year ended December 31, 2009 and approximately 55.0% of our consolidated revenue from these fees and charges during the nine months ended September 30, 2010. If the users of our cards decrease their transaction activity, the extent to which they pay invoices late or their use of optional services, our revenue could be materially adversely affected. In addition, several market factors can affect the amount of our fees and charges, including the market for similar charges for competitive card products and the availability of alternative payment methods such as cash or house accounts. Furthermore, regulators and Congress have scrutinized the electronic payments industry’s pricing, charges and other practices related to its customers. Any legislative or regulatory restrictions on our ability to price our products and services could materially and adversely affect our revenue. Any decrease in our revenue derived from these fees and charges could materially and adversely affect our business, operating results and financial condition.
12
Table of Contents
Index to Financial Statements
We operate in a competitive business environment, and if we are unable to compete effectively, our business, operating results and financial condition would be adversely affected.
The market for our products and services is highly competitive, and competition could intensify in the future. Our competitors vary in size and in the scope and breadth of the products and services they offer. Our primary competitors in the United States are small, regional and large independent fleet card providers, major oil companies and petroleum marketers that issue their own fleet cards and major financial services companies that provide card services to major oil companies and petroleum marketers. We also compete for customers with providers of alternative payment mechanisms, such as financial institutions that issue corporate and consumer credit cards and merchants offering house cash accounts or other forms of credit. Our primary competitors in Europe are independent fleet card providers, major oil companies and petroleum marketers that issue branded fleet cards, and providers of card outsourcing services to major oil companies and petroleum marketers.
The most significant competitive factors in our business are the breadth of product and service features, network acceptance size, customer service and account management and price. We may experience competitive disadvantages with respect to any of these factors from time to time as potential customers prioritize or value these competitive factors differently. As a result, a specific offering of our products and service features, networks and pricing may serve as a competitive advantage with respect to one customer and a disadvantage for another based on the customers’ preferences.
Some of our existing and potential competitors have longer operating histories, greater brand name recognition, larger customer bases, more extensive customer relationships or greater financial and technical resources. In addition, our larger competitors may also have greater resources than we do to devote to the promotion and sale of their products and services and to pursue acquisitions. For example, major oil companies and petroleum marketers and large financial institutions may choose to integrate fuel-card services as a complement to their existing card products and services. As a result, they may be able to adapt more quickly to new or emerging technologies and changing opportunities, standards or customer requirements. To the extent that our competitors are regarded as leaders in specific categories, they may have an advantage over us as we attempt to further penetrate these categories.
Future mergers or consolidations among competitors, or acquisitions of our competitors by large companies may present competitive challenges to our business. Resulting combined entities could be at a competitive advantage if their fuel-card products and services are effectively integrated and bundled into sales packages with their widely utilized non-fuel-card-related products and services. Further, larger competitors have reduced, and could continue to reduce, the fees for their services, which has increased and may continue to increase pricing pressure within our markets.
Overall, increased competition in our markets could result in intensified pricing pressure, reduced profit margins, increased sales and marketing expenses and a failure to increase, or a loss of, market share. We may not be able to maintain or improve our competitive position against our current or future competitors, which could adversely affect our business, operating results and financial condition.
Our business is dependent on several key strategic relationships, the loss of which could adversely affect our operating results.
We intend to seek to expand our strategic relationships with major oil companies. We refer to the major oil companies and petroleum marketers with whom we have strategic relationships as our “partners.” During 2009 and the nine months ended September 30, 2010, our top three strategic relationships with major oil companies accounted for approximately 18% and 22%, respectively, of our consolidated revenue. No single partner represented more than 10% of our consolidated revenue in 2009. In the nine months ended September 30, 2010, one partner accounted for approximately 11% of our consolidated revenue. Two of our partners each represented
13
Table of Contents
Index to Financial Statements
greater than 5% of our consolidated revenue during 2009. Our agreements with our major oil company partners typically have initial terms of five to ten years with current remaining terms ranging from less than one year up to seven years.
The success of our business is in part dependent on our ability to maintain these strategic relationships and enter into additional strategic relationships with major oil companies. In our relationships with these major oil companies, our services are marketed under our partners’ brands. If these partners fail to maintain their brands, or decrease the size of their branded networks, our ability to grow our business may be adversely affected. Our inability to maintain or further develop these relationships or add additional strategic relationships could materially and adversely affect our business and operating results.
To enter into a new strategic relationship or renew an existing strategic relationship with a major oil company, we often must participate in a competitive bidding process, which may focus on a limited number of factors, such as pricing. The use of these processes may affect our ability to effectively compete for these relationships. Our competitors may be willing to bid for these contracts on pricing or other terms that we consider uneconomical in order to win this business. The loss of our existing major oil company partners or the failure to contract with additional partners could materially and adversely affect our business, operating results and financial condition.
We depend, in part, on our merchant relationships to grow our business. To grow our customer base, we must retain and add relationships with merchants who are located in areas where our customers purchase fuel and lodging. If we are unable to maintain and expand these relationships, our business may be adversely affected.
A portion of our growth is derived from acquiring new merchant relationships to serve our customers, our new and enhanced product and service offerings and cross-selling our products and services through existing merchant relationships. We rely on the continuing growth of our merchant relationships and our distribution channels in order to expand our customer base. There can be no guarantee that this growth will continue. Similarly, our growth also will depend on our ability to retain and maintain existing merchant relationships that accept our proprietary closed-loop networks in areas where our customers purchase fuel and lodging. Our contractual agreements with fuel merchants typically have initial terms of one year and automatically renew on a year-to-year basis unless either party gives notice of termination. Our agreements with lodging providers typically have initial terms of one year and automatically renew on a month-to-month basis unless either party gives notice of termination. Furthermore, merchants with which we have relationships may experience bankruptcy, financial distress, or otherwise be forced to contract their operations. The loss of existing merchant relationships, the contraction of our existing merchants’ operations or the inability to acquire new merchant relationships could adversely affect our ability to serve our customers and our business and operating results.
A decline in general economic conditions, and in particular, a decline in demand for fuel and other vehicle products and services would adversely affect our business, operating results and financial condition.
Our operating results are materially affected by conditions in the economy generally, both in the United States and internationally. We generate revenue based in part on the volume of fuel purchase transactions we process. Our transaction volume is correlated with general economic conditions in the United States and Europe and in particular, the amount of business activity in these economies. Downturns in these economies are generally characterized by reduced commercial activity and, consequently, reduced purchasing of fuel and other vehicle products and services by businesses. The recession in 2007 and 2008 negatively affected the organic growth of our business in 2009, which resulted from lower transaction volume from existing customers. Unfavorable changes in economic conditions, including declining consumer confidence, inflation, recession or other changes, may lead our customers, which are largely comprised of commercial fleets, to demand less fuel, or lead our partners to reduce their use of our products and services. These declines could result from, among other things, reduced fleet traffic, corporate purchasing, travel and other commercial activities from which we derive revenue.
14
Table of Contents
Index to Financial Statements
Further, economic conditions also may impact the ability of our customers or partners to pay for fuel or other services they have purchased and, as a result, our reserve for credit losses and write-offs of accounts receivable could increase. In addition, demand for fuel and other vehicle products and services may be reduced by other factors that are beyond our control, such as the development and use of vehicles with greater fuel efficiency and alternative fuel sources.
We are unable to predict the likely duration and severity of the current disruption in financial markets and adverse economic conditions in the United States and Europe. As a result, a sustained deterioration in general economic conditions in the United States or Europe, or increases in interest rates in key countries in which we operate, could adversely affect our business and operating results.
We have expanded into new lines of business in the past and may do so in the future. If we are unable to successfully integrate these new businesses, our results of operations and financial condition may be adversely affected.
We have expanded our business to encompass new lines of business in the past. For example, within the past several years we have entered into the lodging card business in the United States and now offer a limited telematics service to European customers. We may continue to enter new lines of business and offer new products and services in the future. There is no guarantee that we will be successful in integrating these new lines of business into our operations. If we are unable to do so, our operating results and financial condition may be adversely affected.
If we fail to develop and implement new technology, products and services, adapt our products and services to changes in technology or the marketplace, or if our ongoing efforts to upgrade our technology, products and services are not successful, we could lose customers and partners.
The markets for our products and services are highly competitive, and characterized by technological change, frequent introduction of new products and services and evolving industry standards. We must respond to the technological advances offered by our competitors and the requirements of our customers and partners, in order to maintain and improve upon our competitive position. We may be unsuccessful in expanding our technological capabilities and developing, marketing or selling new products and services that meet these changing demands, which could jeopardize our competitive position. In addition, we engage in significant efforts to upgrade our products and services and the technology that supports these activities on a regular basis. If we are unsuccessful in completing the migration of material technology, otherwise upgrading our products and services and supporting technology or completing or gaining market acceptance of new technology, products and services, it would have a material adverse effect on our ability to retain existing customers and attract new ones in the impacted business line.
Our debt obligations, or our incurrence of additional debt obligations, could limit our flexibility in managing our business and could materially and adversely effect our financial performance.
As of September 30, 2010, we had approximately $323.5 million of long-term indebtedness outstanding. In addition, we are permitted under our credit agreement to incur additional indebtedness, subject to specified limitations. Our substantial indebtedness currently outstanding, or as may be outstanding if we incur additional indebtedness, could have important consequences, including the following:
| • | we may have difficulty satisfying our obligations under our debt facilities and, if we fail to satisfy these obligations, an event of default could result; |
15
Table of Contents
Index to Financial Statements
| • | we may be required to dedicate a substantial portion of our cash flow from operations to required payments on our indebtedness, thereby reducing the availability of cash flow for acquisitions, working capital, capital expenditures and other general corporate activities. See “Management’s discussion and analysis of financial condition and results of operations—Contractual obligations,” which sets forth our payment obligations with respect to our existing long-term debt; |
| • | covenants relating to our debt may limit our ability to enter into certain contracts or to obtain additional financing for acquisitions, working capital, capital expenditures and other general corporate activities; |
| • | covenants relating to our debt may limit our flexibility in planning for, or reacting to, changes in our business and the industry in which we operate, including by restricting our ability to make strategic acquisitions; |
| • | we may be more vulnerable than our competitors to the impact of economic downturns and adverse developments in the industry in which we operate; |
| • | we are exposed to the risk of increased interest rates because certain of our borrowings are subject to variable rates of interest; |
| • | although we have no current intention to pay any dividends, we may be unable to pay dividends or make other distributions with respect to your investment; and |
| • | we may be placed at a competitive disadvantage against any less leveraged competitors. |
The occurrence of one or more of these potential consequences could have a material adverse effect on our business, financial condition, operating results, and ability to satisfy our obligations under our indebtedness.
In addition, we and our subsidiaries may be able to incur substantial additional indebtedness in the future. Although our credit agreement contains restrictions on the incurrence of additional indebtedness, these restrictions are subject to a number of significant qualifications and exceptions, and under certain circumstances, the amount of additional indebtedness that could be incurred in compliance with these restrictions could be substantial. If new debt is added to our existing debt levels, the related risks that we will face would increase.
We meet a significant portion of our working capital needs through a securitization facility, which we must renew on an annual basis.
We meet a significant portion of our working capital needs through a securitization facility, pursuant to which we sell accounts receivable to a special-purpose entity that in turn sells undivided participation interests in the accounts receivable to certain purchasers, who finance their purchases through the issuance of short-term commercial paper. The securitization facility has a one year term. During the financial crisis that began in 2008, the market for commercial paper experienced significant volatility. Although we have been able to renew our securitization facility annually, there can be no assurance that we will continue to be able to renew this facility in the future on terms acceptable to us.
A significant rise in fuel prices could cause our accounts receivable to increase beyond the capacity of the securitization facility. There can be no assurance that the size of the facility can be expanded to meet these increased working capital needs. Further, we may not be able to fund such increases in accounts receivable with our available cash resources. Our inability to meet working capital needs could adversely affect our financial condition and business, including our relationships with merchants, customers and partners. Further, we are exposed to the risk of increased interest rates because our borrowings under the securitization facility are subject to variable rates of interest.
16
Table of Contents
Index to Financial Statements
We are subject to risks related to volatility in foreign currency exchange rates, and restrictions on our ability to utilize revenue generated in foreign currencies.
As a result of our foreign operations, we are subject to risks related to changes in currency rates for revenue generated in currencies other than the U.S. dollar. For the year ended December 31, 2009 and the nine months ended September 30, 2010, approximately 36.0% and 33.0% of our revenue, respectively, was denominated in currencies other than the U.S. dollar (primarily Czech koruna and British pound). Revenue and profit generated by international operations may increase or decrease compared to prior periods as a result of changes in foreign currency exchange rates. Resulting exchange gains and losses are included in our net income. Volatility in foreign currency exchange rates may materially adversely affect our operating results and financial condition.
Furthermore, we are subject to exchange control regulations that restrict or prohibit the conversion of more than a specified amount of our foreign currencies into U.S. dollars, and, as we expand, we may become subject to further exchange control regulations that limit our ability to freely utilize and transfer currency in and out of particular jurisdictions. These restrictions may make it more difficult to effectively utilize the cash generated by our operations and may adversely effect our financial condition.
We conduct a significant portion of our business in foreign countries and we expect to expand our operations into additional foreign countries where we may be adversely affected by operational and political risks that are greater than in the United States.
We have foreign operations in, or provide services in, Belarus, Belgium, Canada, the Czech Republic, Estonia, Ireland, Latvia, Lithuania, Luxembourg, the Netherlands, Pakistan, Poland, the Russian Federation, Slovakia, South Africa, Ukraine and the United Kingdom. We also expect to seek to expand our operations into various countries in Asia, Europe and Latin America as part of our growth strategy.
Some of the countries where we operate, and other countries where we will seek to operate, have undergone significant political, economic and social change in recent years, and the risk of unforeseen changes in these countries may be greater than in the United States. In particular, changes in laws or regulations, including with respect to taxation, information technology, data transmission and the Internet, or in the interpretation of existing laws or regulations, whether caused by a change in government or otherwise, could materially adversely affect our business, operating results and financial condition. In addition, conducting and expanding our international operations subjects us to other risks that we do not generally face in the United States. These include:
| • | difficulties in managing the staffing of our international operations, including hiring and retaining qualified employees; |
| • | increased expense related to localization of our products and services, including language translation and the creation of localized agreements; |
| • | potentially adverse tax consequences, including the complexities of foreign value added tax systems, restrictions on the repatriation of earnings and changes in tax rates; |
| • | increased expense to comply with foreign laws and legal standards, including laws that regulate pricing and promotion activities and the import and export of information technology, which can be difficult to monitor and are often subject to change; |
| • | increased expense to comply with U.S. laws that apply to foreign operations, including the Foreign Corrupt Practices Act and Office of Foreign Assets Control regulations; |
| • | longer accounts receivable payment cycles and difficulties in collecting accounts receivable; |
| • | increased financial accounting and reporting burdens and complexities; |
17
Table of Contents
Index to Financial Statements
| • | political, social and economic instability; |
| • | terrorist attacks and security concerns in general; and |
| • | reduced or varied protection for intellectual property rights and cultural norms in some geographies that are simply not respectful of intellectual property rights. |
The occurrence of one or more of these events could negatively affect our international operations and, consequently, our operating results. Further, operating in international markets requires significant management attention and financial resources. Due to the additional uncertainties and risks of doing business in foreign jurisdictions, international acquisitions tend to entail risks and require additional oversight and management attention that are typically not attendant to acquisitions made within the United States. We cannot be certain that the investment and additional resources required to establish, acquire or integrate operations in other countries will produce desired levels of revenue or profitability.
We are dependent on technology systems and electronic communications networks managed by third parties, which could result in our inability to prevent disruptions in our services.
Our ability to process and authorize transactions electronically depends on our ability to communicate with our fuel, lodging and vehicle maintenance providers electronically through point-of-sale devices and electronic networks that are owned and operated by third parties. In addition, in order to process transactions promptly, our computer equipment and network servers must be functional 24 hours a day, which requires access to telecommunications facilities managed by third-parties and the availability of electricity, which we do not control. A severe disruption of one or more of these networks, including as a result of utility or third-party system interruptions, could impair our ability to authorize transactions and process information, which could harm our reputation, result in a loss of customers or partners and adversely affect our business and operating results.
We also utilize third-party providers to assist us with disaster recovery operations. As a result, we are subject to the risk of a provider’s unresponsiveness in the event of a significant breakdown in our computer equipment or networks. Furthermore, our property and business interruption insurance may not be adequate to compensate us for all losses or failures that may occur.
We may experience software defects, system errors, computer viruses and development delays, which could damage customer relations, decrease our profitability and expose us to liability.
Our products and services are based on proprietary and third-party network technology and processing systems that may encounter development delays and could be susceptible to undetected errors, viruses or defects. Development delays, system errors, viruses or defects that result in service interruption or data loss could have a material adverse effect on our business, damage our reputation and subject us to third-party liability. In addition, errors, viruses and defects in our network technology and processing systems could result in additional development costs and the diversion of our technical and other resources from other development efforts or operations. Further, our attempts to limit our potential liability, through disclaimers and limitation-of-liability provisions in our agreements, may not be successful.
We may incur substantial losses due to fraudulent use of our fleet cards.
Under certain circumstances, when we fund customer transactions, we may bear the risk of substantial losses due to fraudulent use of our fleet cards. We do not maintain any insurance to protect us against any such losses.
18
Table of Contents
Index to Financial Statements
We may not be able to adequately protect the data we collect about our customers and partners, which could subject us to liability and damage our reputation.
We electronically receive, process, store and transmit our customers’ and partners’ sensitive information, including bank account information and expense data. We keep this information confidential; however, our websites, networks, information systems, services and technologies may be targeted for sabotage, disruption or misappropriation. Unauthorized access to our networks and computer systems could result in the theft or publication of confidential information or the deletion or modification of records or could otherwise cause interruptions in our service and operations.
Because techniques used to obtain unauthorized access or to sabotage systems change frequently and may not be recognized until launched against a target, we may be unable to anticipate these techniques or to implement adequate preventative measures. Although we believe we have sufficient controls in place to prevent disruption and misappropriation and to respond to such attacks, any inability to prevent security breaches could have a negative impact on our reputation, expose us to liability, decrease market acceptance of electronic transactions and cause our present and potential clients to choose another service provider. Any of these developments could have a material adverse effect on our business, operating results and financial condition.
We expect to expand through acquisitions, which may divert our management’s attention and result in unexpected operating difficulties, increased costs and dilution to our stockholders. We also may never realize the anticipated benefits of the acquisitions.
We have been an active business acquirer both in the United States and internationally, and, as part of our growth strategy, we expect to seek to acquire businesses, commercial account portfolios, technologies, services and products in the future. We have substantially expanded our overall business, customer base, headcount and operations both domestically and internationally through acquisitions. The acquisition and integration of each business involves a number of risks and may result in unforeseen operating difficulties and expenditures in assimilating or integrating the businesses, technologies, products, personnel or operations of the acquired business. Furthermore, future acquisitions may:
| • | involve our entry into geographic or business markets in which we have little or no prior experience; |
| • | involve difficulties in retaining the customers of the acquired business; |
| • | result in a delay or reduction of sales for both us and the business we acquire; and |
| • | disrupt our ongoing business, divert our resources and require significant management attention that would otherwise be available for ongoing development of our current business. |
In addition, international acquisitions often involve additional or increased risks including, for example:
| • | difficulty managing geographically separated organizations, systems and facilities; |
| • | difficulty integrating personnel with diverse business backgrounds and organizational cultures; |
| • | increased expense to comply with foreign regulatory requirements applicable to acquisitions; |
| • | difficulty entering new foreign markets due to, among other things, lack of customer acceptance and a lack of business knowledge of these new markets; and |
| • | political, social and economic instability. |
19
Table of Contents
Index to Financial Statements
To complete a future acquisition, we may determine that it is necessary to use a substantial amount of our cash or engage in equity or debt financing. If we raise additional funds through further issuances of equity or convertible debt securities, our existing stockholders could suffer significant dilution, and any new equity securities we issue could have rights, preferences and privileges senior to those of holders of our common stock. Any debt financing obtained by us in the future could involve restrictive covenants relating to our capital-raising activities and other financial and operational matters that make it more difficult for us to obtain additional capital in the future and to pursue other business opportunities, including potential acquisitions. In addition, we may not be able to obtain additional financing on terms favorable to us, if at all, which could limit our ability to engage in acquisitions. Moreover, we can make no assurances that the anticipated benefits of any acquisition, such as operating improvements or anticipated cost savings, would be realized or that we would not be exposed to unexpected liabilities in connection with any acquisition.
Further, an acquisition may negatively affect our operating results because it may require us to incur charges and substantial debt or other liabilities, may cause adverse tax consequences, substantial depreciation and amortization or deferred compensation charges, may require the amortization, write-down or impairment of amounts related to deferred compensation, goodwill and other intangible assets, or may not generate sufficient financial return to offset acquisition costs.
The market for fleet-card services is evolving and may not continue to develop or grow.
Our fleet-card businesses rely on the acceptance and use of payment cards by businesses to purchase fuel for their vehicle fleets. If the use of fleet cards by businesses does not continue to grow, it could have a material adverse effect on our business, operating results and financial condition. In order to consistently increase and maintain our profitability, businesses and partners must continue to adopt our services. Similarly, growth in the acceptance and use of fleet cards will be impacted by the acceptance and use of electronic payment transactions generally. Furthermore, new technologies may displace fleet cards as payment mechanisms for fuel purchase transactions. A decline in the acceptance and use of fleet cards, and electronic payment transactions generally, by businesses and merchants could have a material adverse effect on our business, operating results and financial condition. The market for our lodging cards is also evolving and that portion of our business is subject to similar risks.
Our balance sheet includes significant amounts of goodwill and intangible assets. The impairment of a significant portion of these assets would negatively affect our financial results.
Our balance sheet includes goodwill and intangible assets that represent approximately 52% of our total assets at September 30, 2010. These assets consist primarily of goodwill and identified intangible assets associated with our acquisitions. We also expect to engage in additional acquisitions, which may result in our recognition of additional goodwill and intangible assets. Under current accounting standards, we are required to amortize certain intangible assets over the useful life of the asset, while goodwill is not amortized. On at least an annual basis, we assess whether there have been impairments in the carrying value of goodwill and intangible assets. If the carrying value of the asset is determined to be impaired, then it is written down to fair value by a charge to operating earnings. An impairment of a significant portion of goodwill or intangible assets could materially negatively affect our operating results and financial condition.
If we are unable to protect our intellectual property rights and confidential information, our competitive position could be harmed and we could be required to incur significant expenses in order to enforce our rights.
To protect our proprietary technology, we rely on copyright, trade secret and other intellectual property laws and confidentiality agreements with employees and third parties, all of which offer only limited protection. Despite
20
Table of Contents
Index to Financial Statements
our precautions, it may be possible for third parties to obtain and use without consent confidential information or infringe on our intellectual property rights, and our ability to police that misappropriation or infringement is uncertain, particularly in countries outside of the United States. In addition, our confidentiality agreements with employees, vendors, customers and other third parties may not effectively prevent disclosure or use of proprietary technology or confidential information and may not provide an adequate remedy in the event of such unauthorized use or disclosure.
Protecting against the unauthorized use of our intellectual property and confidential information is expensive, difficult and not always possible. Litigation may be necessary in the future to enforce or defend our intellectual property rights, to protect our confidential information, including trade secrets, or to determine the validity and scope of the proprietary rights of others. This litigation could be costly and divert management resources, either of which could harm our business, operating results and financial condition. Accordingly, despite our efforts, we may not be able to prevent third parties from infringing upon or misappropriating our intellectual property and proprietary information.
We cannot be certain that the steps we have taken will prevent the unauthorized use or the reverse engineering of our proprietary technology. Moreover, others may independently develop technologies that are competitive to ours or infringe our intellectual property. The enforcement of our intellectual property rights also depends on our legal actions against these infringers being successful, and we cannot be sure these actions will be successful, even when our rights have been infringed. Furthermore, effective patent, trademark, service mark, copyright and trade secret protection may not be available in every country in which we may offer our products and services.
Claims by others that we or our customers infringe their intellectual property rights could harm our business.
Third parties could claim that our technologies and processes underlying our products and services infringe their intellectual property. In addition, to the extent that we gain greater visibility and market exposure as a public company, we may face a higher risk of being the target of intellectual property infringement claims asserted by third parties. We may, in the future, receive notices alleging that we have misappropriated or infringed a third party’s intellectual property rights. There may be third-party intellectual property rights, including patents and pending patent applications, that cover significant aspects of our technologies, processes or business methods. Any claims of infringement or misappropriation by a third party, even those without merit, could cause us to incur substantial defense costs and could distract our management from our business, and there can be no assurance that we will be able to prevail against such claims. Some of our competitors may have the capability to dedicate substantially greater resources to enforcing their intellectual property rights and to defending claims that may be brought against them than we do. Furthermore, a party making such a claim, if successful, could secure a judgment that requires us to pay substantial damages, potentially including treble damages if we are found to have willfully infringed a patent. A judgment could also include an injunction or other court order that could prevent us from offering our products and services. In addition, we might be required to seek a license for the use of a third party’s intellectual property, which may not be available on commercially reasonable terms or at all. Alternatively, we might be required to develop non-infringing technology, which could require significant effort and expense and might ultimately not be successful.
Third parties may also assert infringement claims against our customers relating to their use of our technologies or processes. Any of these claims might require us to defend potentially protracted and costly litigation on their behalf, regardless of the merits of these claims, because under certain conditions we agree to indemnify our customers from third-party claims of intellectual property infringement. If any of these claims succeed, we might be forced to pay damages on behalf of our customers, which could adversely affect our business, operating results and financial condition.
21
Table of Contents
Index to Financial Statements
Our success is dependent, in part, upon our executive officers and other key personnel, and the loss of key personnel could materially adversely affect our business.
Our success depends, in part, on our executive officers and other key personnel. Our senior management team has significant industry experience and would be difficult to replace. The market for qualified individuals is competitive, and we may not be able to attract and retain qualified personnel or candidates to replace or succeed members of our senior management team or other key personnel. The loss of key personnel could materially adversely affect our business.
Changes in laws, regulations and enforcement activities may adversely affect our products and services and the markets in which we operate.
The electronic payments industry is subject to increasing regulation in the United States and internationally. Domestic and foreign government regulations impose compliance obligations on us and restrictions on our operating activities, which can be difficult to administer because of their scope, mandates and varied requirements. We are subject to a number of government regulations, including, among others: interest rate and fee restrictions; credit access and disclosure requirements; collection and pricing regulations; compliance obligations; security and data breach requirements; identity theft avoidance programs; and anti-money laundering compliance programs. Government regulations can also include licensing or registration requirements. While a large portion of these regulations focuses on individual consumer protection, legislatures continue to consider whether to include business consumers within the scope of these regulations. As a result, new or expanded regulation focusing on business cardholders or changes in interpretation or enforcement of regulations may have an adverse effect on our business and operating results, due to increased compliance costs and new restrictions affecting the terms under which we offer our products and services. In addition, we have structured our business in accordance with existing tax laws and interpretations, including those related to state occupancy taxes, value added taxes in foreign jurisdictions and restrictions on repatriation of funds or transfers of revenue between jurisdictions. Changes in tax laws or their interpretations could increase our tax liability, further limit our utilization of funds located in foreign jurisdictions and have a material adverse effect on our business and financial condition.
We generate a portion of our revenue from our lodging card business, which is affected by conditions in the hotel industry generally and has a concentration of customers in the railroad and trucking industries.
Revenue from our lodging card business, which we acquired on April 1, 2009, equaled $37.1 million of our consolidated revenue for the year ended December 31, 2009. Our lodging card business earns revenue from customers purchasing lodging from the hotel industry and derives a significant portion of this revenue from end users in the railroad and trucking industries. Therefore, we are exposed to risks affecting each of these industries. For example, unfavorable economic conditions adversely impacting the hotel, railroad and trucking industries generally could cause a decrease in demand for our products and services in our lodging card business, resulting in decreased revenue. In addition, mergers or consolidations in these industries could reduce our customer and partnership base, resulting in a smaller market for our products and services.
We contract with government entities and are subject to risks related to our governmental contracts.
In the course of our business we contract with government entities, including state and local government fleet customers, as well as federal government agencies. As a result, we are subject to various laws and regulations that apply to companies doing business with federal, state and local governments. The laws relating to government contracts differ from other commercial contracting laws and our government contracts may contain
22
Table of Contents
Index to Financial Statements
pricing terms and conditions that are not common among private contracts. In addition, we may be subject to investigation from time to time concerning our compliance with the laws and regulations relating to our government contracts. Our failure to comply with these laws and regulations may result in suspension of these contracts or administrative or other penalties.
Litigation and regulatory actions could subject us to significant fines, penalties or requirements resulting in increased expenses.
We are not currently party to any legal proceedings or governmental inquiries or investigations that we consider to be material. We are, however, subject to litigation from time to time in the ordinary course of our business, which if ultimately determined unfavorably could force us to pay damages or fines, or change our business practices, any of which could have a material adverse effect on our operating results. In addition, we may become involved in various actions or proceedings brought by domestic and foreign governmental regulatory agencies in the event of alleged noncompliance with laws or regulations, which could potentially subject us to significant fines, penalties or other requirements resulting in increased expenses or restricting the conduct of our business. We are currently involved in such an investigation by the Office of Fair Trading in the United Kingdom, relating to our Keyfuels product line. This product line consists of our proprietary payment card and associated site network in the United Kingdom. A competitor alleged we are dominant in a relevant market with our Keyfuels product line. The Office of Fair Trading is investigating whether we are dominant and, if dominant, whether some of our contracts with some sites and dealers would constitute exclusive dealings requiring them to be reformed to eliminate exclusivity. Although we do not currently anticipate an adverse result or material adverse impact from the investigation, if determined adversely, the regulator has authority to require us to reform contracts to eliminate exclusivity and impose significant fines.
We rely on third parties for card issuing and processing services supporting our MasterCard network fleet card products. Failure to maintain these contractual relationships upon acceptable terms would have an adverse effect on our MasterCard network fleet card offerings, customer retention and operating results.
Some of our fleet-card products in North America are accepted in the MasterCard merchant network pursuant to our contractual relationships with two issuing banks and two third-party processors. In order to continue offering fleet cards accepted at MasterCard network merchants, we must maintain our contractual relationship with at least one issuing bank. Further, unless we develop our own MasterCard-approved processing capabilities, we must continue to obtain processing services from at least one processor approved by MasterCard with the capability to provide acceptable levels of reporting data for fleet operators. Generally, these contracts have remaining terms of between three and five years and automatically renew from year to year unless either party provides notice of termination; however, one of the two issuing banks has provided us with notice that it does not intend to automatically renew our agreement when it expires in 2012. Approximately 1.4% of our 2009 revenue and 2.3% of our revenue for the nine months ended September 30, 2010, respectively, was associated with this issuing bank. We intend to replace this issuing bank if satisfactory arrangements to renew the contract are not concluded and we believe an alternative issuing bank can be found; however, our failure to maintain these relationships, or find suitable alternatives, could have an adverse effect on our MasterCard network fleet card products, our customer retention and our operating results.
Changes in MasterCard interchange fees could decrease our revenue.
A portion of our revenue is generated by network processing fees charged to merchants, known as interchange fees, associated with transactions processed using our MasterCard-branded fleet cards. Interchange fee amounts associated with our MasterCard network fleet cards are affected by a number of factors, including regulatory limits in the United States and Europe and fee changes imposed by MasterCard. In addition, interchange fees are
23
Table of Contents
Index to Financial Statements
the subject of intense legal and regulatory scrutiny and competitive pressures in the electronic payments industry, which could result in lower interchange fees generally in the future. Temporary or permanent decreases in the interchange fees associated with our MasterCard network fleet-card transactions, could adversely affect our business and operating results.
If we are not able to maintain and enhance our brands, it could adversely affect our business, operating results and financial condition.
We believe that maintaining and enhancing our brands is critical to our customer relationships, and our ability to obtain partners and retain employees. The successful promotion of our brands will depend upon our marketing and public relations efforts, our ability to continue to offer high-quality products and services and our ability to successfully differentiate our services from those of our competitors. In addition, future extension of our brands to add new products or services different from our current offerings may dilute our brands, particularly if we fail to maintain our quality standards in these new areas. The promotion of our brands will require us to make substantial expenditures, and we anticipate that the expenditures will increase as our markets become more competitive and we expand into new markets. To the extent that these activities yield increased revenue, this revenue may not offset the expenses we incur. There can be no assurance that our brand promotion activities will be successful.
Failure to comply with the United States Foreign Corrupt Practices Act, and similar laws associated with our international activities, could subject us to penalties and other adverse consequences.
As we continue to expand our business internationally, we may expand into certain foreign countries, particularly those with developing economies, where companies often engage in business practices that are prohibited by U.S. regulations, including the United States Foreign Corrupt Practices Act, or the FCPA. Such laws prohibit improper payments or offers of payments to foreign governments and their officials and political parties by U.S. and other business entities for the purpose of obtaining or retaining business. We have implemented policies to discourage such practices; however, there can be no assurances that all of our employees, consultants and agents, including those that may be based in or from countries where practices that violate U.S. laws may be customary, will not take actions in violation of our policies, for which we may be ultimately responsible. Violations of the FCPA may result in severe criminal or civil sanctions and suspension or debarment from U.S. government contracting, which could negatively affect our business, operating results and financial condition.
Risks related to this offering and ownership of our common stock
Our stock price will likely be volatile and your investment could decline in value.
The market price of our common stock following this offering may fluctuate substantially as a result of many factors, some of which are beyond our control. These fluctuations could cause you to lose all or part of the value of your investment in our common stock. Factors that could cause fluctuations in the market price of our common stock include the following:
| • | quarterly variations in our results of operations; |
| • | results of operations that vary from the expectations of securities analysts and investors; |
| • | results of operations that vary from those of our competitors; |
| • | changes in expectations as to our future financial performance, including financial estimates by securities analysts and investors; |
| • | announcements by us or our competitors of significant contracts, acquisitions, or capital commitments; |
24
Table of Contents
Index to Financial Statements
| • | announcements by third parties of significant claims or proceedings against us; |
| • | regulatory developments in the United States and abroad; |
| • | future sales of our common stock, and additions or departures of key personnel; and |
| • | general domestic and international economic, market and currency factors and conditions unrelated to our performance. |
In addition, the stock market in general has experienced significant price and volume fluctuations that have often been unrelated or disproportionate to operating performance of individual companies. These broad market factors may seriously harm the market price of our common stock, regardless of our operating performance. In the past, following periods of volatility in the market price of a company’s securities, securities class action litigation has often been instituted. A securities class action suit against us could result in significant liabilities and, regardless of the outcome, could result in substantial costs and the diversion of our management’s attention and resources.
Our common stock has no prior market and our stock price may decline after the offering.
Before this offering, there has been no public market for shares of our common stock. Although our common stock has been approved for listing on the New York Stock Exchange, subject to official notice of issuance, an active trading market for our common stock may not develop or, if it develops, may not be sustained after this offering. Our company and the representatives of the underwriters will negotiate to determine the initial public offering price. The initial public offering price may be higher than the market price of our common stock after the offering and you may not be able to sell your shares of our common stock at or above the price you paid in the offering. As a result, you could lose all or part of your investment.
Our principal stockholders will have a controlling influence over our business affairs and may make business decisions with which you disagree and which may adversely affect the value of your investment.
After this offering, it is anticipated that our principal stockholders and their affiliates will beneficially own or control, directly or indirectly, 53,366,451 shares of our common stock, which in the aggregate will represent approximately 66% of the outstanding shares of our common stock. As a result, if some of these persons or entities act together, they will have the ability to exercise significant influence over matters submitted to our stockholders for approval, including the election and removal of directors, amendments to our certificate of incorporation and bylaws and the approval of any business combination. These actions may be taken even if they are opposed by other stockholders. This concentration of ownership may also have the effect of delaying or preventing a change of control of our company or discouraging others from making tender offers for our shares, which could prevent our stockholders from receiving a premium for their shares.
Some of these persons or entities who make up our principal stockholders may have interests different from yours. For example, because many of these stockholders purchased their shares at prices substantially below the price at which shares are being sold in this offering and have held their shares for a relatively longer period, they may be more interested in selling FleetCor to an acquirer than other stockholders or may want us to pursue strategies that deviate from the interests of other stockholders.
Investors purchasing common stock in this offering will experience immediate and substantial dilution.
The initial public offering price of shares of our common stock is substantially higher than the net tangible book value per outstanding share of our common stock. You will incur immediate and substantial dilution of $19.27 per share in the net tangible book value of shares of our common stock, based on an assumed initial public offering
25
Table of Contents
Index to Financial Statements
price of $24.50, the midpoint of the range set forth on the cover of this prospectus. In addition, we have outstanding options with exercise prices significantly below the initial public offering price. To the extent outstanding options are ultimately exercised, there will be further dilution of the common stock sold in this offering.
Future sales, or the perception of future sales, of a substantial amount of our common shares could depress the trading price of our common stock.
If we or our stockholders sell substantial amounts of our shares of common stock in the public market following this offering or if the market perceives that these sales could occur, the market price of shares of our common stock could decline. These sales may make it more difficult for us to sell equity or equity-related securities in the future at a time and price that we deem appropriate, or to use equity as consideration for future acquisitions.
Upon completion of this offering, we will have 475 million shares of common stock authorized and 78,719,146 shares of common stock outstanding. Of these shares, the 12,675,000 shares to be sold in this offering will be freely tradable. Before the sale of any shares to be sold in this offering, we, our executive officers and directors, and the selling stockholders and other stockholders (subject to certain limited exceptions) will have entered into agreements with the underwriters not to sell or otherwise dispose of shares of our common stock for a period of at least 180 days following completion of this offering, with certain exceptions. Immediately upon the expiration of this lock-up period, 15,647,786 shares will be freely tradable pursuant to Rule 144 under the Securities Act of 1933 by non-affiliates and another 50,396,360 shares will be eligible for resale pursuant to Rule 144 under the Securities Act of 1933, subject to the volume, manner of sale and other limitations of Rule 144.
Our failure to maintain effective internal control over financial reporting could adversely affect our business, operating results and financial condition.
Beginning with our annual report for the year ended December 31, 2011, Section 404 of the Sarbanes-Oxley Act of 2002, or Section 404, will require us to include a report by our management on our internal control over financial reporting. This report must contain an assessment by management of the effectiveness of our internal control over financial reporting as of the end of the year and a statement as to whether or not our internal controls are effective. Our annual report for the year ended December 31, 2011 must also contain a statement that our independent registered public accounting firm has issued an attestation report on our internal control over financial reporting.
In order to achieve timely compliance with Section 404, we have begun a process to document and evaluate our internal control over financial reporting. Our efforts to comply with Section 404 have resulted in, and are likely to continue to result in, significant costs, the commitment of time and operational resources and the diversion of management’s attention. Even if we develop effective controls, such controls may become inadequate because of changes in conditions, and the degree of compliance with the policies or procedures may deteriorate. If our management identifies one or more material weaknesses in our internal control over financial reporting, we will be unable to assert that our internal control over financial reporting is effective. If we are unable to assert that our internal control over financial reporting is effective, or if our independent registered public accounting firm is unable to express an unqualified opinion that we have maintained effective internal control over financial reporting, market perception of our financial condition and the market price of our stock may be adversely affected, we could be subject to sanctions or investigations by the New York Stock Exchange, the Securities and Exchange Commission (the SEC) or other regulatory authorities, and customer perception of our business may suffer.
Furthermore, implementing any appropriate changes to our internal control over financial reporting may entail substantial costs to modify our existing accounting systems, may take a significant period of time to complete and
26
Table of Contents
Index to Financial Statements
may distract our officers, directors and employees from the operation of our business. These changes, however, may not be effective in maintaining the adequacy of our internal control over financial reporting, and any failure to maintain that adequacy, or consequent inability to produce accurate financial statements on a timely basis, could increase our operating costs and could adversely affect our business, operating results and financial condition.
Our disclosure controls and procedures may not prevent or detect all errors or acts of fraud.
Upon completion of this offering, we will become subject to the periodic reporting requirements of the Securities Exchange Act of 1934, as amended, or the Exchange Act. Our disclosure controls and procedures are designed to reasonably ensure that information required to be disclosed by us in reports we file or submit under the Exchange Act is accumulated and communicated to management and recorded, processed, summarized and reported within the time periods specified in the rules and forms of the Securities and Exchange Commission. We believe that any disclosure controls and procedures or internal controls and procedures, no matter how well conceived and operated, can provide only reasonable, not absolute, assurance that the objectives of the control system are and will be met. These inherent limitations include the realities that judgments in decision-making can be faulty and that breakdowns can occur because of simple error or mistake. Additionally, controls can be circumvented by the individual acts of some persons, by collusion of two or more people or by an unauthorized override of the controls. Accordingly, because of the inherent limitations in our control system, misstatements due to error or fraud may occur and not be detected.
We will incur significantly increased costs as a result of operating as a public company, and our management will be required to devote substantial time to compliance efforts.
As a public company, we will incur significant legal, accounting and other expenses that we did not incur as a private company. The Sarbanes-Oxley Act of 2002 and rules subsequently implemented by the Securities and Exchange Commission and the New York Stock Exchange impose additional requirements on public companies, including enhanced corporate governance practices. For example, the listing requirements for the New York Stock Exchange provide that listed companies satisfy certain corporate governance requirements relating to independent directors, audit committees, stockholder meetings, stockholder approvals, solicitation of proxies, conflicts of interest, stockholder voting rights and codes of business conduct. Our management and other personnel will need to devote a substantial amount of time and resources in complying with these requirements. Moreover, these rules and regulations will increase our legal and financial compliance costs and will make some activities more time-consuming and costly, although we are currently unable to estimate these costs with any degree of certainty. These rules and regulations could also make it more difficult for us to attract and retain qualified persons to serve on our board of directors and board committees or as executive officers and more expensive for us to obtain director and officer liability insurance.
Anti-takeover provisions in our charter documents could discourage, delay or prevent a change in control of our company and may affect the trading price of our common stock.
Our corporate documents, to be effective immediately before this offering, and the Delaware General Corporation Law contain provisions that may enable our board of directors to resist a change in control of FleetCor even if a change in control were to be considered favorable by you and other stockholders. These provisions:
| • | stagger the terms of our board of directors and require supermajority stockholder voting to remove directors; |
| • | authorize our board of directors to issue preferred stock and to determine the rights and preferences of those shares, which may be senior to our common stock, without prior stockholder approval; |
27
Table of Contents
Index to Financial Statements
| • | establish advance notice requirements for nominating directors and proposing matters to be voted on by stockholders at stockholder meetings; |
| • | prohibit our stockholders from calling a special meeting and prohibit stockholders from acting by written consent; and |
| • | require supermajority stockholder voting to effect certain amendments to our certificate of incorporation and bylaws. |
In addition, our certificate of incorporation will prohibit large stockholders, in particular those owning 15% or more of our outstanding voting stock, from merging or consolidating with us except under certain circumstances. These provisions could discourage, delay or prevent a transaction involving a change in control of FleetCor. These provisions could also discourage proxy contests and make it more difficult for you and other stockholders to elect directors of your choosing and cause us to take other corporate actions you desire.
We do not expect to pay any dividends on our common stock for the foreseeable future.
We currently expect to retain all future earnings, if any, for future operation, expansion and debt repayment and have no current plans to pay any cash dividends to holders of our common stock for the foreseeable future. Any decision to declare and pay dividends in the future will be made at the discretion of our board of directors and will depend on, among other things, our operating results, financial condition, cash requirements, contractual restrictions and other factors that our board of directors may deem relevant. In addition, we must comply with the covenants in our credit agreements in order to be able to pay cash dividends, and our ability to pay dividends generally may be further limited by covenants of any existing and future outstanding indebtedness we or our subsidiaries incur. As a result, you may not receive any return on an investment in our common stock unless you sell our common stock for a price greater than that which you paid for it.
28
Table of Contents
Index to Financial Statements
Special note regarding forward-looking statements
This prospectus contains statements that express our opinions, expectations, beliefs, plans, objectives, assumptions or projections regarding future events or future results, in contrast with statements that reflect historical facts. Many of these statements are contained under the headings “Prospectus summary,” “Management’s discussion and analysis of financial condition and results of operations” and “Business.” In some cases, we have identified such forward-looking statements with typical conditional words such as “anticipate,” “intend,” “believe,” “estimate,” “plan,” “seek,” “project” or “expect,” “may,” “will,” “would,” “could” or “should,” the negative of these terms or other comparable terminology.
These forward-looking statements are not a guarantee of performance, and you should not place undue reliance on such statements. We have based these forward-looking statements largely on our current expectations and projections about future events. Forward-looking statements are subject to many uncertainties and other variable circumstances, including those discussed in this prospectus under the headings “Risk factors” and “Management’s discussion and analysis of financial condition and results of operations,” many of which are outside of our control, that could cause our actual results and experience to differ materially from any forward-looking statement. Given these risks and uncertainties, you are cautioned not to place undue reliance on these forward-looking statements. The forward-looking statements included in this prospectus are made only as of the date hereof. We do not undertake, and specifically decline, any obligation to update any such statements or to publicly announce the results of any revisions to any of such statements to reflect future events or developments.
29
Table of Contents
Index to Financial Statements
We estimate that the net proceeds we will receive from the sale of 430,961 shares of our common stock in this offering, after deducting underwriting discounts and other offering expenses payable by us, will be approximately $6.3 million. This estimate assumes an initial public offering price of $24.50 per share, the mid-point of the range set forth on the cover page of this prospectus. A $1.00 increase (decrease) in the assumed initial public offering price of $24.50 per share would increase (decrease) the net proceeds to us from this offering by $0.4 million, assuming the number of shares offered by us, as set forth on the cover page of this prospectus, remains the same and after deducting the estimated underwriting discounts and other offering expenses payable by us. We will not receive any proceeds from the sale of shares of our common stock by the selling stockholders, which include members of our senior management (including any shares sold by the selling stockholders pursuant to the underwriters’ option to purchase additional shares), although we will receive the exercise price in respect of any options to purchase shares of common stock that are exercised by selling stockholders in connection with this offering. See “Principal and selling stockholders” for more information.
We intend to use approximately $3.1 million of the net proceeds from this offering to repay a portion of our existing term loan indebtedness under our 2005 Credit Facility, as further described under “Description of indebtedness—2005 Credit Facility.” As of September 30, 2010, we had $274.0 million in outstanding term loans under the 2005 Credit Facility, which bears interest at LIBOR plus 2.25% (2.5% at September 30, 2010) and matures in April 2013. In addition, we intend to use the remaining net proceeds for working capital and other general corporate purposes.
30
Table of Contents
Index to Financial Statements
We currently expect to retain all future earnings, if any, for use in the operation and expansion of our business. We have never declared or paid any dividends on our common stock and do not anticipate paying cash dividends to holders of our common stock in the foreseeable future. In addition, our credit agreements restrict our ability to pay dividends. Any determination to pay dividends in the future will be at the discretion of our board of directors and will depend upon, among other factors, our results of operations, financial condition, capital requirements and covenants in our existing financing arrangements and any future financing arrangements.
Pursuant to the terms of our Series D-3 preferred stock, accumulated and unpaid dividends on the Series D-3 convertible preferred stock, in an aggregate amount of approximately $7.3 million as of September 30, 2010, become payable in cash upon the automatic conversion of the Series D-3 convertible preferred stock into common stock in connection with this offering. The actual amount of this dividend will differ based on the actual closing date of this offering.
31
Table of Contents
Index to Financial Statements
The following table sets forth our cash and cash equivalents and our capitalization as of September 30, 2010:
| • | on an actual basis; |
| • | on a pro forma basis to give effect to (1) the automatic conversion of all of the outstanding shares of our convertible preferred stock into 43,575,148 shares of our common stock immediately prior to the closing of this offering, (2) a two and one-half-for-one stock split of shares of our common stock effected on November 29, 2010, (3) the amendment and restatement of our certificate of incorporation in connection with this offering, (4) the payment of three-eighths of the cumulative dividend on the Series D-3 convertible preferred stock, aggregating $7.3 million and (5) compensation expense of approximately $14.1 million related to 1,631,805 shares of restricted stock which will vest upon the closing of this offering (assuming an initial public offering price of $24.50 per share, which is the midpoint of the estimated price range set forth on the cover page of this prospectus); and |
| • | on a pro forma as adjusted basis to give further effect to (1) the sale by us of 430,961 shares of common stock in this offering at an assumed initial public offering price of $24.50 per share, which is the midpoint of the estimated price range set forth on the cover page of this prospectus, after deducting the estimated underwriting discounts and commissions and other offering expenses payable by us, (2) the exercise of 587,874 fully vested stock options by selling stockholders, our receipt of $3.5 million representing the aggregate exercise price of such options and the sale of the option shares in this offering and (3) the repayment of an estimated $3.1 million of outstanding term loans under the 2005 Credit Facility with a portion of the net proceeds of this offering. |
You should read the following information together with the information contained in “Selected consolidated financial data,” “Management’s discussion and analysis of financial condition and results of operations” and our consolidated financial statements and the accompanying notes appearing elsewhere in this prospectus.
| As of September 30, 2010 | ||||||||||||
| (dollars in thousands) | Actual | Pro forma | Pro forma as adjusted (1) |
|||||||||
| (unaudited) | (unaudited) | |||||||||||
| Cash and cash equivalents (excluding restricted cash) |
$ | 110,773 | $ | 103,462 | $ | 110,127 | ||||||
| Total debt (including current portion): |
||||||||||||
| Term note payable—domestic |
274,000 | 274,000 | 270,862 | |||||||||
| Term note payable—foreign |
59,209 | 59,209 | 59,209 | |||||||||
| Other debt |
168,117 | 168,117 | 168,117 | |||||||||
| Total debt |
501,326 | 501,326 | 498,188 | |||||||||
| Convertible preferred stock, par value $0.001 per share: 1,919,135 shares authorized and issued and 1,668,449 shares outstanding, actual, and no shares authorized, issued and outstanding, pro forma and pro forma as adjusted, for Series D-1; 230,769 shares authorized and issued and 201,923 shares outstanding, actual, and no shares authorized, issued and outstanding, pro forma and pro forma as adjusted, for Series D-2; 3,995,413 shares authorized, issued and outstanding, actual, and no shares authorized, issued and outstanding, pro forma and pro forma as adjusted, for Series D-3; 8,164,281 shares authorized, issued and outstanding, actual, and no shares authorized, issued and outstanding, pro forma and pro forma as adjusted, for Series D-4; and 3,400,000 shares authorized, issued and outstanding, actual, and no shares authorized, issued and outstanding, pro forma and pro forma as adjusted, for Series E (aggregate liquidation preference of $409,996) |
344,018 | — | — | |||||||||
32
Table of Contents
Index to Financial Statements
| As of September 30, 2010 | ||||||||||||
| (dollars in thousands) | Actual | Pro forma | Pro forma as adjusted (1) |
|||||||||
| (unaudited) | (unaudited) | |||||||||||
| Preferred stock, par value $0.001 per share: 1,000,000 shares authorized, no shares issued or outstanding, actual; 25,000,000 shares authorized, no shares issued or outstanding, pro forma and pro forma as adjusted |
— | — | — | |||||||||
| Common stock, par value $0.001 per share: 52,000,000 shares authorized, 26,416,540 shares issued and 13,650,069 outstanding, actual; 475,000,000 shares authorized, pro forma and pro forma as adjusted 109,616,490 shares issued and 77,700,311 shares outstanding, pro forma; 110,047,451 shares issued and 78,131,272 shares outstanding, pro forma as adjusted |
26 | 110 | 110 | |||||||||
| Additional paid-in capital |
97,968 | 387,100 | 396,903 | |||||||||
| Retained earnings |
312,742 | 360,233 | 360,233 | |||||||||
| Accumulated other comprehensive loss |
(7,605 | ) | (7,605 | ) | (7,605 | ) | ||||||
| Treasury stock 12,766,471 shares, actual; 31,916,179 shares, pro forma and pro forma as adjusted |
(175,220 | ) | (175,220 | ) | (175,220 | ) | ||||||
| Total stockholders’ equity |
571,929 | 564,618 | 574,421 | |||||||||
| Total capitalization |
$ | 1,073,255 | $ | 1,065,944 | $ | 1,072,609 | ||||||
| (1) | A $1.00 increase (decrease) in the assumed initial public offering price of $24.50, which is the mid-point of the estimated price range set forth on the cover page of this prospectus, would increase (decrease) each of the amount of cash and cash equivalents, additional paid-in capital, total stockholders’ equity and total capitalization by approximately $0.4 million, assuming the number of shares offered, as set forth on the cover page of this prospectus, remains the same and after deducting the estimated underwriting discounts and commissions and other offering expenses payable by us. The pro forma information discussed above is illustrative only and following the closing of this offering will be adjusted based on the actual initial public offering price and other terms of this offering determined at pricing. |
The table above excludes:
| • | as of September 30, 2010, 7,348,344 shares of common stock issuable upon the exercise of outstanding stock options at a weighted-average exercise price of $8.11 per share (which amount excludes 587,874 shares in respect of options to be exercised by selling stockholders in connection with this offering); and |
| • | 6,750,000 shares of common stock reserved for future issuance under our 2010 Equity Compensation Plan. |
33
Table of Contents
Index to Financial Statements
If you invest in shares of our common stock, your interest will be diluted to the extent of the difference between the initial public offering price per share of our common stock and the net tangible book value per share of our common stock upon the closing of this offering. Pro forma net tangible book value per share of common stock is determined by dividing the number of outstanding shares of common stock, after giving effect to (1) a two and one-half-for-one split of shares of our common stock effected on November 29, 2010 and (2) the automatic conversion of all outstanding shares of our convertible preferred stock into common stock immediately prior to the closing of this offering into the net tangible book value attributable to our common stock, which is our total tangible assets less our total liabilities. After giving further effect to (1) the payment of accrued dividends on our Series D-3 convertible preferred stock, which are payable in connection with the conversion of such preferred stock into common stock, (2) the sale of shares of our common stock by us in this offering at an assumed initial public offering price of $24.50 per share, the midpoint of the range set forth on the cover page of this prospectus, and after deducting the estimated underwriting discounts and commissions and other offering expenses payable by us, (3) the repayment of an estimated $3.1 million of outstanding term loans under the 2005 Credit Facility with a portion of the net proceeds of this offering and (4) the exercise of 587,874 fully vested stock options by selling stockholders, our receipt of $3.5 million representing the aggregate exercise price of such options and the sale of the option shares in this offering, the adjusted pro forma net tangible book value attributable to shares of our common stock as of September 30, 2010 would have been approximately $573.9 million, or $5.23 per share. This represents an immediate increase in pro forma net tangible book value of $0.07 per share to the holders of our existing common stock and an immediate dilution of $19.27 per share to new investors purchasing shares of common stock at the initial public offering price.
The following table illustrates this per share dilution:
| Assumed initial public offering price per share |
$ | 24.50 | ||||||
| Pro forma net tangible book value per share as of September 30, 2010 |
$ | 5.16 | ||||||
| Increase in pro forma net tangible book value per share attributable to investors purchasing shares in this offering |
.03 | |||||||
| Increase in pro forma net tangible book value per share in connection with exercise of and sale of fully vested stock options by selling stockholders in this offering |
.04 | |||||||
| Adjusted pro forma net tangible book value per share after this offering |
5.23 | |||||||
| Dilution in net tangible book value per share to new investors |
$ | 19.27 | ||||||
A $1.00 increase (decrease) in the assumed initial public offering price of $24.50, which is the mid-point of the estimated price range set forth on the cover page of this prospectus, would increase (decrease): (1) our adjusted pro forma net tangible book value by $0.4 million; and (2) the dilution in net tangible book value per common share to new investors in this offering by $1.00, in each case, assuming that the number of shares offered by us, as set forth on the cover page of this prospectus, remains the same and after deducting the estimated underwriting discounts and commissions and other offering expenses payable by us.
34
Table of Contents
Index to Financial Statements
The following table sets forth, as of September 30, 2010, the differences between the number of shares of common stock purchased from us, after giving effect to (i) a two and one-half for one stock split of shares of our common stock effected on November 29, 2010, (ii) the conversion of our convertible preferred stock into common stock, (iii) the total price paid and average price per share paid by existing stockholders and by the new investors in this offering at an assumed initial public offering price of $24.50 per shares and (iv) the exercise and sale of fully vested stock options by selling stockholders in this offering.
| Shares purchased | Total consideration | Average price per share |
||||||||||||||||||
| Number | Percent | Amount | Percent | |||||||||||||||||
| Existing shares |
78,288,185 | 99.4% | $ | 386,454,455 | 97.3% | $ | 4.94 | |||||||||||||
| New shares |
430,961 | .6 | 10,558,545 | 2.7 | 24.50 | |||||||||||||||
| Total |
78,719,146 | 100% | $ | 397,013,000 | 100% | $ | 5.04 | |||||||||||||
A $1.00 increase (decrease) in the assumed initial public offering price of $24.50, which is the mid-point of the estimated price range set forth on the cover page of this prospectus, would increase (decrease) total consideration paid by new investors by approximately $0.4 million and would have no impact on the total average price per share, respectively, assuming the number of shares offered, as set forth on the cover page of this prospectus, remains the same.
If the underwriters’ exercise their option to purchase up to 1,901,250 additional shares in full, the following will occur:
| • | the number of existing shares of common stock will represent 99.4% of the total number of shares of our common stock outstanding after this offering; and |
| • | the number of new shares will represent approximately 0.6% of the total number of shares of our common stock outstanding after this offering. |
The foregoing discussion and tables assume no exercise of stock options to purchase 7,348,344 shares of our common stock issuable upon the exercise of stock options outstanding as of September 30, 2010, at a weighted average exercise price of $8.11 per share, other than the exercise of 587,874 options by selling stockholders in connection with this offering. To the extent that any options are exercised, new investors will experience further dilution.
35
Table of Contents
Index to Financial Statements
Unaudited pro forma condensed consolidated
financial information
On April 1, 2009, FleetCor entered into an acquisition agreement to acquire all of the outstanding stock of CLC Group, Inc, and subsidiaries which we refer to in this prospectus as the CLC Acquisition. The total consideration for this acquisition was $169.1 million, consisting of cash paid of $161.1 million and the issuance of $8 million of our Series E convertible preferred stock.
The unaudited pro forma condensed consolidated statement of income for the year ended December 31, 2009 has been derived from the application of pro forma adjustments to our historical audited consolidated financial statements for the year ended December 31, 2009 and CLC Group, Inc. and subsidiaries’ unaudited financial statements for the quarter ended March 31, 2009 and gives effect to the CLC Acquisition as if it occurred on January 1, 2009. The unaudited pro forma condensed consolidated statement of income for the nine months ended September 30, 2009 has been derived from the application of pro forma adjustments to our historical unaudited consolidated financial statements for the nine months ended September 30, 2009 and CLC Group, Inc. and subsidiaries’ unaudited financial statements for the quarter ended March 31, 2009 and gives effect to the CLC Acquisition as if it occurred on January 1, 2009. Our operating results for all periods subsequent to March 31, 2009 reflect the impact of the CLC Acquisition. The acquisition was accounted for as a purchase in accordance with the authoritative guidance related to business combinations. We have not included pro forma balance sheet information because our consolidated balance sheet, as of December 31, 2009, reflects the effect of the CLC Acquisition.
The unaudited pro forma condensed consolidated statement of income does not purport to represent what our results of operations would have been if the CLC Acquisition had occurred on January 1, 2009 and are not intended to project our results of operations for any future period. The unaudited pro forma adjustments are based on estimates, available information and certain assumptions that we believe are reasonable and may be revised as additional information becomes available. The pro forma adjustments and principal assumptions are described in the accompanying notes. You should read this table together with the discussion under the headings “Selected consolidated financial data” and “Management’s discussion and analysis of financial condition and results of operations” and CLC Group, Inc. and subsidiaries consolidated financial statements and the related notes included elsewhere in this prospectus.
36
Table of Contents
Index to Financial Statements
FleetCor Technologies, Inc.
Unaudited pro forma condensed consolidated statement of income
Year ended December 31, 2009
(in thousands, except share data)
| FleetCor Technologies, Inc. |
CLC Group, Inc. and subsidiaries January 1, 2009 through March 31, 2009 |
Acquisition adjustments |
Pro forma | |||||||||||||
| Revenues, net |
$ | 354,073 | $ | 16,308 | $ | — | $ | 370,381 | ||||||||
| Operating expenses |
179,660 | 7,187 | — | 186,847 | ||||||||||||
| 174,413 | 9,121 | — | 183,534 | |||||||||||||
| Depreciation and amortization |
28,368 | 790 | 469 | (a) | 29,627 | |||||||||||
| Operating income |
146,045 | 8,331 | (469 | ) | 153,907 | |||||||||||
| Other (income) expense, net |
(933 | ) | 132 | — | (801 | ) | ||||||||||
| Interest expense, net |
17,363 | 253 | — | 17,616 | ||||||||||||
| Total other expense |
16,430 | 385 | — | 16,815 | ||||||||||||
| Income before income taxes |
129,615 | 7,946 | (469 | ) | 137,092 | |||||||||||
| Provision for income taxes |
40,563 | 3,266 | (150 | )(b) | 43,679 | |||||||||||
| Net income |
$ | 89,052 | $ | 4,680 | $ | (319 | ) | $ | 93,413 | |||||||
| Pro forma earnings per share(c): |
||||||||||||||||
| Basic |
$ | 2.33 | ||||||||||||||
| Diluted |
1.15 | |||||||||||||||
| Basic weighted average shares outstanding |
33,802 | |||||||||||||||
| Diluted weighted average shares outstanding |
80,979 | |||||||||||||||
| (a) | Represents additional amortization of intangible assets recorded in connection with the purchase price allocation of the CLC Acquisition computed as follows: |
| Amortization of intangible assets based on purchase price allocation |
$ | 1,069 | ||
| Amortization of intangible assets included in CLC Group, Inc. and subsidiaries’ historical financial statements |
600 | |||
| Additional amortization expense |
$ | 469 | ||
| (b) | Represents a reduction in the provision for income taxes for the additional amortization expense recorded that related to intangible assets in connection with the CLC Group, Inc. and subsidiaries’ purchase price allocation. |
| (c) | Pro forma basic and diluted earnings per share give effect to the two and one-half-for-one stock split effected on November 29, 2010. |
37
Table of Contents
Index to Financial Statements
FleetCor Technologies, Inc.
Unaudited pro forma condensed consolidated statement of income
Nine months ended September 30, 2009
(in thousands, except share data)
| FleetCor Technologies, Inc. |
CLC Group, Inc. and subsidiaries(a) |
Acquisition adjustments |
Pro forma | |||||||||||||
| Revenues, net |
$ | 256,761 | $ | 16,308 | $ | — | $ | 273,069 | ||||||||
| Operating expenses |
131,680 | 7,187 | — | 138,867 | ||||||||||||
| 125,081 | 9,121 | — | 134,202 | |||||||||||||
| Depreciation and amortization |
20,235 | 790 | 469 | 21,494 | ||||||||||||
| Operating income |
104,846 | 8,331 | (469 | )(b) | 112,708 | |||||||||||
| Other (income) expense, net |
(369 | ) | 132 | — | (237 | ) | ||||||||||
| Interest expense, net |
13,023 | 253 | — | 13,276 | ||||||||||||
| Total other expense |
12,654 | 385 | — | 13,039 | ||||||||||||
| Income before income taxes |
92,192 | 7,946 | (469 | ) | 99,669 | |||||||||||
| Provision for income taxes |
28,088 | 3,266 | (150 | )(c) | 31,204 | |||||||||||
| Net income |
$ | 64,104 | $ | 4,680 | $ | (319 | ) | $ | 68,465 | |||||||
| Pro forma earnings per share(d): |
||||||||||||||||
| Basic |
$ | 1.57 | ||||||||||||||
| Diluted |
.85 | |||||||||||||||
| Basic weighted average shares outstanding |
33,775 | |||||||||||||||
| Diluted weighted average shares outstanding |
80,780 | |||||||||||||||
| (a) | Represents CLC Group, Inc. and subsidiaries unaudited financial statements for the quarter ended March 31, 2009. Our operating results for all periods subsequent to March 31, 2009 reflect the impact of the CLC Acquisition. |
| (b) | Represents additional amortization of intangible assets recorded in connection with the purchase price allocation of the CLC Acquisition computed as follows: |
| Amortization of intangible assets based on purchase price allocation |
$ | 1,069 | ||
| Amortization of intangible assets included in CLC Group, Inc. and subsidiaries’ historical financial statements |
600 | |||
| Additional amortization expense |
$ | 469 | ||
| (c) | Represents a reduction in the provision for income taxes for the additional amortization expense recorded that related to intangible assets in connection with the CLC Group, Inc. and subsidiaries’ purchase price allocation. |
| (d) | Pro forma basic and diluted earnings per share give effect to the two and one-half-for-one stock split effected on November 29, 2010. |
38
Table of Contents
Index to Financial Statements
Selected consolidated financial data
We derived the consolidated statement of income and other financial data for the years ended December 31, 2009, 2008 and 2007 and the selected consolidated balance sheet data as of December 31, 2009 and 2008 from the audited consolidated financial statements included elsewhere in this prospectus. The consolidated statement of income data for the nine months ended September 30, 2010 and 2009 as well as the consolidated balance sheet data as of September 30, 2010 are derived from our unaudited consolidated financial statements that are included elsewhere in this prospectus. We derived the selected historical financial data for the years ended December 31, 2006 and 2005 and the selected consolidated balance sheets as of December 31, 2007, 2006 and 2005 from our audited consolidated financial statements that are not included in this prospectus.
The selected consolidated financial data set forth below should be read in conjunction with “Management’s discussion and analysis of financial condition and results of operations” and our audited consolidated financial statements and notes thereto included elsewhere in this prospectus. The unaudited consolidated financial statements include, in the opinion of management, all adjustments, which include only normal recurring adjustments, that management considers necessary for the fair presentation of the financial information set forth in those statements. Our historical results are not necessarily indicative of the results to be expected in any future period.
| (in thousands, except per share data) | Nine months ended September 30, |
Year ended December 31, | ||||||||||||||||||||||||||
| 2010 | 2009 | 2009 | 2008 | 2007 | 2006 | 2005 | ||||||||||||||||||||||
| (unaudited) | ||||||||||||||||||||||||||||
| Consolidated statement of income data(1): |
||||||||||||||||||||||||||||
| Revenues, net |
$ | 327,294 | $ | 256,761 | $ | 354,073 | $ | 341,053 | $ | 264,086 | $ | 186,209 | $ | 143,334 | ||||||||||||||
| Expenses: |
||||||||||||||||||||||||||||
| Merchant commissions |
39,549 | 28,860 | 39,709 | 38,539 | 39,358 | 32,784 | 24,247 | |||||||||||||||||||||
| Processing |
52,608 | 43,099 | 57,997 | 51,406 | 34,060 | 26,388 | 18,360 | |||||||||||||||||||||
| Selling |
23,155 | 21,470 | 30,579 | 23,778 | 22,625 | 19,464 | 13,740 | |||||||||||||||||||||
| General and administrative |
40,025 | 38,251 | 51,375 | 47,635 | 41,986 | 23,175 | 20,562 | |||||||||||||||||||||
| Depreciation and amortization |
25,238 | 20,235 | 28,368 | 27,240 | 20,293 | 12,571 | 7,448 | |||||||||||||||||||||
| Operating income |
146,719 | 104,846 | 146,045 | 152,455 | 105,764 | 71,827 | 58,977 | |||||||||||||||||||||
| Other, net |
(767 | ) | (369 | ) | (933 | ) | (2,488 | ) | (1,554 | ) | 39 | 1,997 | ||||||||||||||||
| Interest expense, net |
16,352 | 13,023 | 17,363 | 20,256 | 19,735 | 11,854 | 7,564 | |||||||||||||||||||||
| Total other expense |
15,585 | 12,654 | 16,430 | 17,768 | 18,181 | 11,893 | 9,561 | |||||||||||||||||||||
| Income before income taxes |
131,134 | 92,192 | 129,615 | 134,687 | 87,583 | 59,934 | 49,416 | |||||||||||||||||||||
| Provision for income taxes |
40,752 | 28,088 | 40,563 | 37,405 | 25,998 | 21,957 | 18,748 | |||||||||||||||||||||
| Net income |
$ | 90,382 | $ | 64,104 | $ | 89,052 | $ | 97,282 | $ | 61,585 | $ | 37,977 | $ | 30,668 | ||||||||||||||
| Pro forma earnings per share (unaudited)(2): |
||||||||||||||||||||||||||||
| Earnings per share, basic |
$ | .89 | $ | .78 | $ | 1.10 | $ | 1.36 | $ | .87 | $ | .58 | $ | .46 | ||||||||||||||
| Earnings per share, diluted |
.93 | .82 | 1.13 | 1.35 | .86 | .57 | .44 | |||||||||||||||||||||
| Weighted average shares outstanding, basic |
77,600 | 74,548 | 75,253 | 68,108 | 67,271 | 61,892 | 65,812 | |||||||||||||||||||||
| Weighted average shares outstanding, diluted |
82,045 | 77,978 | 78,854 | 71,913 | 71,720 | 66,660 | 69,852 | |||||||||||||||||||||
39
Table of Contents
Index to Financial Statements
| (in thousands) | As of September 30, | As of December 31, | ||||||||||||||||||||||
| 2010 | 2009 | 2008 | 2007 | 2006 | 2005 | |||||||||||||||||||
| Consolidated balance sheet data: |
||||||||||||||||||||||||
| Cash and cash equivalents(3) |
$ 110,773 | $ | 84,701 | $ | 70,355 | $ | 68,864 | $ | 18,191 | $ | — | |||||||||||||
| Restricted cash(3)(4) |
65,927 | 67,979 | 71,222 | 76,797 | 64,016 | — | ||||||||||||||||||
| Total assets |
1,503,527 | 1,209,545 | 929,062 | 875,106 | 657,925 | 266,359 | ||||||||||||||||||
| Total debt |
501,326 | 351,551 | 370,747 | 341,851 | 255,032 | 127,543 | ||||||||||||||||||
| Total stockholders’ equity |
571,929 | 474,049 | 273,264 | 192,009 | 158,482 | 58,179 | ||||||||||||||||||
| (1) | In June 2009, the Financial Accounting Standards Board, or FASB, issued authoritative guidance limiting the circumstances in which a financial asset may be derecognized when the transferor has not transferred the entire financial asset or has continuing involvement with the transferred asset. This guidance was effective for us as of January 1, 2010. As a result of the adoption of such guidance, effective January 1, 2010, our statements of income will no longer include securitization activities in revenue. Rather, we will report interest income, provision for bad debts and interest expense associated with the debt securities issued from our securitization facility. |
| (2) | Pro forma to give effect to (1) the conversion of all outstanding shares of our convertible preferred stock into 43,575,148 shares of our common stock immediately prior to the completion of this offering, (2) the forgiveness of all cumulative dividends except for a portion of the dividends related to Series D-3 convertible preferred stock where holders will receive cash dividends of approximately $7.3 million on our convertible preferred stock calculated as of September 30, 2010, (3) a two and one-half-for-one stock split of shares of our common stock effected on November 29, 2010 offering and (4) compensation expense of approximately $14.1 million related to 1,631,805 shares of restricted stock which will vest upon the closing of this offering (assuming the price to the public is at the midpoint of the estimated price range set forth on the cover page of this prospectus). |
| (3) | No cash and cash equivalents were maintained at December 31, 2005 due to a negative cash balance, which was classified as accounts payable. Further, there was no restricted cash at December 31, 2005 as restricted cash relates to acquisitions we made in 2006. |
| (4) | Restricted cash represents customer deposits repayable on demand. |
40
Table of Contents
Index to Financial Statements
Management’s discussion and analysis of financial condition
and results of operations
The following discussion and analysis of our financial condition and results of operations should be read in conjunction with the consolidated financial statements and related notes appearing elsewhere in this prospectus. In addition to historical information, this discussion contains forward-looking statements that involve risks, uncertainties and assumptions that could cause actual results to differ materially from management’s expectations. Factors that could cause such differences include, but are not limited to, those identified below and those described in “Risk factors” appearing elsewhere in this prospectus. All foreign currency amounts that have been converted into U.S. dollars in this discussion are based on the exchange rate as reported by OANDA for the applicable periods. In this prospectus, when we refer to consolidated revenue, the provision for bad debts and interest expense on a “managed basis”, in each case, for the periods between January 1, 2005 and December 31, 2009, such amounts have been adjusted for the impact of the new accounting guidance related to our securitization facility as further discussed below. For the periods prior to January 1, 2005, we did not maintain a securitization facility. The term “managed basis” is used throughout “Management’s discussion and analysis of financial condition and results of operations”.
Overview
FleetCor is a leading independent global provider of specialized payment products and services to commercial fleets, major oil companies and petroleum marketers. We serve more than 530,000 commercial accounts in 18 countries in North America, Europe, Africa and Asia, and we had approximately 2.5 million commercial cards in use during the month of December 2009. Through our proprietary payment networks, our cards are accepted at approximately 83,000 locations in North America and internationally. In 2009, we processed approximately $14 billion in purchases on our proprietary networks and third-party networks. We believe that our size and scale, geographic reach, advanced technology and our expansive suite of products, services, brands and proprietary networks contribute to our leading industry position.
We provide our payment products and services in a variety of combinations to create customized payment solutions for our customers and partners. We sell these products and services directly and indirectly through partners with whom we have strategic relationships, such as major oil companies and petroleum marketers. We refer to these major oil companies and petroleum marketers as our “partners.” We provide our customers with various card products that typically function like a charge card to purchase fuel, lodging and related products and services at participating locations. Our payment programs enable businesses to better manage and control employee spending and provide card-accepting merchants with a high volume customer base that can increase their sales and customer loyalty.
In order to deliver our payment programs and services and process transactions, we own and operate six proprietary “closed-loop” networks through which we electronically connect to merchants and capture, analyze and report customized information. We also use third-party networks to deliver our payment programs and services in order to broaden our card acceptance and use. To support our payment products, we also provide a range of services, such as issuing and processing, as well as specialized information services that provide our customers with value-added functionality and data. Our customers can use this data to track important business productivity metrics, combat fraud and employee misuse, streamline expense administration and lower overall fleet operating costs.
FleetCor’s predecessor company was organized in the United States in 1986. In 2000, our current chief executive officer joined us and we changed our name to FleetCor Technologies, Inc. Since 2000, we have grown significantly through a combination of organic initiatives, product and service innovation and over 40
41
Table of Contents
Index to Financial Statements
acquisitions of businesses and commercial account portfolios. We have grown our revenue from $30.7 million in 2001 to $381.3 million on a managed basis in 2009, representing a compound annual growth rate of 37.0%. In 2009, we generated 35.8% of our revenue from our international operations, compared to none in 2005. In addition, we have grown our net income from a net loss of $12.6 million in 2000 to net income of $89.1 million in 2009. Our corporate headquarters are located in Norcross, Georgia. As of December 31, 2009, we employed approximately 1,130 employees, approximately 650 of whom were located in the United States.
Our segments, sources of revenue and expenses
Segments
We operate in two segments, which we refer to as our North American and International segments. Our revenue is reported net of the wholesale cost for underlying products and services. In this prospectus, we refer to this net revenue as “revenue.” For the years ended December 31, 2009, 2008, 2007 and 2006, and the nine months ended September 30, 2010 and 2009, our North American and International segments generated the following revenue:
| Nine months ended September 30, | Year ended December 31, | |||||||||||||||||||||||||||||||||||||||||||||||
| 2010 | 2009 | 2009 | 2008 | 2007 | 2006 | |||||||||||||||||||||||||||||||||||||||||||
| (dollars in millions) | Revenue |
% of total revenue |
Revenue | % of total revenue |
Revenue | % of total revenue |
Revenue | % of total revenue |
Revenue | % of total revenue |
Revenue | % of total revenue |
||||||||||||||||||||||||||||||||||||
| North America |
$219.4 | 67.0% | $ | 167.0 | 65.0% | $ | 227.4 | 64.2% | $ | 205.5 | 60.2% | $ | 161.4 | 61.1% | $ | 169.6 | 91.1% | |||||||||||||||||||||||||||||||
| International |
107.9 | 33.0% | 89.8 | 35.0% | 126.7 | 35.8% | 135.6 | 39.8% | 102.7 | 38.9% | 16.6 | 8.9% | ||||||||||||||||||||||||||||||||||||
| $327.3 | 100.0% | $ | 256.8 | 100.0% | $ | 354.1 | 100.0% | $ | 341.1 | 100.0% | $ | 264.1 | 100.0% | $ | 186.2 | 100.0% | ||||||||||||||||||||||||||||||||
For the years ended December 31, 2009, 2008, 2007 and 2006, and the nine months ended September 30, 2009, our consolidated revenues, net on a managed basis for our North American and International segments was as follows:
| Nine months ended September 30, |
Year ended December 31, | |||||||||||||||||||||||||||||||||||||||
| 2009 | 2009 | 2008 | 2007 | 2006 | ||||||||||||||||||||||||||||||||||||
| (dollars in millions) | Revenue | % of total revenue |
Revenue | % of total revenue |
Revenue | % of total revenue |
Revenue | % of total revenue |
Revenue | % of total revenue |
||||||||||||||||||||||||||||||
| North America |
$ | 188.4 | 67.7% | $ | 254.6 | 66.8% | $ | 248.7 | 64.7% | $ | 188.9 | 64.8% | $ | 193.1 | 92.1% | |||||||||||||||||||||||||
| International |
89.8 | 32.3% | 126.7 | 33.2% | 135.6 | 35.3% | 102.7 | 35.2% | 16.6 | 7.9% | ||||||||||||||||||||||||||||||
| $ | 278.2 | 100.0% | $ | 381.3 | 100.0% | $ | 384.3 | 100.0% | $ | 291.6 | 100.0% | $ | 209.7 | 100.0% | ||||||||||||||||||||||||||
Revenue, net on a managed basis for the twelve months ended September 30, 2010 aggregated $430.4 million. North American and International segment revenue, net on a managed basis for the twelve months ended September 30, 2010 aggregated $285.6 million and $144.8 million, respectively. Revenue, net for the twelve months ended September 30, 2010 represents revenue, net for the year ended December 31, 2009, minus revenue, net for the nine months ended September 30, 2009, plus revenue, net for the nine months ended September 30, 2010.
42
Table of Contents
Index to Financial Statements
Sources of Revenue
Transactions. In both of our segments, we derive revenue from transactions and the related revenue per transaction. As illustrated in the diagram below, a transaction is defined as a purchase by a customer. Our customers include holders of our card products and those of our partners, for whom we manage card programs. Revenue from transactions is derived from our merchant and network relationships as well as our customers and partners. Through our merchant and network relationships we primarily offer fuel, vehicle maintenance or lodging services to our customers. We also earn revenue from our customers and partners through program fees and charges. The following diagram illustrates a typical transaction flow.
Illustrative Transaction Flow
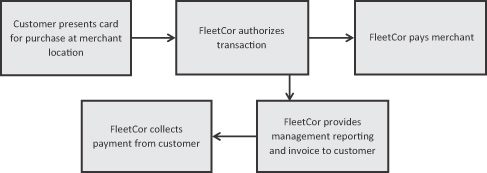
From our merchant and network relationships, we derive revenue from the difference between the price charged to a customer for a transaction and the price paid to the merchant or network for the same transaction. As illustrated in the table below, the price paid to a merchant or network may be calculated as (i) the merchant’s wholesale cost of fuel plus a markup; (ii) the transaction purchase price less a percentage discount; or (iii) the transaction purchase price less a fixed fee per unit. The difference between the price we pay to a merchant and the merchant’s wholesale cost for the underlying products and services is considered a “merchant commission” and is recognized as an expense. Approximately 46.0% and 45.0% of our revenue during 2009 and the first nine months of 2010, respectively, was derived from our merchant and network relationships.
Illustrative Revenue Model for Fuel Purchases
(unit of one gallon)
| Illustrative Revenue Model
|
|
Merchant Payment Methods
|
| |||||||||||||||||||||||||||||||
| Retail Price |
$ | 3.00 | i) Cost Plus Mark-up: | ii) Percentage Discount: | iii) Fixed Fee: | |||||||||||||||||||||||||||||
| Wholesale Cost |
(2.86 | ) | Wholesale Cost | $ | 2.86 | Retail Price | $ | 3.00 | Retail Price | $ | 3.00 | |||||||||||||||||||||||
| Mark-up | 0.05 | Discount (3%) | (0.09 | ) | Fixed Fee |
(0.09 | ) | |||||||||||||||||||||||||||
| FleetCor Revenue |
$ | 0.14 | ||||||||||||||||||||||||||||||||
| Merchant Commission |
$ | (0.05 | ) | Price Paid to Merchant | $ | 2.91 | Price Paid to Merchant | $ | 2.91 | Price Paid to Merchant | $ | 2.91 | ||||||||||||||||||||||
| Price Paid to Merchant |
$ | 2.91 | ||||||||||||||||||||||||||||||||
From our customers and partners, we derive revenue from a variety of program fees including transaction fees, card fees, network fees and report fees. Our payment programs include other fees and charges associated with late payments and based on customer credit risk. Approximately 54.0% and 55.0% of our revenue during 2009 and the first nine months of 2010, respectively, was derived from customer and partner program fees and charges.
43
Table of Contents
Index to Financial Statements
Transaction volume and revenue per transaction. Set forth below is revenue per transaction information for the years ended December 31, 2009, 2008 and 2007 and the nine months ended September 30, 2010 and 2009:
| Nine months ended September 30, |
Year ended December 31, | |||||||||||||||||||||||
| 2010 | 2009 | 2009 | 2008 | 2007 | 2006 | |||||||||||||||||||
| Transactions (in millions) |
||||||||||||||||||||||||
| North America |
111.0 | 107.2 | 143.4 | 149.5 | 130.0 | 142.0 | ||||||||||||||||||
| International |
36.4 | 36.8 | 50.5 | 39.9 | 28.4 | 3.5 | ||||||||||||||||||
| Total transactions |
147.4 | 144.0 | 193.9 | 189.4 | 158.4 | 145.5 | ||||||||||||||||||
| Revenue per transaction |
||||||||||||||||||||||||
| North America |
$ | 1.98 | $ | 1.56 | $ | 1.59 | $ | 1.37 | $ | 1.24 | $ | 1.19 | ||||||||||||
| International |
2.97 | 2.44 | 2.51 | 3.40 | 3.61 | 4.80 | ||||||||||||||||||
| Consolidated revenue per transaction |
2.22 | 1.78 | 1.83 | 1.80 | 1.67 | 1.28 | ||||||||||||||||||
| Managed consolidated revenue per transaction |
N/A | (1) | 1.93 | 1.97 | 2.02 | 1.84 | 1.45 | |||||||||||||||||
| (1) | As a result of the adoption of authoritative accounting guidance, effective January 1, 2010, our statements of income no longer include securitization activities in revenues and therefore this presentation is not applicable for this period. |
For the nine months ended September 30, 2010 compared to the same period in 2009, transaction volume increased from 144.0 million to 147.4 million, an increase of 3.4 million or 2.3%. We experienced an increase in transactions in our North American segment due to our acquisition of CLC Group, Inc. and subsidiaries in April 2009, and organic growth in certain payment programs. We experienced a decrease in transactions in our International segment due to the loss of a high transaction, low revenue contract, partially offset by organic growth in certain payment programs.
From 2008 to 2009 transactions increased from 189.3 million to 193.9 million, an increase of 4.6 million or 2.4%. We experienced a decrease in transactions in our North American segment due primarily to a reduction in transactions by existing customers that we believe was a result of the economic downturn, partially offset by our acquisition of CLC Group, Inc., in April 2009, and organic growth in certain payment programs. We experienced an increase in transactions in our International segment due to the full year impact of acquisitions completed in 2008 and new acquisitions in 2009. Transactions increased from 158.4 million in 2007 to 189.3 million in 2008, an increase of 30.9 million or 19.5%. The increase was due primarily to organic growth in the business and acquisitions in our International segment.
Revenue per transaction is derived from the various revenue types as discussed above and can vary based on geography, the relevant merchant relationship, the payment product utilized and the types of products or services purchased, the mix of which would be influenced by our acquisitions, organic growth in our business, and fluctuations in foreign currency exchange rates. Revenue per transaction per customer increases as the level of services we provide to a customer increases. The revenue per transaction in the International segment runs higher than the North America segment due primarily to higher margins and higher fuel prices in our international product lines. International revenue per transaction has decreased from 2007 to 2009 in part due to changes in foreign exchange rates and the impact of an acquisition completed in 2008 that carries a lower fee per transaction based on the relevant card products associated with this acquisition.
Our consolidated revenue per transaction increased from $1.85 in the nine months ended September 30, 2009 to $2.22 in the nine months ended September 30, 2010. The increase was primarily due to the following:
| • | during the nine months ended September 30, 2010, our total revenue increased by $21.4 million, or $0.08 per transaction, as a result of the adoption of authoritative accounting guidance related to our asset securitization facility as further discussed in “Note 2 – Summary of significant accounting policies”; |
44
Table of Contents
Index to Financial Statements
| • | acquisitions completed during 2009, which carried a higher rate per transaction due to the relevant card products associated with these acquisitions; |
| • | higher program fees and charges in certain payment programs; |
| • | the weakening of the U.S. dollar during the nine months ended September 30, 2010, relative to other foreign currencies, which resulted in favorable foreign exchange rates that increased our revenue per transaction; and |
| • | the loss of a high transaction, low revenue contract in our International segment. |
Our consolidated revenue per transaction increased from $1.80 in 2008 to $1.83 in 2009. During 2009, our consolidated revenue per transaction was positively impacted by:
| • | acquisitions completed during 2009, that carried a higher rate per transaction due to the relevant card products associated with these acquisitions; and |
| • | higher program fees and charges primarily resulting from the full-year impact of the implementation of a private label contract on our proprietary system. |
During 2009, our consolidated revenue per transaction was negatively impacted by a range of factors, including:
| • | the strengthening of the U.S. dollar during 2009, relative to other foreign currencies, which resulted in unfavorable foreign exchange rates that reduced our 2009 revenue per transaction; |
| • | the wholesale price of fuel decreased at a higher rate than the retail price of fuel during the second half of 2008 causing the margin between the wholesale cost of fuel and the retail price of fuel in 2008 to expand beyond historical levels. In 2009, fuel price spreads returned to historical levels; and |
| • | the average retail price of fuel in 2009 was significantly lower than the average retail price of fuel in 2008, which resulted in a decrease in our 2009 revenue per transaction. |
Our consolidated revenue per transaction increased from $1.67 in 2007 to $1.80 in 2008. During 2008, our revenue per transaction was positively impacted by:
| • | higher program fees and charges primarily resulting from the full-year impact of a private label contract and organic growth in our existing business; and |
| • | the wholesale price of fuel decreased at a higher rate than the retail price of fuel during the second half of 2008 causing the margin between the wholesale cost of fuel and the retail price of fuel in 2008 to expand beyond historical levels; |
| • | the average retail price of fuel in 2008 was significantly higher than the average retail price of fuel in 2007, which resulted in an increase in our 2008 revenue per transaction; and |
| • | the weakening of the U.S. dollar during 2008, relative to foreign currencies, which resulted in favorable foreign exchange rates that increased our 2008 consolidated revenue per transaction. |
During 2008, our consolidated revenue per transaction was negatively impacted by:
| • | an acquisition completed during 2008, that carried a lower rate per transaction due to the relevant card products associated with the acquisition. |
45
Table of Contents
Index to Financial Statements
Sources of expenses
We incur expenses in the following categories:
| • | Merchant commissions – We incur merchant commissions expenses when we reimburse merchants with whom we have direct, contractual relationships in respect of specific transactions in which a customer purchases products or services from the merchant. Merchant commission equals the difference between the price paid by us to the merchant and the merchant’s wholesale cost of the underlying products or services. |
| • | Processing – Our processing expense consists of expenses related to processing transactions, servicing our customers and merchants and bad debt expense related to non-securitized accounts receivable. |
| • | Selling – Our selling expenses consist primarily of wages, benefits, sales commissions (other than merchant commissions) and related expenses for our sales, marketing and account management personnel and activities. |
| • | General and administrative – Our general and administrative expenses include compensation and related expenses (including stock-based compensation) for our executive, finance and accounting, information technology, human resources, legal and other administrative personnel. Also included are facilities expenses, third-party professional services fees, travel and entertainment expenses, and other corporate-level expenses. |
| • | Depreciation and amortization – Our depreciation and amortization expenses include depreciation of property and equipment, consisting of computer hardware and software (including proprietary software development expense), card-reading equipment, furniture, fixtures, vehicles and buildings and leasehold improvements related to office space. Our amortization expenses include intangible assets related to customer and vendor relationships, tradenames and trademarks, non-compete agreements and software. We are amortizing intangible assets related to business acquisitions and certain private label contracts associated with the purchase of accounts receivable. |
| • | Other income, net – Other income, net includes foreign currency transaction gains or losses, revenue/costs from the sale of assets and other miscellaneous operating costs and revenue. |
| • | Interest expense, net – Interest expense, net includes interest income on our cash balances and interest expense on our outstanding debt and excludes interest on our securitization facility. We have historically invested our cash primarily in short-term money market funds. |
| • | Provision for income taxes – The provision for income taxes consists primarily of corporate income taxes related to profits resulting from the sale of our products and services in the United States and internationally. Our worldwide effective tax rate is lower than the U.S. statutory rate of 35%, due primarily to lower rates in foreign jurisdictions and foreign-sourced non-taxable income. |
Factors and trends impacting our business
We believe that the following factors and trends are important in understanding our financial performance:
| • | Fuel prices – Our fleet customers use our products and services primarily in connection with the purchase of fuel. Accordingly, our revenue is affected by fuel prices, which are subject to significant volatility. A change in retail fuel prices could cause a decrease or increase in our revenue from several sources, including fees paid to us based on a percentage of each customer’s total purchase. We believe that in 2009, approximately 19.1% of our consolidated revenue on a managed basis was directly influenced by the absolute price of fuel. Changes in the absolute price of fuel may also impact unpaid account balances and the late fees and charges based on these amounts. |
46
Table of Contents
Index to Financial Statements
| • | Fuel-price spread volatility – A portion of our revenue involves transactions where we derive revenue from fuel-price spreads, which is the difference between the price charged to a fleet customer for a transaction and the price paid to the merchant for the same transaction. In these transactions, the price paid to the merchant is based on the wholesale cost of fuel. The merchant’s wholesale cost of fuel is dependent on several factors including, among others, the factors described above affecting fuel prices. The fuel price that we charge to our customer is dependent on several factors including, among others, the fuel price paid to the merchant, posted retail fuel prices and competitive fuel prices. We experience fuel-price spread contraction when the merchant’s wholesale cost of fuel increases at a faster rate than the fuel price we charge to our customers, or the fuel price we charge to our customers decreases at a faster rate than the merchant’s wholesale cost of fuel. Approximately 18.6% of our consolidated revenue on a managed basis in 2009 was derived from transactions where our revenue is tied to fuel-price spreads. |
| • | Acquisitions – Since 2002, we have completed over 40 acquisitions of companies and commercial account portfolios. Acquisitions have been an important part of our growth strategy, and it is our intention to continue to seek opportunities to increase our customer base and diversify our service offering through further strategic acquisitions. The impact of acquisitions has, and may continue to have, a significant impact on our results of operations and may make it difficult to compare our results between periods. |
| • | Interest rates – Our results of operations are affected by interest rates. We are exposed to market risk changes in interest rates on our cash investments and debt. |
| • | Global economic downturn – Our results of operations are materially affected by conditions in the economy generally, both in North America and internationally. Factors affected by the economy include our transaction volumes and the credit risk of our customers. These factors affected our businesses in both our North American and International segments. |
| • | Foreign currency changes – Our results of operations are impacted by changes in foreign currency rates; namely, by movements of the British pound, the Czech koruna, the Russian rouble, the Canadian dollar and the Euro relative to the U.S. dollar. Approximately 64% of our revenue in 2009 was derived in U.S. dollars and was not affected by foreign currency exchange rates. |
| • | Expenses – In connection with being a public company and complying with the Sarbanes-Oxley Act of 2002, we expect our general and administrative expense to increase and then remain relatively constant or increase slightly as a percentage of revenue. Over the long term, we expect that our general and administrative expense will decrease as a percentage of revenue as our revenue increases. To support our expected revenue growth, we plan to continue to incur additional sales and marketing expense by investing in our direct marketing, third-party agents, internet marketing, telemarketing and field sales force. |
Accounts receivable securitization
We utilize an off-balance sheet securitization facility in the ordinary course of our business to finance a portion of our accounts receivable. Our off-balance sheet activity utilizes a qualified special-purpose entity, or QSPE, in the form of a limited liability company. The QSPE raises funds by issuing debt to third-party investors. The QSPE holds trade accounts receivable whose cash flows are the primary source of repayment for the liabilities of the QSPE. Investors only have recourse to the assets held by the QSPE. Our involvement in these arrangements takes the form of originating accounts receivable and providing servicing activities. Accounts receivable that we sell under the securitization facility are reported in our consolidated financial statements in accordance with relevant authoritative literature. Trade accounts receivable sold under this program are excluded from accounts receivable in our consolidated financial statements.
47
Table of Contents
Index to Financial Statements
In June 2009, the Financial Accounting Standards Board, or FASB, issued authoritative guidance limiting the circumstances in which a financial asset may be derecognized when the transferor has not transferred the entire financial asset or has continuing involvement with the transferred asset. The concept of a QSPE entity, which had previously facilitated sale accounting for certain asset transfers, is removed by this standard. This guidance was effective for us as of January 1, 2010. As a result of the adoption of such guidance, effective January 1, 2010, we consolidate the QSPE and the securitization of accounts receivable related to the QSPE are accounted for as a secured borrowing rather than as a sale. Accordingly, we record accounts receivable and short-term debt related to the securitization facilities as assets and liabilities on our balance sheet. In addition, our statements of income no longer includes securitization activities in revenue. Rather, we report provision for bad debts and interest expense associated with the debt securities issued by the QSPE.
As a result of the implementation of this guidance, at September 30, 2010, we had $167 million of accounts receivable and short-term debt on our balance sheet. See “Note 2 – Summary of significant accounting policies” to our consolidated financial statements included herein for further details.
Although bad debt and interest associated with our securitization facility were reported in revenue for the periods prior to January 1, 2010, we monitored these costs on a managed basis. The following table presents certain statement of income items adjusted for the impact of the new accounting guidance described above related to our securitization facility.
| (in millions) | Nine months ended September 30, |
Year
ended December 31, |
||||||||||||||||||||||||||||||||||||||||||||||
| 2009 | 2009 | 2008 | 2007 | |||||||||||||||||||||||||||||||||||||||||||||
| As reported |
Adjust- ments |
As |
As |
Adjust- ments |
As adjusted |
As reported |
Adjust- ments |
As adjusted |
As reported |
Adjust- ments |
As adjusted |
|||||||||||||||||||||||||||||||||||||
| Net revenue |
$256.8 | $21.4 | $278.2 | $ | 354.1 | $ | 27.2 | $ | 381.3 | $ | 341.1 | $ | 43.2 | $ | 384.3 | $ | 264.1 | $ | 27.5 | $ | 291.6 | |||||||||||||||||||||||||||
| Processing expense |
43.1 | 17.3 | 60.4 | 58.0 | 21.9 | 79.9 | 51.4 | 27.4 | 78.8 | 34.1 | 11.3 | 45.4 | ||||||||||||||||||||||||||||||||||||
| Interest expense, net |
13.0 | 4.1 | 17.1 | 17.4 | 5.3 | 22.7 | 20.3 | 15.8 | 36.1 | 19.7 | 16.2 | 35.9 | ||||||||||||||||||||||||||||||||||||
| (in millions) |
Year
ended December 31, |
|||||||||||||||||||||||||||||||||||||||||||||||
| 2006 | 2005 | |||||||||||||||||||||||||||||||||||||||||||||||
| As reported |
Adjust- ments |
As |
As reported |
Adjust- ments |
As adjusted |
|||||||||||||||||||||||||||||||||||||||||||
| Net revenue |
$186.2 | $23.5 | $209.7 | $ | 143.4 | $ | 16.6 | $ | 160.0 | |||||||||||||||||||||||||||||||||||||||
| Processing expense |
26.3 | 10.4 | 36.7 | 18.4 | 9.6 | 28.0 | ||||||||||||||||||||||||||||||||||||||||||
| Interest expense, net |
11.9 | 13.1 | 25.0 | 7.5 | 7.0 | 14.5 | ||||||||||||||||||||||||||||||||||||||||||
For periods prior to the year ended December 31, 2005, we did not maintain an asset securitization facility. Our revenue for the years ended December 31, 2004, 2003, 2002 and 2001 equaled $100.0 million, $72.6 million, $43.2 million and $30.7 million, respectively.
48
Table of Contents
Index to Financial Statements
Managed provision for bad debts as a percentage of gross billed revenue is as follows (dollar amounts in millions):
| Nine months ended September 30, |
Year
ended December 31, |
|||||||||||||||||||
| 2009 | 2009 | 2008 | 2007 | 2006 | ||||||||||||||||
| Provision for bad debt included in: |
||||||||||||||||||||
| Processing expense |
$ | 8.1 | $ | 10.7 | $ | 7.5 | $ | 3.7 | $ | 4.8 | ||||||||||
| Revenue, net |
17.3 | 21.9 | 27.4 | 11.3 | 10.4 | |||||||||||||||
| Managed provision for bad debts |
25.4 | 32.6 | 34.9 | 15.0 | 15.2 | |||||||||||||||
| Managed provision for bad debts as a percentage of gross billed revenue (1) |
0.62% | 0.56% | 0.43% | 0.36% | 0.43% | |||||||||||||||
| (1) | In this table, gross billed revenue represents revenue billed to customers, when our card products are utilized, for which we bear credit risk and includes the costs underlying the transaction (e.g. fuel and lodging). Gross billed revenue is calculated on a one quarter lag. For example, gross billed revenue for the year ended December 31, 2007 is calculated as gross billed revenue for the three months ended December 31, 2006 plus gross billed revenue for the nine month period from January 1, 2007 through September 30, 2007. We believe this calculation better matches our provision for bad debts with the related gross billed revenue. For the nine months ended September 30, 2010 the provision for bad debts was $15.1 million, or 0.30%, as a percentage of gross billed revenue. Managed provision for bad debts as a percentage of gross billed revenue for the quarters ended March 31, June 30, September 30, and December 31, 2009 was 0.74%, 0.73%, 0.40%, and 0.43%, respectively. Managed provision for bad debt as a percentage of gross billed revenue for the quarters ended March 31, June 30, and September 30, 2010 was 0.32%, 0.32%, and 0.27%, respectively. Managed provision for bad debts as a percentage of billed revenue for the period January 1, 2006 to December 31, 2008 was 0.41%. |
Acquisitions
During 2009, we acquired three companies the two largest of which are described below. The results of CLC Group, Inc. and its subsidiaries since the date of acquisition are included within our North American segment. The results of operations for the remaining acquisitions are included in our International segment from their respective dates of acquisition.
| • | In April 2009, we completed the acquisition of all of the outstanding stock of CLC Group, Inc., a provider of lodging management programs based in Wichita, Kansas, which we refer to as the CLC Acquisition in this prospectus. The aggregate purchase price was $169.1 million, $161.1 million paid in cash and $8.0 million paid in the form of our Series E convertible preferred stock. Through this acquisition, we entered the lodging payments business. The consolidated financial statements of CLC Group, Inc. and its subsidiaries for 2008 are included elsewhere in this prospectus and pro forma adjustments to our historical results of operations for the year ended December 31, 2009 and for the nine months ended September 30, 2009, to give effect to the CLC Acquisition as if it occurred on January 1, 2009, are included in this prospectus under the caption “Unaudited pro forma condensed consolidated financial information.” |
| • | In August 2009, we completed the acquisition of all of the outstanding shares of ReD Fuel Cards (Europe) Limited, a fleet card company based in the United Kingdom, which we refer to as the ReD Acquisition in this prospectus. The aggregate purchase price was $62.9 million (based on the exchange rate on the date of acquisition). As a result of this acquisition, we expanded our commercial fleet card offerings in the United Kingdom and Ireland. |
During 2008, we acquired four companies, the three largest of which are discussed below. The results of operations for these acquisitions are included in our International segment from their respective dates of acquisition.
| • | In March 2008, we completed the acquisition of all of the outstanding shares of Abbey Group (OXON) Limited, a fleet card company based in the United Kingdom, and affiliated entities, for an aggregate purchase price of $15.0 million (based on the exchange rate on the date of the acquisition). |
49
Table of Contents
Index to Financial Statements
| • | In June 2008, we completed the acquisition of all of the outstanding shares of ICP International Card Products B.V., or ICP, a payment transaction processing company based in the Netherlands, for an aggregate cash purchase price of $5.9 million (based on the exchange rate on the date of the acquisition). As a result of this acquisition, we expanded our processing services for major oil companies in Europe, Asia and Africa. |
| • | In July 2008, we completed the acquisition of all of the outstanding shares of Petrol Plus Region, an independent fuel card provider based in Russia, and an affiliated entity, for an aggregate purchase price of $49.0 million. As a result of this acquisition, we have become the leading independent fuel card company in Russia with additional operations in Poland, Lithuania, Latvia and Estonia. |
In April 2007, we completed the acquisition of all of the outstanding shares of Fambo UK Limited, a fuel card company based in the United Kingdom, for an aggregate purchase price of $34.3 million (based on the exchange rate on the date of the acquisition). The results of operations for this acquisition are included in the consolidated results of operations of our International segment from the date of acquisition.
Results of operations
Year ended December 31, 2009 compared to the year ended December 31, 2008
The following table sets forth selected consolidated statement of operations data for the years ended December 31, 2009 and 2008 (dollars in millions).
| Year ended December 31, 2009 |
% of total revenue |
Year ended December 31, 2008 |
% of total revenue |
Increase (decrease) |
% Change | |||||||||||||||||||
| Revenues, net: |
||||||||||||||||||||||||
| North America |
$ | 227.4 | 64% | $ | 205.5 | 60% | $ | 21.9 | 10.7 % | |||||||||||||||
| International |
126.7 | 36% | 135.6 | 40% | (8.9 | ) | (6.6)% | |||||||||||||||||
| Total revenues, net |
354.1 | 100% | 341.1 | 100% | 13.0 | 3.8 % | ||||||||||||||||||
| Consolidated operating expenses: |
||||||||||||||||||||||||
| Merchant commissions |
39.7 | 11% | 38.5 | 11% | 1.2 | 3.1 % | ||||||||||||||||||
| Processing |
58.0 | 16% | 51.4 | 15% | 6.6 | 12.8 % | ||||||||||||||||||
| Selling |
30.6 | 9% | 23.8 | 7% | 6.8 | 28.6 % | ||||||||||||||||||
| General and administrative |
51.4 | 15% | 47.6 | 14% | 3.8 | 8.0 % | ||||||||||||||||||
| Depreciation and amortization |
28.4 | 8% | 27.3 | 8% | 1.1 | 4.0 % | ||||||||||||||||||
| Operating income |
146.0 | 41% | 152.5 | 45% | (6.5 | ) | (4.3)% | |||||||||||||||||
| Other income, net |
(.9 | ) | 0% | (2.5 | ) | (1)% | 1.6 | (64.0)% | ||||||||||||||||
| Interest expense, net |
17.3 | 5% | 20.3 | 6% | (3.0 | ) | (14.8)% | |||||||||||||||||
| Provision for income taxes |
40.5 | 11% | 37.4 | 11% | 3.1 | 8.3 % | ||||||||||||||||||
| Net income |
$ | 89.1 | 25% | $ | 97.3 | 29% | $ | (8.2 | ) | (8.4)% | ||||||||||||||
| Operating income for segments: |
||||||||||||||||||||||||
| North America |
$ | 91.7 | 40% | $ | 88.3 | 43% | $ | 3.4 | 3.9 % | |||||||||||||||
| International |
54.3 | 43% | 64.2 | 47% | (9.9 | ) | (15.4)% | |||||||||||||||||
| Operating income |
$ | 146.0 | 41% | $ | 152.5 | 45% | $ | (6.5 | ) | (4.3)% | ||||||||||||||
| Operating margin for segments: |
||||||||||||||||||||||||
| North America |
40.3% | 43.0% | (2.5 | )% | ||||||||||||||||||||
| International |
42.9% | 47.3% | (4.4 | )% | ||||||||||||||||||||
50
Table of Contents
Index to Financial Statements
Revenue
Our consolidated revenue increased from $341.1 million in 2008 to $354.1 million in 2009, an increase of $13.0 million, or 3.8%. During 2009, our consolidated revenue was positively impacted by:
| • | acquisitions completed during 2009, which represented an aggregate of $45.5 million in revenue from their respective dates of acquisition; |
| • | acquisitions completed during 2008, which contributed an aggregate of $7.2 million in revenue in 2009 in excess of revenue recognized in 2008 (excluding the impact of foreign exchange rate fluctuations); and |
| • | higher program fees and charges from our existing customers, including the full-year impact of the implementation of a private label contract on our proprietary system, which contributed approximately $14.9 million of revenue year over year. |
During 2009, our consolidated revenue was negatively impacted by a range of factors, including:
| • | the strengthening of the U.S. dollar during 2009, relative to other foreign currencies, which resulted in unfavorable foreign exchange rates as compared to 2008 that reduced our revenue in 2009 by $18.1 million; |
| • | lower transaction volumes during 2009 due primarily to the impact of the economic downturn; |
| • | a decrease in the wholesale price of fuel at a higher rate than the retail price of fuel during the second half of 2008, causing the margin between the wholesale cost of fuel and the retail price of fuel to expand beyond historical levels. We believe the differential contributed incremental revenue of approximately $9 million in 2008 relative to revenue in 2009. Fuel-price spread margins returned to more historical levels in 2009; and |
| • | the average retail price of fuel was lower in 2009 as compared to 2008. We believe that the lower average retail price of fuel in 2009 reduced revenue by approximately $10 million. |
North American segment revenue
North American revenue increased from $205.5 million in 2008 to $227.4 million in 2009, an increase of $21.9 million, or 10.7%. The increase in our North American revenue was due primarily to:
| • | the impact of nine months of revenue following the CLC Acquisition in April 2009, the results of which were reported in our results of operations from the date of acquisition and represented $37.1 million in revenue; |
| • | the loss on sales of receivables to the securitization facility, which on a managed basis represents interest on the securitization facility and bad debt expense on the securitized accounts receivable, decreased from $43.2 million in 2008 to $27.2 million in 2009, resulting in a lower adjustment to revenue of $16.0 million in 2009 versus 2008; and |
| • | $14.9 million in higher program fees and charges from our existing customers, including the full-year impact of the implementation of a private label contract on our proprietary system. |
The increase in North American revenue was primarily offset by:
| • | a decrease in the wholesale price of fuel at a higher rate than the retail price of fuel during the second half of 2008, causing the margin between the wholesale cost of fuel and the retail price of fuel to expand beyond historical levels. We believe the differential contributed incremental revenue of approximately $9 million in 2008 relative to revenue in 2009. Fuel-price spread margins returned to more historical levels in 2009; |
| • | the average retail price of fuel was lower in 2009 as compared to 2008. We believe that the lower average retail price of fuel in 2009 reduced revenue by approximately $10 million; and |
51
Table of Contents
Index to Financial Statements
| • | lower transaction volumes, which we believe resulted from the economic downturn. |
International segment revenue
International segment revenue decreased from $135.6 million in 2008 to $126.7 million in 2009, a decrease of $8.9 million, or 6.6%. The decrease in International segment revenue was due primarily to the following:
| • | the strengthening of the U.S. dollar during 2009, relative to foreign currencies, which resulted in unfavorable foreign exchange rates that reduced our revenue in 2009 by $18.1 million; and |
| • | lower transaction volumes, which we believe resulted from the economic downturn. |
The decrease in International segment revenue was partially offset by:
| • | the full-year impact of acquisitions completed during 2008 and the partial-year impact of acquisitions completed during 2009, which represented an aggregate increase in revenue of $15.7 million in 2009; and |
| • | higher revenue per transaction from our existing card products as compared to 2008. |
Consolidated operating expenses
Merchant commissions. Merchant commissions increased from $38.5 million in 2008 to $39.7 million in 2009, an increase of $1.2 million, or 3.1%. This increase was due primarily to acquisitions completed during 2009 which added $6.2 million in expense, partially offset by the favorable impact of foreign exchange rates of $3.3 million, and lower transaction volumes by existing customers, which we believe were due to the economic downturn.
Processing. Processing expenses increased from $51.4 million in 2008 to $58.0 million in 2009, an increase of $6.6 million, or 12.8%. This increase was due primarily to the impact of acquisitions completed during 2009 of $7.7 million and an increase of $0.5 million for bad debt related to non-securitized accounts receivable due to a higher percentage of uncollectible accounts. These increases were partially offset by the favorable impact of foreign exchange rates of $1.0 million and lower servicing costs of $2.4 million due to operating efficiencies.
Selling. Selling expenses increased from $23.8 million in 2008 to $30.6 million in 2009, an increase of $6.8 million, or 28.6%. The increase was due primarily to the impact of acquisitions completed during 2009 of $3.5 million and additional sales and marketing expense of $4.1 million to increase sales production. These increases were partially offset by the favorable impact of foreign exchange rates of $0.7 million.
General and administrative. General and administrative expense increased from $47.6 million in 2008 to $51.4 million in 2009, an increase of $3.8 million, or 8.0%. An increase of $9.2 million was attributable to acquisitions completed during 2009. This increase was partially offset by the favorable impact of foreign exchange rates of $3.7 million and operating efficiencies that we believe reduced expenses by $2.2 million.
Depreciation and amortization. Depreciation and amortization increased from $27.3 million in 2008 to $28.4 million in 2009, an increase of $1.1 million, or 4.0%. An increase of $5.7 million was attributable to acquisitions completed during 2009 due primarily to the amortization of intangible assets related to customer and vendor relationships, tradenames and trademarks, non-compete agreements and software. This increase was partially offset by the impact of a contract that became fully amortized during 2008 and represented $5.9 million of additional amortization in 2008.
52
Table of Contents
Index to Financial Statements
Operating income and operating margin
Consolidated operating income
Operating income decreased from $152.5 million in 2008 to $146.0 million in 2009, a decrease of $6.5 million, or 4.3%. Our operating margin was 44.7% and 41.2% for 2008 and 2009, respectively. The decrease in operating income and margin from 2008 to 2009 was due primarily to the impact of lower price-spread revenue during 2009 relative to the higher than normal fuel-price spreads experienced during the second half of 2008, the unfavorable impact of foreign exchange rates in 2009 compared to 2008, lower average retail price of fuel in 2009 compared to 2008 and a decrease in transaction volumes as a result of the global economic downturn.
For the purpose of segment operations, we calculate segment operating income by subtracting segment operating expenses from segment revenue. Similarly, segment operating margin is calculated by dividing segment operating income by segment revenue.
North American segment operating income
North American operating income increased from $88.3 million in 2008 to $91.7 million in 2009, an increase of $3.4 million, or 3.9%. North American operating margin was 43.0% and 40.3% for 2008 and 2009, respectively. The increase in operating income from 2008 to 2009 was due primarily to the impact of the CLC Acquisition, which we completed in April 2009, and organic growth in our rate per transaction during 2009 compared to 2008. These factors were partially offset by lower fuel-price spread revenue in 2009 compared to 2008 due to higher than normal fuel-price spreads in the second half of 2008, a lower average retail price of fuel in 2009 compared to 2008 and a decrease in transaction volumes, which we believe resulted from the economic downturn. Operating margin decreased from 2008 to 2009 due primarily to lower fuel-price spread revenue in 2009 as discussed above without a corresponding decrease in our operating expenses. As a result, the higher than normal revenues in 2008 increased operating margin in that year by approximately 3%.
International segment operating income
International operating income decreased from $64.2 million in 2008 to $54.3 million in 2009, a decrease of $9.9 million, or 15.4%. International operating margin was 47.3% and 42.9% for 2008 and 2009, respectively. The decrease in operating income and margin from 2008 to 2009 was due primarily to the impact of foreign exchange rates and lower transaction volumes as a result of the economic downturn. These factors were partially offset by the impact of completed acquisitions during 2009 and the full year impact of the acquisitions completed during 2008.
Other income, net
Other income decreased from $2.5 million in 2008 to $0.9 million in 2009, a decrease of $1.6 million, or 64.0%. The decrease was due primarily to the reversal of a previously-recorded litigation reserve of $1.1 million in 2008 and losses on foreign currency transactions of $0.5 million in 2009.
Interest expense, net
Interest expense, net reflects the amount of interest paid on our 2005 Credit Facility and CCS Credit Facility described below under the headings “2005 Credit Facility” and “CCS Credit Facility”, respectively, offset by interest income. Interest expense decreased from $20.3 million in 2008 to $17.3 million in 2009, a decrease of $3.0 million, or 14.8%. The decrease from 2008 to 2009 resulted from lower average interest rates during 2009 than experienced during 2008. The average interest rate (including the effect of interest rate derivatives) on the
53
Table of Contents
Index to Financial Statements
2005 Credit Facility was 5.13% in 2009 versus 6.19% in 2008. The average interest rate on the CCS Credit Facility was 3.81% in 2009 versus 5.82% in 2008.
Provision for income taxes
The provision for income taxes increased from $37.4 million in 2008 to $40.5 million in 2009, an increase of $3.1 million, or 8.3%. The increase from 2008 to 2009 was due primarily to an increase in our effective tax rate from 27.8% in 2008 to 31.3% in 2009. The increase in our effective tax rate was due primarily to the increase in valuation allowances on state net operating losses. As of December 31, 2009, we had net operating loss carryforwards for state income tax purposes of approximately $53.0 million, which are available to offset future state taxable income through 2021. A valuation allowance was made against our state net operating loss carryforwards, the cumulative effect of which was recognized as an increase in tax expense of approximately $0.9 million for 2009. Additionally, part of the increase was due to acquisition-related costs, which were expensed for accounting purposes but capitalized for tax purposes, and the mix of earnings between domestic and foreign jurisdictions with differing tax rates.
Net income
For all the reasons discussed above, our net income decreased from $97.3 million in 2008 to $89.1 million in 2009, a decrease of $8.2 million, or 8.4%.
Year ended December 31, 2008 compared to the year ended December 31, 2007
The following table sets forth selected consolidated statement of operations data for the years ended December 31, 2008 and 2007 (dollars in millions).
| Year ended December 31, 2008 |
% of total revenue |
Year ended December 31, 2007 |
% of total revenue |
Increase (decrease) |
% change | |||||||||||||||||||
| Revenues, net: |
||||||||||||||||||||||||
| North America |
$ | 205.5 | 60% | $ | 161.4 | 61% | $ | 44.1 | 27.3% | |||||||||||||||
| International |
135.6 | 40% | 102.7 | 39% | 32.9 | 32.0% | ||||||||||||||||||
| Total revenues, net |
341.1 | 100% | 264.1 | 100% | 77.0 | 29.2% | ||||||||||||||||||
| Consolidated operating expenses: |
||||||||||||||||||||||||
| Merchant commissions |
38.5 | 11% | 39.4 | 15% | (.9 | ) | (2.3)% | |||||||||||||||||
| Processing |
51.4 | 15% | 34.1 | 13% | 17.3 | 50.7% | ||||||||||||||||||
| Selling |
23.8 | 7% | 22.6 | 9% | 1.2 | 5.3% | ||||||||||||||||||
| General and administrative |
47.6 | 14% | 42.0 | 16% | 5.6 | 13.3% | ||||||||||||||||||
| Depreciation and amortization |
27.3 | 8% | 20.2 | 8% | 7.1 | 35.1% | ||||||||||||||||||
| Operating income |
152.5 | 45% | 105.8 | 40% | 46.7 | 44.1% | ||||||||||||||||||
| Other income, net |
(2.5 | ) | (1)% | (1.5 | ) | (1)% | (1.0 | ) | 66.7% | |||||||||||||||
| Interest expense, net |
20.3 | 6% | 19.7 | 7% | .6 | 3.0% | ||||||||||||||||||
| Provision for income taxes |
37.4 | 11% | 26.0 | 10% | 11.4 | 43.8% | ||||||||||||||||||
| Net income |
$ | 97.3 | 29% | $ | 61.6 | 23% | $ | 35.7 | 58.0% | |||||||||||||||
| Operating income for segments: |
||||||||||||||||||||||||
| North America |
$ | 88.3 | 43% | $ | 64.6 | 40% | $ | 23.7 | 36.7% | |||||||||||||||
| International |
64.2 | 47% | 41.2 | 40% | 23.0 | 55.8% | ||||||||||||||||||
| Operating income |
$ | 152.5 | 45% | $ | 105.8 | 40% | $ | 46.7 | 44.1% | |||||||||||||||
| Operating margin for segments: |
||||||||||||||||||||||||
| North America |
43.0% | 40.0% | 2.9% | |||||||||||||||||||||
| International |
47.3% | 40.1% | 7.2% | |||||||||||||||||||||
54
Table of Contents
Index to Financial Statements
Revenue
Our consolidated revenue increased from $264.1 million in 2007 to $341.1 million in 2008, an increase of $77.0 million, or 29.2%. During 2008, our consolidated revenue was positively impacted by:
| • | acquisitions of businesses during 2008, which represented an aggregate of $15.1 million in revenue from their respective dates of acquisition; |
| • | acquisitions of businesses and a commercial account portfolio completed during 2007, which contributed an aggregate of $7.6 million in 2008 in excess of revenue recognized in 2007; |
| • | higher program fees and other fees and charges primarily resulting from the full-year impact of a private label contract and higher fees for a number of our commercial account portfolios; |
| • | the decrease in the wholesale price of fuel at a higher rate than the retail price of fuel during the second half of 2008, which caused the margin between the wholesale cost of fuel and the retail price of fuel to expand beyond historical levels and which we believe contributed incremental revenue of approximately $23 million relative to revenue in 2007; and |
| • | the average retail price of fuel was higher in 2008 as compared to 2007. We believe that the higher average retail price of fuel in 2008 increased revenue by approximately $7 million. |
Our consolidated revenue was also negatively impacted during 2008 by lower transaction volumes which we believe resulted from the economic downturn.
North American segment revenue
Revenue increased from $161.4 million in 2007 to $205.5 million in 2008, an increase of $44.1 million, or 27.3%. The increase in revenue was due primarily to:
| • | higher program fees and other fees and charges primarily as a result of the full-year impact of a private label contract and higher fees in a number of our commercial account portfolios of $43.7 million; |
| • | incrementally higher fuel-price spread revenue of approximately $23 million during 2008 relative to 2007; and |
| • | the average retail price of fuel was higher in 2008 as compared to 2007. We believe that the higher average retail price of fuel in 2008 increased revenue by approximately $7 million. |
The increase in North America revenue was partially offset by:
| • | a change in the loss on sales of receivables to the securitization facility (on a managed basis we view the loss as interest on the securitization facility and bad debt expense on the securitized accounts receivable) resulting in a higher adjustment to revenue of $15.7 million in 2008; and |
| • | lower transaction volumes during 2008, which we believe resulted from the economic downturn. |
International segment revenue
Revenue increased from $102.7 million in 2007 to $135.6 million in 2008, an increase of $32.9 million, or 32.0%. The increase in revenue was due primarily to:
| • | acquisitions completed during 2008 plus the full-year impact of acquisitions completed during 2007, which represented an aggregate of $22.7 million in revenue in 2008; |
| • | higher transaction volumes and revenue per transaction from our existing card products as compared to 2007; and |
55
Table of Contents
Index to Financial Statements
| • | the weakening of the U.S. dollar during 2008, relative to certain foreign currencies, which resulted in favorable foreign exchange rates that increased our revenue in 2008 by $8.6 million. |
Consolidated operating expenses
Merchant commissions. Merchant commissions decreased from $39.4 million in 2007 to $38.5 million in 2008, a decrease of $0.9 million, or 2.3%. The decrease was attributable primarily to lower transaction volumes that incurred merchant commissions.
Processing. Processing expense increased from $34.1 million in 2007 to $51.4 million in 2008, an increase of $17.3 million, or 50.7%. The increase from 2007 to 2008 was due primarily to the implementation of a new private label contract of $4.3 million, the impact of four completed acquisitions during 2008 and the full-year impact of acquisitions completed during 2007 of $5.1 million, and additional credit/collections department expense of $3.5 million.
Selling. Selling expense increased from $22.6 million in 2007 to $23.8 million in 2008, an increase of $1.2 million, or 5.3%. The increase resulted from the impact of acquisitions completed in 2007 and 2008 of $2.0 million.
General and administrative. General and administrative expense increased from $42.0 million in 2007 to $47.6 million in 2008, an increase of $5.6 million, or 13.3%. The increase was due primarily to the impact of acquisitions completed in 2007 and 2008 of $4.4 million, additional stock-based compensation expense of $1.5 million and increased acquisition related expenses. These increases were partially offset by cost saving initiatives of $1.9 million.
Depreciation and amortization. Depreciation and amortization increased from $20.2 million in 2007 to $27.3 million in 2008, an increase of $7.1 million, or 35.1%. The increase was due primarily to acquisitions completed during 2008, which increased depreciation and amortization by $1.5 million and the amortization of the premium attributable to the purchase of a new private label portfolio of $1.5 million. Amortization expense increased as a result of our amortization of intangible assets related to customer and vendor relationships, intellectual property and software. In addition, during 2008, we accelerated the amortization of a private label contract of $2.2 million.
Operating income and operating margin for segments
Consolidated operating income
Operating income increased from $105.8 million in 2007 to $152.5 million in 2008, an increase of $46.7 million, or 44.1%. Our operating margin was 40.0% and 44.7% for 2007 and 2008, respectively. The increase in operating income from 2007 to 2008 resulted from a number of factors, the most significant of which included the completion of four acquisitions during 2008 and the full-year impact of three acquisitions completed during 2007, higher price-spread revenue as a result of higher than normal fuel-price spreads in the second half of 2008 compared to 2007, higher average retail price of fuel in 2008 as compared to 2007 and organic growth in the business. In addition, the impact of higher fuel spread revenue in 2008 increased operating margins compared to 2007.
North American segment operating income
North American operating income increased from $64.6 million in 2007 to $88.3 million in 2008, an increase of $23.7 million, or 36.7%. The North American operating margin was 40.0% and 43.0% for 2007 and 2008, respectively. The increase in operating income from 2007 to 2008 resulted from a number of factors, the most significant of which related to higher fuel price-spread revenue as a result of higher than normal fuel-price
56
Table of Contents
Index to Financial Statements
spreads in the second half of 2008 compared to 2007, higher average retail price of fuel in 2008 as compared to 2007 and organic growth in our business. In addition, the impact of higher fuel price-spread revenue in 2008 increased operating margins.
International segment operating income
International operating income increased from $41.2 million in 2007 to $64.2 million in 2008, an increase of $23.0 million, or 55.8%. International operating margin was 40.1% and 47.3% for 2007 and 2008, respectively. The increase in operating income from 2007 to 2008 was due primarily to acquisitions completed during 2008 and the full-year impact of acquisitions completed during 2007, favorable foreign currency exchange rates in 2008 versus 2007 and organic growth in our business. Operating margins were also positively impacted during 2008 by the economies of scale gained through the integration of acquired companies into our existing business.
Other income, net
Other income increased from $1.5 million in 2007 to $2.5 million in 2008, an increase of $1.0 million, or 66.7%. The increase was due primarily to the reversal of a previously recorded litigation reserve of $1.1 million in 2008.
Interest expense, net
Interest expense increased from $19.7 million in 2007 to $20.3 million in 2008, an increase of $0.6 million, or 3.0%. The increase from 2007 to 2008 resulted from additional borrowings of $50.0 million under our 2005 Credit Facility. The increase in interest associated with the increased borrowing was offset by lower average interest rates in 2008 on the 2005 Credit Facility. The average interest rate (including the effect of interest rate derivatives) on the 2005 Credit Facility was 6.19% in 2008 versus 7.72% in 2007. The average interest rate on the CCS Credit Facility was 5.82% in 2008 versus 5.15% in 2007.
Provision for income taxes
The provision for income taxes increased from $26.0 million in 2007 to $37.4 million in 2008, an increase of $11.4 million, or 43.8%. The increase was due primarily to higher income before taxes of $134.7 million in 2008 compared to $87.6 million in 2007. Our consolidated effective tax rate for 2008 was 27.8% as compared to 29.7% for 2007. The decrease in our effective tax rate was due primarily to a reduction in our reserve for uncertain tax positions in certain foreign jurisdictions, a reduction in the statutory tax rate in certain foreign jurisdictions and the mix of earnings between domestic and foreign jurisdictions.
Net income
For all the reasons discussed above, our net income increased from $61.6 million in 2007 to $97.3 million in 2008, an increase of $35.7 million, or 58.0%.
57
Table of Contents
Index to Financial Statements
Nine months ended September 30, 2010 compared to the nine months ended September 30, 2009
The following table sets forth selected consolidated statement of operations data for the nine months ended September 30, 2010 and 2009 (dollars in thousands).
| Nine months ended September 30, 2010 |
% of Revenue |
Nine months ended September 30, 2009 |
% of Revenue |
Increase (Decrease) |
% Change | |||||||||||||||||||
| Revenues, net: |
||||||||||||||||||||||||
| North America |
$ | 219,447 | 67% | $ | 167,002 | 65% | $ | 52,445 | 31.4% | |||||||||||||||
| International |
107,847 | 33% | 89,759 | 35% | 18,088 | 20.2% | ||||||||||||||||||
| Total revenues, net |
327,294 | 100% | 256,761 | 100% | 70,533 | 27.5% | ||||||||||||||||||
| Consolidated operating expenses: |
||||||||||||||||||||||||
| Merchant commissions |
39,549 | 12% | 28,860 | 11% | 10,689 | 37.0% | ||||||||||||||||||
| Processing |
52,608 | 16% | 43,099 | 17% | 9,509 | 22.1% | ||||||||||||||||||
| Selling |
23,155 | 7% | 21,470 | 8% | 1,685 | 7.8% | ||||||||||||||||||
| General and administrative |
40,025 | 12% | 38,251 | 15% | 1,774 | 4.6% | ||||||||||||||||||
| Depreciation and amortization |
25,238 | 8% | 20,235 | 8% | 5,003 | 24.7% | ||||||||||||||||||
| Operating Income |
146,719 | 45% | 104,846 | 41% | 41,873 | 39.9% | ||||||||||||||||||
| Other income, net |
(767 | ) | 0% | (369 | ) | 0% | (398 | ) | 107.9% | |||||||||||||||
| Interest expense, net |
16,352 | 5% | 13,023 | 5% | 3,329 | 25.6% | ||||||||||||||||||
| Provision for income taxes |
40,752 | 12% | 28,088 | 11% | 12,664 | 45.1% | ||||||||||||||||||
| Net income |
$ | 90,382 | 28% | $ | 64,104 | 25% | $ | 26,278 | 41.0% | |||||||||||||||
| Operating income for segments: |
||||||||||||||||||||||||
| North America |
$ | 95,185 | 43.4% | $ | 65,978 | 39.5% | $ | 29,207 | 44.3% | |||||||||||||||
| International |
51,534 | 47.8% | 38,868 | 43.3% | 12,666 | 32.6% | ||||||||||||||||||
| Operating income |
$ | 146,719 | 44.8% | $ | 104,846 | 40.8% | $ | 41,873 | 39.9% | |||||||||||||||
| Operating margin for segments: |
||||||||||||||||||||||||
| North America |
43.4% | 39.5% | 3.9% | |||||||||||||||||||||
| International |
47.8% | 43.3% | 4.5% | |||||||||||||||||||||
Revenue
Our consolidated revenue increased from $256.8 million in the nine months ended September 30, 2009 to $327.3 million in the nine months ended September 30, 2010, an increase of $70.5 million, or 27.5%. The increase in revenue was primarily due to the following:
| • | during the nine months ended September 30, 2010, our total revenue increased by $21.4 million as a result of the adoption of authoritative accounting guidance related to our asset securitization facility as further discussed in “Note 2 – Summary of significant accounting policies”; |
| • | acquisitions completed during 2009, which increased revenue by $10.9 million in the first nine months of 2010; |
| • | increased volume and higher program fees and charges from our existing customers, which increased revenue in the nine months ended September 30, 2010 by approximately $37.7 million; and |
| • | the weakening of the U.S. dollar during the nine months ended September 30, 2010, relative to other foreign currencies, which resulted in favorable foreign exchange rates as compared to the nine months ended September 30, 2009, which increased our revenue in the nine months ended September 30, 2010 by $0.6 million. |
58
Table of Contents
Index to Financial Statements
North American segment revenue
North American segment revenue increased from $167.0 million in the nine months ended September 30, 2009 to $219.4 million in the nine months ended September 30, 2010, an increase of $52.4 million, or 31.4%. The increase was primarily due to the following:
| • | during the nine months ended September 30, 2010, our total revenue increased by $21.4 million as a result of the adoption of authoritative accounting guidance related to our asset securitization facility as further discussed in “Note 2 – Summary of significant accounting policies”; |
| • | an acquisition completed in April 2009 which added approximately $11.6 million in revenue for the nine months ended September 30, 2010, which was offset by a decrease of $12.0 million related to the fulfillment of a contract which expired; |
| • | $30.1 million in higher program fees and charges from our existing customers; and |
| • | higher transaction volumes, which we believe resulted from the economic recovery. |
International segment revenue
International segment revenue increased from $89.8 million in the nine months ended September 30, 2009 to $107.8 million in the nine months ended September 30, 2010, an increase of $18.1 million, or 20.2%. The increase in International segment revenue was due primarily to the following:
| • | the impact of acquisitions completed during 2009, which represented an increase in revenue of $11.3 million in the nine months ended September 30, 2010; |
| • | the weakening of the U.S. dollar during the nine months ended September 30, 2010, relative to foreign currencies, which resulted in favorable foreign exchange rates that increased our revenue in the nine months ended September 30, 2010 by $0.6 million; and |
| • | higher revenue per transaction from our existing card products as compared to the nine months ended September 30, 2009. |
Consolidated operating expenses
Merchant commissions. Merchant commissions increased from $28.9 million in the nine months ended September 30, 2009 to $39.5 million in the nine months ended September 30, 2010, an increase of $10.7 million, or 37.0%. This increase was due primarily to organic growth in certain payment programs.
Processing. Processing expense increased from $43.1 million in the nine months ended September 30, 2009 to $52.6 million in the nine months ended September 30, 2010, an increase of $9.5 million, or 22.1%. During the nine months ended September 30, 2010, our processing expenses increased by $17.3 million as a result of the adoption of authoritative accounting guidance related to our asset securitization facility as further discussed in “Note 2 – Summary of significant accounting policies” and the impact of acquisitions completed during 2009 which added $3.2 million in processing expense in the nine months ended September 30, 2010. Partially offsetting these increases was lower bad debt in our existing businesses of $10.3 million.
Selling. Selling expense increased from $21.5 million in the nine months ended September 30, 2009 to $23.2 million in the nine months ended September 30, 2010, an increase of $1.7 million, or 7.8%. The increase was due primarily to the impact of acquisitions completed during 2009 of $0.3 million and organic growth in certain payment programs.
59
Table of Contents
Index to Financial Statements
General and administrative. General and administrative expense increased from $38.3 million in the nine months ended September 30, 2009 to $40.0 million in the nine months ended September 30, 2010, an increase of $1.8 million, or 4.6%. The increase was primarily due to the impact of acquisitions completed during 2009 of $0.2 million, an unfavorable impact of foreign exchange rates of $0.8 million and an investment in increased head count to support new business development.
Depreciation and amortization. Depreciation and amortization increased from $20.2 million in the nine months ended September 30, 2009 to $25.2 million in the nine months ended September 30, 2010, an increase of $5.0 million, or 24.7%. An increase of $1.3 million was attributable to the impact of the amortization of intangible assets related to customer and vendor relationships, tradenames and trademarks, non-compete agreements and software associated with acquisitions completed during 2009. The increase in depreciation is also related to the depreciation of a new operating system put into service during 2009.
Operating income and operating margin
Consolidated operating income
Operating income increased from $104.8 million in the nine months ended September 30, 2009 to $146.7 million in the nine months ended September 30, 2010, an increase of $41.9 million, or 39.9%. Our operating margin was 40.8% and 44.8% for the nine months ended September 30, 2009 and 2010, respectively. The increase in operating income and margin during these periods was due primarily to a favorable impact of foreign exchange rates in the nine months ended September 30, 2010 compared to the nine months ended September 30, 2009, acquisitions completed during 2009 that carried a higher operating margin than our existing businesses, lower bad debt expense and an increase in revenue per transaction in our existing businesses.
For the purpose of segment operations, we calculate segment operating income by subtracting segment operating expenses from segment revenue. Similarly, segment operating margin is calculated by dividing segment operating income by segment revenue.
North American segment operating income
North American operating income increased from $66.0 million in the nine months ended September 30, 2009 to $95.2 million in the nine months ended September 30, 2010, an increase of $29.2 million, or 44.3%. North American operating margin was 39.5% and 43.4% for the nine months ended September 30, 2009 and 2010, respectively. The increase in operating income and margins during these periods was due primarily to the impact of the CLC Acquisition, which closed in April 2009 and carried a higher operating margin than our existing businesses, and organic growth in our rate per transaction during the nine months ended September 30, 2010 as compared to the nine months ended September 30, 2009.
International segment operating income
International operating income increased from $38.9 million in the nine months ended September 30, 2009 to $51.5 million in the nine months ended September 30, 2010, an increase of $12.7 million, or 32.6%. International operating margin was 43.3% and 47.8% for the nine months ended September 30, 2009 and 2010, respectively. The increase in operating income and margin during these periods was due primarily to the impact of completed acquisitions during the nine months ended September 30, 2009, the impact of foreign exchange rates and an increase in rate per transaction resulting from organic growth and the loss of a high transaction, low revenue contract during the nine months ended September 30, 2010.
60
Table of Contents
Index to Financial Statements
Other income, net
Other income increased from $0.4 million in the nine months ended September 30, 2009 to $0.8 million in the nine months ended September 30, 2010, an increase of $0.4 million, or 107.9%.
Interest expense, net
Interest expense, net reflects the amount of interest paid on our 2005 Credit Facility and CCS Credit Facility net of interest income. Interest expense increased from $13.0 million in the nine months ended September 30, 2009 to $16.4 million in the nine months ended September 30, 2010, an increase of $3.3 million, or 25.6%. During the nine months ended September 30, 2010, our interest expense increased by $4.1 million as a result of the adoption of authoritative accounting guidance related to our asset securitization facility as further discussed in “Note 2 – Summary of significant accounting policies”, and higher average interest rates on the 2005 Credit Facility. These increases were partially offset by higher interest income, the impact of lower principal balances on both the 2005 Credit Facility and the CCS Credit Facility and lower average interest rates on the CCS Credit Facility. The average interest rate (including the effect of interest rate derivatives) on the 2005 Credit Facility was 5.80% in the nine months ended September 30, 2010 versus 5.31% in the nine months ended September 30, 2009. The average interest rate on the CCS Credit Facility was 2.67% in the nine months ended September 30, 2010 versus 3.76% in the nine months ended September 30, 2009.
Provision for income taxes
The provision for income taxes increased from $28.1 million in the nine months ended September 30, 2009 to $40.8 million in the nine months ended September 30, 2010, an increase of $12.7 million, or 45.1%. We provide for income taxes during interim periods based on an estimate of our effective tax rate for the year. Discrete items and changes in the estimate of the annual tax rate are recorded in the period they occur. Our effective tax rate for the nine months ended September 30, 2010 was 31.1% as compared to 30.5% for the nine months ended September 30, 2009. The increase in the effective tax rate was primarily due to a change in the mix of earnings between the United States and Europe. We pay taxes in many different taxing jurisdictions, including the United States, most U.S. states and many non-U.S. jurisdictions. The tax rates in non-U.S. taxing jurisdictions are lower than the U.S. tax rate. Consequently, as our earnings fluctuate between taxing jurisdictions our effective tax rate fluctuates.
Net income
For all the reasons discussed above, our net income increased from $64.1 million in the nine months ended September 30, 2009 to $90.4 million in the nine months ended September 30, 2010, an increase of $26.3 million, or 41.0%.
61
Table of Contents
Index to Financial Statements
Quarterly results of operations
The following table sets forth our selected unaudited quarterly consolidated statement of income data for each of the eight quarters in the two-year period ended September 30, 2010. This information is derived from our unaudited financial statements, which in the opinion of management contain all adjustments necessary for a fair statement of such financial data. The results of historical periods are not necessarily indicative of the results of operations for any future period. You should read this data together with our consolidated financial statements and the accompanying notes appearing elsewhere in this prospectus.
| Quarter ended | ||||||||||||||||||||||||||||||||
| (in millions) | September 30, 2010 |
June 30, 2010 |
March 31, 2010 |
December 31, 2009 |
September 30, 2009 |
June 30, 2009 |
March 31, 2009 |
December 31, 2008 |
||||||||||||||||||||||||
| Revenues, net |
$ | 111.7 | $ | 111.4 | $ | 104.2 | $ | 97.3 | $ | 100.6 | $ | 88.1 | $ | 68.1 | $ | 91.3 | ||||||||||||||||
| Operating income |
49.1 | 50.6 | 47.1 | 41.2 | 47.9 | 33.9 | 23.1 | 32.0 | ||||||||||||||||||||||||
| Net income |
33.4 | 29.6 | 27.3 | 24.9 | 29.9 | 20.8 | 13.4 | 22.4 | ||||||||||||||||||||||||
Liquidity and capital resources
Our principal liquidity requirements are to service and repay our indebtedness, make acquisitions of businesses and commercial account portfolios and meet working capital, tax and capital expenditure needs.
Sources of liquidity
At September 30, 2010, our unrestricted cash and cash equivalent balance totaled $110.8 million. Our restricted cash balance at September 30, 2010 totaled $65.9 million. Restricted cash represents customer deposits, primarily in the Czech Republic, which we are restricted from using other than to repay customer deposits and which may not be deposited outside of the Czech Republic.
We utilize an accounts receivable securitization facility to finance a majority of our domestic fuel card receivables, to lower our cost of funds and more efficiently use capital. We generate and record accounts receivable when a customer makes a purchase from a merchant using one of our card products and generally pay merchants within seven days of receiving the merchant billing. As a result, we utilize the asset securitization facility as a source of liquidity to provide the cash flow required to fund merchant payments while we collect customer balances. These balances are primarily composed of charge balances, which are typically billed to the customer on a weekly, semimonthly or monthly basis, and are generally required to be paid within 30 days of billing. We also consider the undrawn amounts under our securitization facility and 2005 Credit Facility as funds available for working capital purposes or for acquisitions. At September 30, 2010, we had the ability to generate approximately $80.8 million of additional liquidity under our securitization facility and $50.0 million available under the 2005 Credit Facility.
Based on our current forecasts and anticipated market conditions, we believe that our current cash balances, our available borrowing capacity and our ability to generate cash from operations, will be sufficient to fund our liquidity needs for at least the next 12 months. However, we regularly evaluate our cash requirements for current operations, commitments, capital requirements and acquisitions, and we may elect to raise additional funds for these purposes in the future, either through the issuance of debt and equity securities or otherwise. We may not be able to obtain additional financing on terms favorable to us, if at all.
62
Table of Contents
Index to Financial Statements
Cash flows
The following table summarizes our cash flows for the years ended December 31, 2009, 2008 and 2007 and for the nine months ended September 30, 2010 and 2009.
| (in millions) | Nine months ended September 30, | Year ended December 31, | ||||||||||||||||||
| 2010 | 2009 | 2009 | 2008 | 2007 | ||||||||||||||||
| Net cash provided by operating activities |
$ | 106.9 | $ | 150.2 | $ | 178.8 | $ | 59.0 | $ | 55.9 | ||||||||||
| Net cash used in investing activities |
(13.3 | ) | (233.1 | ) | (240.8 | ) | (63.0 | ) | (40.8 | ) | ||||||||||
| Net cash (used in) provided by financing activities |
(69.2 | ) | 76.2 | 72.2 | 14.0 | 30.9 | ||||||||||||||
Operating activities. Net cash provided by operating activities for the nine months ended September 30, 2010 was $106.9 million compared to $150.2 million for the nine months ended September 30, 2009. The decrease is attributable primarily to an increase in prepaid expenses and other current assets of $34.0 million related to the timing of purchases in our U.K. operations, an increase in accounts receivable of $29.0 million, and a decrease in the provision for losses on accounts receivable due to lower bad debts of $10.4 million. These decreases were offset by an increase in restricted cash of $4.3 million primarily due to favorable foreign exchange rate fluctuations and higher net income of $26.3 million.
Net cash provided by operating activities for 2009 was $178.8 million compared to $59.0 million for 2008. This improvement is attributable primarily to working capital improvements of $102.8 million, driven mainly by an increase in accounts payable due to timing of year-end merchant payables, interest and income tax and improved collection on accounts receivable, and an increase in prepaid expenses related to timing of purchases that contributed approximately $24.3 million year over year. These increases were partially offset by lower net income of $8.2 million.
Net cash provided by operating activities for 2008 was $59.0 million compared to $55.9 million for 2007. This improvement is attributable primarily to increased net income of $36.0 million, an increase in provision for losses on accounts receivable due to higher bad debts of $19.5 million and an increase in restricted cash due to favorable foreign exchange rate fluctuations of $18.4 million. These increases were partially offset by a reduction in working capital of $76.8 million. The decrease in working capital was a result of improved collections on accounts receivable, offset by a reduction in accounts payable due to timing of year end merchant payables, interest and income tax payments.
Investing activities. Net cash used in investing activities for the nine months ended September 30, 2010 was $13.3 million compared to $233.1 million for the nine months ended September 30, 2009. The decrease is attributable to acquisitions completed during the nine months ended September 30, 2010 of $6.2 million as compared to $225.6 million in the nine months ended September 30, 2009.
Net cash used in investing activities increased $177.8 million in 2009, from $63 million in 2008, due primarily to acquisitions completed in 2009 of $175.2 million. In addition, our capital expenditures increased from $7.1 million in 2008 to $9.7 million in 2009 primarily as a result of additional investments to build and enhance our proprietary processing systems. Net cash used in investing activities increased $22.2 million in 2008, from $40.8 million in 2007 due primarily to acquisitions.
Financing activities. Net cash used in financing activities increased $145.4 million, from net cash provided by financing activities of $76.2 million in the nine months ended September 30, 2009 to net cash used in financing activities of $69.2 million for the nine months ended September 30, 2010. The increase is attributable primarily to the inclusion of the securitization facility, which as of January 1, 2010 was consolidated, and the absence of equity proceeds to us from the issuance of preferred stock during the nine months ended September 30, 2010.
63
Table of Contents
Index to Financial Statements
During the nine months ended September 30, 2010, we made net payments on the securitization facility of approximately $51.0 million. In April 2009, we received net proceeds of $93.5 million from the issuance of our Series E preferred stock.
Net cash provided by financing activities increased $58.2 million, from $14.0 million in 2008. The increase in cash provided by financing activities resulted from the net proceeds received from the issuance of our Series E preferred stock of $93.7 million in April 2009. In addition, during 2009 we made principal payments on the 2005 Credit Facility and the CCS Credit Facility of $21.0 million compared to aggregate principal payments of $33.8 million in 2008. These increases were offset by note proceeds of $50.0 million received in 2008 under the delayed draw portion of the 2005 Credit Facility.
Net cash provided by financing activities decreased $16.9 million in 2008, from $30.9 million in 2007. The decrease is due primarily to $39.8 million in note proceeds and a $24.6 million increase in principal note payments, partially offset by the repurchase of common stock of $24.3 million in 2007 and the premium paid on the purchase of receivables of $14.3 million in 2007.
Capital spending summary
Our capital expenditures were $7.1 million and $7.5 million in the nine months ended September 30, 2010 and 2009, respectively, a decrease of $0.4 million. Our capital expenditures were $5.3 million in 2006 and $7.1 million in both 2007 and 2008. Our capital expenditures increased to $9.7 million in 2009, an increase of $2.6 million, or 36.6%, from 2008. The increase was related primarily to investments to enhance our existing processing systems and to develop a new European processing system. We anticipate our capital expenditures to increase to approximately $9.3 million during 2010 as we continue to enhance our existing processing systems.
2005 Credit Facility
We are a party to a credit agreement, dated as of June 29, 2005, which has been subsequently amended and restated as of April 30, 2007, among FleetCor Technologies Operating Company, LLC and FleetCor UK Acquisition Limited, as borrowers, FleetCor Technologies, Inc., JPMorgan Chase Bank, N.A., as administrative agent and collateral agent, J.P. Morgan Europe Limited, as London agent, and the other lenders party thereto. We refer to this facility as the 2005 Credit Facility in this prospectus.
The 2005 Credit Facility provides for term loans in the amount of $250.0 million and two tranches of multicurrency revolving loans, each of which revolving loans may be made in U.S. dollars, British pounds or Euros; a U.S. tranche for the U.S. borrower of up to $30.0 million (with a $10.0 million sub-limit for letters of credit), and a global tranche for both the U.S. borrower and U.K. borrower of up to $20.0 million. The 2005 Credit Facility also includes a $10.0 million swing line facility which is available to the U.S. borrower. The credit agreement also provides for delayed draw term loans in the amount of up to $50.0 million, of which $50.0 million was borrowed in April 2008. The 2005 Credit Facility further provides for incremental term loans in an aggregate amount not to exceed $100.0 million. None of the incremental term loans have been made. As of September 30, 2010, we had $274.0 million in outstanding term loans and no borrowings on the revolving line under the 2005 Credit Facility.
Interest on the facilities may accrue, at our election, based on a base rate, EURIBOR or LIBOR, plus a margin. The margin with respect to term loans is fixed at 2.25% for LIBOR and EURIBOR loans and at 1.25% for base rate loans. With respect to revolving loans and letter of credit fees, the margin or fee is determined based on our leverage ratio and ranges from 2.00% to 2.50% for LIBOR and EURIBOR loans and from 1.00% to 1.50% for base rate loans. As of September 30, 2010 our term loans bore interest at LIBOR plus 2.25% and we had no U.S. revolving loans or multicurrency loans outstanding. Interest on overdue amounts will accrue at a rate equal to the
64
Table of Contents
Index to Financial Statements
applicable interest rate plus 2% per annum. As described below under the heading “Market risk—Use of derivatives”, we were required under the credit agreement to enter into interest rate swaps with respect to at least 40% of our long term debt.
The stated maturity date for our term loans is April 30, 2013 and the stated maturity date for our revolving loans and letters of credit is April 30, 2012. The term loans are payable in quarterly installments of .25% of the initial aggregate principal amount of the loans and are due on the last business day of each March, June, September, and December with the final principal payment due in April 2013. Principal payments of $14.0 million, $7.9 million and $2.3 million were made on the term loan during 2009, 2008 and the nine months ended September 30, 2010, respectively.
Our credit agreement contains a number of negative covenants restricting, among other things, indebtedness, investments, liens, dispositions of assets, restricted payments (including dividends), mergers and acquisitions, “burdensome agreements” (as defined in the 2005 Credit Facility), accounting changes, transactions with affiliates, prepayments of indebtedness, and capital expenditures. Two financial covenants, including a leverage ratio requirement and an interest coverage ratio requirement, are measured quarterly. We are currently required to maintain a leverage ratio of not greater than 2.25 to 1, and beginning January 1, 2011, we will be required to maintain a leverage ratio of not greater than 2.00 to 1. We are required to maintain an interest coverage ratio of not less than 4.00 to 1. As of September 30, 2010, we were in compliance with each of the covenants under the 2005 Credit Facility.
We have received commitments from lenders for an additional tranche of revolving loans in the amount of up to $100 million to be made under the terms of the 2005 Credit Facility. The additional revolving loans will be available only in U.S. dollars, and the commitments for the additional revolving loans will not be held pro rata with the commitments held by the lenders holding existing commitments for the revolving loans and term loans. The additional revolving loan commitments will have a maturity date of October 31, 2012. The maturity date of the existing commitments for revolving loans is April 30, 2012, and the lenders providing such commitments will be asked to extend the maturity date to October 31, 2012. The revolving commitments held by any lender not agreeing to the extension of the maturity date will remain April 30, 2012. In all other respects, we expect that the additional revolving loan commitments will be subject to the terms and conditions applicable to revolving loans made under the existing commitments for the U.S. tranche. The conditions for the additional revolving loan commitments include, among other things, the closing of this offering and the execution of definitive documentation on or before January 15, 2011.
In addition, J.P. Morgan Securities LLC has agreed to arrange an amendment to the 2005 Credit Facility to permit the additional revolving loans described above, to remove the mandatory prepayment requirement with respect to excess cash flow and certain equity issuances, to extend the maturity date on revolving loans with respect to consenting lenders to October 31, 2012, and to increase the interest rate margins for term loans. We expect that the proposed amendment will also include certain other covenant amendments, subject to the requisite consents of the other lenders. The conditions for the proposed amendments include, among other things, the closing of this offering and the execution of definitive documentation on or before January 15, 2011. A customary consent fee will be payable by us to consenting lenders, together with certain other amendment fees and expenses.
CCS Credit Facility
Certain of our subsidiaries are parties to a credit facility agreement, dated as of December 7, 2006, which was amended as of March 28, 2008, among CCS Česká společnost pro platební karty a.s., as borrower, FENIKA s.r.o., as borrower (FENIKA s.r.o. and CCS Česká společnost pro platební karty a.s. subsequently merged into a new entity CCS Česká společnost pro platební karty s.r.o. (“CCS”)), FleetCor Luxembourg Holding 3 S.à r.l., as shareholder, HVB Bank Czech Republic a.s. (current commercial name UniCredit Bank Czech Republic, a.s.), as
65
Table of Contents
Index to Financial Statements
security agent, Bank Austria Creditanstalt AG (current commercial name Unicredit Bank Austria AG), as arranger and facility agent, and the other lenders party thereto. We refer to this facility as the CCS Credit Facility in this prospectus.
The CCS Credit Facility agreement provides for term loans in the total amount of CZK 1.675 billion ($83.8 million), which consists of a “Facility A” amortized term loan in the amount of CZK 990 million ($49.5 million) and a “Facility B” bullet term loan in the amount of CZK 685.0 million ($34.3 million). The unpaid principal balance of the term loans as of September 30, 2010 is approximately CZK 452.0 million ($25.0 million) for “Facility A” and approximately CZK 616.2 million ($34.2 million) for “Facility B”. The outstanding balance of CCS term notes payable increased by an aggregate of $0.7 million for the nine months ended September 30, 2010 and increased by an aggregate of $6.0 million for the nine months ended September 30, 2009 due to changes in the value of the Czech koruna versus the U.S. dollar.
Interest on the term loans may accrue, calculated according to the term selected by CCS, based on a base rate, PRIBOR (Prague Interbank Offered Rate), plus a margin and a mandatory cost. The margin is determined based on CCS’s leverage ratio and ranges from 0.95% to 1.75% for the “Facility A” term loan and from 2.00% to 2.90% for the “Facility B” term loan. As of September 30, 2010, the interest rate on “Facility A” equaled 2.15% and the interest rate on “Facility B” was 3.0%.
The stated maturity date for CCS’s term loans is December 21, 2013 with respect to “Facility A” and December 21, 2014 with respect to “Facility B”. The “Facility A” term loan is payable in semiannual payments in June and December of each year and the “Facility B” term loan is payable in one lump sum. Principal payments of $7.0 million and $18.0 million were made in 2009 and 2008, respectively. Principal payments of approximately $3.1 million were made during the nine months ended September 30, 2010. CCS has the right to prepay the loans without premium or penalty on the last day of an interest period.
The CCS credit agreement contains a number of negative covenants restricting, among other things, indebtedness, investments, liens, dispositions of assets, change of business, restricted payments (including dividends), mergers and acquisitions, transactions with affiliates and prepayments of indebtedness. The agreement also contains financial covenants including a leverage ratio requirement, a debt service cover ratio requirement, an equity ratio requirement and a liquidity ratio requirement, all of which are tested quarterly. CCS is currently required to maintain a leverage ratio of not greater than 3.25 to 1. CCS is required to maintain a debt service coverage ratio of not less than 1.20 to 1, an equity ratio of not less than 0.20 to 1, and a liquidity ratio not less than 1.00 to 1. As of September 30, 2010, CCS was in compliance with each of the covenants under the CCS Credit Facility agreement.
Seller financing
One of our subsidiaries, FleetCor Luxembourg Holding2 S.à r.l. (“Lux 2”), entered into a Share Sale and Purchase Agreement dated April 24, 2008 (the “Purchase Agreement”) with ICP Internet Cash Payments B.V. for the purchase of ICP International Card Products B.V. The acquired business is now being operated in the Netherlands as FleetCor Technologieën B.V. In connection with the purchase Lux 2 agreed to make deferred payments in the aggregate amount of €1.0 million ($1.5 million), of which one remaining payment is due and payable on June 6, 2011 in the amount of €0.33 million ($0.44 million). The obligation to make such deferred payments is described in the Purchase Agreement, as modified by letter agreement dated August 11, 2008, and is not evidenced by a promissory note.
In connection with our acquisition of Petrol Plus Region and an affiliated company in 2007, the parties agreed to defer our payment of a portion of the purchase price, equal to approximately $11.9 million, which was paid on February 1, 2010.
66
Table of Contents
Index to Financial Statements
Securitization facility
We are a party to a receivables purchase agreement among FleetCor Funding LLC, as seller, PNC Bank, National Association as administrator, and the various purchaser agents, conduit purchasers and related committed purchasers parties thereto, which was amended and restated for the fourth time as of October 29, 2007 and which has been amended three times since then to add or remove purchasers and to extend the facility termination date, among other things. We refer to this arrangement as the securitization facility in this prospectus. The current purchase limit under the securitization facility is $500 million and the facility termination date is February 24, 2011.
The purchasers under the securitization facility are contractually committed to purchase up to $500 million of receivables on a revolving basis through February 24, 2011. To the extent that the commercial paper markets are unavailable, the primary bank is required to provide funding up to the purchase limit at a higher interest rate.
Under a related purchase and sale agreement, dated as of December 20, 2004, and most recently amended on July 7, 2008, between FleetCor Funding LLC, as purchaser, and certain of our subsidiaries, as originators, the receivables generated by the originators are deemed to be sold to FleetCor Funding LLC immediately and without further action upon creation of such receivables. At the request of FleetCor Funding LLC, as seller, undivided percentage ownership interests in the receivables are ratably purchased by the purchasers in amounts not to exceed their respective commitments under the facility. Collections on receivables are required to be made pursuant to a written credit and collection policy and may be reinvested in other receivables, may be held in trust for the purchasers, or may be distributed. Fees are paid to each purchaser agent for the benefit of the purchasers and liquidity providers in the related purchaser group in accordance with the securitization facility and certain fee letter agreements.
The securitization facility provides for certain termination events, upon the occurrence of which the administrator may declare the facility termination date to have occurred, may exercise certain enforcement rights with respect to the receivables, and may appoint a successor servicer, among other things. Termination events include nonpayment, noncompliance with covenants, default under any indebtedness in excess of $10.0 million, the failure to maintain certain ratios related to defaults, delinquencies and dilution, change in control, failure to maintain a leverage ratio of not greater than 2.25 to 1 through December 31, 2010 and 2.00 to 1 for the periods thereafter (measured quarterly), failure to maintain an interest coverage ratio of not less than 4.00 to 1 (measured quarterly) and failure to perform under a performance guaranty. As of September 30, 2010, we were in compliance with each of the covenants under our securitization facility.
Critical accounting policies and estimates
In applying the accounting policies that we use to prepare our consolidated financial statements, we necessarily make accounting estimates that affect our reported amounts of assets, liabilities, revenue and expenses. Some of these estimates require us to make assumptions about matters that are highly uncertain at the time we make the accounting estimates. We base these assumptions and the resulting estimates on historical information and other factors that we believe to be reasonable under the circumstances, and we evaluate these assumptions and estimates on an ongoing basis. In many instances, however, we reasonably could have used different accounting estimates and, in other instances, changes in our accounting estimates could occur from period to period, with the result in each case being a material change in the financial statement presentation of our financial condition or results of operations. We refer to estimates of this type as critical accounting estimates. Our significant accounting policies are summarized in consolidated financial statements contained elsewhere in this prospectus. The critical accounting estimates that we discuss below are those that we believe are most important to an understanding of our consolidated financial statements.
67
Table of Contents
Index to Financial Statements
Revenue recognition and presentation
Revenue is derived from our merchant and network relationships as well as from customers and partners. We recognize revenue on fees generated through services to commercial fleets, major oil companies and petroleum marketers and record revenue net of the wholesale cost of the underlying products and services based on the following: (i) we are not the primary obligor in the fuel arrangement and we are not responsible for fulfillment and the acceptability of the product; (ii) we have no inventory risk, do not bear the risk of product loss and do not make any changes to the fuel or have any involvement in the product specifications; (iii) we do not have significant latitude with respect to establishing the price for fuel and (iv) the amount we earn for our services is fixed.
Through our merchant and network relationships we provide fuel, vehicle maintenance or lodging services to our customers. We derive revenue from our merchant and network relationships based on the difference between the price charged to a customer for a transaction and the price paid to the merchant or network for the same transaction. Our net revenue consists of margin on fuel sales and fees for technical support, processing, communications and reporting. The price paid to a merchant or network may be calculated as (i) the merchant’s wholesale cost of fuel plus a markup; (ii) the transaction purchase price less a percentage discount; or (iii) the transaction purchase price less a fixed fee per unit. The difference between the price we pay to a merchant and the merchant’s wholesale cost for the underlying products and services is considered a merchant commission and is recognized as an expense when the transaction is executed. We recognize revenue from merchant and network relationships when persuasive evidence of an arrangement exists, the services have been provided to the customer, the sales price is fixed or determinable and collectibility is reasonably assured. We have entered into agreements with major oil companies and petroleum marketers which specify that a transaction is deemed to be captured when we have validated that the transaction has no errors and have accepted and posted the data to our records. Revenue is recognized on lodging and transportation management services when the lodging stay or transportation service is completed.
We also derive revenue from customers and partners from a variety of program fees including transaction fees, card fees, network fees, report fees and other transaction-based fees which typically are calculated based on measures such as percentage of dollar volume processed, number of transactions processed, or some combination thereof. Such services are provided through proprietary networks or through the use of third-party networks. Transaction fees and other transaction-based fees generated from our proprietary networks and third-party networks are recognized at the time the transaction is captured. Card fees, network fees and program fees are recognized as we fulfill our contractual service obligations. In addition, we recognize revenue from late fees and finance charges. Such fees are recognized net of a provision for estimated uncollectible amounts at the time the fees and finance charges are assessed.
Accounts receivable
As described above under the heading “Securitization facility,” we maintain a $500 million revolving trade accounts receivable securitization facility. Pursuant to the terms of the securitization facility, we transfer certain of our domestic receivables, on a revolving basis, to FleetCor Funding LLC, a wholly-owned bankruptcy remote subsidiary. In turn, FleetCor Funding LLC sells, without recourse, on a revolving basis, up to $500 million of undivided ownership interests in this pool of accounts receivable to a multi-seller, asset-backed commercial paper conduit. FleetCor Funding LLC maintains a subordinated interest, in the form of over collateralization, in a portion of the receivables sold to the conduit. Purchases by the conduit are financed with the sale of highly-rated commercial paper. On February 25, 2010, we extended the term of the securitization facility to February 24, 2011.
We utilize proceeds from the sale of our accounts receivable as an alternative to other forms of debt, effectively reducing our overall borrowing costs. We have agreed to continue servicing the sold receivables for the financial
68
Table of Contents
Index to Financial Statements
institutions at market rates, which approximates our cost of servicing. We retain a residual interest in the accounts receivable sold as a form of credit enhancement. The residual interest’s fair value approximates carrying value due to its short-term nature.
FleetCor Funding LLC determines the level of funding achieved by the sale of trade accounts receivable, subject to a maximum amount. FleetCor Funding LLC retains a residual interest in the eligible receivables transferred to the trust, such that amounts payable in respect of such residual interest will be distributed to FleetCor Funding LLC upon payment in full of all amounts owed by FleetCor Funding LLC to the financial institutions.
In June 2009, the FASB issued authoritative guidance limiting the circumstances in which a financial asset may be derecognized when the transferor has not transferred the entire financial asset or has continuing involvement with the transferred asset. The concept of a qualifying special-purpose entity, or QSPE, which had previously facilitated sale accounting for certain asset transfers, is removed by this standard. This guidance is effective for us as of January 1, 2010. As a result of the adoption of such guidance, effective January 1, 2010, we consolidated our QSPE. Using the carrying amounts of the assets and liabilities of the QSPE as prescribed by ASU No. 2009-17 and any corresponding elimination of activity between the QSPE and us resulting from the consolidation on January 1, 2010, we recorded a $218 million increase in total assets, a $218 million increase in total liabilities and non-cash financing activities of $218 million. Beginning January 1, 2010, our consolidated balance sheet and consolidated statement of income no longer reflect activity related to our retained economic interests, but instead reflect activity related to our securitized accounts receivable and the corresponding securitized debt, including interest income, fees generated from late payments, provision for losses on accounts receivable, and interest expense. Interest expense and provisions for losses on accounts receivable associated with the securitized accounts receivable are no longer included as a deduction from revenues, net in the consolidated statement of income, resulting in an increase of $21.4 million in the nine months ended September 30, 2010 as compared to the same period in 2009.
The cash flows from borrowings and repayments, associated with the securitized debt, are now presented as cash flows from financing activities. Our consolidated statement of income for the nine months ended September 30, 2009 and our balance sheet as of December 31, 2009 have not been retrospectively adjusted to reflect the adoption of ASU Nos. 2009-16 and 2009-17. Therefore, current period results and balances will not be comparable to prior period amounts, particularly with regard to accounts receivable, securitization facility, provision for losses on accounts receivable, interest expense and revenues, net.
Credit risk and reserve for losses on receivables
We control credit risk by performing periodic credit evaluations of our customers. Payments from customers are generally due within 30 days of billing. We routinely review our accounts receivable balances and make provisions for probable doubtful accounts based primarily on the aging of those balances. Accounts receivable are deemed uncollectible and removed from accounts receivable and the allowance for doubtful accounts when internal collection efforts have been exhausted and accounts have been turned over to a third-party collection agency.
Impairment of long-lived assets and intangibles
We test our other long-lived assets for impairment in accordance with relevant authoritative guidance. We evaluate whether impairment indicators related to our property, plant and equipment and other long-lived assets are present. These impairment indicators may include a significant decrease in the market price of a long-lived asset or asset group, a significant adverse change in the extent or manner in which a long-lived asset or asset group is being used or in its physical condition, or a current-period operating or cash flow loss combined with a history of operating or cash flow losses or a forecast that demonstrates continuing losses associated with the use of a long-lived asset or asset group. If impairment indicators are present, we estimate the future cash flows for
69
Table of Contents
Index to Financial Statements
the asset or group of assets. The sum of the undiscounted future cash flows attributable to the asset or group of assets is compared to their carrying amount. The cash flows are estimated utilizing various projections of revenue and expenses, working capital and proceeds from asset disposals on a basis consistent with the strategic plan. If the carrying amount exceeds the sum of the undiscounted future cash flows, we determine the assets’ fair value by discounting the future cash flows using a discount rate required for a similar investment of like risk and we record an impairment charge as the difference between the fair value and the carrying value of the asset group. Generally, we perform testing of the asset group at the business-line level, as this is the lowest level for which identifiable cash flows are available.
We evaluate goodwill for impairment annually in the fourth quarter at the reporting unit level, which is one level below the operating segment level. We also test for impairment if events and circumstances indicate that it is more likely than not that the fair value of a reporting unit is below its carrying amount. If the carrying amount of the reporting unit is greater than the fair value, impairment may be present. We assess the fair value of each reporting unit for its goodwill impairment test based on an earnings multiple or an actual sales offer received from a prospective buyer, if available. Estimates critical to our fair value estimates using earnings multiples include the projected financial performance of the reporting unit and the applicable earnings multiple.
We measure the amount of any goodwill impairment based upon the estimated fair value of the underlying assets and liabilities of the reporting unit, including any unrecognized intangible assets, and estimate the implied fair value of goodwill. An impairment charge is recognized to the extent the recorded goodwill exceeds the implied fair value of goodwill.
We also evaluate indefinite-lived intangible assets (primarily trademarks and trade names) for impairment annually. We also test for impairment if events and circumstances indicate that it is more likely than not that the fair value of an indefinite-lived intangible asset is below its carrying amount. Estimates critical to our evaluation of indefinite-lived intangible assets for impairment include the discount rate, royalty rates used in our evaluation of trade names, projected average revenue growth and projected long-term growth rates in the determination of terminal values. An impairment charge is recorded if the carrying amount of an indefinite-lived intangible asset exceeds the estimated fair value on the measurement date.
Income taxes
We account for income taxes in accordance with relevant authoritative literature. Income taxes are accounted for under the asset and liability method. Deferred tax assets and liabilities are recognized for the future tax consequences attributable to differences between the financial statement carrying amounts of existing assets and liabilities and their respective tax bases. Deferred tax assets and liabilities are measured using enacted tax rates expected to apply to taxable income in the years in which those temporary differences are expected to be recovered or settled. The effect on deferred tax assets and liabilities of a change in tax rates is recognized in the period that includes the enactment date. The realizability of deferred tax assets must also be assessed.
The ultimate realization of deferred tax assets is dependent upon the generation of future taxable income during the periods in which the associated temporary differences became deductible. A valuation allowance must be established for deferred tax assets that are not believed to more likely than not be realized in the future. We include any estimated interest and penalties on tax-related matters in income taxes payable and income tax expense.
We do not provide deferred taxes for the undistributed earnings of our foreign subsidiaries that are considered to be indefinitely reinvested outside of the United States in accordance with relevant authoritative literature. If in the future these earnings are repatriated to the United States, or if we determine that the earnings will be remitted in the foreseeable future, additional tax provisions may be required.
70
Table of Contents
Index to Financial Statements
On January 1, 2007, we retrospectively adopted the provisions of relevant authoritative literature with respect to uncertainty in income taxes. This guidance clarifies the accounting for uncertainty in income taxes recognized in an entity’s financial statements and prescribes threshold and measurement attributes for financial statement disclosure of tax positions taken or expected to be taken on a tax return. Under the relevant authoritative literature, the impact of an uncertain income tax position on the income tax return must be recognized at the largest amount that is more likely than not to be sustained upon audit by the relevant taxing authority. An uncertain income tax position will not be recognized if it has less than a 50% likelihood of being sustained.
As a result of adopting the provisions of the authoritative literature regarding uncertain tax positions, we recognized a reduction in shareholders’ equity of $0.8 million on January 1, 2007 reflecting the cumulative effect of adoption. This adjustment resulted from changes in the amount of tax benefits related to uncertain tax positions and the accrual of potential interest and penalties on those uncertain tax positions.
Business combinations
We have accounted for business combinations under the purchase method of accounting. The cost of each acquired business is allocated to the assets acquired and liabilities assumed based on their estimated fair values. These estimates are revised during an allocation period as necessary when, and if, information becomes available to further define and quantify the value of the assets acquired and liabilities assumed. The allocation period does not exceed one year from the date of the acquisition. To the extent additional information to refine the original allocation becomes available during the allocation period, the allocation of the purchase price is adjusted. Should information become available after the allocation period, those items are included in operating results. The direct costs of the acquisition are recorded as operating expenses in 2009. Prior to 2009, the costs of an enterprise acquired in a business combination included the direct cost of the acquisition. A portion of our 2008 and earlier acquisitions include additional contingent consideration related to future earnouts based on the growth of the market. When the contingencies are resolved and additional consideration is distributable, we will record the consideration issued as additional cost of the acquired company, or goodwill. The operating results of entities acquired are included in our consolidated statements of operation from the completion date of the applicable transaction. Goodwill represents the excess of the purchase price over the fair value of the tangible and intangible assets acquired and any liabilities assumed.
Stock-based compensation
We account for employee stock options and restricted stock in accordance with relevant authoritative literature, which requires companies to recognize compensation cost for stock options and other stock-based awards based on the estimated fair value as measured on the grant date. We have selected the Black-Scholes model for estimating the grant date fair value of share-based payments. Stock-based compensation cost is measured at the grant date based on the value of the award and is recognized as expense over the requisite service period based on the number of awards for which the requisite service is expected to be rendered. For performance-based restricted stock awards, we must also make assumptions regarding the likelihood of achieving performance goals. If actual results differ significantly from these estimates, stock-based compensation expense and our results of operations could be materially affected.
In connection with making our fair value estimates related to our stock option and restricted stock grants, we considered various factors including third-party equity transactions and certain commonly used valuation techniques. We sold convertible preferred stock to third parties in 2005, 2006 and 2009. In addition, in 2007 we repurchased common stock and preferred stock from the holders at a negotiated price, which we believe represented fair value. These third-party transactions served as a basis for determining the fair value of our common stock at various dates. In situations where we sold preferred stock that included conversion and dividend features, we considered such features in those instruments and the fact that such instruments could not
71
Table of Contents
Index to Financial Statements
be freely traded in determining a fair value for our common stock. Generally, we concluded that the fair value of our common stock was 10% to 25% less than the preferred stock at the date of such third-party transactions due to the features attributable to the preferred stock. In periods prior to third-party transactions, and in intervening periods subsequent to the third-party transactions, we utilized various earnings and revenue multiples to estimate the fair value of our common stock or to serve as an additional factor in determining fair value. Finally, we used information we obtained related to our acquisitions and the related determination of purchase prices for these acquisitions (which were generally based on earnings multiples) as additional data to help determine the fair value of our equity instruments.
We have continued to enhance our value through acquisitions and organic growth. Our third-party investors made their investments with the expectation that some form of liquidity event would occur in the future at values higher than their initial investments. We have continued to evaluate and adjust the estimated fair value of our common stock based on our acquisition strategy, organic growth, changes in management and other environmental factors. From June 2006 to December 2009, the estimated fair value of our common stock (as adjusted for the stock split), as determined based on the factors noted above, increased from $6.55 per share to $18 per share and from April 2009 to December 2009, the fair value of our common stock increased from $10 per share to $18 per share. The factors we considered in connection with estimating the fair value of our common stock for the period from April 2009 through December 2009 were the consummation of our acquisitions of CLC Group, Inc. and ReD Fuel Cards (Europe) Limited in April 2009 and August 2009, respectively. These acquisitions—coupled with modest organic growth—contributed to increasing revenues and profitability measures during this period. Additionally, in December 2009, we began to consider certain strategic alternatives, including a liquidity event, which resulted in us having further discussions with third parties regarding our enterprise value. Based on these factors we estimated the fair value of our common stock had increased significantly during the period from April 2009 through December 2009. The mid-point of the price range of this offering set forth on the cover page of this prospectus is expected to be higher (as adjusted for the stock split) than our most recent stock option grant which was granted in September 2010 at $20 per share. Given the timing of this offering, we conclude that our estimate of the fair value of our common stock was reasonable in light of various market conditions present at the date of grant.
Recent accounting pronouncements
Off balance sheet arrangements
We utilize an off-balance sheet arrangement in the ordinary course of business to finance a portion of our accounts receivable. Our off-balance sheet activity utilizes a qualified special-purpose entity, or QSPE, in the form of a limited liability company. The QSPE raises funds by issuing debt to third-party investors. The QSPE holds trade accounts receivable whose cash flows are the primary source of repayment for the liabilities of the QSPE. Investors only have recourse to the assets held by the QSPE. Our involvement in these arrangements takes the form of originating accounts receivable and providing servicing activities.
In June 2009, the FASB issued authoritative guidance limiting the circumstances in which a financial asset may be derecognized when the transferor has not transferred the entire financial asset or has continuing involvement with the transferred asset. The concept of a qualified special-purpose entity, which had previously facilitated sale accounting for certain asset transfers, is removed by this standard. This guidance was effective for us as of January 1, 2010. As a result of the adoption of such guidance, effective January 1, 2010, we will consolidate the QSPE and the securitization of accounts receivable related to the QSPE will be accounted for as a secured borrowing rather than as a sale. Accordingly, we will record accounts receivable and short-term debt related to the securitization facility as assets and liabilities on our balance sheet. In addition, subsequent to the adoption, our statements of income will no longer include securitization activities in revenue. Rather, we will report provision for bad debts and interest expense associated with the debt securities issued by the QSPE.
72
Table of Contents
Index to Financial Statements
As a result of the implementation of this guidance, at September 30, 2010, we had $167 million of accounts receivable and short-term debt on our balance sheet. See “Note 2 – Summary of significant accounting policies” for further details.
Market risk
Foreign currency risk
Our International segment exposes us to foreign currency exchange rate changes that can impact translations of foreign-denominated assets and liabilities into U.S. dollars and future earnings and cash flows from transactions denominated in different currencies. Revenue from our International segment was 35.8%, 39.8%, 38.9% and 33.0% of consolidated revenue for the years ended December 31, 2009, 2008, and 2007 and the nine months ended September 30, 2010, respectively. We measure foreign currency exchange risk based on changes in foreign currency exchange rates using a sensitivity analysis. The sensitivity analysis measures the potential change in earnings based on a hypothetical 10% change in currency exchange rates. Exchange rates and currency positions as of December 31, 2009 were used to perform the sensitivity analysis. Such analysis indicated that a hypothetical 10% change in foreign currency exchange rates would have increased or decreased consolidated pretax income during the year ended December 31, 2009 by approximately $5.4 million had the U.S. dollar exchange rate increased or decreased relative to the currencies to which we had exposure. When exchange rates and currency positions as of December 31, 2008 and 2007 were used to perform this sensitivity analysis, the analysis indicated that a hypothetical 10% change in currency exchange rates would have increased or decreased consolidated pretax income for the years ended December 31, 2008 and 2007 by approximately $7.7 million and $2.6 million, respectively.
Interest rate risk
We are exposed to changes in interest rates on our cash investments and debt. We invest our excess cash either to pay down our securitization facility debt or in securities that we believe are highly liquid and marketable in the short term. These investments are not held for trading or other speculative purposes. Under the 2005 Credit Facility, we have a syndicated $300.0 million term loan agreement with a syndicate of term loan B investors in the United States. The term loan bears interest, at our election, at the prime rate or LIBOR plus a margin based on our leverage position. As of September 30, 2010, the interest rate on the term loan was LIBOR plus 2.25%. The term loan expires in April 2013.
Under the 2005 Credit Facility, we also have a $50 million unsecured revolving credit facility with a syndicate of banks based in the United States and Europe. The facility expires in April 2012, and borrowings bear a variable interest rate based at the prime rate or LIBOR plus a margin that varies according to our leverage position. As of September 30, 2010, there were no borrowings on this facility.
In addition, we have an $83.8 million term loan under our CCS Credit Facility. This term loan bears interest on a base rate, PRIBOR, plus a margin and mandatory cost.
Based on the amounts and mix of our fixed and floating rate debt (exclusive of our asset securitization facility) at December 31, 2009 and December 31, 2008, if market interest rates had increased or decreased an average of 100 basis points, after considering the effect of our interest rate swap, our interest expense would have changed by $1.8 million and $1.7 million, respectively. We determined these amounts by considering the impact of the hypothetical interest rates on our borrowing costs and interest rate swap agreement. These analyses do not consider the effects of changes in the level of overall economic activity that could exist in such an environment.
73
Table of Contents
Index to Financial Statements
Fuel price risk
Our fleet customers use our products and services primarily in connection with the purchase of fuel. Accordingly, our revenue is affected by fuel prices, which are subject to significant volatility. A decline in retail fuel prices could cause a change in our revenue from several sources, including fees paid to us based on a percentage of each customer’s total purchase. Changes in the absolute price of fuel may also impact unpaid account balances and the late fees and charges based on these amounts. The impact of changes in fuel price is somewhat mitigated by our agreements with certain merchants, where the price paid to the merchant is equal to the lesser of the merchant’s cost plus a markup or a percentage of the transaction purchase price. We do not enter into any fuel price derivative instruments.
Fuel-price spread risk
From our merchant and network relationships, we derive revenue from the difference between the price charged to a fleet customer for a transaction and the price paid to the merchant or network for the same transaction. The price paid to a merchant or network is calculated as the merchant’s wholesale cost of fuel plus a markup. The merchant’s wholesale cost of fuel is dependent on several factors including, among others, the factors described above affecting fuel prices. The fuel price that we charge to our customer is dependent on several factors including, among others, the fuel price paid to the fuel merchant, posted retail fuel prices and competitive fuel prices. We experience fuel-price spread contraction when the merchant’s wholesale cost of fuel increases at a faster rate than the fuel price we charge to our customers, or the fuel price we charge to our customers decreases at a faster rate than the merchant’s wholesale cost of fuel. Accordingly, if fuel-price spreads contract, we may generate less revenue, which could adversely affect our operating results. The impact of volatility in fuel spreads is somewhat mitigated by our agreements with certain merchants, where the price paid to the merchant is equal to the lesser of the merchant’s cost plus a markup or a percentage of the transaction purchase price.
Contractual obligations
The table below summarizes the estimated dollar amounts of payments under contractual obligations identified below as of December 31, 2009 for the periods specified:
| (in millions) | Payments due by period (a) | |||||||||||||||||||
| Total | Less than 1 year |
1-3 |
3-5 |
More than |
||||||||||||||||
| Operating leases |
$ | 16.5 | $ | 5.3 | $ | 8.0 | $ | 2.8 | $ | 0.4 | ||||||||||
| 2005 Credit Facility |
276.3 | 3.0 | 6.0 | 6.0 | 261.3 | |||||||||||||||
| CCS Credit Facility |
61.5 | 7.0 | 14.0 | 40.5 | — | |||||||||||||||
| Interest rate swap |
6.4 | 6.4 | — | — | — | |||||||||||||||
| Seller financing notes |
12.8 | 12.3 | 0.5 | — | — | |||||||||||||||
| Securitization facility (b) |
223.0 | — | 223.0 | — | — | |||||||||||||||
| Total |
$ | 596.5 | $ | 34.0 | $ |
251.5 |
|
$ |
49.3 |
|
$ |
261.7 |
| |||||||
| (a) | Deferred income tax liabilities as of September 30, 2010 were approximately $84.8 million. Refer to Note 11 to our audited consolidated financial statements. This amount is not included in the total contractual obligations table because we believe this presentation would not be meaningful. Deferred income tax liabilities are calculated based on temporary differences between the tax bases of assets and liabilities and their respective book bases, which will result in taxable amounts in future years when the liabilities are settled at their reported financial statement amounts. The results of these calculations do not have a direct connection with the amount of cash taxes to be paid in any future periods. As a result, scheduling deferred income tax liabilities as payments due by period could be misleading, because this scheduling would not relate to liquidity needs. |
| (b) | As further described in Footnote 2, Recent Accounting Pronouncements, in the notes to condensed consolidated financial statements effective January 1, 2010 consolidated the special-purpose entity utilized in its securitization facility. As a result, the Company now includes securitized debt. We have reflected this securitized debt as if we had consolidated the special-purpose entity as of December 31, 2009 above. |
74
Table of Contents
Index to Financial Statements
Overview
FleetCor is a leading independent global provider of specialized payment products and services to commercial fleets, major oil companies and petroleum marketers. We serve more than 530,000 commercial accounts in 18 countries in North America, Europe, Africa and Asia, and we had approximately 2.5 million commercial cards in use during the month of December 2009. Through our proprietary payment networks, our cards are accepted at approximately 83,000 locations in North America and internationally. In 2009, we processed approximately $14 billion in purchases on our proprietary networks and third-party networks. We believe that our size and scale, geographic reach, advanced technology and our expansive suite of products, services, brands and proprietary networks contribute to our leading industry position.
We provide our payment products and services in a variety of combinations to create customized payment solutions for our customers and partners. Our payment programs enable businesses to better manage and control employee spending and provide card-accepting merchants with a high volume customer base that can increase their sales and customer loyalty. In order to deliver our payment programs and services and process transactions, we own and operate six proprietary “closed-loop” networks through which we electronically connect to merchants and capture, analyze and report customized information. We also use third-party networks to deliver our payment programs and services in order to broaden our card acceptance and use. To support our payment products, we also provide a range of services, such as issuing and processing, as well as specialized information services that provide our customers with value-added functionality and data. Our customers can use this data to track important business productivity metrics, combat fraud and employee misuse, streamline expense administration and lower overall fleet operating costs.
We market our payment products directly to a broad range of commercial fleet customers, including vehicle fleets of all sizes and government fleets. Among these customers, we provide our products and services predominantly to small and medium commercial fleets. We believe these fleets represent an attractive segment of the global commercial fleet market given their relatively high use of less efficient payment products, such as cash and general purpose credit cards. We also manage commercial fleet card programs for major oil companies, such as British Petroleum (BP) (including its subsidiary Arco), Chevron and Citgo, and over 800 petroleum marketers. These companies collectively maintain hundreds of thousands of end-customer relationships with commercial fleets. We refer to these major oil companies and petroleum marketers with whom we have strategic relationships as our “partners.”
FleetCor benefits from an attractive business model, which is characterized by our recurring revenue, significant operating margins and low capital expenditure requirements. Our revenue is recurring in nature because we generate fees every time a card is used, customers rely on our payment programs to control their own recurring operating expenses and our partners and customers representing a substantial portion of revenue enter into multi-year service contracts. Our highly-scalable business model creates significant operating efficiencies, which enable us to generate strong cash flow that may be used to repay indebtedness, make acquisitions and fund the future growth of our business. In addition, this business model enables us to continue to grow our business organically without significant additional capital expenditures.
We believe the fleet card industry is positioned for further consolidation because it is served by a fragmented group of suppliers, few with the size and scale to adequately invest to keep pace with industry advancements. For example, there is significant time and investment required to establish the “closed-loop” networks and technology solutions that address the diverse requirements of customers and partners across various geographic markets. We believe this dynamic will continue to shift market share to larger scale vendors with advanced technology platforms and drive further consolidation globally.
75
Table of Contents
Index to Financial Statements
FleetCor’s predecessor company was organized in the United States in 1986. In 2000, our current chief executive officer joined us and we changed our name to FleetCor Technologies, Inc. Since 2000, we have grown significantly through a combination of organic initiatives, product and service innovation and over 40 acquisitions of businesses and commercial account portfolios. We have grown our revenue from $30.7 million in 2001 to $381.3 million on a managed basis in 2009, representing a compound annual growth rate of 37.0%. In 2009, we generated 35.8% of our revenue from our international operations, compared to none in 2005. For the years ended December 31, 2005, 2006, 2007, 2008 and 2009, our consolidated revenue was $143.3 million, $186.2 million, $264.1 million, $341.1 million and $354.1 million, respectively. In the same periods, we generated operating income of $59.0 million, $71.8 million, $105.8 million, $152.5 million and $146.0 million, respectively. In addition, we have grown our net income from a net loss of $12.6 million in 2000 to net income of $89.1 million in 2009.
Industry background
The electronic payments industry is a large and fast growing sector that is benefiting from favorable trends around the world
The electronic payments industry has grown significantly over the past 50 years as card-based payment products, such as credit and debit cards, have benefited from favorable trends. These products have increasingly gained acceptance by merchants, usage by consumers and adoption by businesses and governments around the world because they offer faster, safer and often lower cost alternatives to traditional, paper-based payment methods. Packaged Facts, a research firm, estimates that total global card purchase volumes reached $6.8 trillion in 2009, growing at a compound annual growth rate of 10.8% from 2005 to 2009.
Commercial cards provide specialized capabilities and are among the fastest growing segments of the electronic payments industry
Given the high degree of payment card usage globally, various types of business-specific payment products are being used increasingly in the marketplace. Commercial card products are typically charge cards, which are paid in full every month and provide businesses with control over the types of authorized purchases, integration with accounting systems, detailed reporting, and the ability to incorporate and transmit additional data with a payment transaction. Packaged Facts estimates that total global commercial card purchase volumes reached $916.5 billion in 2009, growing at a compound annual growth rate of 8.2% from 2005 to 2009, and will reach $1.5 trillion in 2014, growing at a compound annual growth rate of 10.6% from 2009 to 2014. Some of the more common commercial card applications and services include:
| • | Purchasing cards—used for corporate procurement spending |
| • | Corporate cards—used for travel and entertainment expenses |
| • | Small-business credit and debit cards—used for general purpose spending |
| • | Prepaid commercial cards—used for rewards, incentives, payroll, healthcare and other pre-funded expenses |
| • | Fleet cards—used to purchase fuel and for other commercial fleet related expenses and provide specialized, value-added information services and controls |
| • | Lodging cards—used to purchase lodging and related services |
Fleet cards typically provide differentiated services that help commercial fleet operators operate their businesses more effectively
Fleet cards are specialized commercial cards that fleet operators provide to their drivers to pay for fuel, maintenance, repairs and other approved purchases. Fleet cards typically provide differentiated services, which
76
Table of Contents
Index to Financial Statements
include significant cost controls (managed through business rules implemented at the point of sale) and access to “level 3” data regarding transactions, such as the amount of the expenditure, the identification of the driver and vehicle, the odometer reading, the identity of the fuel or vehicle maintenance provider and the items purchased. These services enable commercial fleet operators to choose which products and services may be purchased using these cards and help prevent unauthorized spending. In addition, fleet cards typically provide commercial fleet operators with other valuable information services and reporting tools—such as fleet tracking and mileage and maintenance trends—which provide commercial fleet operators even greater control over their fleets, employees and expenses.
In order to provide fleet cards and related services, fleet card vendors contract with fuel retailers and other merchants to accept their cards, either directly or indirectly through a third party. Fleet card vendors typically process transactions for these merchants using specialized card-processing platforms and proprietary “closed-loop” networks. Closed-loop networks connect the fleet card vendor directly with each merchant and provide significant functionality and control. Fleet card vendors also offer products through “open-loop” payment networks, such as the MasterCard network, that connect to merchants through acquiring banks. These cards can provide broader acceptance, but may provide less control over functionality and pricing than some proprietary, closed-loop network card products.
Fleets represent a large customer base around the world
Fleets are composed of one or more vehicles, including automobiles, vans, SUVs, trucks and buses, used by businesses and governments. Fleets typically are categorized by the number of vehicles in the fleet and by the type of fleet. We divide the fleet market into the following five categories: small commercial fleets (1-10 vehicles), medium commercial fleets (11-150 vehicles), large commercial fleets (over 150 vehicles), over the road fleets (which include long-haul trucks that travel across long distances) and government fleets (which are owned and operated by governments). Based on our analysis of data from a variety of sources, we believe small and medium commercial fleets represent our greatest opportunity for growth since large commercial fleets are more likely to currently utilize fleet cards while small and medium fleets often utilize less efficient payment products (such as cash and general purpose credit cards).
| • | The United States market—Packaged Facts estimates that there were approximately 41.9 million fleet vehicles in the United States in 2008 and that the fuel consumed by these vehicles in 2008 totaled approximately 55.9 billion gallons. We believe small, medium, large and government fleets in the United States represent a significant market opportunity for growth. Packaged Facts estimates that total U.S. closed-loop fleet card purchase volumes reached $50.8 billion in 2009, growing at a compound annual growth rate of 6.0% from 2005 to 2009. Based on research by Packaged Facts, 35% of U.S. fleet vehicle fuel volume in 2009 was purchased utilizing closed-loop fleet cards. |
| • | The European market—We believe the European market is the largest market outside the United States. Based on our analysis of fleet vehicle data from several third-party sources, we believe there were approximately 68 million fleet vehicles in 30 European and Eurasian countries in 2007 (2007 representing the most recent year common to each of these sources). Datamonitor, a research firm, estimates that the total amount of fuel sold on commercial fuel cards in 25 European countries reached approximately 67 billion litres in 2009, with approximately 48 billion litres being sold on commercial fuel cards issued by twenty major oil companies. Based on our analysis of data available for several of the largest European countries, including France, Germany, Italy, the Netherlands, Spain and the United Kingdom, we estimate that during 2005, approximately 59% of fleet vehicle fuel volume in Europe was purchased with some form of fleet card product. |
77
Table of Contents
Index to Financial Statements
| • | The Latin American and Asian markets—There is less data available on the Latin American and Asian fleet card markets; however, we believe, based on information available to us from a variety of sources, that commercial fleets in these markets will likely represent a significant, long-term growth opportunity given the levels of commercial card penetration in these markets and our belief in the potential for economic growth in these markets. According to the June 2010 BP Statistical Review of World Energy, total world consumption of oil was approximately 3.9 billion metric tons in 2009, with consumption outside of the United States and developed European Markets comprising approximately 62%, with emerging markets comprising approximately 43%, and consumption in Asia and Latin America comprising approximately 45% of world consumption. |
Industry characteristics provide an attractive growth opportunity
The fleet card industry began to develop in the 1980s as a variety of fleet card acceptance networks were developed to address the needs of different commercial fleet customers. For example, truck stop networks were built to meet the needs of over the road fleets, as these fueling locations generally have the amenities, such as high canopies, high-speed diesel pumps, dining services and shower facilities, to accommodate heavy goods vehicles and their operators. “Universal” networks, formed largely through brand-wide card acceptance agreements with major oil companies, were established to meet the broader acceptance needs of large national account fleets. Cardlock networks, which utilize unattended commercial fueling locations, were developed to provide a broader network solution to fleets, typically local construction or industrial service companies. Network operators also developed varying technologies that provided specific features and functionality to address the needs of customers in distinct segments.
In the 2000s, the fleet card industry began to consolidate and a few, larger vendors emerged with the network breadth and technical capabilities to address larger and more diverse customer bases and geographic markets. Despite this trend, the fleet card industry is still served by a fragmented group of participants with varying distribution models, including oil companies, petroleum marketers, third-party independent fleet card issuers and network operators, transaction processors and software service providers. For many of these industry participants, fleet cards are not a core component to their businesses and we believe few have made the investments required to keep pace with industry advancements. As a result, we believe there is a significant amount of aging technology, legacy systems and “dated” business practices within the fleet card industry, which we believe will continue to shift market share to larger scale vendors with advanced technology platforms and drive further consolidation globally.
Given the generally rising levels of fuel prices and the continued increase in the number and size of commercial fleets, we believe the use of fleet cards will continue to increase around the world. In addition, we believe that penetration rates will continue to increase given the moderate penetration of fleet card products, particularly in the small and medium fleet sector and some international markets, as well as the cost-effective nature and advanced functionality of these products. We believe increasing penetration could accelerate the growth of the fleet card sector relative to alternative payment methods, and we believe larger scale participants may be able to grow at a faster rate than the sector due to the fragmented nature of the industry.
We believe the market’s development and consolidation have created significant barriers to entry because, to achieve meaningful scale, new participants will need to provide technology platforms and product solutions that address the diverse requirements of commercial fleet customers, major oil companies and petroleum marketers, in certain cases across broad geographic markets. As a result of this past and expected future consolidation, we believe there will be an increasingly limited number of vendors that can serve the fleet card market effectively and (given the apparent lack of investment in global operations by other independent fleet card providers) even fewer with the ability to provide products and network services on a global scale.
78
Table of Contents
Index to Financial Statements
Our competitive strengths
We believe our competitive strengths include the following:
| • | Global leadership. We are a leading independent global provider of specialized commercial payment products and services to fleets, major oil companies and petroleum marketers. We provide our products and services to more than 530,000 commercial accounts with approximately 2.5 million commercial cards in use in 18 countries in North America, Europe, Africa and Asia. We believe that our deep and diverse relationships, geographic reach, strong brands and scale contribute to our leading industry position. Through our customer and strategic relationships, we gain valuable insight into trends in the marketplace, which allows us to identify market opportunities, develop targeted offerings and adapt our business practices to meet specific customer and partner needs. Our international presence diversifies our revenue base and gives us access to new, less- penetrated markets. We believe that our strong brand recognition increases card acceptance, drives usage of our proprietary networks and presents opportunities for future strategic relationships. Our size and scale enable us to make significant investments in technology and systems infrastructure. We seek to leverage the scale, geographic reach and diversity of our business to systematically analyze performance, develop better business models and transplant best practices throughout our company. We believe that we maintain a leading industry position and compare favorably to other independent fleet card providers based on the number of accounts served, employees, cards in use and revenue. |
| • | Broad distribution capabilities. We target new customers across different markets by using multiple distribution channels and tailored sales and marketing efforts designed to address the unique characteristics of individual market segments. In 2009, we added approximately 47,000 new commercial accounts directly through our own sales efforts and approximately 25,000 additional commercial accounts via the sales efforts of our strategic relationships. Our strategic relationships with oil companies and petroleum marketers allow us to add new commercial accounts with little incremental sales costs. To target small fleets, we leverage scalable, low-cost channels, including our partners’ sales efforts, numerous search-engine-optimized marketing websites and marketing at the point of sale. We target medium-sized fleets with our direct marketing, telesales and field sales channels. We serve our largest customers with a national accounts group that specializes in serving the complex needs of these customers. By targeting and effectively marketing our products to several different customer segments, we are able address a variety of growth opportunities and diversify our revenue base. |
| • | Proprietary closed-loop networks. We operate six proprietary closed-loop networks which, as of December 31, 2009, served approximately 83,000 acceptance locations in North America and internationally. In 2009, we processed purchases of over $14 billion of fuel through our proprietary and third-party networks. During the twelve months ended September 2010, we processed purchases of approximately 3.3 billion gallons of fuel in North America and 1 billion gallons of fuel internationally, with the majority of international volume originating in Europe. Our proprietary networks require fleet operators to direct cardholder traffic to our merchant locations and concentrate cardholder activity. We believe this allows us to negotiate better economic terms for card acceptance than are typical of our industry. Many of our networks have been built over long periods of time, with acceptance negotiated directly with individual merchants operating local sites. We believe that the significant time and investment required to establish a large-scale network with mass merchant acceptance makes our model extremely difficult to replicate and creates a significant barrier to entry in our industry. Because of our long operating history in many local markets, our networks have significant brand recognition and a longstanding customer base, which drives cardholder usage and merchant acceptance. |
| • | Advanced, reliable technology systems. We operate proprietary and industry-leading technology systems that use modern, scalable and standardized architecture. Our business models and best practices are codified in our technology systems, allowing us to take advantage of revenue-enhancing and cost-saving opportunities across our different businesses and geographies. The highly adaptable and configurable design of our systems |
79
Table of Contents
Index to Financial Statements
| allows us to add and enhance system functionality quickly and cost-effectively. We can offer customized product features, introduce new products and enter new markets without large scale redevelopment or disruption in our operations. Our infrastructure can flexibly support growth in transaction volume, conversions of large proprietary fleet card programs and the addition of new strategic relationships with low incremental operating cost and capital investment. We have a demonstrated record of transforming legacy systems of acquired businesses to achieve our scalability, security and reliability standards. Our fault-tolerant and highly secure data centers ensure continuous transaction processing, settlement and customer service, enabling us to establish greater trust among major oil companies and petroleum marketers. |
| • | Superior products and services. We provide products and services tailored to the specific needs of our fleet customers, which we believe makes them more attractive than alternative payment methods such as cash, house accounts and general purpose credit cards, as well as many other fleet card products. Our products and services provide advantages over traditional forms of payment by capturing vehicle-specific and point-of-sale transaction information—such as odometer readings and amount and type of fuel purchased—which enable fleet operators to monitor and control fuel spending. We believe we are also able to achieve a competitive advantage over many other fleet card vendors by designing products targeting the unique needs of our customers and partners in different markets. For example, the GlobalFleetNet platform has emerged as a leading offering for pan-European oil companies and petroleum marketers because it provides an “end-to-end” (encompassing issuing, processing and network services) payment services platform incorporating the multiple languages, currencies and tax regimes in the region. We believe that the greater adoption and higher customer loyalty resulting from the functional advantages of our products contribute to the growth and stability of our business. |
| • | Strong execution capabilities. Our leadership team has a long and demonstrated track record of growing our business and has generated revenue growth (on a managed basis) at a compound annual growth rate of more than 37.0% from 2001 to 2009. We have achieved our growth through a strategy combining operational initiatives, strategic relationships and acquisitions. We have grown our revenue organically by enhancing our sales and marketing channels and evolving our pricing strategies as well as by introducing new products and services. In the past five years, we have forged several important strategic relationships with major oil companies, including British Petroleum (BP) (including its subsidiary, Arco), Chevron, and Citgo. We have a successful track record of integrating business practices, operations, technology and corporate functions of acquired businesses, and have created value from the resulting synergies, operational improvements and cross-selling opportunities. |
Our growth strategy
Our strategy is to grow our revenue and profits by further penetrating our target markets, expanding our product and service offerings, entering new geographic markets and acquiring companies that meet our strategic criteria. The key elements of our growth strategy are to:
| • | Penetrate our target markets further. We intend to expand our presence in target markets by adding more customers, cross-selling additional products and services to existing customers, entering into additional strategic relationships and making acquisitions. To target small-to-medium fleets, we will continue to invest in cost-effective distribution channels such as direct marketing, third-party agents, internet and telemarketing, including both in-house and outsourced telemarketing. We will also seek to leverage our strategic relationships with major oil companies and petroleum marketers to attract small and medium fleet customers. To further penetrate the medium-to-large fleet market, we will continue to invest in our field sales force. In addition, we also intend to attract new customers by providing enhanced customization of our card programs. We recognize the value of large institutional relationships and seek to expand our strategic relationships with fleet leasing companies, corporate and small-business card issuers and automotive manufacturers. |
80
Table of Contents
Index to Financial Statements
| • | Expand our products and services. We will seek to grow revenue by introducing new product features and functionality to our fleet card products, including additional maintenance, lodging and travel and entertainment capabilities. We aim to extend our network offerings in order to help major oil companies and petroleum marketers compete more effectively with other fleet cards and alternative payment methods. For example, we plan to offer extended network products, such as a co-branded MasterCard product, to major oil companies and petroleum marketers. We will continue to expand the servicing model for relationships with local and regional petroleum marketers to include additional services such as issuing and network services. We will also continue to market our telematics solutions and other fleet monitoring services to fleet customers. |
| • | Enter new geographic markets. We intend to continue expanding in areas of Europe and the United States where we currently do not have a significant presence. We are also evaluating other opportunities in markets we believe to be under-penetrated, such as Latin America and parts of Asia. We intend to enter these markets through a combination of strategic relationships with global oil companies and petroleum marketers and acquisitions. |
| • | Pursue growth through strategic acquisitions. We have a proven track record of growth through acquisitions of companies that meet our strategic criteria. Since 2002, we have completed over 40 acquisitions of companies and commercial account portfolios. A large portion of our historic growth internationally has been achieved through strategic acquisitions, including the acquisitions of our CCS and Petrol Plus Region networks. In certain international markets, where fleet card penetration is below levels observed in the United States, we will seek opportunities to increase our customer base through further strategic acquisitions. We also will consider acquisition targets that will provide related services to our fleet customers. |
Our products and services
We sell a range of customized fleet and lodging payment programs directly and indirectly through partners, such as major oil companies and petroleum marketers. We provide our customers with various card products that typically function like a charge card to purchase fuel, lodging and related products and services at participating locations. We support these cards with specialized issuing, processing and information services that enable us to manage card accounts, facilitate the routing, authorization, clearing and settlement of transactions, and provide value-added functionality and data including customizable card-level controls and productivity analysis tools. Depending on our customer’s and partner’s needs, we provide these services in a variety of outsourced solutions ranging from a comprehensive “end-to-end” solution (encompassing issuing, processing and network services) to limited back office processing services. In addition, we offer a telematics solution in Europe that combines global positioning, satellite tracking and other wireless technology to allow fleet operators to monitor the capacity utilization and movement of their vehicles and drivers. Approximately 10% of our revenue during the nine months ended September 30, 2010 came from our lodging and telematics products.
Networks
In order to deliver our payment programs and services, we own and operate six proprietary closed-loop networks in North America and internationally. In other geographies we utilize the networks of our major oil and petroleum marketer partners. Our networks have well-established brands in local markets and proprietary technology that enable us to capture, transact, analyze and report value-added information pertinent to managing and controlling employee spending. Our networks include:
North American proprietary closed-loop networks
| • | Fuelman network—our primary proprietary fleet card network in the United States. We have negotiated card acceptance and settlement terms with over 11,000 individual merchants, providing the Fuelman network with nearly 31,000 fueling sites and nearly 24,000 maintenance sites across the country. |
81
Table of Contents
Index to Financial Statements
| • | Corporate Lodging Consultants network (CLC)—our proprietary lodging network in the United States and Canada. We have negotiated card acceptance and settlement terms with over 10,000 individual merchants, providing the CLC network with over 16,000 hotels across the United States and Canada. |
| • | Commercial Fueling Network (CFN)—our “members only” unattended fueling location network in the United States and Canada. The CFN network is composed of approximately 2,800 fueling sites, each of which is owned by a CFN member, and the majority of which are unattended cardlock facilities. The CFN membership base is comprised of approximately 280 independent petroleum marketers. Our members join CFN to provide network access to their fleet customers and benefit from fleet card volume generated by our other members’ fleet customers fueling at their locations. |
International proprietary closed-loop networks
| • | Keyfuels network—our primary proprietary fleet card network in the United Kingdom. We have negotiated card acceptance and settlement terms with approximately 490 individual merchants, providing the Keyfuels network with over 1,400 fueling sites. |
| • | CCS network—our primary proprietary fleet card network in the Czech Republic and Slovakia. We have negotiated card acceptance and settlement terms with several major oil companies on a brand-wide basis, including Agip, Benzina, OMV and Shell, and with approximately 530 other merchants, providing the CCS network with over 2,500 fueling sites. |
| • | Petrol Plus Region (PPR) network—our primary proprietary fleet card network in Russia, Poland, Ukraine, Belarus, Lithuania, Estonia and Latvia. We have negotiated card acceptance and settlement terms with over 640 individual merchants, providing the PPR network with approximately 6,000 fueling sites across the region. |
Third-Party networks
In addition to our proprietary “closed-loop” networks, we also utilize various third-party networks to deliver our payment programs and services. These networks include:
| • | MasterCard network—In the United States, we issue corporate cards that utilize the MasterCard payment network, which includes 165,000 fuel sites and 400,000 maintenance locations across the country. Our co-branded MasterCard corporate cards, which represent less than 10% of our total cards in use during the month of December 2010, have additional purchasing capabilities and can be accepted at over 27 million locations worldwide. We market these cards to customers who require card acceptance beyond our proprietary merchant locations. The MasterCard network delivers the ability to capture value-added transaction data at the point-of-sale and allows us to provide customers with fleet controls and reporting comparable to those of our proprietary fleet card networks. The revenue generated from our MasterCard products for the years ended December 31, 2006, 2007, 2008, 2009, and the twelve months ended September 30, 2010 equaled $2.4 million, $6.4 million, $13.0 million, $16.9 million, and $27.1 million, respectively. |
| • | Major oil and fuel marketer networks—The proprietary networks of branded locations owned by our major oil and petroleum marketer partners in both North America and internationally are generally utilized to support the proprietary, branded card programs of these partners. |
| • | UTA network—UNION TANK Eckstein GmbH & Co. KG (UTA) operates a network of over 43,000 fleet card-accepting locations across 38 countries throughout Europe, including more than 28,000 fueling sites. The UTA network is generally utilized by European transport companies that travel between multiple countries. |
| • | ReD network—Retail Decisions Limited (ReD) operates a network of over 3,700 fleet card-accepting fueling sites across 16 countries in Europe. The ReD network is generally utilized by European transport companies that travel between multiple countries. |
82
Table of Contents
Index to Financial Statements
Customers and distribution channels
We provide our products and services primarily to fleet customers and our major oil company and petroleum marketer partners. Our commercial fleet customers are businesses that operate fleets comprised of one or more vehicles, including small fleets (1-10 vehicles), medium fleets (11-150 vehicles), large fleets (over 150 vehicles), and government fleets (which are owned and operated by governments). We also provide services through strategic relationships with our partners, ranging in size from major oil companies, such as British Petroleum (BP) (including its subsidiary, Arco), Chevron and Citgo, to small petroleum marketers with a single fueling location. While we refer to companies with whom we have strategic relationships as “partners,” our legal relationships with these companies are contractual, and do not constitute legal partnerships.
We distribute our products and services directly to fleet customers as well as through our major oil company and petroleum marketer partners. We provide comprehensive “end-to-end” support for our direct card programs that include issuing, processing and network services. We manage and market the fleet card programs of our partners under our partners’ own brands. We support these programs with a variety of business models ranging from fully outsourced card programs, which include issuing, processing and network services, to card programs where we may only provide limited back office processing services. These supporting services vary based on our partners’ needs and their own card program capabilities.
We primarily provide issuing, processing and information services to our major oil company partners, as these partners utilize their proprietary networks of branded locations to support their card programs. In addition, we provide network services to those major oil company partners who choose to offer a co-branded MasterCard as part of their card program. Our agreements with our major oil company partners typically have initial terms of five to ten years with current remaining terms ranging from less than one year up to seven years. During the twelve months ended September 30, 2010, we processed purchases of approximately 0.8 billion gallons of fuel for our major oil company partners in North America.
Our top three strategic relationships with major oil companies represented in the aggregate approximately 22%, 18%, 14% and 13% of our consolidated revenue for the nine months ended September 30, 2010, and the years ended December 31, 2009, 2008 and 2007, respectively. No single partner represented more than 10% of our consolidated revenue in these periods other than British Petroleum (including its subsidiary, Arco), which represented approximately 11% of our consolidated revenue in 2007, and one partner that represented approximately 11% of our consolidated revenue for the nine months ended September 30, 2010.
We provide similar products and services to government fleet customers as we provide to other commercial fleet customers. Our government fleet customers generally constitute local, state or federal government-affiliated departments and agencies with vehicle fleets, such as police vehicle fleets and school bus fleets. For a description of our financial information by our North American and International segments and geographical areas, see Note 16 to the accompanying consolidated financial statements.
Sales and marketing
We market our products and services to fleet operators in North America and internationally through multiple channels including field sales, telesales, direct marketing, point-of-sale marketing and the internet. We also leverage the sales and marketing capabilities of our strategic relationships with over 800 oil companies, petroleum marketers, card marketers and leasing companies. As of December 31, 2009, we employed approximately 285 sales and marketing employees worldwide that are focused on acquiring new customers for all of our direct business card programs, as well as select card programs for oil companies and petroleum marketers. We also utilize tradeshows, advertising and other awareness campaigns to market our products and services.
83
Table of Contents
Index to Financial Statements
In marketing our products and services, we emphasize the size and reach of our card acceptance networks, the benefits of our purchasing controls and reporting functionality and a commitment to high standards of customer service. We utilize proprietary and third-party databases to develop our prospect universe, and segment those prospects by various characteristics, including industry, geography, fleet size and credit score, to identify potential customers. We develop customized offers for different types of potential customers and work to deliver those offers through the most effective marketing channel. We actively manage prospects across our various marketing channels to optimize our results and avoid marketing channel conflicts.
In 2009, we acquired approximately 47,000 new commercial accounts across our markets through our own sales and marketing efforts. In addition, our partners acquired approximately another 25,000 new commercial accounts in 2009 through their own sales and marketing efforts.
Our primary means of acquiring new customers include:
| • | Field sales—Our direct sales team includes approximately 120 field sales representatives, as of December 31, 2009, who conduct face-to-face sales presentations and product demonstrations with prospects, assist with post-sale program implementation and training and provide in-person account management. Our field sales force generally targets fleets with 15 or more vehicles or cards. Field sales representatives also attend and manage our marketing at tradeshows. |
| • | Telesales—We had approximately 135 telesales representatives handling inbound and outbound sales calls as of December 31, 2009. Our inbound call volume is primarily generated as a result of referrals, direct marketing, point-of-sale marketing and the internet. Our outbound phone calls typically target fleets that have expressed an initial interest in our services or have been identified through database analysis as prospective customers. Our telesales teams generally target fleets with 15 or fewer vehicles or cards. We also leverage our telesales channel to cross-sell additional products to existing customers. |
| • | Direct marketing—We market directly to potential fleet customers via mail and email. We test various program offers and promotions, and adopt the most successful features into subsequent direct marketing initiatives. We seek to enhance the sales conversion rates of our direct marketing efforts by coordinating timely follow-up calls by our telesales teams. |
| • | Point-of-sale marketing—We provide marketing literature at the point-of-sale within our proprietary networks and those of major oil companies and petroleum marketers. Literature may include “take-one” applications, pump-top advertising and in-store advertising. Our point-of-sale marketing leverages the branding and distribution reach of the physical merchant locations. |
| • | Internet marketing—We manage numerous marketing websites around the world. Our marketing websites tend to fall into two categories: product-specific websites and marketing portals. |
| • | Product-specific websites—Our product-specific websites, including fuelman.com, cfnnet.com, checkinncard.com and keyfuels.co.uk, focus on one or more specific products, provide the most in-depth information available online regarding those particular products, allow prospects to apply for cards online (where appropriate) and allow customers to access and manage their accounts online. We manage product-specific websites for our own proprietary card programs as well as card programs of select oil companies and petroleum marketers. |
| • | Marketing portals—Our marketing portals, including fleetcardsUSA.com and fuelcards.co.uk, serve as information sources for fleet operators interested in fleet card products. In addition to providing helpful information on fleet management, including maintenance, tax reporting and fuel efficiency, these websites allow fleet operators to research card products, compare the features and benefits of multiple products, and identify the card product which best meets the fleet manager’s needs. Our exclusive |
84
Table of Contents
Index to Financial Statements
| FleetMatch™ technology matches an operator’s information, including fleet size, geographic span of operations and fuel type usage, to the benefits and features of our various fleet card products and provides a customized product recommendation to the fleet manager. |
As part of our internet marketing strategy, we monitor and modify our marketing websites to improve our search engine rankings and test our advertising keywords to optimize our pay-per-click advertising spend among the major internet search firms such as Google and Yahoo.
| • | Strategic relationships—We have developed and currently manage relationships with over 800 oil companies, independent petroleum marketers, card marketers and leasing companies. Our major oil company and petroleum marketer relationships offer our payment processing and information management services to their fleet customers in order to establish and enhance customer loyalty. Our card programs for major oil companies and petroleum marketers carry their proprietary branding and may or may not be accepted in one of our merchant networks. We benefit from the marketing efforts of major oil companies and petroleum marketers with whom we have strategic relationships to attract customers to their fueling locations. We manage the fleet card sales and marketing efforts for several major oil companies across the full spectrum of channels, including field sales, telesales, direct marketing, point-of-sale marketing and internet marketing. In these cases, we establish dedicated sales and marketing teams to focus exclusively on marketing the products of major oil companies and petroleum marketers. Our major oil company relationships include some of the world’s largest oil companies such as BP, Chevron and Citgo. Through our leasing company relationships, we offer our payment processing and information management services to their fleet customers as part of the leasing company’s broader package of fleet services. Our leasing company relationships all reside outside of North America, and we view these relationships as an important strategic growth area. |
Account management
| • | Customer service, account activation, account retention. We provide account management and customer services with approximately 390 service professionals as of December 31, 2009. Based in dedicated call centers across our key markets, these professionals handle transaction authorizations, billing questions and account changes. Customers also have the opportunity to self-service their accounts through interactive voice response and online tools. We monitor the quality of the service we provide to our customers by adhering to industry standard service levels with respect to abandon rates and answer times and through regular agent call monitoring. We also conduct regular customer surveys to ensure customers are satisfied with our products and services. In addition to our base customer service support, we provide the following specialized services: |
| • | Welcome and activation—We have dedicated teams that contact and welcome our new customers. These teams focus on successful activation and utilization of our new customers and provide training and education on the use of our products and services. |
| • | Strategic account management—We assign designated account managers who serve as the single point of contact for our large fleets. Our account managers have in-depth knowledge of our programs and our customers’ operations and objectives. Our account managers train fleet operators and support them on the operation and optimal use of our programs, oversee account setup and activation, review online billing and create customized reports. Our account managers also prepare periodic account reviews, provide specific information on trends in their accounts and work together to identify and discuss major issues and emerging needs of large fleets. |
| • | Account retention—We have proprietary, proactive strategies to contact customers who may be at risk of terminating their relationship with us. Through these strategies we seek to address service concerns, enhance product structures and provide customized solutions to address customer issues. |
85
Table of Contents
Index to Financial Statements
| • | Merchant network services—Our representatives work with merchants such as fuel and vehicle maintenance providers to enroll them in one of our proprietary networks, install and test all network and terminal software and hardware and train them on the sale and transaction authorization process. In addition, our representatives provide transaction analysis and site reporting and address settlement issues. |
| • | Credit underwriting and collections. We follow detailed application credit review, account management, and collections procedures for all our fleet customers. We use multiple levers including billing frequency, payment terms, spending limits and security to manage risk in our portfolio. |
| • | New account underwriting. We use a combination of quantitative, third-party credit scoring models and judgmental underwriting to screen potential customers and establish appropriate credit terms and spend limits. Our underwriting process provides additional scrutiny for large credit amounts and we utilize tiered credit approval authority among our management. |
| • | Prepaid and secured accounts. We also offer products and services on a prepaid or fully-secured basis. Prepaid customer accounts are funded with an initial deposit and subsequently debited for each purchase transacted on the cards issued to the customer. Fully-secured customer accounts are funded with an initial deposit equal to the anticipated purchase volume for a given timeframe. The deposit is held until such time as the customer either fails to pay the account or closes its account after paying outstanding amounts. Under either approach, our prepaid and fully-secured offerings allow us to market to a broader universe of prospects, including customers who might otherwise not meet our credit standards. |
| • | Monitoring and account management. We have developed proprietary fraud detection programs to monitor transactions and prevent misuse of our products. We monitor the credit quality of our portfolio monthly utilizing external credit scores and internal behavior data to identify high risk or deteriorating credit quality accounts. We conduct targeted strategies to minimize exposure to high risk accounts, including reducing spending limits and payment terms or requiring additional security. |
| • | Collections. As accounts become delinquent, we may suspend future transactions based on our risk assessment of the account. Our collections strategy includes a combination of internal and outsourced resources which use both manual and dialer-based calling strategies. We use a segmented collection strategy which prioritizes higher risk and higher balance accounts. For severely delinquent, high balance accounts we may pursue legal remedies from time to time. |
Competition
We face considerable competition in our business. The most significant competitive factors in our business are the breadth of product and service features, network acceptance size, customer service and account management and price. We believe that we generally compete favorably with respect to each of these factors. However, we may experience competitive disadvantages with respect to each of these factors from time to time as potential customers prioritize or value these competitive factors differently. As a result, a specific offering of our products and service features, networks and pricing may serve as a competitive advantage with respect to one customer and a disadvantage for another based on the customers’ preferences.
We compete with independent fleet card providers, providers of card outsourcing services and major financial services companies as well as major oil companies and petroleum marketers that issue their own fleet cards. We also compete with providers of alternative payment mechanisms, such as financial institutions that issue corporate and consumer credit cards, and merchants offering house accounts as well as other forms of credit. Our primary independent fleet card competitors are Wright Express Corporation, Comdata Corporation and U.S. Bank Voyager Fleet Systems Inc. in North America and Arval UK Group Limited (a subsidiary of BNP Paribas) internationally.
86
Table of Contents
Index to Financial Statements
Technology
Our technology provides continuous authorization of transactions, processing of critical account and client information and settlement between merchants, issuing companies and individual commercial entities. We recognize the importance of state-of-the-art, secure, efficient and reliable technology in our business and have made significant investments in our applications and infrastructure. In 2009, we spent more than $20 million in capital and operating expenses to operate, protect and enhance our technology and we expect to spend a similar amount in 2010.
Our technology function comprises approximately 120 employees, as of December 31, 2009, based in the United States and Europe with expertise in the management of applications, transaction networks and infrastructure. We operate application development centers in the United States, United Kingdom, Netherlands, Russia and Czech Republic. Our distributed application architecture allows us to maintain, administer and upgrade our systems in a cost-effective and flexible manner. We integrate our systems with third-party vendor applications for certain products, sales and customer relationship management and back-office support. Our technology organization has undertaken and successfully executed large scale projects to develop or consolidate new systems, convert oil company and petroleum marketer systems and integrate acquisitions while continuing to operate and enhance existing systems.
Our technology infrastructure is supported by best-in-class, highly-secure data centers, with redundant locations. We operate three primary data centers, located in Atlanta, Georgia, Prague, Czech Republic and Las Vegas, Nevada. We use only proven, client-server technology and have no foreseeable capacity limitations. Our systems meet the highest standards for security with multiple industry certifications. Our network is configured with multiple layers of security to isolate our databases from unauthorized access. We use sophisticated security protocols for communication among applications, and our employees access critical components on a need-only basis. As of September 30, 2010, we have not experienced any breaches in network, application or data security.
We maintain up-to-date disaster recovery and business continuity plans. Our telecommunications and internet systems have multiple levels of redundancy to ensure reliability of network service. In 2009, we experienced 99.99% up-times for authorizations.
Proprietary processing systems
We operate several proprietary processing systems that provide the features and functionality to run our card programs, including our card issuing, processing and information services. Our processing systems also integrate with our proprietary networks, which provide brand awareness and connectivity to our acceptance locations that enables the “end-to-end” card acceptance, data capture and transaction authorization capabilities of our card programs. Our proprietary processing systems are tailored to meet the unique needs of the individual markets they serve.
Intellectual property
Our intellectual property is an essential element of our business. We use trademark, copyright, trade secret and other intellectual property laws and confidentiality agreements to protect our intellectual property. We own trademark registrations supporting a number of our brands, such as FleetCor®, Fuelman®, FleetNet®, FleetCards USA®, CFN®, and Mannatec® in the United States. We also own trademark registrations in various European jurisdictions for a number of our brands, such as Keyfuels®, The Fuelcard Company®, CCS®, iMonitor® and Transit Card®. Our employees involved in technology development in some of the countries in which we operate, including the United States, are required to sign agreements acknowledging that all intellectual property created by them on our behalf is owned by us. We also have stringent internal policies regarding the protection, disclosure and use of our confidential information.
87
Table of Contents
Index to Financial Statements
Regulatory
A substantial number of laws and regulations apply to businesses offering payment cards to customers or processing or servicing such cards. These laws generally apply only to consumer cards, which are cards used to make purchases for personal, family or household purposes. Because our payment cards are limited to purchases for business purposes only, they are typically classified as commercial cards which are generally not subject to many of the laws and regulations applicable to consumer cards. However, our business is still subject to significant regulation, and the following is a description of certain United States federal and state laws and regulations and certain laws and regulations of other jurisdictions applicable to our business.
Federal Trade Commission Act
The Federal Trade Commission Act empowers the Federal Trade Commission (the “FTC”) to regulate unfair methods of competition and unfair or deceptive acts or practices affecting commerce. While this power generally applies only to “consumers,” the FTC has sometimes taken enforcement action on behalf of small business owners in certain circumstances. We also may be subject to state laws and regulations that generally prohibit engaging in unfair and deceptive business practices, which may extend to small businesses. Other countries in which we operate also regulate unfair and deceptive practices in a similar manner.
Truth in Lending Act
The Truth in Lending Act, or TILA, which is implemented by the Federal Reserve’s Regulation Z, was enacted to increase consumer awareness of the cost of credit. Most provisions of Regulation Z apply only to the extension of “consumer” credit, but a limited number of provisions apply to commercial cards, including a provision providing that, in cases where ten or more credit cards are issued by a card issuer for use by the employees of an organization, the organization, to which credit is extended, may agree to liability imposed on the organization for unauthorized use without regard to Regulation Z limitations. Our cardholder agreements generally provide that the customer agrees that if it has been issued ten or more cards at its request, then the customer waives to the fullest extent possible all limitations on liability for unauthorized use of the cards.
Equal Credit Opportunity Act
The Equal Credit Opportunity Act, which is implemented by the Federal Reserve’s Regulation B, prohibits creditors from discriminating when extending credit on certain “prohibited bases” such as an applicant’s sex, race, nationality and marital status, and further requires that creditors disclose the reasons they took any adverse action against an applicant or a customer.
The Fair Credit Reporting Act
The Fair Credit Reporting Act of 1970, or FCRA, regulates the disclosure and use of consumer reports by consumer reporting agencies. We are permitted to obtain consumer reports with respect to an individual who guarantees or otherwise is obligated on a commercial card.
FACT Act
The Fair and Accurate Credit Transactions Act of 2003, or the FACT Act, amended certain provisions of FCRA applicable to consumer reports generally not applicable to business credit. However, the FACT Act included provisions that require creditors to adopt Identity Theft Prevention Programs to detect, prevent and mitigate identity theft, including detecting identity theft “red flags,” in connection with covered accounts, which can include business purpose accounts for which there is a reasonably foreseeable risk of identity theft (the “Red Flags Rules”). Enforcement of the Red Flags Rules by the FTC has been delayed until December 31, 2010.
88
Table of Contents
Index to Financial Statements
Bank Secrecy Act
We are subject to certain provisions of the Currency and Foreign Transactions Reporting Act and the accompanying regulations issued by the U.S. Department of the Treasury, or the Bank Secrecy Act, as amended by the USA PATRIOT Act of 2001, or the Patriot Act. The Patriot Act contains a wide variety of provisions aimed at fighting terrorism and money laundering. Among other things, the Bank Secrecy Act, as amended by the Patriot Act, requires financial services providers to establish anti-money laundering programs that meet certain standards, including, in some instances, expanded reporting and enhanced information gathering and recordkeeping requirements. We maintain anti-money laundering controls designed to prevent our network from being used for money laundering or terrorist financing purposes. Other countries in which we operate have also enacted laws or regulations regarding anti-terrorism and money laundering.
Credit Card Accountability Responsibility and Disclosure Act of 2009
The Credit Card Accountability Responsibility and Disclosure Act of 2009, or the Credit CARD Act, was adopted on May 22, 2009 and amended certain provisions of the TILA and Regulation Z generally not applicable to business purpose cards. However, the Credit CARD Act directs the Federal Reserve to conduct a study of credit card use by small businesses, and not later than 12 months after enactment to provide a report to Congress including recommendations for administrative or legislative initiatives to provide protections for credit card plans for small businesses, as appropriate. Any changes in credit card rules applicable to small businesses resulting from the study and recommendations, if any, may affect our small business customer card plans.
Dodd-Frank Wall Street Reform and Consumer Protection Act
In July 2010, President Obama signed into law the Dodd-Frank Wall Street Reform and Consumer Protection Act, or the Reform Act. The Reform Act is comprehensive in scope and contains a wide array of provisions intending to govern the practices and oversight of financial institutions and other participants in the financial markets. The focus of the Reform Act is consumer protection oriented; our principal business in the United States, however, is business purpose charge cards which do not currently appear to be the focus of the reforms. For instance, among other matters, the law creates a new independent Consumer Financial Protection Bureau, which will regulate consumer credit across the U.S. economy. The Bureau will have broad rulemaking and enforcement authority over providers of credit, savings, payment and other consumer financial products and services. It is unknown how this new bureau will exercise its authority. Many provisions of the Reform Act require the adoption of rules to implement. Proposed regulations have not been published. Accordingly, the ultimate consequences of the Reform Act and its implementing regulations on our business, results of operations and financial condition are uncertain at this time.
State usury laws
Some of our card products may be deemed to involve commercial purpose loans. Most state laws provide that money cannot be lent at an interest rate in excess of a certain statutory maximum. This “usury limit” may act as a ceiling on interest to cardholders for the extension of credit. These limits are often different for consumer cards and commercial cards. Because we have substantial operations in multiple jurisdictions, and we utilize choice of law provisions in our cardholder agreements, we have flexibility as to the laws of which jurisdiction to apply. In addition, the interest rates on certain of our card products are set based upon the usury limit of the cardholder’s state. With respect to card products where we work with a partner or issuing bank, the partner bank may utilize the law of the jurisdiction applicable to the bank and “exports” the usury limit of that state in connection with cards issued to residents of other states or we may use our choice of law provisions.
89
Table of Contents
Index to Financial Statements
Payment card industry rules
Partner banks issuing payment cards bearing the MasterCard brand, and FleetCor to the extent it provides certain services in connection with those cards and fleet customers acting as merchants accepting those cards, must comply with the bylaws, regulations and requirements that are promulgated by MasterCard and other applicable payment card organizations, including the Payment Card Industry Data Security Standard developed by MasterCard and Visa, the MasterCard Site Data Protection Program, and any other applicable bank card data security program requirements.
Other regulations
We are subject to U.S. federal and state data security and breach notification laws and regulations, as well as data protection laws in the foreign countries in which we operate. We are also subject to bankruptcy and debtor relief laws that can affect our ability to collect amounts owed to us.
Legal matters
We are not currently party to any legal proceedings or governmental inquiries or investigations that we consider to be material. We are and may become, however, subject to lawsuits from time to time in the ordinary course of our business. We are currently involved in an investigation by the Office of Fair Trading in the United Kingdom, relating to our Keyfuels product line. This product line consists of our proprietary payment card and associated site network in the United Kingdom. A competitor alleged we are dominant in a relevant market with our Keyfuels product line. The Office of Fair Trading is investigating whether we are dominant and, if dominant, whether some of our contracts with some sites and dealers would constitute exclusive dealings requiring them to be reformed to eliminate exclusivity. Although we do not currently anticipate an adverse result or material adverse impact from the investigation, if determined adversely, the regulator has authority to require us to reform contracts to eliminate exclusivity and impose significant fines.
Employees and labor relations
As of December 31, 2009, we employed approximately 1,130 employees, approximately 650 of whom were located in the United States. None of our employees are subject to a collective bargaining agreement. We consider our employee relations to be good and have never experienced a work stoppage.
90
Table of Contents
Index to Financial Statements
Facilities
We lease all of the real property used in our business, except as noted below. The following table lists each of our material facilities and its location, use and approximate square footage.
| Facility | Use | Approximate size | ||
| United States |
Square Feet | |||
| Norcross, Georgia |
Corporate headquarters and operations | 57,300 | ||
| Covington, Louisiana |
Accounting, treasury, merchant authorization | 13,600 | ||
| Houston, Texas |
Credit and collections | 15,000 | ||
| Carlsbad, California |
Customer support | 3,900 | ||
| Concord, California |
Customer support | 7,100 | ||
| San Mateo, California |
CFN operations and customer support | 9,200 | ||
| Wichita, Kansas |
CLC operations and customer support | 31,100 | ||
| Europe |
||||
| Prague, Czech Republic |
CCS headquarters, operations, customer service and sales | 55,000 | ||
| Doetinchem, Netherlands |
Customer support and card processing | 2,700 | ||
| Kaliningrad, Russia |
PPR sales and customer support | 1,400 | ||
| Moscow, Russia |
PPR headquarters, sales, customer support and operations | 6,400 | ||
| Vilnius, Lithuania |
Credit and collections | 800 | ||
| Warsaw, Poland |
Sales and credit and collections | 500 | ||
| Ipswich, United Kingdom(1) |
Operations, sales and customer support | 17,900 | ||
| Knaresborough, United Kingdom |
Operations, sales and customer support | 5,100 | ||
| London, United Kingdom |
Europe headquarters | 2,800 | ||
| Walsall, United Kingdom |
Operations, sales and customer support | 9,500 | ||
| (1) | We own a freehold interest in this facility. |
We also lease a number of minor additional facilities, including local sales offices, small storage facilities and a small number of service stations in the United Kingdom. We believe our facilities are adequate for our needs for at least the next 12 months. We anticipate that suitable additional or alternative facilities will be available to accommodate foreseeable expansion of our operations.
91
Table of Contents
Index to Financial Statements
The following table sets forth certain information regarding the members of our board of directors and our executive officers, with their respective ages as of April 1, 2010. Our officers serve at the discretion of our board of directors. There are no family relationships between any of our directors or executive officers.
| Name | Age | Position(s) | ||||
| Executive Officers: |
||||||
| Ronald F. Clarke |
54 | President, Chief Executive Officer and Chairman of the Board of Directors | ||||
| Eric R. Dey |
50 | Chief Financial Officer | ||||
| Todd W. House |
38 | Chief Operating Officer—U.S. Shared Services | ||||
| Van E. Huff |
49 | Chief Information Officer | ||||
| Robert P. Brandes |
49 | Executive Vice President—Global Universal Products | ||||
| John S. Coughlin |
42 | Executive Vice President—Corporate Development | ||||
| Jeffrey D. Lamb |
52 | Executive Vice President—U.S. Fuel Card Marketing and Sales | ||||
| William J. Schmit |
53 | President—Major Oil Card Programs | ||||
| Timothy J. Downs |
52 | President—Corporate Lodging Consultants | ||||
| Andrew R. Blazye |
51 | Chief Executive Officer—FleetCor Europe | ||||
| Other Directors: |
||||||
| Andrew B. Balson |
43 | Director | ||||
| John R. Carroll |
42 | Director | ||||
| Bruce R. Evans |
51 | Director | ||||
| Mark A. Johnson |
57 | Director | ||||
| Richard Macchia |
58 | Director | ||||
| Glenn W. Marschel |
63 | Director | ||||
| Steven T. Stull |
51 | Director | ||||
Ronald F. Clarke has been our President and Chief Executive Officer since August 2000 and was appointed Chairman of our board of directors in March 2003. From 1999 to 2000, Mr. Clarke served as President and Chief Operating Officer of AHL Services, Inc, a staffing firm. From 1990 to 1998, Mr. Clarke served as chief marketing officer and later as a division president with Automatic Data Processing, Inc., a computer services company. From 1987 to 1990, Mr. Clarke was a principal with Booz Allen Hamilton, a global management consulting firm. Earlier in his career, Mr. Clarke was a marketing manager for General Electric Company, a diversified technology, media, and financial services corporation.
Eric R. Dey has been our Chief Financial Officer since November 2002. From October 2000 to October 2002, Mr. Dey served as Chief Financial Officer of NCI Corporation, a call center company. From July 1999 to October 2000, Mr. Dey served as Chief Financial Officer of Leisure Time Technology, a software development/manufacturing company. On March 16, 2001, Leisure Time Technology filed a petition for bankruptcy under the federal bankruptcy laws. From 1994 to 1999, Mr. Dey served as Corporate Controller with Excel Communications, a telecommunications service provider. From 1984 to 1994, Mr. Dey held a variety of financial and accounting positions with PepsiCo, Inc., a global beverage, snack and food company.
Todd W. House has been our Chief Operating Officer—U.S. Shared Services since April 2009. Beginning in December 2010, Mr. House will also be responsible for our U.S. direct business. From July 2007 to April 2009, Mr. House held various positions, including Chief Financial Officer, with Axiant, LLC, a provider of financial services and recovery management solutions. From April 2005 to July 2007, Mr. House was Vice President and Chief Credit Officer with Carmax, Inc., an automobile retailer. From August 1993 to April 2005, Mr. House was Vice President–Credit Risk Management with Capital One Financial Corp., a financial services company. On November 20, 2009, Axiant, LLC filed a petition for bankruptcy under the federal bankruptcy laws.
92
Table of Contents
Index to Financial Statements
Van E. Huff has been our Chief Information Officer since October 2004. From August 1984 to October 2004, Mr. Huff served in various positions, including as Senior Vice President—IT for First Data Corporation, a provider of electronic commerce and payment solutions.
Robert P. Brandes has been with us since June 2002. Mr. Brandes was named our Executive Vice President—Global Universal Products effective December 2010. From September 2009 to December 2010, Mr. Brandes served as our President—Universal Fleet Cards. Mr. Brandes served as Senior Vice President—Product Management from December 2008 to September 2009, Senior Vice President—Co-Brand from January 2007 to December 2008 and Vice President—Marketing from June 2002 to January 2007.
John S. Coughlin has served as our Executive Vice President—Corporate Development since September 2010. From 2007 to 2010, Mr. Coughlin served as a Managing Director at PCG Capital Partners, a private equity firm. From 2005 to 2006, Mr. Coughlin served as Chief Executive Officer of NCDR LLC (dba Kool Smiles), a private equity owned national dental practice management company. From 1994 to 2005, Mr. Coughlin was with The Parthenon Group, a strategic advisory and principal investment firm, where he was a Senior Partner and the founder and head of the firm’s San Francisco office.
Jeffrey D. Lamb joined us as Executive Vice President—U.S. Fuel Card Marketing and Sales in December 2010. In July 2005, Mr. Lamb co-founded Socius Capital, LLC, an independent financial sponsor and management company to small and medium-sized businesses, and served as its Managing Director until December 2010. Since December 2008, Mr. Lamb has served on the Board of Managers of Wazee Companies, LLC, an electrical repair and maintenance service provider. Between July 2006 and March 2009, Mr. Lamb served on the Board of Directors of On the Scene Productions, Inc., a video production company for the public relations industry. Mr. Lamb also served as the Chief Executive Officer of On the Scene Productions, Inc. between July 2006 and February 2008. On the Scene Productions, Inc. filed its voluntary petition for bankruptcy liquidation under the U.S. Bankruptcy Code in October 2009. From 2001 to 2004, Mr. Lamb was Senior Director of Worldwide Marketing for the service division of Sun Microsystems, Inc. (acquired by Oracle Corporation in January 2010), a provider of network computing infrastructure solutions.
William J. Schmit, Jr. has served as our President—Major Oil Card Programs since November 2005. From April 1999 to November 2005, Mr. Schmit served as our Senior Vice President—Private Label Programs.
Timothy J. Downs joined us as President—Corporate Lodging Consultants in connection with our acquisition of CLC Group, Inc. in April 2009. Prior to joining us, Mr. Downs held various positions with Corporate Lodging Consultants, including Vice President Technology from May 1999 to September 2004 and as Executive Vice President Operations from September 2004 to April 2009.
Andrew R. Blazye has served as our Chief Executive Officer—FleetCor Europe, since July 2007. From April 2006 to June 2007, Mr. Blazye was a Group Director for Dunnhumby Ltd., a research firm. From September 1980, to March 2006, Mr. Blazye held various positions with Shell International Ltd., a subsidiary of Royal Dutch Shell plc, a global energy company, including Global Payments General Manager.
Andrew B. Balson joined our board of directors in July 2006. Since 1996, Mr. Balson has been with Bain Capital Partners, LLC, a private equity firm and has served as a Managing Director since 2000. Mr. Balson is a director of Domino’s Pizza, Inc. and OSI Restaurant Partners, LLC. Mr. Balson served as a director of Burger King Holdings, Inc., a restaurant owner and franchisor, from December 2002 to July 2008.
John R. Carroll joined our board of directors in May 2002. Since 1998, Mr. Carroll has served as a Managing Director with Summit Partners, a growth equity firm. Mr. Carroll has served on numerous private company boards.
93
Table of Contents
Index to Financial Statements
Bruce R. Evans joined our board of directors in May 2002. Since 1986, Mr. Evans has served in various positions with Summit Partners, including most recently as a Managing Director. Mr. Evans currently serves as a director of optionsXpress Holdings, Inc. Mr. Evans has previously served as a director of Unica Corporation and Hittite Microwave Corporation.
Mark A. Johnson joined our board of directors in March 2003. Since September 2008, Mr. Johnson has served as a Partner with Total Technology Ventures, a venture capital firm. From February 2003 to January 2008, Mr. Johnson was Vice Chairman—M&A of CheckFree Corporation. Mr. Johnson served on the board of directors of CheckFree from 1982 to 2007.
Richard Macchia joined our board of directors in July 2010. Mr. Macchia served as Chief Financial Officer and Senior Vice President of Administration for Internet Security Systems, Inc., an information security provider, from December 1997 through October 2005. Mr. Macchia remained employed with Internet Security Systems, Inc. during the following year to transition the Chief Financial Officer role to his successor. Internet Security Systems, Inc. was acquired by International Business Machines Corporation in October 2006 and Mr. Macchia has been retired since October 2006.
Glenn W. Marschel joined our board of directors in September 2002. Since August 2000, Mr. Marschel has served as President and Chief Executive Officer of NetNumber, Inc., a provider of standards based registry and directory services and software technology to the communications industry.
Steven T. Stull joined our board of directors in October 2000. Since 1992, Mr. Stull has served as President of Advantage Capital Partners, a private equity firm, which he co-founded.
Director Qualifications
The current members of our board of directors have been designated pursuant to our sixth amended and restated stockholders agreement. The stockholders agreement provides that our board is composed of our chief executive officer, directors designated by our major stockholders, and directors elected by our common and preferred stockholders. The stockholders agreement will terminate upon the closing of this offering and, thereafter, our directors will be elected by vote of our stockholders.
When considering whether our directors have the experience, qualifications, attributes or skills, taken as a whole, to enable the board of directors to satisfy its oversight responsibilities effectively in light of our business and structure, the board of directors focused primarily on each person’s background and experience as reflected in the information discussed in each of the directors’ individual biographies set forth immediately above. We believe that our directors provide an appropriate mix of experience and skills relevant to the size and nature of our business.
In addition, we believe that our directors provide a broad range of experience and substantial qualifications and skills that are important to our business, which factors may change from time to time.
| • | Business and strategic acquisition experience. We believe that the company benefits from our directors’ substantial and recent business experience, including their knowledge and understanding of international markets. In addition, given our history of strategic acquisitions and growth strategy both domestically and internationally, we value directors who provide deep knowledge and experience evaluating, executing and integrating strategic acquisitions. In particular, we have obtained these qualities on our board from directors with experience evaluating and advising a range of portfolio companies. |
94
Table of Contents
Index to Financial Statements
| • | Leadership experience. We believe that directors with experience in significant leadership positions over an extended period, especially president or chief executive officer positions, provide us with leadership for our company and strategic insight. These directors generally possess effective leadership qualities and the ability to identify and develop those qualities in others. They demonstrate a practical understanding of organizations, long-term strategy, risk management and executing growth strategies. |
| • | High level of financial literacy. We also believe that an understanding of finance and financial reporting processes represents an important characteristic for our board of directors. We use financial measures and performance targets to evaluate the performance of our employees, businesses and payment products across our international customer and network base. |
| • | Industry and company knowledge. We also seek directors with relevant business expertise and experience as executives, directors, investors or in other leadership positions in the electronic payments, technology and business and financial services industries both domestically and internationally. |
We have set forth below additional summary information regarding the specific experience, qualifications, attributes and skills of each of our directors.
Mr. Balson
| • | Business and strategic acquisition experience—managing director of Bain Capital Partners; oversees investments in portfolio companies; evaluates and oversees strategic acquisitions by Bain Capital and its portfolio companies. |
| • | Leadership experience—director of numerous public and private companies, including serving as member of nominating and corporate governance and compensation committees. |
| • | High level of financial literacy—ten years of experience as a managing director of a global investment company overseeing and evaluating investments and portfolio companies; former experience in the merchant banking group of Morgan Stanley & Co. and the leveraged buyout group of SBC Australia. |
| • | Industry and company knowledge—served as our board member since 2006 providing strategic and financial advice relevant to our growth; oversees investments and portfolio companies in the software and business services industries; former Bain & Company consultant to the technology, telecommunications, financial services and consumer goods industries. |
Mr. Carroll
| • | Business and strategic acquisition experience—managing director of Summit Partners; helps oversee investments in portfolio companies in North America, Europe and Asia; evaluates and oversees strategic acquisitions and dispositions by Summit Partners and its portfolio companies. |
| • | Leadership experience—director of numerous private companies, including serving as member of audit and compensation committees. |
| • | High level of financial literacy—15 years of experience with Summit Partners, a global growth equity investment firm, including serving as a managing director; experience overseeing and evaluating investments and portfolio companies; former experience as a commercial banker with BayBank Corporation. |
| • | Industry and company knowledge—served as our board member since 2002 providing strategic, financial and acquisition advice relevant to our growth domestically and internationally; oversees investments and portfolio companies in the technology, business, financial and information services industries; former Bain & Company consultant to the financial services industry. |
95
Table of Contents
Index to Financial Statements
Mr. Clarke
| • | Business and strategic acquisition experience—significant experience with our business as our chief executive officer for ten years; strategic direction for our numerous acquisitions both domestically and internationally over this period. |
| • | Leadership experience—chairman of our board of directors, providing leadership and oversight of our board’s operations; prior experience as an executive officer with several public companies, including service as a chief operating officer, chief marketing officer and division president. |
| • | High level of financial literacy—significant experience with our finance function through his oversight of our chief financial officer for ten years. |
| • | Industry and company knowledge—significant familiarity with our company and industry through his service as our chief executive officer for ten years, his prior experience in the financial and business services industry, including with AHL Services, Inc. (staffing services), Automated Data Processing, Inc. (transaction processing, data communication and information services) and his experience providing management consulting services with Booz Allen, a global management consulting firm. |
Mr. Evans
| • | Business and strategic acquisition experience—managing director of Summit Partners; oversees investments in portfolio companies in North America, Europe and Asia; evaluates and oversees strategic acquisitions and dispositions by Summit Partners and its portfolio companies; director of the National Venture Capital Association. |
| • | Leadership experience—served as a director of more than 25 private and public companies, including as a member of audit, nominating, governance, investment and compensation committees; substantial experience addressing corporate development, compensation, human resources, governance, management and growth strategy matters; member of the Vanderbilt University Board of Trustees. |
| • | High level of financial literacy—over 24 years of experience with Summit Partners, a global growth equity investment firm, including serving as a managing director; substantial experience overseeing and evaluating numerous investments and portfolio companies; past service on public company audit committees. |
| • | Industry and company knowledge—served as our board member since 2002 providing strategic, financial and acquisition advice relevant to our growth domestically and internationally; oversees investments and portfolio companies in the technology, business and financial services industries; prior experience in the data processing and national accounts divisions of International Business Machines Corporation. |
Mr. Johnson
| • | Business and strategic acquisition experience—a partner of Total Technology Ventures, a venture capital firm; chairman of Venture Atlanta and member of the board of directors of the Technology Association of Georgia; former vice chairman of CheckFree Corporation (a Nasdaq-listed company acquired in December 2007 by Fiserv, Inc.) which included oversight of mergers and acquisitions and evaluating strategic growth opportunities. |
| • | Leadership experience—former vice chairman of CheckFree Corporation; responsibilities included overseeing mergers and acquisitions, evaluating strategic growth opportunities, developing strategic corporate relationships and supporting long term business strategies; member of the CheckFree board of directors; joined CheckFree Corporation in 1982 as vice president of operations; currently serves as a member of the board of directors of private companies. |
96
Table of Contents
Index to Financial Statements
| • | High level of financial literacy—founder of e-RM Ventures, a private investing consultancy focused on early-stage payments-related companies; former experience with the Federal Reserve Bank of Cleveland and Bank One with responsibilities for checking and cash management operations; member of balance sheet committee of CheckFree Corporation; public company audit committee experience. |
| • | Industry and company knowledge—served as our board member since 2003 providing strategic advice relevant to our growth; senior executive of CheckFree Corporation, a provider of financial electronic commerce services and products to organizations around the world; responsible for the development and launch of CheckFree’s commercial and consumer electronic funds transfer services and CheckFree’s electronic bill payment and bill presentment businesses as well as the development of key strategic alliances and marketing initiatives. |
Mr. Marschel
| • | Business experience—extensive experience as a senior executive of various technology, payment and information processing companies; currently the president and chief executive officer of NetNumber, Inc., a provider of standards based software technology to the communications industry. |
| • | Leadership experience—president and chief executive officer of NetNumber, Inc.; former chief executive officer, president and co-chairman of Faroudja, Inc., a video processing technology company; former president and chief executive officer of Paging Network Inc., a provider of wireless messaging services; and former vice chairman of First Financial Management Corporation, a provider of credit card and transaction authorization, processing and settlement, healthcare claims processing and document management/imaging services; experience serving on the board of directors of private and public companies. |
| • | Industry and company knowledge—served as our board member since 2002 providing strategic advice relevant to our growth; extensive senior executive experience in the technology, payment processing and information processing industries, including substantial experience with Automated Data Processing, Inc., a computer services company, where he served as president of several businesses, including the automotive and employer services divisions, following senior positions in sales, client services, strategy and marketing. |
Mr. Macchia
| • | Business and leadership experience—retired chief financial officer and senior vice president of administration; oversaw financial functions, human resources, facilities and investor relations; served in senior executive roles with several public companies for over 20 years; served as a partner of KPMG LLP, an international accounting firm, for two years. |
| • | High level of financial literacy—served as a principal financial or principal accounting officer with several public companies for over 20 years; certified public accountant in good standing since 1976; practiced with KPMG LLP from 1973 to 1985. |
| • | Industry knowledge—over 20 years experience in the financial and information services industry, including with MicroBilt Corporation (financial information services), First Financial Management Corporation (credit card authorization, processing and settlement services; healthcare claims processing services; document management/imaging services) and Internet Security Systems, Inc. (information security services). |
97
Table of Contents
Index to Financial Statements
Mr. Stull
| • | Business and strategic acquisition experience—President of Advantage Capital Partners, a private equity firm, serving as the firm’s chief executive officer and directing investment policy, overall operations, strategic planning, and fundraising activities. |
| • | Leadership experience—director of numerous private companies, including serving as member of audit and compensation committees. |
| • | High level of financial literacy—served for nine years as an executive in the investment department of General American Life Insurance Company, heading its securities division and personally managing its high yield, convertible, and preferred stock portfolios; experience as a chief financial officer; experience with a commercial bank and a savings and loan association. |
| • | Industry and company knowledge—served as our board member since 2000 providing strategic advice relevant to our growth; oversees investments and portfolio companies in the technology, business, financial and information services industries; served as the chief financial officer of an information services company. |
Compensation committee interlocks and insider participation
None of our executive officers currently serve on the compensation committee or board of directors of any other company of which any member or proposed member of our compensation, nominating and corporate governance committee is an executive officer.
Board of directors and committees
Our board of directors currently consists of eight members. Of our directors, seven—Messrs. Balson, Carroll, Evans, Johnson, Macchia, Marschel and Stull—are “independent directors” as defined under the New York Stock Exchange listing standards. Under our amended and restated bylaws effective immediately prior to the closing of this offering, the number of directors will be determined from time to time by our board of directors.
Upon the completion of this offering, the board of directors will be divided into three classes, with each class serving for a staggered three-year term. The board of directors will initially consist of three class I directors, three class II directors and two class III directors. Our directors will be divided among the three classes as follows:
| • | the class I directors are Messrs. Carroll, Johnson and Stull; |
| • | the class II directors are Messrs. Evans, Balson and Marschel; and |
| • | the class III directors are Messrs. Clarke and Macchia. |
At each annual meeting of stockholders, a class of directors will be elected for a three-year term to succeed the directors of the same class whose terms are then expiring. The terms of the class I directors, class II directors and class III directors identified above will expire upon the election and qualification of successor directors at the annual meeting of stockholders held during the calendar years 2011, 2012 and 2013, respectively.
Pursuant to our stockholders agreement, as amended and restated, Messrs. Balson, Carroll, Evans, Johnson, Macchia, Marschel and Stull were appointed to our board of directors by certain of our investors. Messrs. Balson, Carroll, Evans, Johnson, Macchia, Marschel and Stull will continue to serve as directors despite the fact that our stockholders agreement will terminate upon the closing of this offering.
98
Table of Contents
Index to Financial Statements
Audit committee
Our audit committee currently consists of Messrs. Carroll, Johnson and Marschel. We intend to appoint Mr. Macchia as the chairman of our audit committee prior to the completion of this offering. Our board has determined that each member of the audit committee, other than Mr. Carroll, meets the definition of “independent director” for purposes of the New York Stock Exchange rules and the independence requirements of Rule 10A-3 of the Securities Exchange Act of 1934, as amended (the “Exchange Act”). We expect that Mr. Carroll will continue to serve as a member of the Audit Committee in accordance with the transition period rules and regulations of the New York Stock Exchange. Our board of directors has also determined that Mr. Macchia qualifies as an “audit committee financial expert” under Securities and Exchange Commission rules and regulations.
Our audit committee will be responsible for, among other matters:
| • | appointing, compensating, retaining, evaluating, terminating and overseeing our independent registered public accounting firm; |
| • | discussing with our independent registered public accounting firm their independence from management; |
| • | reviewing with our independent registered public accounting firm the scope and results of their audit; |
| • | approving all audit and permissible non-audit services to be performed by our independent registered public accounting firm; |
| • | overseeing the financial reporting process and discussing with management and our independent registered public accounting firm the interim and annual financial statements that we file with the Securities and Exchange Commission; |
| • | reviewing and monitoring our accounting principles, accounting policies, financial and accounting controls and compliance with legal and regulatory requirements; |
| • | establishing procedures for the confidential anonymous submission of concerns regarding questionable accounting, internal controls or auditing matters; and |
| • | reviewing and approving related person transactions. |
Our board of directors has adopted a written charter for the audit committee, which will be available on our website.
Compensation, nominating and corporate governance committee
Our compensation committee currently consists of Messrs. Balson, Evans, Marschel and Stull. Immediately prior to the closing of this offering, we will establish a new compensation, nominating and corporate governance committee that will consist of Messrs. Balson, Evans (chairman), Marschel and Stull. Our board of directors has determined that each compensation, nominating and corporate governance committee member meets the definition of “independent director” for purposes of the New York Stock Exchange rules and the definition of “outside director” for purposes of Section 162(m) of the Internal Revenue Code of 1986, as amended. In addition, we intend to establish a sub-committee of our compensation, nominating and corporate governance committee consisting of Messrs. Marschel and Stull for purposes of approving any compensation that may otherwise be subject to Section 16 of the Exchange Act.
99
Table of Contents
Index to Financial Statements
The compensation, nominating and corporate governance committee will be responsible for, among other matters:
| • | annually reviewing and approving our goals and objectives for executive compensation; |
| • | annually reviewing and approving for the chief executive officer and other executive officers (1) the annual base salary level, (2) the annual cash incentive opportunity level, (3) the long-term incentive opportunity level, and (4) any special or supplemental benefits or perquisites; |
| • | reviewing and approving employment agreements, severance arrangements and change of control agreements for the chief executive officer and other executive officers, as appropriate; |
| • | making recommendations and reports to the board of directors concerning matters of executive compensation; |
| • | administering our executive incentive plans; |
| • | reviewing compensation plans, programs and policies; |
| • | developing and recommending criteria for selecting new directors; |
| • | screening and recommending to the board of directors individuals qualified to become executive officers; and |
| • | handling such other matters that are specifically delegated to the compensation, nominating and corporate governance committee by the board of directors from time to time. |
Our board of directors has adopted a written charter for the compensation, nominating and corporate governance committee, which will be available on our website.
See “Compensation discussion and analysis” for a description of the processes and procedures of the compensation committee and for additional information regarding the compensation committee’s role and management’s role in determining compensation for executive officers and directors prior to this offering.
Executive and acquisitions committee
Immediately prior to the closing of this offering, we will form an executive and acquisitions committee that will consist of Messrs. Clarke (chairman), Balson, Evans and Johnson. Between meetings of our board of directors, the executive and acquisitions committee will have and may exercise the powers of the board of directors to act upon any matters which, in the view of the Chairman of the Board, should not be postponed until the next previously scheduled meeting of the board of directors, except for those powers expressly reserved to the board. In particular, the executive and acquisitions committee may assist the board of directors in connection with capital expenditures, investments, acquisitions, financing activities and other matters. Our board of directors has adopted a written charter for the executive and acquisitions committee.
100
Table of Contents
Index to Financial Statements
Compensation discussion and analysis
This Compensation discussion and analysis describes the compensation policies and programs for our named executive officers for 2009, which consist of our chief executive officer, our chief financial officer and three other executive officers with the highest total compensation in 2009, as determined under the rules and regulations of the SEC. Our named executive officers for 2009 are Ronald F. Clarke, our President and Chief Executive Officer; Eric R. Dey, our Chief Financial Officer; Alex P. Hart, our President–Fuelman Fleet Cards; Todd W. House, our Chief Operating Officer–U.S. Shared Services; and Andrew R. Blazye, our Chief Executive Officer–FleetCor Europe. Mr. Hart resigned effective August 13, 2010. It also discusses compensation decisions that have been made in early 2010 and describes our expectations with respect to certain compensation decisions to be made subsequent to this offering. Because Mr. Blazye is based in the United Kingdom, his compensation is denominated in British pounds; all amounts discussed in this section for Mr. Blazye have been converted into dollars at an exchange rate of $1.572 to £1, the average exchange rate during 2009.
This Compensation discussion and analysis does not give effect to a two and one-half-for-one stock split of shares of all our common stock effected on November 29, 2010.
Overview of compensation program
The compensation committee of our board of directors is responsible for establishing and implementing our compensation philosophy, as detailed below. Our compensation committee evaluates and determines the levels and forms of individual compensation for our executive officers, including salaries, cash incentive compensation, bonuses and equity incentive compensation. Our compensation committee reviews and approves compensation for our executive officers periodically, generally in the first quarter of each fiscal year, based on each executive officer’s performance and our overall performance during the prior year. The committee designs the program with the overall goal that the total compensation paid to our executive officers is fair, reasonable and competitive and includes incentives that are designed to appropriately drive corporate performance. In addition, our chief executive officer has historically played a significant role in reviewing the performance of the other executive officers and making compensation recommendations to the compensation committee for the executive officers (other than himself).
Compensation philosophy
Our executive compensation program is designed to help us attract talented individuals to manage and operate all aspects of our business, to reward those individuals for the achievement of our financial and strategic goals, to retain those individuals who contribute to the success of our business and to align the interests of those individuals with those of our stockholders. We believe that annual cash incentive compensation should be linked to metrics that create value for our stockholders and the ownership by management of equity interests in our business is an effective mechanism for providing incentives for management to maximize gains for stockholders.
Overview of elements of compensation
As discussed in further detail below, our compensation program consists of the following four principal components:
| • | Base salary. Base salaries for our named executive officers are evaluated periodically. |
| • | Annual cash incentive compensation. Our named executive officers typically earn annual cash incentive compensation based on (1) achievement of company-wide financial performance goals for the year and/or (2) achievement of individual or business unit performance goals. |
101
Table of Contents
Index to Financial Statements
| • | Long-term equity incentive awards. We grant equity awards to our named executive officers as long-term incentives. We attempt to ensure that a significant portion of our named executive officers’ compensation is linked to our long-term success and aligned with the returns provided to our stockholders. |
| • | Benefits and perquisites. We provide various health and welfare benefits to all of our employees. We provide a 401(k) plan to all of our U.S. employees. We also provide minimal perquisites to our named executive officers, as described below. Our named executive officers do not participate in any non-qualified deferred compensation plans or defined benefit pension plans. |
Determining compensation for the named executive officers
The compensation committee is responsible for administering our compensation practices and making decisions with respect to the compensation paid to our named executive officers. Our compensation committee has not retained the services of a compensation consultant. Compensation for our executive officers historically has been individualized, impacted by arm’s-length negotiations at the time of employment, and based on a variety of factors, including:
| • | our compensation committee’s evaluation of the competitive market based on its general market experience; |
| • | the roles and responsibilities of our executives; |
| • | the individual experience and skills of, and expected contributions from, our executives; |
| • | the individual performance of our executives during the year and the historic performance levels of our executives; |
| • | our overall financial performance; |
| • | our financial condition and available resources; and |
| • | our need for a particular position to be filled. |
Our chief executive officer has historically played a significant role in reviewing the performance of the other executive officers and making compensation recommendations to the compensation committee for the executive officers. When discussing performance evaluations and setting compensation levels for our executive officers, the compensation committee works closely with our chief executive officer; however, the compensation committee has the discretion to reject or modify the recommendations of our chief executive officer. Our chief executive officer does not participate in determining or recommending the amount of his own compensation.
Going forward, our chief executive officer will periodically evaluate the other executive officers’ performance with the compensation committee and make recommendations for base salary, cash incentive awards and grants of long-term equity incentive awards for all executive officers other than himself. Based on these recommendations from our chief executive officer and in consideration of the objectives described above and the principles described below, the compensation committee will approve the annual compensation packages of all our executive officers. As we gain experience as a public company, we expect that the specific direction, emphasis and components of our executive compensation program will continue to evolve. For example, over time we may reduce our reliance upon subjective determinations made by our compensation committee in favor of a more empirically based approach that involves benchmarking against peer companies or the input of a compensation consultant.
Compensation mix and how each element fits into our overall compensation objectives
The compensation committee strives to achieve an appropriate mix between cash payments and equity incentive awards in order to meet our compensation objectives. Our compensation committee does not have any formal
102
Table of Contents
Index to Financial Statements
policy for allocating compensation between short-term and long-term compensation or cash and non-cash compensation. We believe the most important indicator of whether our compensation objectives are being met is our ability to motivate our executive officers to deliver superior performance and retain them to continue their careers with us on a cost-effective basis.
Our mix of compensation elements is designed to reward recent results, motivate long-term performance and align our executives’ interests with those of our stockholders. We achieve this through a combination of cash and equity awards. Base salary and benefits are designed to provide a secure level of cash compensation. Annual cash incentive awards support our annual operating plan and are earned only if we meet the performance goals established by the compensation committee. Equity awards are granted in the form of stock options and performance-based restricted stock. Stock options have value for our executives only if our stock price increases. Performance-based restricted stock has value to our executives only if we meet the performance goal established by the compensation committee.
While we have typically provided cash compensation (base salary) and a cash incentive opportunity to each executive in each year, we do not typically provide equity compensation to each executive on an annual basis. For example, our chief executive officer received an equity grant in 2009, but did not receive an equity grant in 2008 or 2007. Historically we have made an initial equity grant in connection with the commencement of employment and additional “refresher” grants when an executive has vested in his existing grants. We also make equity grants designed to encourage a specific performance goal or to reward an executive for extraordinary performance in a particular year. In determining the size of an equity award the compensation committee considers relative job responsibility, the value of existing unvested awards, individual performance history, prior contributions to us, the size of prior grants, arm’s-length negotiation at the time of an executive’s hiring and availability of shares in our pool. The compensation committee considers cash compensation and equity compensation separately, and therefore the grant of an equity award in one year does not impact the potential cash compensation to that executive for the same year.
Compensation levels for the named executive officers
The compensation committee applies the same compensation policies to all of our named executive officers with the overall goal that the total compensation paid to our executive officers is fair, reasonable and competitive and includes incentives that are designed to appropriately drive corporate performance. The ultimate compensation levels earned by the named executive officers reflect the application of these policies to the varying roles and responsibilities of the executives. Generally, the greater the responsibility of the executive and the greater the potential impact of the executive on revenue and net income growth, the higher the potential compensation that can be earned by the executive. In addition, the compensation committee is aware of the competitive market for executive compensation, which reflects a meaningful variation between the chief executive officer and other executive positions for each element of compensation.
Our chief executive officer has the greatest responsibility in managing our company. He joined our company in 2000, and has managed our significant growth over the decade through a combination of organic initiatives, product and service innovation and over 40 acquisitions of businesses and commercial account portfolios, growing our revenue from $33.0 million in 2000 to $354.1 million in 2009. As a result of our compensation committee’s assessment of our chief executive officer’s role and responsibilities within our company, his nearly ten years of service to our company and the competitive market for chief executive officer compensation, there is a significant compensation differential between his compensation levels and those of our other named executive officers.
Components of compensation
The components of compensation include base salary, annual cash incentive compensation, long-term equity incentive awards and benefits and perquisites.
103
Table of Contents
Index to Financial Statements
Base salary
Base salaries are adjusted from time to time, taking into account individual responsibilities, individual performance for the year, the experience of the individual, current salary, retention incentives, internal equity and the compensation committee’s evaluation of the competitive market based on its general market experience. No particular weight is assigned to each factor. Historically, we have not applied specific formulas to set base salaries, nor have we sought to benchmark base salaries against similarly situated companies. Initial base salaries for our executive officers are typically negotiated at arm’s-length at the time of hiring.
Effective March 16, 2009, Mr. Clarke received a raise of approximately 8.7%, which increased his base salary to $625,000. Our compensation committee approved the increase in recognition of his oversight of three acquisitions that significantly increased our International operations: Abbey Group (OXON) Limited, a fleet card company based in the United Kingdom, ICP, a payment transaction processing company based in the Netherlands, and Petrol Plus Region, an independent fuel card provider based in Russia, his oversight of the successful implementation of a new private label contract, the superior financial performance of our business as a whole, the launch of new distribution channels for our U.S. direct business and the finalization of extensions of two private label contracts.
Effective March 1, 2010, February 15, 2010 and February 1, 2010, respectively, Mr. Clarke, Mr. Dey and Mr. Blazye received base salary increases. Our compensation committee approved an increase to Mr. Clarke’s base salary of 10% to $687,500 in recognition of his oversight of two significant acquisitions (the CLC Acquisition and the ReD Acquisition) in 2009, his leadership of our company in maintaining our performance through the economic downturn, and recognition of his increased responsibilities as a result of this offering. Our compensation committee approved an increase to Mr. Dey’s base salary of 12.5% to $270,000 in recognition of his increased responsibilities as a result of this offering, his steady management of the accounting, accounts payable and accounts receivable and planning and analysis functions in 2009 and in light of the fact that he had not received a base salary increase in recent years. Our compensation committee approved an increase to Mr. Blazye’s base salary of 10% to $345,840 in recognition of his increased responsibilities due to the ReD Acquisition in 2009, his assumption of the day-to-day management of Petrol Plus Region and in light of the fact that he had not received a base salary increase in recent years.
Mr. Hart joined us in September 2009 and Mr. House joined us in April 2009, each with an initial base salary of $275,000. These initial base salaries represented the results of arm’s-length negotiations at their time of employment. In negotiating the base salaries in connection with their initial employment, the compensation committee considered their levels of responsibility in our company, the base salaries of other employees with similar roles at our company, the base salaries of Messrs. Hart and House at their previous positions and our knowledge of the competitive market. Our compensation committee determined not to increase the salaries of Messrs. Hart and House in 2010 due to their relatively recent tenure.
Annual cash incentive compensation
Our compensation committee generally awards annual cash incentive payments to our executive officers. The annual cash incentive payments are intended to compensate our executive officers for achieving company-wide and/or individual or business unit performance goals that are important to our success. Our compensation committee approves all targets and payouts, in consultation with our chief executive officer. Executives are generally eligible for payments only if they are employed by us both on the last day of the applicable fiscal year and on the actual payment date of the bonus amount.
In April 2009, the compensation committee approved our 2009 annual cash incentive program for our executive officers employed at that time. The primary objectives of the program were to provide an incentive for superior work, to motivate our employees toward even higher achievement and business results, to tie our employees’
104
Table of Contents
Index to Financial Statements
goals to company performance and to enable us to attract and retain highly qualified individuals. In addition, the compensation committee approved goals under the incentive program for Mr. House at the time of his employment. Mr. Hart, who joined us in September 2009, did not participate in the program, but instead received a guaranteed bonus for 2009 in connection with his hiring, as described below. Mr. House, who joined us in April 2009, was eligible to participate in the program but was guaranteed a minimum bonus amount for 2009 in connection with his hiring, as described below.
The annual cash incentive program was intended to compensate for the achievement of both our annual financial goals and individual or business unit performance objectives, as outlined below, and was structured to result in significant compensation payouts if targets were achieved. Our compensation committee set the target payout levels, generally as a percentage of base salary, for the executive officers based on recommendations from the chief executive officer (except with respect to his own level). The compensation committee determined these target payout levels based on a combination of factors, including each executive’s role and responsibilities, experience and skills and expected contribution to our company. Mr. Clarke’s target payout level was set at 100% of his base salary and, in addition, incorporated two additional goals in the amount of $100,000 each. Mr. Dey’s target payout level was set at 33% of his base salary. Mr. House’s target payout level was set at 50% of his base salary. Mr. Blazye’s target payout level was set at 50% of his base salary.
The compensation committee may also grant discretionary bonuses based on its subjective evaluation of company performance and the executive officers’ performance during the year. Discretionary bonus grants to the named executive officers for 2009 performance are discussed below.
2009 Performance goals and results. Our compensation committee structured the 2009 annual incentive program to include a combination of company-wide, business unit and individual performance goals, as appropriate, for the named executive officers. Individual or business unit performance goals are necessarily tied to the particular area of expertise and responsibilities of the executive and his or her performance in attaining those objectives. Our named executive officers prepare recommendations regarding their individual or business unit performance goals, which are reviewed by our chief executive officer and approved by the compensation committee. Pursuant to this process, our compensation committee approved the 2009 performance goals for each named executive officer, other than Mr. Hart who did not participate in the program.
The 2009 performance goals for each named executive officer that participated in the program are described below. Certain of these goals could be paid out in amounts up to 150% of the individual target amounts for performance exceeding objectives. Other goals could be paid out in amounts as low as 50% of the individual target amounts if performance achieved only a portion of the objectives.
Mr. Clarke was eligible to receive (i) 30% of his target award, or $187,500, if we achieved 2009 earnings per share of $3.34 and (ii) 70% of his target award, or $437,500 by successfully integrating certain acquisitions during 2009, hiring employees in certain key areas and achieving key financial and operating projects. We did not attain the target performance described in (i) above. Mr. Clarke achieved approximately 147%, or $643,750, of his award described in (ii) above. In addition, Mr. Clarke was eligible to receive an additional incentive award of $200,000 by (a) managing certain credit risks and (b) increasing revenue within a CLC lodging division. Mr. Clarke earned $100,000 of the additional incentive award.
Mr. Dey was eligible to receive (i) 50% of his target award, or $40,000, if we achieved 2009 earnings per share of $3.34 and (ii) 50% of his target award, or $40,000, by amending our receivables purchase agreement, completing certain acquisitions and generating certain tax savings through restructurings. We did not attain the target performance described in (i) above. Mr. Dey achieved 90%, or $36,000, of his award described in (ii) above.
Mr. House’s award did not include company-wide performance goals. Mr. House was eligible to receive his target award by managing credit risk, achieving certain revenue within certain business units and hiring employees in certain key areas. Mr. House achieved approximately 26%, or $36,094, of his award.
105
Table of Contents
Index to Financial Statements
Mr. Blazye’s award did not include company-wide performance goals. Mr. Blazye was eligible to receive his target award by achieving certain profits before taxes within certain business units, hiring employees in certain key areas, completing certain acquisitions, and executing certain operating arrangements. Mr. Blazye achieved 35%, or $55,020, of this award. In addition, Mr. Blazye was eligible to receive an additional incentive award of $80,650 by completing certain acquisitions. Mr. Blazye earned $31,440 of the additional incentive award.
The annual incentive award amounts earned by each named executive officer under our cash incentive program are included in the Non-Equity Incentive Plan Compensation column in the Summary Compensation Table below.
2009 Discretionary and guaranteed bonuses. Upon the recommendation of our chief executive officer, the compensation committee determined to award additional discretionary bonuses to certain of our named executive officers for 2009. Messrs. Dey, House and Blazye received discretionary bonuses of $29,000, $31,250 and $39,300, respectively. For Mr. Dey, the compensation committee noted that his structuring of payments for our 2009 acquisitions resulted in significant overall expense savings for the company, his creation of a new corporate entity structure will create ongoing expense savings for the company and his role in increasing the account receivable facility availability. For Mr. House, the compensation committee noted that he made significant progress in overseeing the reduction of bad debt during 2009 and recognized his assumption of increased responsibilities during 2009 for certain sales and marketing oversight. For Mr. Blazye, the compensation committee noted that he made considerable progress in 2009 toward winning a private label contract.
The compensation committee also determined to award a discretionary bonus to Mr. Clarke of $56,250, so that his actual 2009 incentive compensation would be equivalent to his actual 2008 incentive compensation, in accordance with the compensation committee’s belief that Mr. Clarke’s performance during 2009 was consistent with his performance during 2008. In awarding the discretionary bonus, the compensation committee also noted that he successfully hired new talent to the senior executive team in 2009 and his leadership of value-added projects for our company in 2009 including corporate entity restructuring, increasing the accounts receivable facility capacity, reducing bad debt and launching of new products and services.
In connection with their hiring, Messrs. Hart and House negotiated guaranteed minimum bonus amounts for 2009 of $35,000 and $68,750, respectively. In negotiating the guaranteed bonuses in connection with their initial employment, the compensation committee considered their levels of responsibility in our company, their bonus history at their previous positions and our knowledge of the competitive market.
The discretionary and guaranteed bonus amounts earned by each named executive officer for 2009 are included in the Bonus column in the Summary Compensation Table below.
2010 Annual cash incentive program. The compensation committee has approved a 2010 annual cash incentive program that is materially consistent with our 2009 program.
Long-term equity incentive awards
The goals of our long-term, equity-based incentive awards are to motivate long-term performance and align the interests of our executive officers with the interests of our stockholders. Because vesting is based on continued employment, our equity-based incentives also encourage the retention of our executive officers through the vesting period of the awards. We do not typically provide equity awards to our executives on an annual basis. For example, our chief executive officer received an equity award in 2009, but did not receive an equity award in 2008 and 2007.
We typically use equity awards to compensate our executive officers in the form of (1) initial grants in connection with the commencement of employment and additional “refresher” grants when an executive has vested in his existing grants and (2) grants designed to encourage a specific performance goal or to reward the executive for extraordinary performance. To date there has been no set program for the award of refresher grants,
106
Table of Contents
Index to Financial Statements
and our compensation committee retains discretion to make equity awards to executives at any time, including in connection with the promotion of an executive, to reward an executive, for retention purposes or for other circumstances. Our compensation committee has established a pool of shares available for equity awards, which is increased from time to time by the compensation committee, in consultation with our chief executive officer. All awards are subject to the availability of shares from this pool.
We believe that stock options are an effective tool for meeting our compensation goals because executives are able to profit from stock options only if our stock price increases relative to the stock option’s exercise price. In addition, we believe that performance-based restricted stock awards are an effective tool for meeting our compensation goals because the conditions to vesting motivate the achievement of performance goals and the value of the grants will increase as the value of our stock price increases.
In determining the size of the long-term equity incentives to be awarded to our executive officers, we take into account a number of internal factors, such as the relative job scope, the value of existing long-term incentive awards, individual performance history, prior contributions to us, the size of prior grants, arm’s-length negotiation at the time of an executive’s hiring and availability of shares in our pool. Our chief executive officer makes equity award grant recommendations for each executive, including our named executive officers (other than himself). Grant recommendations are presented to the compensation committee for its review and approval.
We do not have any security ownership requirements for our executive officers.
Prior to this offering, we granted options and performance-based restricted stock to our employees, including executive officers, under the FleetCor Technologies, Inc. Amended and Restated Stock Incentive Plan, which we refer to as our “2002 Plan.” See “—2002 Plan.”
Stock option grants. The exercise price of each stock option grant is the fair market value of our common stock on the grant date. For 2009, the determination of the appropriate fair market value was made by the board of directors. In the absence of a public trading market, the board considered numerous objective and subjective factors to determine its best estimate of the fair market value of our common stock as of the date of each option grant, including but not limited to, the following factors: (i) our operating performance, including metrics such as earnings per share; (ii) one-time gains and losses affecting our operating results and other extraordinary corporate events; and (iii) arm’s-length transactional valuations of our common stock.
As a privately owned company, there was no market for our common stock prior to this offering. Accordingly, in 2009, we had no program, plan or practice pertaining to the timing of stock option grants to executive officers coinciding with the release of material non-public information. Going forward, the compensation committee intends to adopt a formal policy regarding the timing of grants.
Stock option awards to our named executive officers typically vest ratably over a period of three to five years. In some cases a portion of the grant is immediately vested if the grant is designed to reward performance that has already been completed. We believe our vesting schedules generally encourage long-term employment with our company while allowing our executives to realize compensation in line with the value they have created for our stockholders.
Performance-based restricted stock grants. Our performance-based restricted stock grants generally contain individual or business unit performance conditions. Such shares typically do not vest until these performance conditions have been satisfied and we achieve a “qualifying liquidity event” for our stockholders, such as a sale, merger or an initial public offering, each exceeding a specified level of per-share consideration. See “—2002 Plan” for a further discussion of qualifying liquidity events.
107
Table of Contents
Index to Financial Statements
2009 Equity awards. During 2009, we granted the following equity awards to our named executive officers:
| Name | Shares of performance based restricted stock |
Stock options | ||||||
| Ronald F. Clarke |
300,000 | 300,000 | ||||||
| Alex P. Hart |
— | 50,000 | ||||||
| Todd W. House |
— | 50,000 | ||||||
Mr. Clarke’s shares of restricted stock will vest upon a qualifying liquidity event, such as this offering, if the per-share consideration received in such transaction is greater than or equal to certain specified thresholds. A certain number of the shares will vest if the per-share consideration ranges from an increase of 28% to 140% over the fair value of our common stock on the grant date. Of Mr. Clarke’s options, 67,500 vested on the grant date, and 67,500 vest on June 17, 2010, June 17, 2011 and June 17, 2012, respectively, and 30,000 vest on June 17, 2013. In determining the size of the option and restricted stock grant to Mr. Clarke in June 2009, the compensation committee noted that he had not received an equity grant since August 2006 and had vested in almost 90% of his previously-granted equity awards. The compensation committee believed that it would need to make a significant grant of equity in order to retain Mr. Clarke, encourage his leadership efforts in growing our stock price and moving our company toward a liquidity event and more closely align Mr. Clarke’s interests with those of our stockholders.
Mr. Hart’s options were granted in connection with his hiring in September 2009, and Mr. House’s options were granted in connection with his hiring in April 2009. Both option grants vest ratably over four years. In addition, the compensation committee approved awards of up to 35,000 shares of performance-based restricted stock to Messrs. Hart and House in connection with their hiring. The terms of these awards were established in June 2010 and are described below under “—2010 equity awards.” Because the terms of these awards were not established in 2009, these awards were not deemed to be granted in 2009 and are not included in the table above or the compensation tables below. The equity grants to Messrs. Hart and House were based on arm’s-length negotiations at the time of their hire. In negotiating the number of the option and restricted stock awards in connection with their initial employment, the compensation committee considered their level of responsibility in our company and the expected value of the equity grants based on our knowledge of the competitive market.
Messrs. Dey and Blazye were not granted any equity awards during 2009 because of the limited number of shares available for grant in the pool and because they had received grants of awards in prior years.
2010 equity awards. In June 2010, the compensation committee finalized the terms of the previously-approved performance-based restricted stock grants under the 2002 Plan to Messrs. Hart and House described in “—2009 equity awards” above. Of Mr. Hart’s award of 35,000 shares, (1) 2,000 would have vested upon the achievement of earnings per share targets in each of 2010, 2011 and 2012, and (2) 14,500 would have vested upon the achievement of certain operating metrics within certain lines of business in each of 2011 and 2012. Mr. Hart forfeited these shares upon his resignation. Mr. House’s award was reduced to 30,000 shares, (1) 5,000 of which vest upon the completion of this offering, (2) 2,000 of which vest upon the achievement of earnings per share targets in each of 2010, 2011 and 2012 and (3) 9,500 of which vest upon the achievement of certain operating metrics within certain lines of business in each of 2011 and 2012. These awards were initially approved in 2009 for the reasons described in “—2009 equity awards” above, and the specific terms of the awards described above were made to encourage these executives to work to complete this offering and to grow our business in the short- and long-term. In addition, the compensation committee finalized the terms of a previously-approved performance-based restricted stock grant to Mr. Blazye.
108
Table of Contents
Index to Financial Statements
Mr. Blazye’s award was reduced from 35,000 to 30,000 shares, (1) 5,000 of which will vest upon the closing of this offering, (2) 2,000 of which will vest upon the achievement of earnings per share targets in each of 2010, 2011 and 2012 and (3) 19,000 of which will vest upon the achievement of certain business transactions.
In addition to finalizing the terms of previous grants, in June 2010 (subject to certain modifications that were made in September 2010) our compensation committee authorized new awards to our chief executive officer and our other executive officers and employees pursuant to the 2010 Plan, subject to effectiveness of the 2010 Plan. The grants described below will be adjusted to reflect the two and one-half-for-one stock split effected on November 29, 2010.
Mr. Clarke received a grant, contingent upon the closing of this offering, of (1) 166,667 shares of restricted stock, 20% of which will vest on each of July 1, 2011, 2012, 2103, 2014 and 2015, (2) 166,667 shares of performance-based restricted stock, 20% of which will vest upon our common stock reaching, for a 30 day trading period, each of 1.25, 1.50 and 1.75 times the public offering price (for a total of 60%) and 40% of which will vest upon our common stock reaching, for a 30 day trading period, 2.00 times the public offering price, and (3) 333,333 options with an exercise price equal to the public offering price, 25% of which will vest on each of July 1, 2011, 2012, 2103 and 2014. In addition, the compensation committee has committed to grant to Mr. Clarke, (provided he continues to be employed by us at the time of grant) on the second anniversary of the closing of this offering, 333,333 options, with an exercise price equal to the fair market value of our common stock on the date of grant, 25% of which will vest upon each of July 1, 2011, 2012, 2103 and 2014. Mr. Clarke’s equity grants were made in recognition of his outstanding efforts in connection with this offering, to incentivize him to work to grow our stock price over time and as a retention incentive.
Messrs. Dey, House and Blazye received grants, contingent upon the closing of this offering, of (1) 42,105, 15,000, and 15,000 options, respectively, with an exercise price equal to the public offering price, 25% of which will vest on each of July 1, 2011, 2012, 2013 and 2014 and (2) 42,105 options each, with an exercise price equal to the public offering price, 25% of which will vest on each of July 1, 2013, 2014, 2015 and 2016. In addition, Mr. Dey received a grant, contingent upon the closing of this offering, of 2,000 shares of performance-based restricted stock, which will vest upon the achievement of a 2010 earnings per share target. The grants to Messrs. Dey, House and Blazye were made to incentivize them to work to grow our stock price over time, to achieve growth in targeted areas of our business, to encourage their efforts in achieving strong earnings per share in 2010 and as a retention incentive. Mr. Hart did not receive any grant because of the limited number of shares available for grant in connection with the offering and because the committee believed that his existing awards provided sufficient incentives.
In addition to the grants to the named executive officers, the compensation committee granted to our other executive officers and employees, contingent upon the closing of this offering, a total of (1) 331,483 options, with an exercise price equal to the public offering price, 25% of which will vest on each of July 1, 2011, 2012, 2013 and 2014, (2) 409,647 options, with an exercise price equal to the public offering price, 25% of which will vest on each of July 1, 2013, 2014, 2015 and 2016, and (3) a total of 8,000 shares of performance-based restricted stock, which will vest upon the achievement of a 2010 earnings per share target or other performance-based target.
We have reserved an aggregate of 6,750,000 shares (post stock split) of common stock under the FleetCor Technologies, Inc. 2010 Equity Compensation Plan, which we refer to as the “2010 Plan.” See “—2010 equity compensation plan.” Our 2010 Plan has been approved by our board of directors and stockholders effective upon the closing of this offering. Subsequent to this offering, all equity awards will be made pursuant to the 2010 Plan and no further awards will be made under the 2002 Plan; however, all options granted prior to this offering will remain valid in accordance with their terms. The 2010 Plan will permit the grant of stock options, stock appreciation rights and stock grants. See “—2010 equity compensation plan.”
109
Table of Contents
Index to Financial Statements
Benefits and perquisites
We provide benefits and perquisites to our named executive officers as described below. Because Mr. Blazye is based in the United Kingdom, his benefits differ from the benefits offered to our U.S.-based employees and are generally consistent with the benefits offered to our U.K.-based employees.
We offer all U.S.-based employees the opportunity to participate in a 401(k) plan. The general purpose of our 401(k) plan is to provide employees with an incentive to make regular savings in order to provide additional financial security during retirement. Our 401(k) plan provides that we match 25% of an employee’s contribution, up to an employee contribution of 4% of salary. Our named executive officers (other than Mr. Blazye) participate in this 401(k) plan on the same basis as all of our other participating employees. Our U.K. employees, including Mr. Blazye, are eligible to participate in a self-invested personal pension plan, called a SIPP, which is similar to a 401(k) plan or other qualified deferred compensation plan. If Mr. Blazye contributes 2% of his annual base salary to the SIPP, we are required to contribute 5% of his annual base salary to the SIPP.
We provide to all of our eligible employees, including our named executive officers, health and welfare benefits and we pay the premiums for these benefits on behalf of our named executive officers. We provide to our named executive officers life insurance benefits and long term care insurance and pay the premiums on their behalf.
We do not provide any nonqualified deferred compensation arrangements or defined benefit pension plans to our named executive officers.
Severance and change of control benefits
Under their employment agreements or offer letters, and pursuant to our historic practice, our executive officers are generally entitled to certain severance and change of control benefits. If we terminate Mr. Clarke’s employment for any reason other than for cause, Mr. Clarke will receive cash severance payments, in equal monthly installments over 12 months equal to 150% of his then-current annual base salary plus any accrued and unpaid vacation. Mr. Clarke will is also eligible to receive payment of his health insurance premiums in amounts equal to those made immediately prior to his termination and, if permissible, continuation of coverage under our life and disability insurance plans for twelve months. In addition, if Mr. Clarke’s employment is terminated for good reason or is terminated for any reason other than cause, in each case within 12 months following a change in control, he can elect to have us purchase from him all stock options granted to him and all shares of our stock that he then owns at fair market value.
Each of our other named executive officers will receive cash severance in the amount of six months of his then-current salary, upon execution of a general release, if he is terminated by us for any reason other than for cause. We provide severance compensation if our executives are terminated without cause, to incentivize our executive officers to act in the best interests of our stockholders in the face of a transaction even if they may be terminated as a result. For a further discussion of these benefits, see “—Employment agreements and offer letters” and “—Potential payments on termination or change in control.”
Our stock option and restricted stock award agreements do not provide for accelerated vesting under any circumstances. Outstanding restricted stock awards generally vest only upon a “qualifying liquidity event”, such as this offering, subject in most cases to the additional condition that the price to the public exceeds applicable thresholds. See “—2002 Plan.”
110
Table of Contents
Index to Financial Statements
Section 162(m)
Section 162(m) of the Code limits a public company’s deduction for federal income tax purposes to not more than $1 million of compensation paid to certain executive officers in a calendar year. Compensation above $1 million may be deducted if it is “performance-based compensation.” Section 162(m) of the Code was not applicable to us in 2009 because we were not a public company. When we become a public company, we intend to rely on an exemption from Section 162(m) for a plan adopted prior to the time a company becomes a public company. Subject to certain requirements, we may rely on this “grandfather” provision for certain awards granted under our 2010 Plan for a period that ends no later than the first stockholders meeting after the close of the third calendar year following the calendar year in which our initial public offering occurs. We anticipate that the compensation committee will evaluate the effects of the compensation limits of Section 162(m) on any compensation it proposes to grant, and the compensation committee intends to provide future compensation in a manner consistent with our best interests and those of our stockholders.
Summary compensation table for 2009
The following table shows the compensation for each of the named executive officers for 2009, calculated in accordance with SEC rules and regulations.
| Name and principal position |
Year | Salary ($)(1) |
Bonus ($)(2) |
Stock awards ($)(3) |
Option awards ($)(4) |
Non-Equity incentive plan compensation ($)(5) |
All other compen- sation ($)(6) |
Total ($) |
||||||||||||||||||||||||
| Ronald F. Clarke |
2009 | $ | 614,863 | $ | 56,250 | $ | 1,200,000 | $ | 1,737,675 | $ | 743,750 | $ | 19,493 | $ | 4,372,031 | |||||||||||||||||
| President, Chief Executive Officer and Chairman of the Board of Directors |
||||||||||||||||||||||||||||||||
| Eric R. Dey |
2009 | $ | 240,000 | $ | 29,000 | — | — | $ | 36,000 | $ | 19,160 | $ | 324,160 | |||||||||||||||||||
| Chief Financial Officer |
||||||||||||||||||||||||||||||||
| Alex P. Hart |
2009 | $ | 76,096 | $ | 35,000 | — | $ | 627,500 | — | $ | 4,615 | $ | 743,211 | |||||||||||||||||||
| President—Direct Business |
||||||||||||||||||||||||||||||||
| Todd W. House |
2009 | $ | 192,877 | $ | 63,906 | — | $ | 357,000 | $ | 36,094 | $ | 10,679 | $ | 660,556 | ||||||||||||||||||
| Chief Operating Officer |
||||||||||||||||||||||||||||||||
| Andrew R. Blazye(7) |
2009 | $ | 314,400 | $ | 39,300 | — | — | $ | 86,460 | $ | 19,344 | $ | 459,504 | |||||||||||||||||||
| Chief Executive Officer—FleetCor Europe |
||||||||||||||||||||||||||||||||
| (1) | This column represents the salary earned from January 1 through December 31, 2009. |
| (2) | This column represents the discretionary and guaranteed bonus amounts paid for 2009. For a description of these payments, see “—Components of compensation—Annual cash incentive compensation.” |
| (3) | The values for stock awards in this column represent the aggregate grant date fair value for the performance-based restricted stock awards granted in 2009, computed in accordance with FASB ASC Topic 718. Awards with performance conditions, such as the performance-based restricted stock granted in 2009, are computed based on the probable outcome of the performance condition as of the grant date for the award. For an overview of the features of these awards, see “—Components of compensation—Long-term equity incentive awards”. The maximum grant date fair value of Mr. Clarke’s performance-based restricted stock awards assuming satisfaction of all performance conditions is $7,500,000. |
111
Table of Contents
Index to Financial Statements
| (4) | The values for stock option awards in this column represent the aggregate grant date fair value for the stock option awards granted in 2009 computed in accordance with FASB ASC Topic 718. The assumptions used to value these awards can be found in Note 5 in the accompanying consolidated financial statements. For an overview of the features of these awards, see “—Components of compensation—Long-term equity incentive awards”. |
| (5) | This column represents the amounts earned under the 2009 annual cash incentive award program based on achievement of performance goals under the program. For a description of the program, including the performance goals under the program, see “—Components of compensation—Annual cash incentive compensation.” |
| (6) | The following table breaks down the amounts shown in this column for 2009 (all amounts in $): |
| Name | Company based SIPP |
Health benefit premiums |
Life insurance premiums |
Long-Term care |
Total | |||||||||||||||
| R. Clarke |
— | $ | 17,592 | $ | 864 | $ | 1,037 | $ | 19,493 | |||||||||||
| E. Dey |
— | $ | 17,592 | $ | 826 | $ | 742 | $ | 19,160 | |||||||||||
| A. Hart |
— | $ | 4,399 | $ | 216 | — | $ | 4,615 | ||||||||||||
| T. House |
— | $ | 10,154 | $ | 525 | — | $ | 10,679 | ||||||||||||
| A. Blazye |
$ | 15,720 | $ | 2,767 | $ | 857 | — | $ | 19,344 | |||||||||||
| (7) | Because Mr. Blazye is based in the United Kingdom, his compensation is denominated in British Pounds; all amounts for Mr. Blazye have been converted into dollars at an exchange rate of 1.572 to £1, the average exchange rate during 2009. |
Grants of plan-based awards for 2009
The following table provides information about awards granted in 2009 to each of the named executive officers.
| Name |
Grant date |
Date
of |
Estimated possible payouts under non-equity incentive plan awards(2) |
Estimated future payouts under equity incentive plan awards(3) |
All other options |
Exercise awards |
Grant date award |
|||||||||||||||||||||||||||||
| Threshold ($) |
Target ($) |
Maximum ($) |
Target (#) |
|||||||||||||||||||||||||||||||||
| Ronald F. Clarke |
— | $ | 625,000 | $ | 1,125,000 | |||||||||||||||||||||||||||||||
| 6/17/2009 | 6/17/2009 | 300,000 | $ | 1,200,000 | ||||||||||||||||||||||||||||||||
| 6/17/2009 | 6/17/2009 | 300,000 | $ | 25 | $ | 1,737,675 | ||||||||||||||||||||||||||||||
| Eric R. Dey |
— | $ | 80,000 | $ | 104,000 | |||||||||||||||||||||||||||||||
| Alex P. Hart |
— | — | — | |||||||||||||||||||||||||||||||||
| 12/17/2009 | 12/14/2009 | 50,000 | $ | 45 | $ | 627,500 | ||||||||||||||||||||||||||||||
| Todd W. House |
— | $ | 137,500 | $ | 192,500 | |||||||||||||||||||||||||||||||
| 8/11/2009 | 4/15/2009 | 50,000 | $ | 25 | $ | 357,000 | ||||||||||||||||||||||||||||||
| Andrew R. Blazye |
— | $ | 157,200 | $ | 251,520 | |||||||||||||||||||||||||||||||
| (1) | Awards for Mr. House were authorized on April 15, 2009, but were not granted until August 11, 2009, because of insufficient shares available in our pool. |
| (2) | The amount reflects the target and maximum amounts that could be earned under our 2009 annual cash incentive program for each named executive officer. There is no threshold amount under the program. For information concerning this program, see “—Components of compensation—Annual cash incentive compensation.” Because Mr. Blazye is based in the United Kingdom, his compensation is denominated in British Pounds; all amounts for Mr. Blazye have been converted into dollars at an exchange rate of 1.572 to £1, the average exchange rate during 2009. |
| (3) | These columns show the number of shares of restricted stock that would be earned by Mr. Clarke if the performance goal is satisfied. The award does not have a threshold or maximum amount. For information concerning this grants, see “—Components of compensation—Long-term equity incentive awards—2009 Equity awards.” |
| (4) | This column shows the number of stock options granted in 2009. For information concerning these grants, see “—Components of compensation—Long-term equity incentive awards—2009 Equity awards.” |
112
Table of Contents
Index to Financial Statements
| (5) | This column shows the grant date fair value of the restricted stock and stock option awards under FASB ASC Topic 718 granted to each of the named executive officers in 2009. Awards with performance conditions, such as the performance-based restricted stock granted to Mr. Clarke in 2009, are computed based on the probable outcome of the performance condition as of the grant date for the award. There can be no assurance that the grant date fair value of stock and option awards will ever be realized by the named executive officers. |
Outstanding equity awards at fiscal year-end 2009
The following table shows the number of stock options and restricted stock held by the named executive officers on December 31, 2009.
| Option awards | Stock awards | |||||||||||||||||||||||||||
| Name | Number of securities underlying unexercised options (#) exercisable |
Number of securities underlying unexercised options (#) unexercisable (1) |
Option exercise price ($) |
Option grant date |
Option expiration date |
Equity unearned shares, units or other rights that have not vested (#)(2) |
Equity incentive unearned shares, units or other rights that have not vested ($)(3) |
|||||||||||||||||||||
| Ronald F. Clarke |
|
333,333 200,000 67,500 — |
|
|
— — 232,500 — |
|
$ $ $
|
5.77 13.00 25.00 — |
|
|
1/3/2005 11/7/2005 6/17/2009 — |
|
|
1/3/2015 11/7/2015 6/17/2019 — |
|
|
— — — 500,000 |
|
$ |
— — — 18,000,000 |
| |||||||
| Eric R. Dey |
— | — | — | — | — | — | — | |||||||||||||||||||||
| Alex P. Hart |
— | 50,000 | $ | 45.00 | 12/17/2009 | 12/17/2019 | — | — | ||||||||||||||||||||
| Todd W. House |
— | 50,000 | $ | 25.00 | 8/11/2009 | 8/11/2019 | — | — | ||||||||||||||||||||
| Andrew R. Blazye |
43,334 | 21,666 | $ | 30.00 | 9/20/07 | 9/20/2017 | — | — | ||||||||||||||||||||
| (1) | Stock options granted on June 17, 2009 vested 67,500 on June 17, 2010 and vest 67,500 each on June 17, 2011 and June 17, 2012 and 30,000 on June 17, 2013. Stock options granted on December 17, 2009 and August 11, 2009 each vested or will vest ratably on the first, second, third and fourth anniversaries of the respective grant dates. Stock options granted on September 20, 2007 vested 21,667 each on July 9, 2008 and July 9, 2009, and will vest 21,666 on July 9, 2010. |
| (2) | Represents restricted stock award to be earned by Mr. Clarke upon the satisfaction of applicable performance condition of a qualifying liquidity event where the per-share consideration exceeds certain thresholds, and will vest upon the closing of this offering. |
| (3) | Market or payout value assumes that a qualifying liquidity event occurred on December 31, 2009 at a per-share value of $45 per share, which represents the fair value of our common stock as of December 31, 2009, as determined by our board of directors. At such value, 100,000 of Mr. Clarke’s restricted shares would expire unvested. There is no guarantee that this amount will be earned by Mr. Clarke, and if any amount is earned, it may differ from the amount shown in this column. |
Nonqualified deferred compensation
We do not provide any nonqualified deferred compensation arrangements to our named executive officers.
Pension benefits
We do not provide any defined benefit pension plans to our named executive officers.
Annual executive incentive program
Our board of directors has adopted the FleetCor Technologies, Inc. Annual Executive Incentive Program, which we refer to in this prospectus as the Incentive Program.
Background. Under Section 162(m) of the Internal Revenue Code, after the initial public offering of our common stock, we cannot deduct compensation paid in any fiscal year to our chief executive officer and our three other highest paid officers (other than the chief financial officer) for such year which exceeds $1 million, unless such compensation meets the requirements for performance-based compensation under Section 162(m) of
113
Table of Contents
Index to Financial Statements
the Internal Revenue Code or satisfies a transition rule available for a company that becomes a publicly held corporation. One of the requirements for this transition rule is that the prospectus accompanying our initial public offering discloses information regarding the program under which the compensation is provided. We are providing the following information for purposes of satisfying this transition rule.
Purpose. The purpose of the Incentive Program is to give each participant the opportunity to receive an annual bonus in each fiscal year payable in cash if, and to the extent, the committee administering the Incentive Program determines that the performance goals set by the committee for each participant for such year have been satisfied.
Administration. The committee administering the Incentive Program will be our board’s compensation committee or, following the expiration of a transition period under the Internal Revenue Code and if all members of that committee fail to qualify as “outside directors” within the meaning of Section 162(m), a subcommittee of such committee that consists solely of outside directors.
Participants. The committee has the right to designate any of our executive officers, including our chief executive officer and any other of our employees whom the committee deems a key employee, as a participant in the Incentive Program provided (1) such designation is made no later than 90 days from the beginning of our fiscal year or (2) such designation is effective on the date an individual is first employed if he or she will be a key employee on the date he or she is first employed by us.
Performance criteria upon which performance goals are based. The committee will establish performance goals for each participant for each fiscal year no later than 90 days after the beginning of such year (or for an individual who is a key employee on the date he or she is first employed, within the 30-day period that starts on the date he or she is first employed by FleetCor). The performance goals for participants may be different and, further, each participant’s performance goals may be based on different performance criteria. However, all performance goals will be based on one or more of the following performance criteria, or any variations of the following business criteria: (1) our return over capital costs or increases in our return over capital costs, (2) our total earnings or the growth in such earnings, (3) our consolidated earnings or the growth in such earnings, (4) our earnings per share or the growth in such earnings, (5) our net earnings or the growth in such earnings, (6) our earnings before interest expense, taxes, depreciation, amortization and other non-cash items or the growth in such earnings, (7) our earnings before interest and taxes or the growth in such earnings, (8) our consolidated net income or the growth in such income, (9) the value of our common stock or the growth in such value, (10) our stock price or the growth in such price, (11) our return on assets or the growth on such return, (12) our cash flow or the growth in such cash flow, (13) our total shareholder return or the growth in such return, (14) our expenses or the reduction of our expenses, (15) our sales growth, (16) our overhead ratios or changes in such ratios, (17) our expense-to-sales ratios or the changes in such ratios, (18) our economic value added or changes in such value added, (19) our gross margin or growth in such gross margin, or (20) our bad debt expense or the reduction in such bad debt expense.
The performance goals may, as the committee deems appropriate, be based on criteria related to company-wide performance, division-specific performance, department-specific performance, region-specific performance, personal performance or any combination of such criteria.
Maximum annual bonus. The maximum annual bonus payable under the Incentive Program to any participant for any fiscal year cannot exceed 500% of the base salary which is paid to such participant in such fiscal year or $5 million, whichever is less. However, a bonus will be paid to a participant under the Incentive Program for a fiscal year only to the extent the participant satisfies his or her performance goals for such bonus for such fiscal year, and the committee certifies in writing prior to payment of any bonus under the Incentive Program the extent, if any, to which a participant has satisfied his or her performance goals for each fiscal year. Finally, the committee shall have the discretion to reduce but not to increase the bonus payable to any participant if the committee acting in its discretion determines that such reduction is appropriate.
114
Table of Contents
Index to Financial Statements
Amending and terminating the incentive program. The committee shall have the power to amend the Incentive Program from time to time as the committee deems necessary or appropriate and to terminate the Incentive Program if the committee deems such termination in the best interest of FleetCor.
2010 Equity compensation plan
Our board of directors and stockholders have adopted the FleetCor Technologies, Inc. 2010 Equity Compensation Plan, which we refer to in this prospectus as the 2010 Plan, effective upon the completion of this offering. The purpose of the 2010 Plan is to:
| • | attract and retain employees and directors; |
| • | provide an additional incentive to employees and directors to work to increase the value of our common stock; and |
| • | provide employees and directors with a stake in the future of our company which corresponds to the stake of each of our stockholders. |
No grants will be made under our 2002 Plan on or after the date the 2010 Plan becomes effective.
Share reserve. We have reserved a total of 6,750,000 (post stock split) shares of our common stock for issuance pursuant to our 2010 Plan. All shares reserved for issuance shall remain available for issuance under our 2010 Plan until issued pursuant to the exercise of any option, stock appreciation right or issued pursuant to a stock grant, and when any shares are issued pursuant to any option, stock appreciation right or stock grant, the shares reserved for issuance shall be reduced on a one-to-one basis. Any shares of common stock issued pursuant to a stock grant, which are forfeited will again be available for grants under the 2010 Plan, and if the option price is paid in common stock or if shares of common stock are tendered in satisfaction of any condition to the stock grant, such shares shall not be available for grant under the 2010 Plan.
Administration. The compensation committee of our board of directors, or a subcommittee of the compensation committee, will administer our 2010 Plan. All grants under the 2010 Plan will be evidenced by a certificate that incorporates such terms and conditions as the compensation committee (or its subcommittee) deems necessary or appropriate.
Types of awards. Our 2010 Plan provides for the following types of awards to certain eligible employees and outside directors: stock options; stock grants; and stock appreciation rights, or SARs. Under the 2010 Plan, stock options may be incentive stock options, which we refer to as ISOs, or non-incentive stock options.
Eligibility. The compensation committee may grant options that are intended to qualify as ISOs only to eligible employees and may grant all other awards to eligible employees and outside directors. An eligible employee is an employee of FleetCor or any subsidiary, parent or affiliate of FleetCor who has been designated by the compensation committee to receive a grant under the 2010 Plan. No eligible employee or outside director in any calendar year may be granted an option to purchase more than 2,250,000 shares of common stock, a SAR based on the appreciation with respect to more than 2,250,000 shares of common stock or stock grants, which are intended to satisfy the requirements of Section 162(m) of the Internal Revenue Code, for more than 2,250,000 shares of common stock; provided, that, the compensation committee will have the discretion to increase each such grant limit to 2,500,000 shares of common stock if deemed necessary or appropriate in connection with hiring any eligible employee.
Options. The exercise price for stock options granted under our 2010 Plan may not be less than the fair market value of our common stock on the option grant date. Option recipients may, in the discretion of the compensation committee, pay the exercise price by using cash, check, stock or through an approved cashless exercise procedure.
115
Table of Contents
Index to Financial Statements
Our options vest at the time or times determined by the compensation committee. The compensation committee, in its discretion, may require completion of a period of service as an eligible employee or outside director and/or satisfaction of a performance requirement before an option may be exercised. Our options will expire at a time determined by the compensation committee, but in no event more than ten years after they are granted. At the compensation committee’s discretion, the option certificate may provide for the exercise of an option after an employee’s or director’s status has been terminated for any reason whatsoever, including death and disability.
Tax limitations on incentive stock options. The aggregate fair market value, determined at the time of grant, of shares of our common stock with respect to ISOs that are exercisable for the first time by an optionholder during any calendar year under all of our stock plans may not exceed $100,000. No ISO may be granted to any person who, at the time of grant, owns or is deemed to own stock possessing more than ten percent of our total combined voting power or that of any of our affiliates unless (a) the option exercise price is at least 110% of the fair market value of the stock subject to the option on the date of grant and (b) the term of the ISO does not exceed five years from the date of grant.
Stock appreciation rights. SARs may be granted by the compensation committee to eligible employees and outside directors under the 2010 Plan, either as part of an option or as stand alone SARs. The terms and conditions for a SAR granted as part of an option will be set forth in the option certificate for the related option, while the terms and conditions for a stand alone SAR will be set forth in a SAR certificate. SARs entitle the holder to receive the appreciation of the fair market value of one share of common stock as of the date such right is exercised over the baseline price specified in the option or SAR certificate, or the SAR Value, multiplied by the number of shares of common stock in respect of which the SAR is being exercised. The SAR Value for a SAR must equal or exceed the fair market value of a share of common stock as determined on the grant date in accordance with the 2010 Plan. The SAR Value for a SAR granted together with an option shall be no less than the option price under the related option. If a SAR is granted together with an option, then the exercise of the SAR shall cancel the right to exercise the related option, and the exercise of a related option shall cancel the right to exercise the SAR. A SAR granted as a part of an option shall be exercisable only while the related option is exercisable. The compensation committee, in its discretion, may require completion of a period of service as an eligible employee or outside director and/or satisfaction of a performance requirement before a SAR may be exercised. At the discretion of the compensation committee, any payment due upon the exercise of a SAR can be made in cash or in the form of common stock.
Stock grants. Stock grants are grants which are designed to result in the issuance of common stock to the eligible employee or outside director to whom the grants are made, and stock grants may be granted by the compensation committee subject to such terms and conditions, if any, as the compensation committee acting in its absolute discretion deems appropriate. The compensation committee, in its discretion, may make the issuance of common stock under a stock grant and/or the vesting of such stock subject to certain conditions. These conditions may include, for example, a requirement that the eligible employee continue employment or the outside director continue service with us for a specified period or that we or the eligible employee achieve stated performance or other conditions. To the extent the performance conditions are intended to result in the stock grant qualifying as “performance-based compensation” under Section 162(m) of the Internal Revenue Code, the performance conditions will be one or more of the following: (1) our return over capital costs or increase in return over capital costs, (2) our total earnings or the growth in such earnings, (3) our consolidated earnings or the growth in such earnings, (4) our earnings per share or the growth in such earnings, (5) our net earnings or the growth in such earnings, (6) our earnings before interest expense, taxes, depreciation, amortization and other non-cash items or the growth in such earnings, (7) our earnings before interest and taxes or the growth in such earnings, (8) our consolidated net income or the growth in such income, (9) the value of our stock or the growth in such value, (10) our stock price or the growth in such price, (11) our return on assets or the growth in such return, (12) our cash flow or the growth in our cash flow, (13) our total stockholder return or the growth in such
116
Table of Contents
Index to Financial Statements
return, (14) our expenses or the reduction in such expenses, (15) our sales growth, (16) our overhead ratios or changes in such ratios, (17) our expense-to-sales ratios or changes in such ratios, (18) our economic value added or changes in such value added, (19) our gross margin or growth in such gross margin, or (20) our bad debt expense or the reduction in such bad debt expense.
Each stock grant shall be evidenced by a certificate which will specify what rights, if any, an eligible employee or outside director has with respect to such stock grant as well as any conditions applicable to the stock grant.
Transfer of awards. No award shall be transferable otherwise than by will or the laws of descent and distribution without the consent of the compensation committee.
Change in control. Pursuant to the 2010 Plan, all conditions to the exercise of outstanding options and SARs, and all conditions to the issuance or forfeiture of outstanding stock grants, will be deemed satisfied as of the effective date of the change in control, if as a result of a change in control:
| • | all of the outstanding options, SARs and stock grants granted under the 2010 Plan are not continued in full force and effect or there is no assumption or substitution of the options, SARs and stock grants (with their terms and conditions unchanged) in connection with such change in control; or |
| • | the terms of an option certificate, SAR certificate or stock grant certificate expressly provide that this provision applies to the grant made under such certificate even if there is such a continuation, assumption, or substitution of such grant or the 2010 Plan. |
In this case, our board of directors shall have the right to deem at the time of the change in control any and all terms and conditions to the exercise of all outstanding options and SARs on such date and any and all outstanding issuance and vesting conditions under any stock grants on such date be 100% satisfied on such date, and our board of directors shall also have the right, to the extent required as a part of a change in control transaction, to cancel all outstanding options, SARs and stock grants after giving eligible employees and outside directors a reasonable period of time to exercise their outstanding options and SARs or to take such other action as is necessary to receive common stock subject to stock grants.
The 2010 Plan also provides that if outstanding options, SARs and stock grants are continued in full force and effect or there is an assumption or substitution of the options, SARs and stock grants in connection with a change in control and the terms of option certificate, SAR certificate or stock grant certificate do not otherwise provide, then any conditions to the exercise of an eligible employee’s or director’s outstanding options and SARs and any issuance and forfeiture conditions of outstanding stock grants will automatically expire and have no further force or effect on or after the date that the employee’s or director’s service terminates, if:
| • | the employee’s employment with FleetCor is terminated at our initiative for reasons other than “cause” (as defined in the 2010 Plan) or is terminated at the employee’s initiative for “good reason” (as defined in the 2010 Plan) within the two-year period starting on the date of the change in control; or |
| • | an outside director’s service on our board of directors terminates for any reason within the two-year period starting on the date of the change in control. |
A change in control means, generally:
| • | any sale by us of all or substantially all of our assets or our consummation of any merger, consolidation, reorganization or business combination with any person, except for certain transactions to be described in the 2010 Plan; |
| • | the acquisition by any person, other than certain acquisitions to be specified in the 2010 Plan, of 30% or more of the combined voting power of our then-outstanding voting securities; |
117
Table of Contents
Index to Financial Statements
| • | a change in the composition of our board of directors that causes less than a majority of the directors to be directors that meet one or more of the descriptions to be set forth in the 2010 Plan; or |
| • | stockholder approval of our liquidation or dissolution, other than as will be provided in the 2010 Plan. |
Adjustment of shares. The number, kind or class of shares of common stock reserved for issuance under the 2010 Plan, the annual grant caps, the number, kind or class of shares of common stock subject to options or SARs granted under the 2010 Plan, and the option price of the options and the SAR Value of the SARs, as well as the number, kind or class of shares of common stock granted pursuant to stock grants under the 2010 Plan, shall be adjusted by the compensation committee in a reasonable and equitable manner to reflect any equity restructuring, change in the capitalization of our company or any transaction described in Internal Revenue Code section 424(a) which does not constitute a change in control, as provided in our 2010 Plan.
Adjustment of shares—mergers. The compensation committee, as part of any transaction described in Code Section 424(a) which does not constitute a change in control, shall have the right to adjust the number of shares of common stock reserved for issuance under the 2010 Plan without seeking approval of our stockholders, unless such approval is required by applicable laws or rules of the stock exchange. The compensation committee will also have the right to make stock, option and SAR grants to effect the assumption of, or the substitution for, stock, option and SAR grants previously made by any other corporation to the extent that such transaction calls for the substitution or assumption of such grants.
Amendments or termination. Our board of directors may amend or terminate our 2010 Plan at any time, subject to applicable laws and regulations requiring stockholder approval. No amendment may be made to the section of the plan governing a change in control which might adversely affect any rights that would otherwise vest on a change in control with respect to awards granted prior to the date of any such amendment. The 2010 Plan will terminate on the earlier of (1) the tenth anniversary of the date our stockholders approve its adoption and (2) the date upon which all of the stock reserved for use under the 2010 Plan has been issued or is no longer available for use under this plan.
2002 Plan
We previously adopted the FleetCor Technologies, Inc. Amended and Restated Stock Incentive Plan effective as of May 17, 2002, which we refer to in this prospectus as the 2002 Plan. The 2002 Plan expires on May 16, 2012, but we generally do not intend to grant awards under the 2002 Plan after the 2010 Plan is adopted. The purpose of the 2002 Plan is to provide equity awards to our employees, officers, directors, consultants and advisors. The 2002 Plan provides for incentive stock options, non-incentive stock options, restricted stock, and other awards based on our common stock, including without limitation, the grant of shares based upon certain conditions, the grant of securities convertible into our common stock and the grant of stock appreciation rights, phantom stock awards or stock units.
Unless otherwise expressly provided in the applicable award, upon the consummation of an acquisition (as defined in the 2002 Plan) our board or the board of directors of the surviving or acquiring entity (either of which we refer to as the “board”) shall make appropriate provision for the continuation of outstanding awards or the assumption of such awards by the surviving or acquiring entity by substituting on an equitable basis for the shares then subject to such awards either (a) the consideration payable in connection with the acquisition, (b) shares of stock of the surviving or acquiring corporation or (c) such other securities or consideration as the board deems appropriate. In addition to or in lieu of the foregoing, with respect to outstanding options, our board may provide that outstanding options must be exercised within a specified period after which the options will terminate or may provide that outstanding options will be terminated in exchange for a cash payment. Unless otherwise determined by the board, any repurchase or other rights that relate to an option or other award will
118
Table of Contents
Index to Financial Statements
continue to apply to any consideration, including cash, that has been substituted for the option or other award. We may hold in escrow all or any portion of any such consideration in order to effect any continuing restrictions. Upon the consummation of an acquisition, the exercisability and/or vesting provisions of awards shall be accelerated, if at all, in accordance with the terms and conditions of the award.
In the event of certain changes in our capitalization, our board will make certain adjustments as specified in the Plan. Our board may also amend, suspend or terminate the 2002 Plan at any time.
To date, we have issued restricted stock and stock options under the 2002 Plan. We have also agreed in certain instances to issue restricted stock in the future if certain issuance conditions are met.
Under the most common form of restricted stock award, the restricted stock award vests only if the recipient continuously maintains a business relationship as an employee, officer, director or consultant with us through the date of a “qualifying liquidity event” that is not a “private transaction”. For purposes of these restricted stock awards, a qualifying liquidity event is defined as (1) a liquidity event in which the per share liquidity value is at least a specified dollar amount (which amount is set forth in the individual award agreement) or (2) a firmly underwritten offering of our common stock pursuant to a registration statement which results in gross proceeds to us of $100 million or more and which has a per share price to the public of at least a specified dollar amount (which amount is set forth in the individual award agreement). On March 31, 2010, our board of directors determined that for purposes this offering, clause (2) above will be satisfied if the proceeds to the selling stockholders are greater than $100 million. A liquidity event is defined as the closing of (1) a sale of all or substantially all of our assets or a merger or consolidation of us with or into another corporation (other than a merger or consolidation in which our outstanding voting stock is exchanged or converted into or constitutes shares which represent more than 50% of the surviving entity’s voting capital stock) or (2) a transaction or series of transactions in which a person or group of persons acquire more than 50% of our voting power. A private transaction is defined as a liquidity event where the consideration does not consist of cash or cash equivalent consideration, registered securities or securities for which a registration statement will be filed within 90 days after the completion of the transaction.
We issued certain restricted stock awards that contain the vesting provision described above and also provide that if the employee’s business relationship with us ends as a result of an involuntary termination without cause or due to death or disability and there is a qualifying liquidity event that is not a private transaction within 24 months following the end of his business relationship, we will pay to this employee the proceeds that he would have otherwise received in the qualifying liquidity event (less any amounts we previously paid him) for such shares of restricted stock.
We issued certain restricted stock awards that become fully vested only if the employee continuously maintains a business relationship with us in his capacity as an employee, officer, director or consultant through the date of a liquidity event (as opposed to a qualifying liquidity event) that is not a private transaction.
We issued restricted stock awards to certain other employees which provide for vesting only if the employee continuously maintains a business relationship with us through the later of the date of a qualifying liquidity event (as specifically defined in these two restricted stock awards) or the date a goal specified in the restricted stock award is met. However, for purposes of these restricted stock awards, qualifying liquidity event does not require any specific per share liquidity value or any specific per share price to the public.
We issued a restricted stock award that provides for vesting if both a qualifying liquidity event that is not a private transaction (as such terms are specifically defined in the restricted stock award) occurs and the employee satisfies a service vesting schedule in such award. For purposes of these restricted stock awards, a qualifying liquidity event does not require any specific per share liquidity value or any specific per share price to the public.
119
Table of Contents
Index to Financial Statements
The board has the discretion to accelerate the vesting of any restricted stock award at any time without regard to whether there has been a qualifying liquidity event or other event or transaction.
The incentive stock options and non-incentive stock options granted under the 2002 Plan vest based on the optionee’s continued service with us through the dates specified in the option agreements and, except as described in this paragraph, have no special vesting rules if a liquidity event occurs. However, we granted stock options to Mr. Clarke which provide that in the event a liquidity event that is not a private transaction occurs while he maintains a business relationship with us and when the option is not fully vested, then upon the next scheduled vesting date, the option will be settled in cash with respect to the number of shares for which the option is vested on such date, in an amount per share equal to the difference between the (1) the lesser of the per share liquidity value and the fair market value of a share of stock on such date and (2) the option exercise price per share set forth in the option agreement. The option will have no further value after such settlement.
All option agreements give us a right of first refusal and impose transfer restrictions on the shares covered by the option agreement. The right of first refusal and transfer restrictions expire on the earlier of the tenth anniversary of the date of the option agreement, immediately prior to the close of a public offering of common stock by us pursuant to an effective registration statement filed with the SEC or the occurrence of an “acquisition” that is not a private transaction. If the optionee is a party to a stockholders’ agreement with us containing right of first refusal provisions, the stockholders agreement will control.
All option agreements and restricted stock agreements provide that if there is an initial underwritten public offering of our common stock, the shares subject to such awards may not be sold, offered for sale or otherwise disposed of without consent of the underwriters for a period of time after the execution of the underwriting agreement.
Employment agreements and offer letters
Ronald F. Clarke
We entered into an amended and restated employment agreement with Mr. Clarke, on November 29, 2010, which amended and restated his employment agreement entered into in connection with his hiring on September 25, 2000. The initial term of the employment agreement is through December 31, 2011, and the agreement automatically renews for successive one year periods unless we provide notice at least 30 days prior to the expiration date. Pursuant to the agreement, Mr. Clarke is entitled to an annual base salary of at least $687,500, with annual increases at the discretion of the compensation committee. We may terminate Mr. Clarke’s employment under the agreement by providing 30 days prior written notice and the payment of all sums due under the agreement. If we terminate Mr. Clarke’s employment for any reason other than for “cause” (as defined below), including through non-renewal of the agreement, Mr. Clarke will receive (1) cash severance payments, in equal monthly installments over 12 months (the “Severance Period”), in an amount equal to 150% of his then-current annual base salary plus any accrued and unpaid vacation; (2) at his election, payment of his health insurance premiums for coverage under the Consolidated Omnibus Budget Reconciliation Act of 1985, as amended in amounts equal to those made immediately prior to his termination until the earlier of the expiration of the Severance Period or his commencement of employment with another employer; and (3) continuation of coverage during the Severance Period under our life and disability insurance plans, if permitted by the terms of the plans.
In addition, if Mr. Clarke’s employment is terminated (1) for “good reason” (as defined below) or (2) by us for any reason other than cause, in each case within 12 months following a “change in control” (as defined below), he can elect to have us purchase from him all stock options granted to him as of January 1, 2010 and all shares of our stock that he owned as of January 1, 2010 at fair market value. The fair market value is determined by the change in control price, if the change in control is a cash transaction, or, in all other cases, by the board of directors in good faith.
120
Table of Contents
Index to Financial Statements
“Cause” is defined to mean: Mr. Clarke’s (1) failure to render services to us; (2) commission of an act of disloyalty, gross negligence, dishonesty or breach of fiduciary duty; (3) material breach of the agreement; (4) commission of any crime or act of fraud or embezzlement; (5) misappropriation of our assets; (6) violation of our material written rules or policies; (7) commission of acts generating material adverse publicity toward us; (8) commission or conviction of a felony; or (9) death or inability due to disability to perform his essential job functions for a period of three months.
“Good reason” is defined to mean, following a change in control, and without Mr. Clarke’s written consent: (1) there is a significant diminution in his responsibilities; (2) a reduction in his annual base salary or total compensation and benefits in the amount of 10% or more; (3) his principal place of employment is relocated to a place that is 25 miles from the prior principal place of employment; or (4) he is required to be away from his office 25% more than was required prior to the change in control.
“Change in control” has the same definition as in the 2010 Plan. See “—2010 Equity compensation plan—Change in control.”
Andrew R. Blazye
We entered into an employment agreement with Mr. Blazye on July 9, 2007. The agreement provides that Mr. Blazye’s employment shall continue until either party provides six months’ notice of termination; however, we may terminate the agreement immediately in certain limited circumstances. The agreement provides for a base salary of $314,400, which may be increased, and an annual target bonus payment of 50% of annual base salary and a maximum bonus payment of 75% of annual base salary. The agreement requires Mr. Blazye to make an annual payment in the amount of 2% of annual base salary to a pension plan and we are required to make an annual payment in the amount of 5% of annual base salary. Mr. Blazye has elected to participate in a defined contribution plan.
Other named executive officers
We entered into offer letter agreements with Messrs. Dey, Hart and House in connection with their hiring. Consistent with these offer letters and our historic practice, if any of these named executive officers is terminated by us for any reason other than for cause, we will (1) pay cash severance in the amount of six months of his then-current base salary and (2) provide health benefits for six months, each upon execution of a general release.
Confidentiality and non-competition agreements
Under the terms and conditions of the employee confidentiality and non-competition agreement executed by our named executive officers, which survives any termination of such executive’s employment, our named executive officers, for a period of one year following termination for any reason, have an obligation not to (i) disclose certain of our confidential information, (ii) accept employment with certain enumerated competitors, (iii) solicit, in competition with our sale of products or services, any of our customers with which such executive had substantial contact within one year of such executive’s termination and (iv) recruit or hire, or attempt to recruit or hire, any of our employees, consultants, contractors or other personnel, who have knowledge of certain of our confidential information and with whom such executive had substantial contact within one year of such executive’s termination. In addition, pursuant to the employee confidentiality and non-competition agreement, during the term of employment our named executive officers have an obligation not to (i) disclose certain of our confidential information or (ii) accept employment with certain enumerated competitors.
121
Table of Contents
Index to Financial Statements
Indemnification of directors and officers and limitation of liability
As allowed by the Delaware General Corporation Law we have adopted provisions in our amended and restated certificate of incorporation to relieve our directors from monetary damages to us or our stockholders for breach of each such director’s fiduciary duty as a director to the fullest extent permitted by the Delaware General Corporation Law.
We anticipate entering into indemnification agreements with each of our current directors and certain officers to give such directors and officers additional contractual assurances regarding the scope of their indemnification. The indemnification agreements will provide indemnification against all expenses (as defined in the agreement), judgments, fines and amounts paid in settlement actually and reasonably incurred to the fullest extent permitted by our amended and restated certificate of incorporation, amended and restated bylaws and the Delaware General Corporation Law, and to any greater extent that applicable law may in the future permit. The indemnification agreements will further provide procedures for the determination of a director or officer’s right to receive indemnification and to receive reimbursement of expenses as incurred. In addition, we maintain liability insurance for our directors and officers, which will be required by their indemnification agreements. We believe that the indemnification agreements and liability insurance are necessary to attract and retain qualified persons as directors and officers.
Potential payments on termination or change in control
The following table shows the potential payments to the named executive officers upon a termination of employment under various circumstances. In preparing the table, we assumed the termination occurred on December 31, 2009.
| Name | Severance Amount |
Accelerated Vesting of Equity Awards ($)(2) |
Benefits ($)(3) |
Total ($) |
||||||||||||
| Ronald F. Clarke |
||||||||||||||||
| Termination other than for cause |
$ | 949,519 | — | $ | 19,322 | $ | 968,841 | |||||||||
| Termination for good reason or termination without cause following a change in control |
$ | 949,519 | $ | 27,150,000 | $ | 19,322 | $ | 28,118,841 | ||||||||
| Eric R. Dey |
||||||||||||||||
| Termination other than for cause |
$ | 120,000 | — | $ | 9,661 | $ | 129,661 | |||||||||
| Alex P. Hart(4) |
||||||||||||||||
| Termination other than for cause |
$ | 137,500 | — | $ | 9,661 | $ | 147,161 | |||||||||
| Todd W. House |
||||||||||||||||
| Termination other than for cause |
$ | 137,500 | — | $ | 9,661 | $ | 147,161 | |||||||||
| Andrew R. Blazye |
||||||||||||||||
| Termination other than for cause |
$ | 157,200 | — | $ | 9,671 | $ | 166,871 | |||||||||
| (1) | For Mr. Clarke, represents 150% of his then-current annual base salary and any accrued vacation. For Messrs. Dey, Hart, House and Blazye, represents six months of their then-current annual base salary. |
| (2) | Under Mr. Clarke’s employment agreement he can elect to have us purchase, at fair market value, all outstanding stock options and shares of our stock then owned by him, upon a termination for good reason or without cause within 12 months after a change in control. The value shown above represents the value of the unvested options and restricted stock held by Mr. Clarke at December 31, 2009, assuming a value of $45 per share, for which vesting would be accelerated and that would we would be required to purchase from him should he so elect. |
Our equity incentive award agreements do not provide for accelerated vesting of equity awards under any circumstances. See “—2002 Plan.” Outstanding restricted stock awards will generally vest upon the closing of this offering, in some cases subject to the additional condition that the price to the public exceeds applicable thresholds.
| (3) | For Mr. Clarke, represents payment of medical, dental and vision benefits for 12 months. For Messrs. Dey, Hart and House, represents the value of continuation of medical, dental and vision benefits for six months. For Mr. Blazye represents continuation of all benefits for six months. |
| (4) | Mr. Hart resigned effective August 13, 2010. Because he was not terminated, Mr. Hart did not receive any severance payments in connection with his resignation. |
122
Table of Contents
Index to Financial Statements
Compensation of directors
Members of our board of directors, except for Messrs. Johnson, Macchia and Marschel do not receive compensation for serving as directors. Messrs. Johnson and Marschel received restricted stock grants in 2009 of 3,500 shares each. These shares will vest upon the closing of this offering. We do not pay cash compensation or grant option awards to our directors. Mr. Macchia was appointed to our board of directors in July 2010 and accordingly did not receive compensation during 2009. All members of our board of directors are reimbursed for actual expenses incurred in connection with attendance at board meetings. Mr. Clarke did not receive any compensation for service on our board of directors. Mr. Clarke’s compensation is described in “Compensation discussion and analysis.”
We believe restricted stock awards are an appropriate form of compensation for our directors because the value of the grants will increase as the value of our stock price increases, thus aligning the interests of these directors with those of our stockholders. The amount of these grants was determined based on our board of directors’ general experience with market levels of director compensation. Following this offering, we expect to continue to make annual grants of restricted stock to each of our non-employee directors (who are not otherwise affiliated with Advantage Capital Partners, Bain Capital Partners or Summit Partners) with a value of approximately $175,000. The following table sets forth the total compensation earned by each person who received compensation as a director in 2009.
| Name | Stock awards ($)(1) |
Total ($) |
||||||
| Mark A. Johnson |
$ | 157,500 | $ | 157,500 | ||||
| Glenn W. Marschel |
$ | 157,500 | $ | 157,500 | ||||
| (1) | The values for stock awards in this column represent the grant date fair value for the stock awards granted in 2009, computed in accordance with FASB ASC Topic 718. The amounts shown above assume that we achieve a qualifying liquidity event. |
The aggregate number of stock awards outstanding as of December 31, 2009 for each of our non-employee directors is as follows: Mr. Johnson, 7,000 shares of restricted stock; Mr. Marschel, 7,000 shares of restricted stock. None of our other non-employee directors hold outstanding equity awards, and Messrs. Johnson and Marschel do not hold any stock option awards.
123
Table of Contents
Index to Financial Statements
Principal and selling stockholders
The following table sets forth the beneficial ownership of shares of our common stock before and immediately following the closing of this offering by:
| • | each stockholder who is known by us to be a beneficial owner of 5% or more of our outstanding shares of common stock; |
| • | each selling stockholder; |
| • | each of our current directors; |
| • | each of our named executive officers; and |
| • | all of our directors and executive officers as a group. |
This table assumes (1) the conversion of all outstanding shares of our preferred stock into shares of our common stock immediately prior to the closing of this offering, (2) a two and one-half-for-one stock split of shares of our common stock effected on November 29, 2010 and (3) no further exercises of outstanding options (other than the options expected to be exercised by selling stockholders in connection with this offering) or the underwriters’ option to purchase additional shares. The column entitled “Percentage of shares outstanding—Before offering” is based on 77,662,811 shares of our common stock outstanding as of November 15, 2010. The column entitled “Percentage of shares outstanding—After offering” is based on 78,681,646 shares of common stock to be outstanding after this offering after giving effect to the 430,961 shares we are selling in this offering and assumes no further exercises of outstanding options (other than the options expected to be exercised by selling stockholders in connection with this offering) or the underwriters’ option to purchase additional shares.
Unless otherwise indicated in the footnotes to the table, we believe, based on the information furnished to us, that each person named in the table has sole voting and investment power with respect to all of the shares of our common stock shown as beneficially owned by such person. Beneficial ownership is determined in accordance with the rules of the Securities and Exchange Commission. In computing the number of shares beneficially owned by a person and the percentage of ownership held by that person, shares of common stock subject to options or which are otherwise subject to vesting and that are currently exercisable or will become exercisable within 60 days after November 15, 2010 are deemed outstanding, while these shares are not deemed outstanding for computing percentage ownership of any other person. Unless otherwise indicated below, the address of each named person is c/o FleetCor Technologies, Inc., 655 Engineering Drive, Suite 300, Norcross, Georgia 30092.
124
Table of Contents
Index to Financial Statements
| Number of shares beneficially owned |
Percentage of shares outstanding |
Number of the offering |
||||||||||||||||||
| Before offering |
After offering |
Before offering |
After offering |
|||||||||||||||||
| 5% Stockholders and other selling stockholders:† |
||||||||||||||||||||
| Summit Partners(1) |
29,033,398 | 23,894,486 | 37.4 | 30.4 | 5,138,912 | |||||||||||||||
| Bain Capital Fund VIII, LLC and related entities(2) |
14,278,845 | 11,751,491 | 18.4 | 14.9 | 2,527,354 | |||||||||||||||
| GCC Investments(3) |
9,978,417 | 9,478,417 | 12.9 | 12.1 | 500,000 | |||||||||||||||
| Funds managed by Advent International Corporation(4) |
5,156,318 | 4,243,651 | 6.6 | 5.4 | 912,667 | |||||||||||||||
| Advantage Capital Partners and related entities(5) |
2,397,906 | 1,973,478 | 3.1 | 2.5 | 424,428 | |||||||||||||||
| Peter Vallis |
1,631,302 | 1,553,802 | 2.1 | 2.0 | 77,500 | |||||||||||||||
| Performance Equity and related entities(6) |
1,333,333 | 1,097,334 | 1.7 | 1.4 | 235,999 | |||||||||||||||
| HarbourVest and related entities(7) |
833,332 | 708,332 | 1.1 | * | 125,000 | |||||||||||||||
| Nautic Partners and related entities(8) |
666,667 | 548,667 | * | * | 118,000 | |||||||||||||||
| Scott Ruoff(9) |
436,874 | 359,547 | * | * | 77,327 | |||||||||||||||
| Van Huff(10) |
434,375 | 357,491 | * | * | 76,884 | |||||||||||||||
| William Schmit(11) |
419,529 | 345,272 | * | * | 74,257 | |||||||||||||||
| Benton Routh(12) |
281,250 | 231,469 | * | * | 49,781 | |||||||||||||||
| Steven Smith(13) |
247,499 | 203,692 | * | * | 43,807 | |||||||||||||||
| Ken Greenway(14) |
245,000 | 201,635 | * | * | 43,365 | |||||||||||||||
| Bob Phillips |
234,167 | 199,999 | * | * | 34,168 | |||||||||||||||
| Patricia L. Phillips |
234,165 | 192,718 | * | * | 41,447 | |||||||||||||||
| Charles Freund(15) |
228,125 | 187,747 | * | * | 40,378 | |||||||||||||||
| John Hunter(16) |
187,500 | 154,312 | * | * | 33,188 | |||||||||||||||
| Steven Pisciotta(17) |
174,217 | 143,381 | * | * | 30,836 | |||||||||||||||
| Thomas Griffith |
173,124 | 142,481 | * | * | 30,643 | |||||||||||||||
| Robert Brandes(18) |
154,687 | 127,307 | * | * | 27,380 | |||||||||||||||
| RGIP, LLC(19) |
144,230 | 118,701 | * | * | 25,529 | |||||||||||||||
| Chris Welsh |
139,000 | 114,397 | * | * | 24,603 | |||||||||||||||
| Mark Lavin |
135,625 | 111,619 | * | * | 24,006 | |||||||||||||||
| James Prantl(20) |
127,092 | 104,597 | * | * | 22,495 | |||||||||||||||
| Addario Family Limited Partnership(21) |
125,000 | 102,875 | * | * | 22,125 | |||||||||||||||
| Jon Bennett(22) |
125,000 | 102,875 | * | * | 22,125 | |||||||||||||||
| Vaclav Rehor(23) |
125,000 | 102,875 | * | * | 22,125 | |||||||||||||||
| Erik Hymel(24) |
95,437 | 78,545 | * | * | 16,892 | |||||||||||||||
| Eric Lind(25) |
93,750 | 77,156 | * | * | 16,594 | |||||||||||||||
| Waddaah Keirbeck(26) |
85,625 | 70,469 | * | * | 15,156 | |||||||||||||||
| Melissa Roberts Mayaudon(27) |
84,875 | 69,852 | * | * | 15,023 | |||||||||||||||
| Ken Moore(28) |
79,687 | 65,582 | * | * | 14,105 | |||||||||||||||
| Steven Harned |
78,125 | 64,297 | * | * | 13,828 | |||||||||||||||
| Fred MacDowell(29) |
74,062 | 60,953 | * | * | 13,109 | |||||||||||||||
| Crystal Williams(30) |
71,250 | 58,639 | * | * | 12,611 | |||||||||||||||
| John Ryan(31) |
63,750 | 52,466 | * | * | 11,284 | |||||||||||||||
| Janis Beltramo(32) |
62,500 | 51,437 | * | * | 11,063 | |||||||||||||||
| Paul Citarella(33) |
62,500 | 51,437 | * | * | 11,063 | |||||||||||||||
| Sean Bowen(34) |
62,500 | 51,437 | * | * | 11,063 | |||||||||||||||
| Alisher Ashurov(35) |
124,062 | 113,166 | * | * | 10,896 | |||||||||||||||
| Jason Hemphill(36) |
60,937 | 50,151 | * | * | 10,786 | |||||||||||||||
| Martin Clow(37) |
60,937 | 50,151 | * | * | 10,786 | |||||||||||||||
| Dwight Paramoure(38) |
53,125 | 43,722 | * | * | 9,403 | |||||||||||||||
| Karen Callaghan(39) |
53,125 | 43,722 | * | * | 9,403 | |||||||||||||||
| Mike Noles |
51,250 | 42,179 | * | * | 9,071 | |||||||||||||||
| Annwood Reedy(40) |
43,875 | 36,109 | * | * | 7,766 | |||||||||||||||
| Mark Roberts(41) |
40,625 | 33,434 | * | * | 7,191 | |||||||||||||||
| Daniel Moos |
38,462 | 31,654 | * | * | 6,808 | |||||||||||||||
| Peter Bridgen(42) |
37,500 | 30,862 | * | * | 6,638 | |||||||||||||||
| Peter McCarthy(43) |
37,500 | 30,862 | * | * | 6,638 | |||||||||||||||
| Ronald Leidenfrost(44) |
34,687 | 28,547 | * | * | 6,140 | |||||||||||||||
| Don Trosclair(45) |
34,375 | 28,291 | * | * | 6,084 | |||||||||||||||
| Dave McFarland(46) |
31,875 | 26,233 | * | * | 5,642 | |||||||||||||||
| Morris Kagan(47) |
31,875 | 26,233 | * | * | 5,642 | |||||||||||||||
| Timothy Marlow(48) |
31,875 | 26,233 | * | * | 5,642 | |||||||||||||||
| Additional selling stockholders collectively holding less than 1% of the outstanding shares of FleetCor’s common stock prior to completion of the offering (62 people)(49) |
760,005 | 625,484 | * | * | 134,521 | |||||||||||||||
| Named executive officers and directors: |
||||||||||||||||||||
| Andrew R. Blazye(50) |
237,500 | 206,525 | * | * | 30,975 | |||||||||||||||
| Ronald F. Clarke(51) |
4,858,331 | 3,998,406 | 6.1 | 5.0 | 859,925 | |||||||||||||||
| Eric R. Dey |
198,047 | 162,993 | * | * | 35,054 | |||||||||||||||
| Alex P. Hart |
— | — | — | — | — | |||||||||||||||
| Todd W. House(52) |
106,250 | 98,506 | * | * | 7,744 | |||||||||||||||
| Andrew Balson(53) |
14,278,845 | 11,751,491 | 18.4 | 14.9 | 2,527,354 | |||||||||||||||
| John R. Carroll(54) |
29,033,398 | 23,894,486 | 37.4 | 30.4 | 5,138,912 | |||||||||||||||
| Bruce R. Evans(55) |
29,033,398 | 23,894,486 | 37.4 | 30.4 | 5,138,912 | |||||||||||||||
| Mark A. Johnson |
201,250 | 176,250 | * | * | 25,000 | |||||||||||||||
| Richard Macchia |
3,750 | 3,086 | * | * | 664 | |||||||||||||||
| Glenn W. Marschel |
251,250 | 213,750 | * | * | 37,500 | |||||||||||||||
| Steven T. Stull(56) |
2,397,906 | 1,973,478 | 3.1 | 2.5 | 424,428 | |||||||||||||||
| All executive officers and directors as a group (18 persons)(57): |
52,712,618 | 43,446,541 | 65.7 | 52.9 | 9,266,077 | |||||||||||||||
| † | Other than with respect to Peter Vallis and Patricia L. Phillips, the individuals listed in this table represent named executive officers, directors or current or former employees of FleetCor. |
| * | Less than 1% |
125
Table of Contents
Index to Financial Statements
| (1) | Represents 343,110 shares held by Summit VI Advisors Fund, L.P., 526,790 shares held by Summit VI Entrepreneurs Fund, L.P., 16,497,909 shares held by Summit Ventures VI-A, L.P., 6,880,287 shares held by Summit Ventures VI-B, L.P., 138,140 shares held by Summit Investors VI, L.P., 427,155 shares held by Summit Subordinated Debt Fund II, L.P., 2,626,060 shares held by Summit Partners Private Equity Fund VII-A, L.P., 1,577,252 shares held by Summit Partners Private Equity Fund VII-B, L.P., 15,110 shares held by Summit Investors I, LLC and 1,585 shares held by Summit Investors I (UK), L.P. In this offering, each of the Summit Partners entities will sell the following number of shares of common stock: Summit VI Advisors Fund, L.P., 60,730; Summit VI Entrepreneurs Fund, L.P., 93,242; Summit Ventures VI-A, L.P., 2,920,130; Summit Ventures VI-B, L.P., 1,217,811; Summit Investors VI, L.P., 24,451; Summit Subordinated Debt Fund II, L.P., 75,606; Summit Partners Private Equity Fund VII-A, L.P., 464,813; Summit Partners Private Equity Fund VII-B, L.P., 279,174; Summit Investors I, LLC, 2,674; Summit Investors I (UK), L.P. 281. Summit Partners, L.P. is (i) the managing member of Summit Partners VI (GP), LLC, which is the general partner of Summit Partners VI (GP), L.P., which is the general partner of each of Summit Ventures VI-A, L.P., Summit Ventures VI-B, L.P., Summit VI Advisors Fund, L.P., Summit VI Entrepreneurs Fund, L.P. and Summit Investors VI, L.P., (ii) the managing member of Stamps, Woodsum & Co. IV, which is the managing member of Summit Partners SD II, LLC, which is the general partner of Summit Subordinated Debt Fund II, L.P., (iii) managing member of Summit Partners PE VII, LLC, which is the general partner of Summit Partners PE VII, L.P., which is the general partner of Summit Partners Private Equity Fund VII-A, L.P. and Summit Partners Private Equity Fund VII-B, L.P., and (iv) the manager of Summit Investors Management, LLC, which is manager of Summit Investors I, LLC and the general partner of Summit Investors I (UK), L.P. Summit Partners, L.P., through a two-person investment committee, currently composed of Martin J. Mannion and Bruce R. Evans, has voting and dispositive authority over the shares held by each of these entities and therefore beneficially owns such shares. The address for each of these entities is 222 Berkeley Street, 18th Floor, Boston, MA 02116. Entities affiliated with Summit Partners hold private equity investments in one or more broker dealers, and as a result Summit Partners is an affiliate of a broker dealer. However, affiliates of Summit Partners acquired the securities to be sold in this offering in the ordinary course of business for investment for their own account and not as a nominee or agent and, at the time of that purchase, had no contract, undertaking, agreement, understanding or arrangement, directly or indirectly, with any person to sell, transfer, distribute or grant participations to such person or to any third person with respect to those securities. |
| (2) | Includes (a) 13,708,997 shares held by Bain Capital Fund VIII, LLC, whose sole member is Bain Capital Fund VIII, L.P., whose general partner is Bain Capital Partners VIII, L.P., whose general partner is Bain Capital Investors, LLC (“BCI”), (b) 315,062 shares held by BCIP Associates III, LLC, whose sole member is BCIP Associates III, whose managing general partner is BCI, (c) 147,692 shares held by BCIP T Associates III, LLC, whose sole member is BCIP Trust Associates III, whose managing general partner is BCI, (d) 24,877 shares held by BCIP Associates III-B, LLC, whose sole member is BCIP Associates III-B, whose managing general partner is BCI, (e) 78,572 shares held by BCIP T Associates III-B, LLC, whose sole member is BCIP Trust Associates III-B, whose managing general partner is BCI and (f) 3,645 shares held by BCIP Associates-G, whose managing general partner is BCI. As a result of the relationships described above, BCI may be deemed to own the shares held by entities in the foregoing sentence (the “Bain Capital Entities”). BCI disclaims beneficial ownership of such shares except to the extent of its pecuniary interest therein. Voting and investment determinations with respect to the shares held by the Bain Capital Entities are made by an investment committee comprised of the following managing directors of BCI: Andrew Balson, Steven Barnes, Joshua Bekenstein, John Connaughton, Todd Cook, Paul Edgerley, Christopher Gordon, Blair Hendrix, Jordan Hitch, Matthew Levin, Ian Loring, Philip Loughlin, Mark Nunnelly, Stephen Pagliuca, Mark Verdi, Michael Ward and Stephen Zide. As a result, and by virtue of the relationships described in this footnote, the investment committee of BCI may be deemed to exercise voting and dispositive power with respect to the shares held by the Bain Capital Entities. The investment committee of BCI disclaims ownership of such shares except to the extent of its pecuniary interest therein. In this offering each of the Bain Capital Entites will sell the following number of shares of common stock: (a) Bain Capital Fund VIII, LLC, 2,426,492; (b) BCIP Associates III, LLC, 55,766; (c) BCIP T Associates III, LLC, 26,141; (d) BCIP Associates III-B, LLC, 4,403; (e) BCIP T Associates III-B, LLC, 13,907; and (f) BCIP Associates-G, 645. Certain partners and other employees of the Bain Capital Entities may make a contribution of shares of stock to one or more charities prior to this offering. In such case, a recipient charity, if it chooses to participate in the offering, will be the selling stockholder with respect to the donated shares. |
| (3) | Represents 9,353,417 shares held by Chestnut Hill Fuel, LLC and 625,000 shares held by Richard A. Smith and Nancy Lurie Marks, as the trustees of the trust under the will of Philip Smith FBO Richard A. Smith. Chestnut Hill Ventures, LLC owns a controlling interest in GCC Investments, LLC, which wholly owns Chestnut Hill Fuel, LLC. Chestnut Hill Ventures, LLC, through a two-person board of managers, currently composed of Richard A. Smith and John G. Berylson, has voting and dispositive authority over the shares held by Chestnut Hill Fuel, LLC and therefore beneficially owns such shares. In this offering, each of the GCC Investments entities will sell the following number of shares of common stock: Chestnut Hill Fuel, LLC, 500,000 and Richard A. Smith and Nancy Lurie Marks, as the trustees of the trust under the will of Philip Smith FBO Richard A. Smith, zero. |
| (4) | Represents 2,091,747 shares held by Advent Central & Eastern Europe III Limited Partnership, 1,603,780 shares held by Advent Central & Eastern Europe III—A Limited Partnership, 228,107 shares held by Advent Central & Eastern Europe III—B Limited Partnership, 310,172 shares held by Advent Central & Eastern Europe III—C Limited Partnership, 470,692 shares held by Advent Central & Eastern Europe III—D Limited Partnership, 394,817 shares held by Advent Central & Eastern Europe III—E Limited Partnership, 50,629 shares held by Advent Partners ACEE III Limited Partnership and 6,374 shares held by Advent Partners III Limited Partnership. In this offering, each of the funds managed by Advent International Corporation will sell the following number of shares of common stock: Advent Central & Eastern Europe III Limited Partnership, 370,239; Advent Central & Eastern Europe III—A Limited Partnership, 283,869; Advent Central & Eastern Europe III—B Limited Partnership, 40,375; Advent Central & Eastern Europe III—C Limited Partnership, 54,900; Advent Central & Eastern Europe III—D Limited Partnership, 83,312; Advent Central & Eastern Europe III—E Limited Partnership, 69,883; Advent Partners ACEE III Limited Partnership, 8,961; and Advent Partners III Limited Partnership, 1,128. Advent International Corporation is the manager of Advent International LLC, which is the general partner of Advent Partners III Limited Partnership and ACEE III GP Limited Partnership. ACEE III GP Limited Partnership, in turn, serves as the general partner of: (1) Advent Central and Eastern Europe III; (2) Advent Central and Eastern Europe III—A Limited Partnership; (3) Advent Central and Eastern Europe III—B Limited Partnership; (4) Advent Central and Eastern Europe III—C Limited Partnership; (5) Advent Central and Eastern Europe III—D Limited Partnership and (6) Advent Central and Eastern Europe III—E Limited Partnership. Advent International Corporation is the general partner of Advent Partners ACEE III Limited Partnership. Limited partners of this fund and of Advent Partners III Limited Partnership are individuals affiliated with Advent. Advent International Corporation exercises voting and investment power over the shares held by each of these entities and may be deemed to have beneficial ownership of these shares. With respect to the shares of our common stock held by the Advent Funds, a group of individuals currently composed of Ernest G. Bachrach, David M. Mussafer and Steven M. Tadler exercises voting and investment power over the shares beneficially owned by Advent International Corporation. Each of Mr. Bachrach, Mr. Mussafer and Mr. Tadler disclaims beneficial ownership of the shares held by the Advent funds, except to the extent of their respective |
126
Table of Contents
Index to Financial Statements
| pecuniary interest therein. The address of Advent International Corporation and each of the funds listed above is c/o Advent International Corporation, 75 State Street, Boston, MA 02109. Entities affiliated with Advent International Corporation hold private equity investments in one or more broker dealers, and as a result Advent International Corporation is an affiliate of a broker dealer. However, affiliates of Advent International Corporation acquired the securities to be sold in this offering in the ordinary course of business for investment for their own account and not as a nominee or agent and, at the time of that purchase, had no contract, undertaking, agreement, understanding or arrangement, directly or indirectly, with any person to sell, transfer, distribute or grant participations to such person or to any third person with respect to those securities. |
| (5) | Represents 66,250 shares held by Advantage Capital Financial Company, LLC, 104,170 shares held by Advantage Capital Management Fund, LLC, which is wholly owned by Advantage Capital Partners VI, Limited Partnership and Advantage Capital Partners X, Limited Partnership, 361,685 shares held by Advantage Capital Partners V Limited Partnership, of which Advantage Capital Advisors, LLC is its general partner, 1,253,572 shares held by Advantage Capital Partners VI Limited Partnership, of which, Advantage Capital NOLA VI, LLC is its general partner, 281,102 shares held by Advantage Capital Partners VIII Limited Partnership, of which, Advantage Capital NOLA VIII, LLC is its general partner, and 331,127 shares held by Advantage Capital Partners X Limited Partnership, of which, Advantage Capital NOLA X, LLC is its general partner. In this offering, Advantage Capital Financial Company, LLC will sell 11,726 shares, Advantage Capital Management Fund, LLC will sell 18,438 shares, Advantage Capital Partners V Limited Partnership will sell 64,018 shares, Advantage Capital Partners VI Limited Partnership will sell 221,882 shares, Advantage Capital Partners VIII Limited Partnership will sell 49,755 shares, and Advantage Capital Partners X Limited Partnership will sell 58,609 shares. Mr. Steven T. Stull owns a majority of the voting equity interests in each of the general partners of the limited partnerships listed above, has voting and dispositive authority over the shares held indirectly by these entities and therefore beneficially owns such shares. Mr. Stull and Mr. Damon L. Rawie are the managers and majority holders of Advantage Capital Financial Company, LLC and have shared voting and dispositive authority over the shares held indirectly by this entity and therefore beneficially own such shares. Each of Mr. Stull and Mr. Rawie disclaims beneficial ownership of the shares held by such entities, except to the extent of their respective pecuniary interest therein. |
| (6) | Represents shares held by the following entities as indicated: 692,935 shares by Performance Direct Investments II, LP.; 442,277 shares by JP Morgan Chase Bank, N.A., as trustee for First Plaza Group Trust, solely for the benefit of pool PMI-127; 98,267 shares by JP Morgan Chase Bank, N.A., as trustee for First Plaza Group Trust, solely for the benefit of pool PMI-128; 78,047 shares by JP Morgan Chase Bank, N.A., as trustee for First Plaza Group Trust, solely for the benefit of pool PMI-129; and 21,807 shares by JP Morgan Chase Bank, N.A., as trustee for First Plaza Group Trust, solely for the benefit of pool PMI-130. In this offering, Performance Direct Investments II, LP will sell 122,649 shares; JP Morgan Chase Bank, N.A., as trustee for First Plaza Group Trust, solely for the benefit of pool PMI-127 will sell 78,283 shares; JP Morgan Chase Bank, N.A., as trustee for First Plaza Group Trust, solely for the benefit of pool PMI-128 will sell 17,393 shares; JP Morgan Chase Bank, N.A., as trustee for First Plaza Group Trust, solely for the benefit of pool PMI-129 will sell 13,814 shares; and JP Morgan Chase Bank, N.A., as trustee for First Plaza Group Trust, solely for the benefit of pool PMI-130 will sell 3,860 shares. First Plaza Group Trust (“First Plaza”) and Performance Direct Investments II, L.P. (“PDI”) may be deemed affiliates of Performance Equity Associates (“PEA”). PEA owns 51% of Performance Equity Management, LLC (“PEM”). First Plaza Group Trust (“First Plaza”) is a New York trust containing assets of certain employee benefit plans of General Motors Company (“GM”), its subsidiaries and unrelated employers. General Motors Investment Management Corporation (“GMIMCo”), an indirect wholly-owned subsidiary of GM and 49% owner of PEM, is investment manager to First Plaza. Pursuant to a Subadvisory Agreement, GMIMCo has delegated management of certain assets of First Plaza to PEM, including the assets of First Plaza invested in Fleetcor Technologies, Inc. The shares held by PDI may be deemed to be owned beneficially by PEM. A series of PEM serves as the general partner of PDI. Each of PEM and GMIMCo is registered as an investment adviser under the Investment Advisers Act of 1940. PEM’s principal business is, through its series, serving as general partner of certain private funds. PEM and PEA, as the controlling entity of PEM, have the power to direct the voting and disposition with respect to shares of PDI. Messrs. Charles Froland, Jeffrey Barman, John S. Clark, Marcia Haydel, Jeffrey A. Reals and S. Lawrence Rusoff constitute the investment committee of PEM and have voting and dispositive authority over the shares controlled through these entities and therefore beneficially own such shares. GMIMCo, in its capacity as a fiduciary to the pension plans in First Plaza, has the power to direct the trustee as to the voting and disposition of First Plaza’s shares. Because of the First Plaza trustee’s limited role, beneficial ownership of the shares by the trustee is disclaimed. The principal address of PEM and PEA is 2 Pickwick Plaza, Suite 310, Greenwich, Connecticut 06830. The principal address of First Plaza and GMIMCo is 767 Fifth Avenue, New York, New York 10153. |
| (7) | Represents 416,667 shares held by HarbourVest Partners VIII-Buyout Fund LP and 416,665 shares held by HarbourVest Partners 2007 Direct Fund LP. In this offering, HarbourVest Partners VIII-Buyout Fund LP will sell 62,500 shares and HarbourVest Partners 2007 Direct Fund LP will sell 62,500 shares. HarbourVest Partners, LLC (“HarbourVest”) is the Managing Member of HarbourVest VIII-Buyout Associates LLC, which is the General Partner of HarbourVest VIII-Buyout Associates L.P., which is the General Partner of HarbourVest Partners VIII-Buyout Fund L.P. HarbourVest is also the Managing Member of HarbourVest 2007 Direct Associates LLC, which is the General Partner of HarbourVest 2007 Direct Associates L.P., which is the General Partner of HarbourVest Partners 2007 Direct Fund L.P. Voting and investment control over the securities owned by the aforementioned shareholders is held by Mr. John M. Toomey, Jr., Mr. William A. Johnston, Mr. Gregory V. Stento and Mr. D. Brooks Zug in their capacities as members of the Investment Committee of HarbourVest. |
| (8) | Represents 666,000 shares held by Nautic Partners V, L.P. and 667 shares held by Kennedy Plaza Partners III, LLC. In this offering, Nautic Partners V, L.P. will sell 117,882 shares and Kennedy Plaza Partners III, LLC will sell 118 shares. Nautic Management V, L.P. is the general partner and manager, respectively, of Nautic Partners V, LP and Kennedy Plaza Partners III, LLC. All decisions regarding the voting or disposition of investments held by Nautic Partners V, L.P. and Kennedy Plaza Partners III, LLC are made by majority vote of the Investment Committee of Nautic Management V, L.P. The Investment Committee of Nautic Management V, L.P. is comprised of Habib Y. Gorgi, Robert Van Degna, and Bernard V. Buonanno, III. Messr Gorgi, Van Degna, and Buonanno disclaim any beneficial ownership to shares held by Nautic Partners V, L.P. or Kennedy Plaza Partners III, LLC. |
| (9) | Includes options to purchase 250,000 shares vested or vesting within 60 days of November 15, 2010, some of which may be exercised in connection with this offering. |
| (10) | Represents options to purchase 434,375 shares vested or vesting within 60 days of November 15, 2010, some of which may be exercised in connection with this offering. |
| (11) | Includes options to purchase 250,000 shares vested or vesting within 60 days of November 15, 2010, some of which may be exercised in connection with this offering. |
127
Table of Contents
Index to Financial Statements
| (12) | Includes options to purchase 31,250 shares vested or vesting within 60 days of November 15, 2010, some of which may be exercised in connection with this offering. |
| (13) | Includes options to purchase 93,750 shares vested or vesting within 60 days of November 15, 2010, some of which may be exercised in connection with this offering. |
| (14) | Includes options to purchase 125,000 shares vested or vesting within 60 days of November 15, 2010, some of which may be exercised in connection with this offering. |
| (15) | Includes options to purchase 128,125 shares vested or vesting within 60 days of November 15, 2010, some of which may be exercised in connection with this offering. |
| (16) | Includes options to purchase 186,000 shares vested or vesting within 60 days of November 15, 2010, some of which may be exercised in connection with this offering. |
| (17) | Includes options to purchase 174,217 shares vested or vesting within 60 days of November 15, 2010, some of which may be exercised in connection with this offering. |
| (18) | Includes options to purchase 75,000 shares vested or vesting within 60 days of November 15, 2010, some of which may be exercised in connection with this offering. |
| (19) | Brad Malt, Ann Milner and Alfred Rose have shared voting and investment power for RGIP, LLC. The address of RGIP, LLC is Prudential Tower, 800 Boylston Street, Boston, MA 02199-3600. |
| (20) | Includes options to purchase 127,092 shares vested or vesting within 60 days of November 15, 2010, some of which may be exercised in connection with this offering. |
| (21) | Represents 125,000 shares held by The Addario Family Limited Partnership, of which 22,125 shares will be sold in this offering. EMCO, LLC is the general partner and Bonnie Addario is the member of EMCO, LLC and has voting and dispositive authority over the shares held by the limited partnership and therefore beneficially owns such shares. |
| (22) | Represents options to purchase 125,000 shares vested or vesting within 60 days of November 15, 2010, some of which may be exercised in connection with this offering. |
| (23) | Represents options to purchase 125,000 shares vested or vesting within 60 days of November 15, 2010, some of which may be exercised in connection with this offering. |
| (24) | Represents options to purchase 95,437 shares vested or vesting within 60 days of November 15, 2010, some of which may be exercised in connection with this offering. |
| (25) | Represents options to purchase 93,750 shares vested or vesting within 60 days of November 15, 2010, some of which may be exercised in connection with this offering. |
| (26) | Represents options to purchase 85,625 shares vested or vesting within 60 days of November 15, 2010, some of which may be exercised in connection with this offering. |
| (27) | Represents options to purchase 84,875 shares vested or vesting within 60 days of November 15, 2010, some of which may be exercised in connection with this offering. |
| (28) | Represents options to purchase 79,687 shares vested or vesting within 60 days of November 15, 2010, some of which may be exercised in connection with this offering. |
| (29) | Represents options to purchase 74,062 shares vested or vesting within 60 days of November 15, 2010, some of which may be exercised in connection with this offering. |
| (30) | Represents options to purchase 71,250 shares vested or vesting within 60 days of November 15, 2010, some of which may be exercised in connection with this offering. |
| (31) | Represents options to purchase 63,750 shares vested or vesting within 60 days of November 15, 2010, some of which may be exercised in connection with this offering. |
| (32) | Represents options to purchase 62,500 shares vested or vesting within 60 days of November 15, 2010, some of which may be exercised in connection with this offering. |
| (33) | Represents options to purchase 62,500 shares vested or vesting within 60 days of November 15, 2010, some of which may be exercised in connection with this offering. |
| (34) | Represents options to purchase 62,500 shares vested or vesting within 60 days of November 15, 2010, some of which may be exercised in connection with this offering. |
| (35) | Includes options to purchase 61,562 shares vested or vesting within 60 days of November 15, 2010, some of which may be exercised in connection with this offering. |
| (36) | Represents options to purchase 60,937 shares vested or vesting within 60 days of November 15, 2010, some of which may be exercised in connection with this offering. |
| (37) | Represents options to purchase 60,937 shares vested or vesting within 60 days of November 15, 2010, some of which may be exercised in connection with this offering. |
| (38) | Represents options to purchase 53,125 shares vested or vesting within 60 days of November 15, 2010, some of which may be exercised in connection with this offering. |
| (39) | Represents options to purchase 53,125 shares vested or vesting within 60 days of November 15, 2010, some of which may be exercised in connection with this offering. |
128
Table of Contents
Index to Financial Statements
| (40) | Represents options to purchase 43,875 shares vested or vesting within 60 days of November 15, 2010, some of which may be exercised in connection with this offering. |
| (41) | Represents options to purchase 40,625 shares vested or vesting within 60 days of November 15, 2010, some of which may be exercised in connection with this offering. |
| (42) | Represents options to purchase 37,500 shares vested or vesting within 60 days of November 15, 2010, some of which may be exercised in connection with this offering. |
| (43) | Represents options to purchase 37,500 shares vested or vesting within 60 days of November 15, 2010, some of which may be exercised in connection with this offering. |
| (44) | Represents options to purchase 34,687 shares vested or vesting within 60 days of November 15, 2010, some of which may be exercised in connection with this offering. |
| (45) | Includes options to purchase 18,750 shares vested or vesting within 60 days of November 15, 2010, some of which may be exercised in connection with this offering. |
| (46) | Represents options to purchase 31,875 shares vested or vesting within 60 days of November 15, 2010, some of which may be exercised in connection with this offering. |
| (47) | Includes options to purchase 25,000 shares vested or vesting within 60 days of November 15, 2010, some of which may be exercised in connection with this offering. |
| (48) | Represents options to purchase 31,875 shares vested or vesting within 60 days of November 15, 2010, some of which may be exercised in connection with this offering. |
| (49) | Includes options to purchase 418,313 shares vested or vesting within 60 days of November 15, 2010, some of which may be exercised in connection with this offering. |
| (50) | Includes options to purchase 162,500 shares vested or vesting within 60 days of November 15, 2010, some of which may be exercised in connection with this offering. |
| (51) | Includes options to purchase 1,670,832 shares vested or vesting within 60 days of November 15, 2010, some of which may be exercised in connection with this offering. |
| (52) | Includes options to purchase 31,250 shares vested or vesting within 60 days of November 15, 2010, some of which may be exercised in connection with this offering. |
| (53) | Includes shares held by the Bain Capital Entities. Mr. Balson is a Managing Director and serves on the investment committee of BCI and as a result, and by virtue of the relationships described in Footnote (2), may be deemed to beneficially own the shares owned by the Bain Capital Entities. Mr. Balson disclaims ownership of the shares held by the Bain Capital Entities except to the extent of his pecuniary interest therein. |
| (54) | Includes shares held by the Summit Partners entities. Mr. Carroll is a member of the general partner of Summit Partners, L.P. and as a result may be deemed to beneficially own the shares owned by the Summit Partners entities. Mr. Carroll disclaims ownership of the shares held by the Summit Partners entities except to the extent of his pecuniary interest therein. |
| (55) | Includes shares held by the Summit Partners entities. Mr. Evans is a member of the general partner of and is on the investment committee for Summit Partners, L.P. and as a result may be deemed to beneficially own the shares owned by the Summit Partners entities. Mr. Evans disclaims ownership of the shares held by the Summit Partners entities except to the extent of his pecuniary interest therein. |
| (56) | Includes shares held by the Advantage Capital entities. Mr. Stull has shared voting power with respect to such shares and as a result may be deemed to beneficially own such shares. Mr. Stull disclaims ownership of the shares held by the Advantage Capital entities except to the extent of his pecuniary interest therein. |
| (57) | Includes options to purchase 2,623,957 shares vested or vesting within 60 days of November 15, 2010, some of which may be exercised in connection with this offering. |
129
Table of Contents
Index to Financial Statements
Certain relationships and related party transactions
We describe below the transactions that have occurred since January 1, 2007, and any currently proposed transactions, that involve our company and exceed $120,000, and in which a related party had or has a direct or indirect material interest. All descriptions of the agreements below are qualified in their entirety by reference to the actual agreements. The share amounts disclosed herein do not give effect to (1) the automatic conversion of all outstanding shares of our preferred stock into 43,575,148 shares of our common stock upon the closing of this offering or (2) a two and one-half-for-one stock split of shares of our common stock effected on November 29, 2010.
Series E preferred stock issuance and acquisition of CLC Group, Inc. and subsidiaries
On April 1, 2009, in connection with our acquisition of CLC Group, Inc., and subsidiaries we issued 3.4 million shares of Series E convertible preferred stock at a price of $30 per share, for an aggregate purchase price of $102.0 million. All purchase prices were paid in cash, except as described below. The following table presents the number of shares of preferred stock purchased by each of the parties named below (including shares purchased by their respective affiliates). Each of the parties listed below was, at the time of the transaction, or as a result of the transaction, a holder of 5% or more of a class of our capital stock.
| Entity | Shares of series E convertible preferred stock |
Purchase price |
||||||
| Summit Partners(1) |
1,713,333 | $ | 51,399,990 | |||||
| Performance Equity Management(2) |
533,334 | 16,000,020 | ||||||
| HarbourVest Partners(3) |
333,333 | 9,999,990 | ||||||
| Nautic Partners(4) |
266,667 | 8,000,010 | ||||||
| Funds managed by Advent International Corporation(5) |
243,333 | 7,299,990 | ||||||
| Advantage Capital Partners(6) |
133,333 | 3,999,990 | ||||||
| Wm. B. Reily & Company, Inc. |
100,000 | 3,000,000 | ||||||
| Peter Vallis |
76,667 | 2,300,010 | ||||||
| 3,400,000 | $ | 102,000,000 | ||||||
| (1) | Includes 1,050,424 shares purchased by Summit Partners Private Equity Fund VII-A, L.P., 630,901 shares purchased by Summit Partners Private Equity Fund VII-B, L.P., 25,208 shares purchased by Summit Subordinated Debt Fund II, L.P., 6,044 shares purchased by Summit Investors I, LLC, 634 shares purchased by Summit Investors I (UK), L.P. and 122 shares purchased by Summit Investors VI, L.P. |
| (2) | Includes 277,174 shares purchased by Performance Direct Investments II, L.P., 176,911 shares purchased by JP Morgan Chase Bank, N.A. as trustee for First Plaza Group Trust, solely for the benefit of pool PMI-127, 39,307 shares purchased by JP Morgan Chase Bank, N.A. as trustee for First Plaza Group Trust, solely for the benefit of pool PMI-128, 31,219 shares purchased by JP Morgan Chase Bank, N.A. as trustee for First Plaza Group Trust, solely for the benefit of pool PMI-129 and 8,723 shares purchased by JP Morgan Chase Bank, N.A. as trustee for First Plaza Group Trust, solely for the benefit of pool PMI-130. |
| (3) | Includes 166,667 shares purchased by HarbourVest Partners VIII-Buyout Fund L.P. and 166,666 shares purchased by HarbourVest Partners 2007 Direct Fund L.P. |
| (4) | Includes 266,400 shares purchased by Nautic Partners V, L.P. and 267 shares purchased by Kennedy Plaza Partners III, LLC. The consideration for the purchase price was all of the common stock of CLC Group, Inc. held by Nautic Partners. |
| (5) | Includes 265 shares purchased by Advent Partners III Limited Partnership, 98,744 shares purchased by Advent Central & Eastern Europe III Limited Partnership, 75,754 shares purchased by Advent Central & Eastern Europe III—A Limited Partnership, 10,762 shares purchased by Advent Central & Eastern Europe III—B Limited Partnership, 14,619 shares purchased by Advent Central & Eastern Europe III—C Limited Partnership, 22,192 shares purchased by Advent Central & Eastern Europe III—D Limited Partnership, 18,606 shares purchased by Advent Central & Eastern Europe III— E Limited Partnership and 2,391 shares purchased by Advent Partners ACEE III Limited Partnership. |
| (6) | Includes 28,498 shares purchased by Advantage Capital Partners VI, L.P., 36,667 shares purchased by Advantage Capital Partners X, L.P., 41,668 shares purchased by Advantage Capital Management Fund, LLC and 26,500 shares purchased by Advantage Capital Financial Company, LLC. |
130
Table of Contents
Index to Financial Statements
In addition, in connection with our purchase of all of the common stock of CLC Group, Inc., and subsidiaries we purchased 853 shares from Timothy J. Downs our President—Corporate Lodging Consultants and cancelled 682 options held by Mr. Downs, for aggregate consideration of $1,748,574. We paid Mr. Downs $972,932 in cash and withheld $650,138 for taxes, $120,047 for his portion of an indemnification pool and $5,457 for his portion of payments due to a seller representative. Mr. Downs received the same per-share consideration as other CLC Group, Inc. stock and option holders. As a result of the transaction, Mr. Downs became an executive officer of our Company.
Warrant exercises
On October 13, 2008, we issued an aggregate of 146,578 shares of our common stock to Summit Investors VI, L.P. and Summit Subordinated Debt Fund II, L.P., entities affiliated with Summit Partners, upon the exercise of outstanding warrants, and received approximately $1,466 in cash proceeds.
Stock repurchases
On May 15, 2007, we repurchased an aggregate of 386,344 shares of common stock from Robert P. Brandes, Ronald F. Clarke, Eric R. Dey, Scott C. Ruoff and William J. Schmit, executive officers, 250,686 shares of Series D-1 convertible preferred stock from Advantage Capital Partners, a 5% security holder, and an aggregate of 36,250 shares of common stock issuable upon the exercise of options from Van E. Huff, an executive officer, and Mark A. Johnson, a director, for $30 per share (in the case of options, less any applicable per share exercise price).
Preferred stock conversion and dividends
Our certificate of incorporation provides that immediately upon the closing of this offering, each share of our Series E convertible preferred stock and each share of each class of our Series D convertible preferred stock will convert automatically into one share of our common stock. Our Series E and Series D convertible preferred stock is held by the following 5% holders of a class of our capital stock: Advantage Capital Partners, funds managed by Advent International Corporation, funds sponsored by Bain Capital Partners, GCC Investments, HarbourVest Partners, Nautic Partners, Performance Equity Management, entities affiliated with Summit Partners, Wm B. Reily & Company, Inc. and Peter Vallis (in each case including certain affiliated entities, and collectively, the “5% Security Holders”) and Ronald F. Clarke, Scott C. Ruoff and William J. Schmit, executive officers. No accrued and unpaid dividends will be paid in connection with this conversion, except that we will pay 37.5% of all unpaid accrued dividends on our Series D-3 convertible preferred stock. For more information, see “Dividend Policy.”
Loan to chief executive officer
On May 3, 2002, we accepted a promissory note from Ronald F. Clarke, our Chief Executive Officer, in the amount of $132,235 for a portion of the purchase price of 265,000 shares of our Series B preferred stock (which was subsequently reclassified as Series D-2 preferred stock). The promissory note provided for an annual compound interest rate of 4.99%. Mr. Clarke repaid the note in full on December 23, 2009. Mr. Clarke paid $132,235 in principal and $50,492 in interest over the term of the note. The largest aggregate amount of principal outstanding during the term of the note was $132,235.
Stockholders agreement
On April 1, 2009, we entered into a sixth amended and restated stockholders agreement that binds the holders of our common stock and our Series D and Series E preferred stock. These holders include the 5% Security Holders;
131
Table of Contents
Index to Financial Statements
the following executive officers: Ronald F. Clarke, Scott C. Ruoff, Eric R. Dey, Todd W. House, Van E. Huff, Alex P. Hart, William J. Schmit, Robert P. Brandes, Timothy J. Downs and Andrew R. Blazye; and Mark A. Johnson and Glenn W. Marschel, directors. Pursuant to the sixth amended and restated stockholders agreement, the parties are subject to contractual restrictions relating to their proposed transfer of our capital stock. Under this agreement, proposed transfers of our capital stock by parties to the agreement to a third party that is not a permitted transferee are subject to our right of first refusal and, to the extent we do not exercise our right, non-selling holders have a right, on a pro-rata basis, to purchase the shares proposed to be transferred. If neither we nor the non-selling holders exercise the right to purchase all of the shares of capital stock proposed to be transferred, then certain of our major investors have a pro rata right of participation in the sale. In addition, if certain of our major investors propose to transfer shares of our capital stock to a third party, then non-selling major investors have a pro rata right of participation in the sale. Further, certain of our major investors also have a preemptive right to purchase a pro rata share of any equity securities that we issue. Under this agreement, we are also granted certain “drag-along” rights to require security holders to participate in a proposed sale or merger of the company. The sixth amended and restated stockholders agreement will terminate immediately prior to the consummation of this offering, and will not apply to the sale of shares in this offering.
Registration rights agreement
After this offering, pursuant to the terms of a sixth amended and restated registration rights agreement, the holders of 60,725,348 shares of our common stock (including restricted stock) will be entitled to rights with respect to the registration of these shares under the Securities Act of 1933, as amended, as described below. These holders include the 5% Security Holders.
Demand registration rights
At any time beginning 180 days after the closing of this offering, and upon the written request of entities sponsored by or associated with Bain Capital Partners, LLC or entities affiliated with Summit Partners or funds managed by Advent International Corporation, we must give notice to all holders of our common stock with registration rights, who would have 30 days to request inclusion in the offering, file a registration statement and use our best efforts to register all shares timely requested to be registered. Entities affiliated with Bain Capital Partners and certain entities affiliated with Summit Partners have two such demand registration rights and certain other entities affiliated with Summit Partners and the funds managed by Advent International Corporation have one such demand registration right. We are generally not obligated to effect a registration during the 120-day period subsequent to our filing a registration statement pursuant to these demand registration rights. We may postpone the filing of a registration statement for up to 90 days twice in a 12-month period, but not more than 120 consecutive days, if we have plans to engage in a registered public offering and our board of directors determines in good faith that such offering would be adversely affected by the requested registration.
Piggyback registration rights
If we register any of our securities for public sale, we must give notice to all holders of our common stock with registration rights, who would have 20 days to request inclusion in the offering, and use our best efforts to cause to be registered shares held by our stockholders with registration rights that request to include their shares in the registration statement. However, this right does not apply to a registration relating to any of our employee benefit plans or a corporate reorganization. The managing underwriter of any underwritten public offering will have the right to limit, due to marketing reasons, the number of shares registered by these holders. These piggyback registration rights will not apply to this offering.
132
Table of Contents
Index to Financial Statements
Form S-3 registration rights
The holders of registration rights can request that we register all or a portion of their shares on Form S-3 if we are eligible to file a registration statement on Form S-3, upon which request we must give notice to all holders of our common stock with registration rights, who would have 20 days to request inclusion in the offering. We are required to file no more than one registration statement on Form S-3 upon exercise of these rights per six-month period and we are not required to honor registration requests if the aggregate market value of securities registered would be less than $10 million.
Registration expenses
We will pay all expenses incurred in connection with each of the registrations described above, except for underwriters’ discounts and selling commissions. In addition, we will pay the reasonable fees and disbursements of one counsel for the stockholders participating in such registration.
Indemnification
We have agreed, subject to certain exceptions, to indemnify against liabilities resulting from this offering and the offerings described above, each selling stockholder that is a party to the registration rights agreement, including the 5% Security Holders. In addition, we have agreed that, in order to provide for just and equitable contribution to joint liability, if indemnification is not available to such parties, FleetCor and such parties will each contribute to any liability based on the proportion that the price of the shares sold by them relates to the aggregate offering price, subject to certain exceptions.
Expiration of registration rights
The registration rights described above will terminate with respect to a particular stockholder to the extent the shares held by and issuable to such holder may be sold without registration under the Securities Act in the manner and quantity proposed to be sold.
Policies and procedures with respect to related party transactions
Prior to this offering, we had not adopted any policies or procedures for the review, approval or ratification of transactions with related parties. However, in accordance with the charter of our audit committee, which will become effective upon the closing of this offering, and our policy on related party transactions, which our board of directors will adopt effective upon the closing of this offering, our audit committee will be responsible for reviewing and approving related party transactions. The related party transaction policy will apply to transactions, arrangements and relationships where the aggregate amount involved will or may be expected to exceed $120,000 in any calendar year, where we are a participant and in which a related person has or will have a direct or indirect material interest. A related person is: (1) any of our directors, nominees for director or executive officers; (2) any immediate family member of a director, nominee for director or executive officer; and (3) any person, and his or her immediate family members, or entity that was a beneficial owner of 5% or more of any of our outstanding equity securities at the time the transaction occurred or existed.
In the course of its review and approval of related party transactions, our audit committee will consider the relevant facts and circumstances to decide whether to approve such transactions. Our audit committee will approve only those transactions that it determines are in our best interest. In particular, our policy on related party transactions will require our audit committee to consider, among other factors it deems appropriate:
| • | whether the related party transaction is on terms no less favorable than terms generally available to an unaffiliated third party under the same or similar circumstances; and |
| • | the extent of the related party’s interest in the transaction. |
133
Table of Contents
Index to Financial Statements
Pursuant to our policy on related party transactions, our audit committee will identify the following categories of transactions as deemed to be preapproved by the audit committee, even if the aggregate amount involved exceeds the $120,000 threshold:
| • | our employment of any executive officer or compensation paid by us to any executive officer if our compensation, nominating and corporate governance committee approved (or recommended that our board of directors approve) such compensation; |
| • | any compensation paid to a director if the compensation is required to be reported in our proxy statement under Item 402 of the SEC’s compensation disclosure requirements; |
| • | any transaction with another company at which a related person’s only relationship is as an employee (other than an executive officer), director or beneficial owner of less than 10% of that company’s shares, if the aggregate amount involved does not exceed the greater of $1,000,000, or 2% of that company’s total annual revenues; |
| • | any charitable contribution, grant or endowment made by us to a charitable organization, foundation or university at which a related person’s only relationship is as an employee (other than an executive officer) or a director, if the aggregate amount involved does not exceed the lesser of $1,000,000, or 2% of the charitable organization’s total annual receipts; |
| • | any transaction where the related person’s interest arises solely from the ownership of our common stock and all holders of our common stock received the same benefit on a pro rata basis; |
| • | any transaction involving a related person where the rates or charges involved are determined by competitive bids; |
| • | any transaction with a related person involving the rendering of services as a common or contract carrier, or public utility, at rates or charges fixed in conformity with law or governmental authority; and |
| • | any transaction with a related person involving services as a bank depositary of funds, transfer agent, registrar, trustee under a trust indenture, or similar services. |
In addition, our Code of Business Conduct and Ethics, which will become effective upon the closing of this offering, requires that each of our employees and directors inform his or her superior or the chairman of the audit committee, respectively, of any material transaction or relationship that comes to their attention that could reasonably be expected to create a conflict of interest. Further, at least annually, each director and executive officer will complete a detailed questionnaire that asks questions about any business relationship that may give rise to a conflict of interest and all transactions in which we are involved and in which the executive officer, a director or a related person has a direct or indirect material interest.
134
Table of Contents
Index to Financial Statements
The following summary of our indebtedness and the provisions of each debt instrument summarized below do not purport to be complete and are subject to, and qualified in their entirety by reference to, each of the debt instruments, which we have included as exhibits to the registration statement of which this prospectus is a part. All foreign currency amounts that have been converted into U.S. dollars in this summary are based on the exchange rate as reported by Oanda as of December 31, 2009.
2005 Credit Facility
We are a party to a credit facility agreement, dated as of June 29, 2005, which was amended and restated as of April 30, 2007, among FleetCor Technologies Operating Company, LLC and FleetCor UK Acquisition Limited, as borrowers, FleetCor Technologies, Inc., JPMorgan Chase Bank, N.A., as administrative agent and collateral agent, J.P. Morgan Europe Limited, as London agent, and the lenders from time to time party thereto. We refer to this credit facility as the 2005 Credit Facility in this prospectus. The 2005 Credit Facility provides for term loans in the amount of $250.0 million, and two tranches of multicurrency revolving loans, each of which may be made in U.S. dollars, British pounds or Euros; a U.S. tranche for the U.S. borrower of up to $30.0 million (with a $10 million sublimit for letters of credit), and a global tranche for both the U.S. borrower and the U.K. borrower of up to $20.0 million. There is also a $10.0 million swing line facility which is available to the U.S. borrower. The 2005 Credit Facility provides for delayed draw term loans in the amount of up to $50.0 million, of which $50.0 million was borrowed in April 2008. The 2005 Credit Facility further provides for incremental term loans in the aggregate not to exceed $100.0 million. None of the incremental term loans have been made.
The stated maturity date for our term loans is April 30, 2013 and the stated maturity date for our revolving loans and letters of credit is April 30, 2012. We have the right to prepay the loans without premium or penalty, other than to compensate the lenders for losses on any LIBOR loan or EURIBOR loan which is prepaid on a date other than the last day of an interest period. Mandatory prepayments are required from net cash proceeds of certain dispositions of assets, issuances of equity and issuances of indebtedness. We are required to prepay our term loans in an amount equal to 50% of the net cash proceeds from the issuance of shares of our stock in a public offering. There are exceptions for net cash proceeds that we receive from the issuance of stock to repurchase certain other equity interests or that we use to finance acquisitions. We must make any required prepayment within five business days of receipt of such net cash proceeds. This requirement of prepayment will apply to the proceeds of this offering. We are required to make mandatory prepayments in an amount equal to 50% of excess cash flow for each fiscal year unless our leverage ratio was less than 1.5 to 1 as of the last day of the immediately preceding four fiscal quarters, in which case the prepayment must be in an amount equal to 25% of excess cash flow. No prepayment is required if our leverage ratio on such date was less than 1.0 to 1.
All obligations of the U.S. borrower, under the 2005 Credit Facility are guaranteed by each of our domestic subsidiaries other than FleetCor Funding LLC and are secured by substantially all of our domestic assets, including intercompany debt, and by pledges of 65.0% of our equity interests in our first tier foreign subsidiaries, with an express exclusion for accounts receivable and related assets sold under our securitization facility. All obligations of the U.K. borrower under the 2005 Credit Facility are guaranteed by each of our domestic and U.K. subsidiaries and are secured by all the assets securing the obligations of the U.S. borrower and by pledges of all our equity interests in substantially all of our U.K. subsidiaries.
Interest on the facilities may accrue, at our election, based on a base rate, EURIBOR or LIBOR, plus a margin. The margin with respect to term loans is fixed at 2.25% for LIBOR and EURIBOR loans and at 1.25% for base rate loans. With respect to revolving loans and letter of credit fees, the margin or fee is determined based on our leverage ratio and ranges from 2.00% to 2.50% for LIBOR and EURIBOR loans and from 1.00% to 1.50% for
135
Table of Contents
Index to Financial Statements
base rate loans. As of September 30, 2010 our term loans bore interest at LIBOR plus 2.25% and we had no U.S. revolving loans or multicurrency loans outstanding. Interest on overdue amounts will accrue at a rate equal to the applicable interest rate plus 2.0% per annum. We were required under the credit agreement to enter into interest rate swaps with respect to at least 40% of our long term debt.
The proceeds of the initial term loans made on April 30, 2007 were used to refinance existing term loans, to finance a share repurchase, to finance certain acquisitions, and for working capital and other general corporate purposes. The proceeds of the revolving loans and swing line loans are to be used for working capital and other general corporate purposes. The proceeds of the delayed draw term loans were used for permitted acquisitions. Letters of credit are to be used solely to support payment obligations incurred by us in the ordinary course of business.
We are required to pay the following fees with respect to the 2005 Credit Facility: (i) an unused fee of 0.375% per annum of the daily availability under our revolving credit facility, (ii) a participation fee with respect to letters of credit for each lender for its participation in letters of credit and a fronting fee of 0.125% per annum to the issuing bank, plus the issuing bank’s other fees, and (iii) other fees of the agents as separately agreed.
The 2005 Credit Facility contains a number of negative covenants restricting, among other things, indebtedness, investments, liens, dispositions of assets, restricted payments (including dividends), mergers and acquisitions, burdensome agreements, accounting changes, transactions with affiliates, prepayments of indebtedness, and capital expenditures. Two financial covenants, including a leverage ratio requirement and an interest coverage ratio requirement, are measured quarterly. We are currently required to maintain a leverage ratio of not greater than 2.25 to 1, and beginning January 1, 2011, we will be required to maintain a leverage ratio of not greater than 2.00 to 1. We are required to maintain an interest coverage ratio of not less than 4.00 to 1. As of September 30, 2010, we were in compliance with each of the covenants under this credit agreement.
The events of default under the 2005 Credit Facility include non-payment, noncompliance with covenants, breaches of representations and warranties, default under the securitization facility or under any other agreement relating to indebtedness in excess of $10.0 million, insolvency proceedings, inability to pay debts, judgments in excess of $10.0 million which are not satisfied or stayed pending appeal, writ issued against a material part of a restricted party’s assets, invalidity of loan documents, failure of collateral documents to create liens, change of control, certain ERISA events, and the obligations under the credit agreement ceasing to be senior debt. Following this offering, a “change of control” will mean: (1) a person or group (each as defined in sections 13(d) and 14(d) of the Exchange Act), subject to certain exceptions and excluding Bain Capital Partners LLC, Summit Ventures, L.P., Advantage Capital, GCC Investments, Advent and Reily Corporation and their respective affiliates (the “Permitted Holders”), becomes the beneficial owner (as defined in Rules 13(d)-3 and 13(d)-5 under the Exchange Act), directly or indirectly, of more than the greater of (a) 35% of the outstanding shares of our capital stock and (b) the percentage of our outstanding capital stock owned, directly or indirectly, beneficially by the Permitted Holders, or (2) during any period of twelve consecutive months, a majority of our board of directors fails to consist of continuing directors (as defined in the 2005 Credit Facility).
We have received commitments from lenders for an additional tranche of revolving loans in the amount of up to $100 million to be made under the terms of the 2005 Credit Facility. The additional revolving loans will be available only in U.S. dollars, and the commitments for the additional revolving loans will not be held pro rata with the commitments held by the lenders holding existing commitments for the revolving loans and term loans. The additional revolving loan commitments will have a maturity date of October 31, 2012. The maturity date of the existing commitments for revolving loans is April 30, 2012, and the lenders providing such commitments will be asked to extend the maturity date to October 31, 2012. The revolving commitments held by any lender not agreeing to the extension of the maturity date will remain April 30, 2012. In all other respects, we expect that the additional revolving loan commitments will be subject to the terms and conditions applicable to revolving loans made under the existing commitments for the U.S. tranche. The conditions for the additional revolving loan
136
Table of Contents
Index to Financial Statements
commitments include, among other things, the closing of this offering and the execution of definitive documentation on or before January 15, 2011.
In addition, J.P. Morgan Securities LLC has agreed to arrange for an amendment to the 2005 Credit Facility to permit the additional revolving loans described above, to remove the mandatory prepayment requirement with respect to excess cash flow and certain equity issuances, to extend the maturity date on revolving loans with respect to consenting lenders to October 31, 2012, and to increase the interest rate margins for term loans. We expect that the proposed amendment will also include certain other covenant amendments, subject to the requisite consents of the other lenders. The conditions for the proposed amendments include, among other things, the closing of this offering and the execution of definitive documentation on or before January 15, 2011. A customary consent fee will be payable by us, together with certain other amendment fees and expenses.
CCS Credit Facility
Certain of our subsidiaries are parties to a credit facility agreement, dated as of December 7, 2006, which was amended as of March 28, 2008, among CCS Česká společnost pro platební karty a.s., as borrower, FENIKA s.r.o., as borrower (FENIKA s.r.o. and CCS Česká společnost pro platební karty a.s. subsequently merged into a new entity CCS Česká společnost pro platební karty s.r.o. (“CCS”)), FleetCor Luxembourg Holding 3 S.à r.l., as shareholder, HVB Bank Czech Republic a.s. (current commercial name UniCredit Bank Czech Republic, a.s.), as security agent, Bank Austria Creditanstalt AG (current commercial name Unicredit Bank Austria AG), as arranger and facility agent, and the other lenders party thereto. We refer to this facility as the CCS Credit Facility in this prospectus. The CCS Credit Facility agreement provides for term loans in the total amount of CZK 1.675 billion ($83.8 million), which consists of a “Facility A” amortized term loan in the amount of CZK 990.0 million ($49.5 million) and a “Facility B” bullet term loan in the amount of CZK 685.0 million ($33.5 million).
The stated maturity date for CCS’s term loans is December 21, 2013 with respect to “Facility A” and December 21, 2014 with respect to “Facility B”. The unpaid principal balance of the term loans as of September 30, 2010 is approximately CZK 452.0 million ($25.0 million) for “Facility A” and approximately CZK 616.2 million ($34.2 million) for “Facility B”. CCS has the right to prepay the loans without premium or penalty on the last day of any interest period with respect to the loans being prepaid. Mandatory prepayments are required from proceeds of certain dispositions of assets. CCS is required to make a mandatory prepayment in an amount equal to 50% of such proceeds or in case of the disposal of the shares in CCS’s subsidiary CCS Slovenská spolocnost preplatabné karty s.r.o., the greater of 50% of the net proceeds and CZK 100.0 million ($5.4 million). CCS is also required to make a mandatory prepayment in an amount equal to 50% of excess cash flow for each fiscal year unless CCS’s leverage ratio was less than 2.5 to 1 as of the last day of the immediately preceding four fiscal quarters, in which case no prepayment is required. The mandatory prepayment of all outstanding loans is also required if FleetCor ceases to be the beneficial owner of 100% of the issued share capital of CCS.
The obligations at CCS with respect to the term loans are guaranteed FleetCor Luxembourg Holding 3 S.à r.l. and are secured by substantially all of CCS’s and such guarantor’s assets, including a pledge of 100% of the equity interest in CCS and a pledge of all of CCS’s business assets, including the security assignment of trade receivables and intercompany debt. In addition, FleetCor is obligated to provide a payment support loan to CCS if the ratio of cash and substitutes to customer deposits received falls below 67%. The amount of any required payment support loan would be the amount by which the aggregate amount of customer deposits received from CCS’s customers exceeds the average amount of cash and cash substitutes that CCS has on hand, determined monthly. As of September 30, 2010, the aggregate customer deposits received by CCS were approximately CZK 1.2 billion ($65.9 million).
137
Table of Contents
Index to Financial Statements
Interest on the term loans may accrue, calculated according to the term selected by CCS, based on a base rate, PRIBOR (Prague Interbank Offered Rate), plus a margin and a mandatory cost. The margin is determined based on CCS’s leverage ratio and ranges from 0.95% to 1.75% for the “Facility A” term loan and from 2.00% to 2.50% for the “Facility B” term loan. As of September 30, 2010, the interest rate on “Facility A” equaled 2.15 and the interest rate on “Facility B” equaled 3.00. Interest on overdue amounts will accrue at a rate equal to the applicable interest rate plus 1.00% per annum.
CCS is required to pay the following fees with respect to CCS’s term loans: (i) an annual agency fee in the amount of €20,000, (ii) an annual security agency fee in the amount of CZK 420,000 ($0.23 million), and (iii) a one-time arrangement fee.
The CCS Credit Facility agreement contains a number of negative covenants restricting, among other things, indebtedness, investments, liens, dispositions of assets, change of business, restricted payments (including dividends), mergers and acquisitions, transactions with affiliates and prepayments of indebtedness. The agreement also contains financial covenants including a leverage ratio requirement, a debt service cover ratio requirement, an equity ratio requirement and a liquidity ratio requirement, all of which are tested quarterly. CCS is currently required to maintain a leverage ratio of not greater than 3.50 to 1, and beginning July 1, 2010, CCS will be required to maintain a leverage ratio of not greater than 3.25 to 1. CCS is required to maintain a debt service coverage ratio of not less than 1.20 to 1, an equity ratio of not less than 0.20 to 1, and a liquidity ratio not less than 1.00 to 1. As of September 30, 2010, CCS was in compliance with each of the covenants under the CCS Credit Facility agreement.
The events of default under CCS’s Credit Facility agreement include non-payment, noncompliance with covenants, breaches of representations and warranties, default under any agreement relating to indebtedness or any agreements relating to indebtedness in an aggregate amount in excess of CZK 75.0 million ($4.1 million), insolvency proceedings, cessation of business, inability to pay debts, any one or more judgments including an aggregate liability in excess of CZK 50.0 million ($2.7 million) that are not vacated, discharged or stayed pending appeal, attachment of a part of a restricted party’s assets having an aggregate value of at least CZK 50.0 million ($2.7 million), invalidity of the CCS Credit Facility loan documents and audit qualification.
Seller financing note
One of our subsidiaries, FleetCor Luxembourg Holding2 S.à r.l. (“Lux 2”), entered into a Share Sale and Purchase Agreement dated April 24, 2008 (the “Purchase Agreement”) with ICP Internet Cash Payments B.V. for the purchase of ICP International Card Products B.V. The acquired business is now being operated in the Netherlands as FleetCor Technologieën B.V. In connection with the purchase, Lux 2 agreed to make deferred payments in the aggregate amount of €1,022,500 ($1.5 million), of which one remaining payment is due and payable on June 6, 2011 in the amount of €325,000 ($0.44 million). The obligation to make such deferred payments is described in the Purchase Agreement, as modified by letter agreement dated August 11, 2008, and is not evidenced by a promissory note.
Securitization facility
We are a party to a receivables purchase agreement among FleetCor Funding LLC, as seller, PNC Bank, National Association as administrator, and the various purchaser agents, conduit purchasers and related committed purchasers parties thereto, which was amended and restated for the fourth time as of October 29, 2007 and which has been amended three times since then to add or remove purchasers and to extend the facility termination date, among other things. We refer to this arrangement as the securitization facility in this prospectus. The current purchase limit under the receivables purchase facility is $500.0 million and the facility termination date is
138
Table of Contents
Index to Financial Statements
February 24, 2011. The receivables and related rights sold under the facility are expressly excluded from the collateral securing our 2005 Credit Facility and the sale of the receivables and related rights is expressly permitted under the covenants in the 2005 Credit Facility.
Under a related purchase and sale agreement dated as of December 20, 2004 and most recently amended on July 7, 2008, between FleetCor Funding LLC, as purchaser, and certain of our subsidiaries, as originators, the receivables generated by the originators are deemed to be sold to FleetCor Funding LLC immediately and without further action upon creation of such receivables. At the request of FleetCor Funding LLC, as seller, undivided percentage ownership interests in the receivables are ratably purchased by the purchasers in amounts not to exceed their respective commitments under the facility. Collections on receivables are required to be made pursuant to a written credit and collection policy and may be reinvested in other receivables, may be held in trust for the purchasers, or may be distributed. Under the securitization facility, FleetCor has been appointed and currently serves as the servicer on the facility, but following the occurrence of a termination event (as described below), a successor servicer may be designated by the administrator, with the consent of, or at the direction of, the majority purchaser agents. The servicer may delegate its duties to a sub-servicer. Fees are paid to each purchaser agent for the benefit of the purchasers and liquidity providers in the related purchaser group in accordance with the securitization facility and certain fee letter agreements.
The securitization facility provides for certain termination events, upon the occurrence of which the administrator may declare the facility termination date to have occurred, may exercise certain enforcement rights with respect to the receivables, and may appoint a successor servicer, among other things. Termination events include nonpayment, noncompliance with covenants, breaches of representations or warranties, failure to transfer rights as servicer to any successor servicer when required, failure of any purchase to be a valid and enforceable first priority perfected undivided percentage ownership or security interest free and clear of adverse claims, insolvency, inability to pay debts, default under any indebtedness in excess of $10.0 million, the failure to maintain certain ratios related to defaults, delinquencies and dilution, change in control, the purchased interest exceeds 100% for two business days, the Internal Revenue Service or the Pension Benefit Guaranty Corporation files liens for amounts in excess of $250,000 against our assets, failure to maintain a leverage ratio of not greater than 2.25 to 1 through December 31, 2010 and 2.00 to 1 for the periods thereafter (measured quarterly), failure to maintain an interest coverage ratio of not less than 4.00 to 1 (measured quarterly), failure to perform under the performance guaranty, or the making of capital expenditures in excess of $16.0 million for domestic subsidiaries or $6.0 million for foreign subsidiaries, among others. A “change in control” means (1) we cease to own, directly or indirectly, (a) 100% of the capital stock of FleetCor Funding LLC or (b) a majority of the capital stock of any of our subsidiary originators, in each case free and clear of all adverse claims as defined in the receivables purchase agreement and subject to certain exceptions, or (2) the occurrence of a change of control as defined in the 2005 Credit Facility (as described in “—2005 Credit Facility”). As of September 30, 2010, we were in compliance with each of the covenants under our securitization facility.
139
Table of Contents
Index to Financial Statements
The following description summarizes important terms of our capital stock. Because it is only a summary, it does not contain all the information that may be important to you. For a complete description, you should refer to our amended and restated certificate of incorporation and amended and restated bylaws, forms of which have been filed as exhibits to the registration statement of which this prospectus is a part, as well as the relevant portions of the Delaware General Corporation Law, or DGCL. References to our certificate of incorporation and bylaws are to our amended and restated certificate of incorporation and our amended and restated bylaws, respectively, each of which will become effective upon completion of this offering.
Common stock
General. As of September 30, 2010, there were 77,700,311 shares of our common stock outstanding, par value $0.001 per share, and approximately 183 stockholders of record. After this offering, our certificate of incorporation will authorize the issuance of 475,000,000 shares of our common stock, and there will be 78,719,146 shares of our common stock outstanding.
Voting rights. The holders of our common stock will be entitled to one vote for each share held of record on all matters submitted to a vote of the stockholders, including the election of directors, and do not have cumulative voting rights. Unless otherwise required by law, matters submitted to a vote of our stockholders will require the approval of a majority of votes cast by stockholders represented in person or by proxy and entitled to vote on such matter, except that directors are elected by a plurality of votes cast. Accordingly, the holders of a majority of the shares of common stock entitled to vote in any election of directors will be able to elect all of the directors standing for election, if they so choose.
Dividend rights. Holders of common stock will be entitled to receive ratably dividends if, as and when dividends are declared from time to time by our board of directors out of funds legally available for that purpose subject to any preferential dividend rights of any then outstanding preferred stock. Our ability to pay dividends is limited by covenants in our credit facilities. See “Description of indebtedness” for restrictions on our ability to pay dividends.
Other matters. Upon our liquidation, dissolution or winding up, the holders of common stock will be entitled to share ratably in the net assets legally available for distribution to stockholders after the payment of all of our debts and other liabilities and subject to any other distribution rights granted to holders of any outstanding preferred stock. Holders of common stock will have no preemptive or conversion rights or other subscription rights, and no redemption or sinking fund provisions will be applicable to our common stock. All outstanding shares of common stock are, and the shares of common stock to be outstanding upon completion of this offering will be, fully paid and nonassessable.
Preferred stock
Our certificate of incorporation will permit our board of directors to issue up to 25,000,000 shares of preferred stock from time to time in one or more classes or series. The board also may fix the relative rights and preferences of those shares, including dividend rights, conversion rights, voting rights, redemption rights, terms of sinking funds, liquidation preferences and the number of shares constituting any class or series or the designation of the class or series. Terms selected by our board of directors in the future could decrease the amount of earnings and assets available for distribution to holders of common stock or adversely affect the rights and powers, including voting rights, of the holders of common stock without any further vote or action by the stockholders. As a result, the rights of holders of our common stock will be subject to, and may be adversely affected by, the rights of the holders of any preferred stock that may be issued by us in the future, which could have the effect of decreasing the market price of our common stock.
140
Table of Contents
Index to Financial Statements
Anti-takeover effects of provisions of our certificate of incorporation and bylaws and Delaware law
The provisions of the Delaware General Corporation Law and our certificate of incorporation and bylaws could have the effect of discouraging others from attempting an unsolicited offer to acquire our company. Such provisions may also have the effect of preventing changes in our management. It is possible that these provisions could make it more difficult to accomplish transactions that stockholders may otherwise deem to be in their best interests.
Election and removal of directors. Our board of directors will be divided into three classes with initial terms ending at our annual meetings of stockholders in 2011, 2012 and 2013, respectively. Following their initial terms, each class of directors will be elected for a three-year term. Our directors may be removed only by the affirmative vote of at least 66 2/3% of our then outstanding common stock and only for cause. For more information on the terms of our directors, see the section entitled “Management—Board of directors and committees.” This system of electing and removing directors generally makes it more difficult for stockholders to replace a majority of our directors.
Authorized but unissued shares. The authorized but unissued shares of our common stock and our preferred stock will be available for future issuance without any further vote or action by our stockholders. These additional shares may be utilized for a variety of corporate purposes, including future public offerings to raise additional capital, corporate acquisitions and employee benefit plans. The existence of authorized but unissued shares of our common stock and our preferred stock could render more difficult or discourage an attempt to obtain control over us by means of a proxy contest, tender offer, merger or otherwise.
Stockholder action; advance notification of stockholder nominations and proposals. Our certificate of incorporation and bylaws require that any action required or permitted to be taken by our stockholders must be effected at a duly called annual or special meeting of stockholders and may not be effected by a consent in writing. Our certificate of incorporation also requires that special meetings of stockholders be called only by a majority of our board of directors. In addition, our bylaws provide that candidates for director may be nominated and other business brought before an annual meeting only by the board of directors or by a stockholder who gives written notice to us no later than 90 days prior to nor earlier than 120 days prior to the first anniversary of the last annual meeting of stockholders. These provisions may have the effect of deterring unsolicited offers to acquire our company or delaying changes in control of our management, which could depress the market price of our common stock.
Amendment of certain provisions in our organizational documents. The amendment of any of the above provisions would require approval by holders of at least 66 2/3% of the voting power of all of the then outstanding shares of the capital stock entitled to vote generally in the election of directors, voting together as a single class.
No cumulative voting. The DGCL provides that stockholders are not entitled to the right to cumulate votes in the election of directors unless our certificate of incorporation provides otherwise. Our certificate of incorporation will expressly prohibit cumulative voting.
Delaware anti-takeover law. Our certificate of incorporation provides that Section 203 of the DGCL, an anti-takeover law, will apply to us. In general, Section 203 prohibits a publicly held Delaware corporation from engaging in a “business combination” with an “interested stockholder” for a period of three years following the date the person became an interested stockholder, unless the “business combination” or the transaction in which the person became an interested stockholder is approved in a prescribed manner. Generally, a “business
141
Table of Contents
Index to Financial Statements
combination” includes a merger, asset or stock sale, or other transaction resulting in a financial benefit to the interested stockholder. Generally, an “interested stockholder” is a person who, together with affiliates and associates, owns or, within three years prior to the determination of interested stockholder status, did own, 15% or more of a corporation’s voting stock.
Limitation of liability and indemnification
Our certificate of incorporation will provide that no director will be personally liable for monetary damages for breach of any fiduciary duty as a director, except with respect to liability:
| • | for any breach of the director’s duty of loyalty to us or our stockholders; |
| • | for acts or omissions not in good faith or that involve intentional misconduct or a knowing violation of law; |
| • | under Section 174 of the DGCL (governing distributions to stockholders); or |
| • | for any transaction from which the director derived any improper personal benefit. |
If the DGCL is amended to authorize corporate action further eliminating or limiting the personal liability of directors, then the liability of our directors will be eliminated or limited to the fullest extent permitted by the DGCL, as so amended. The modification or repeal of this provision of our amended and restated certificate of incorporation will not adversely affect any right or protection of a director existing at the time of such modification or repeal.
Our bylaws will also provide that we will, to the fullest extent permitted by law, indemnify our directors and officers against all liabilities and expenses in any suit or proceeding or arising out of their status as an officer or director or their activities in these capacities. We will also indemnify any person who, at our request, is or was serving as a director, officer, employee, agent or trustee of another corporation or of a partnership, limited liability company, joint venture, trust or other enterprise. We may, by action of our board of directors, provide indemnification to our employees and agents within the same scope and effect as the foregoing indemnification of directors and officers.
Registration rights
Some of our stockholders have the right to require us to register common stock for resale in some circumstances. See “Certain relationships and related transactions—Registration rights agreement.”
Transfer agent and registrar
The transfer agent and registrar for our common stock will be American Stock Transfer & Trust Company, LLC.
142
Table of Contents
Index to Financial Statements
Shares eligible for future sale
Based upon the number of shares of our common stock outstanding as of September 30, 2010, we will have 78,719,146 shares of common stock outstanding upon the closing of this offering. All of the shares of our common stock sold in this offering are freely tradable without restriction or further registration under the Securities Act of 1933, as amended, except for any such shares which may be held or acquired by our “affiliates,” as that term is defined in Rule 144 promulgated under the Securities Act of 1933, as amended, which shares will be subject to the volume limitations and other restrictions of Rule 144 described below. The remaining 66,044,146 shares of common stock will be “restricted securities,” as that term is defined in Rule 144. These restricted securities will be eligible for public sale only if they are registered under the Securities Act of 1933, as amended, or if they qualify for an exemption from registration under Rule 144.
Rule 144
In general, under Rule 144 as in effect on the date of this prospectus, a person who is not one of our affiliates at any time during the three months preceding a sale, and who has beneficially owned shares of our common stock for at least six months, would be entitled to sell an unlimited number of shares of our common stock provided current public information about us is available and, after owning such shares for at least one year, would be entitled to sell an unlimited number of shares of our common stock without restriction. Our affiliates who have beneficially owned shares of our common stock for at least six months are entitled to sell within any three-month period a number of shares that does not exceed the greater of:
| • | 1% of the number of shares of our common stock then outstanding, which was equal to approximately 777,003 shares as of September 30, 2010; or |
| • | the average weekly trading volume of our common stock on the New York Stock Exchange during the four calendar weeks preceding the filing of a notice on Form 144 with respect to the sale. |
Sales under Rule 144 by our affiliates are also subject to manner of sale provisions and notice requirements and to the availability of current public information about us.
Options
Following the date of this prospectus, we intend to file one or more registration statements on Form S-8 under the Securities Act of 1933, as amended to register the issuance of up to 13,931,229 shares of common stock under our stock plans. These registration statements will become effective upon filing. All of the shares issued or to be issued upon the exercise of stock options or settlement of other awards under our stock plans are or will be eligible for resale in the public market without restrictions, subject to Rule 144 limitations applicable to affiliates and the lock-up agreements described below.
Registration rights
Upon the closing of this offering, the holders of 60,725,348 shares of our common stock (including restricted stock) will be entitled to rights with respect to the registration of these shares under the Securities Act of 1933, as amended. Registration of these shares under the Securities Act of 1933, as amended, would result in these shares becoming freely tradable without restriction under the Securities Act of 1933, as amended, immediately upon the effectiveness of registration, except for shares purchased by affiliates. For more information, see “Certain relationships and related transactions—Registration rights.”
143
Table of Contents
Index to Financial Statements
Lock-up agreements
Notwithstanding the foregoing, we, the selling stockholders and our directors and executive officers (collectively representing approximately 77,661,849 shares or approximately 99.95% of our common stock outstanding immediately prior to the offering) have agreed with the underwriters, subject to limited exceptions, not to dispose of or hedge any of their common stock or securities convertible into or exchangeable for shares of common stock during the 180-day period after the date of this prospectus, subject to extensions in certain cases, without the prior written consent of J.P. Morgan Securities LLC and Goldman, Sachs & Co.
144
Table of Contents
Index to Financial Statements
Certain United States federal tax consequences
The following is a summary of certain U.S. federal income and estate tax consequences relevant to the purchase, ownership and disposition of our common stock. The following summary is based upon current provisions of the Internal Revenue Code of 1986, as amended, or the Code, Treasury regulations and judicial and administrative authority, all of which are subject to change, possibly with retroactive effect. State, local and foreign tax consequences are not summarized, nor are tax consequences to special classes of investors, including, but not limited to, tax-exempt organizations, insurance companies, banks or other financial institutions, partnerships or other entities classified as partnerships for U.S. federal income tax purposes, dealers in securities, persons liable for the alternative minimum tax, traders in securities that elect to use a mark-to-market method of accounting for their securities holdings, persons who have acquired our common stock as compensation or otherwise in connection with the performance of services, persons that will hold our common stock as a position in a hedging transaction, “straddle,” “conversion transaction” or other risk reduction transaction, and U.S. holders (as defined below) whose functional currency is not the U.S. dollar. Tax consequences may vary depending upon the particular status of an investor. The summary is limited to taxpayers who will hold our common stock as “capital assets” (generally, property held for investment). Each potential investor should consult its own tax advisor as to the U.S. federal, state, local, foreign and any other tax consequences of the purchase, ownership and disposition of our common stock.
If an entity or arrangement treated as a partnership for U.S. federal income tax purposes holds our common stock, the tax consequences relating to an investment in our common stock will generally depend upon the status of the partner and the activities of the partnership. If you are treated as a partner in such an entity holding our common stock, you should consult your tax advisor as to the particular U.S. federal income and estate tax consequences applicable to you.
U.S. holders
The discussion in this section is addressed to a holder of our common stock that is a “U.S. holder” for federal income tax purposes. You are a U.S. holder if you are a beneficial owner of our common stock that is for U.S. federal income tax purposes (i) a citizen or individual resident of the United States; (ii) a corporation (or other entity that is taxable as a corporation) created or organized in the United States or under the laws of the United States or of any State (or the District of Columbia); (iii) an estate if the income of such estate falls within the federal income tax jurisdiction of the United States regardless of the source of such income; or (iv) a trust (a) if a United States court is able to exercise primary supervision over its administration and one or more United States persons have the authority to control all of the substantial decisions of the trust, or (b) that has in effect a valid election under applicable Treasury regulations to be treated as a U.S. person.
Distributions
Distributions with respect to our common stock will be taxable as dividend income when paid to the extent of our current or accumulated earnings and profits as determined for U.S. federal income tax purposes. To the extent that the amount of a distribution with respect to our common stock exceeds our current and accumulated earnings and profits, such distribution will be treated first as a tax-free return of capital to the extent of the U.S. holder’s adjusted tax basis in the common stock, and thereafter as a capital gain, which will be a long-term capital gain if the U.S. holder has held such stock at the time of the distribution for more than one year.
Distributions constituting dividend income received by an individual in respect of our common stock before January 1, 2011 are generally subject to taxation at a maximum rate of 15%, provided certain holding period
145
Table of Contents
Index to Financial Statements
requirements are satisfied. Distributions on our common stock constituting dividend income paid to U.S. holders that are U.S. corporations will generally qualify for the dividends received deduction, subject to various limitations.
Sale or redemption
A U.S. holder will generally recognize capital gain or loss on a sale, exchange, redemption (other than a redemption that is treated as a distribution) or other disposition of our common stock equal to the difference between the amount realized upon the disposition and the U.S. holder’s adjusted tax basis in the shares so disposed. Such capital gain or loss will be long-term capital gain or loss if the U.S. holder’s holding period for the shares disposed of exceeds one year at the time of disposition. Long-term capital gains of non-corporate taxpayers are generally taxed at a lower maximum marginal tax rate than the maximum marginal tax rate applicable to ordinary income. The deductibility of net capital losses by individuals and corporations is subject to limitations.
Information reporting and backup withholding
Information returns will be filed with the IRS in connection with payments of dividends and the proceeds from a sale or other disposition of common stock payable to a U.S. holder that is not an exempt recipient. Certain U.S. holders may be subject to backup withholding with respect to the payment of dividends on our common stock and to certain payments of proceeds on the sale or redemption of our common stock unless such U.S. holders provide proof of an applicable exemption or a correct taxpayer identification number, and otherwise comply with applicable requirements of the backup withholding rules.
Backup withholding is not an additional tax. Any amount withheld under the backup withholding rules from a payment to a U.S. holder is allowable as a credit against such U.S. holder’s U.S. federal income tax, which may entitle the U.S. holder to a refund, provided that the U.S. holder timely provides the required information to the IRS. Moreover, certain penalties may be imposed by the IRS on a U.S. holder who is required to furnish information but does not do so in the proper manner. U.S. holders should consult their tax advisors regarding the application of backup withholding in their particular circumstances and the availability of and procedure for obtaining an exemption from backup withholding under current Treasury regulations.
New medicare tax
On March 23, 2010, U.S. President Barack Obama signed into law the Patient Protection and Affordable Care Act. On March 30, 2010, President Obama signed into law a separate package of modifications (the “Reconciliation Act”). The Reconciliation Act imposes a 3.8% tax on certain types of income, including capital gains, dividends and interest. The tax applies to individuals meeting certain income thresholds during taxable years beginning after December 31, 2012. Prospective U.S. holders should consult their own tax advisors regarding these changes in the tax law.
Non-U.S. holders
The discussion in this section is addressed to holders of our common stock that are “non-U.S. holders.” You are a non-U.S. holder if you are a beneficial owner of our common stock (other than an entity treated as a partnership) and not a U.S. holder for U.S. federal income tax purposes.
Distributions
Generally, distributions treated as dividends as described above under “—U.S. Holders—Distributions” paid to a non-U.S. holder with respect to our common stock will be subject to a 30% U.S. withholding tax, or such lower
146
Table of Contents
Index to Financial Statements
rate as may be specified by an applicable income tax treaty. Distributions that are effectively connected with such non-U.S. holder’s conduct of a trade or business in the United States (and, if a tax treaty applies, are attributable to a U.S. permanent establishment of such holder) are generally subject to U.S. federal income tax on a net income basis and are exempt from the 30% withholding tax (assuming compliance with certain certification requirements). Any such effectively connected distributions received by a non-U.S. holder that is a corporation may also, under certain circumstances, be subject to an additional “branch profits tax” at a 30% rate or such lower rate as may be applicable under an income tax treaty.
For purposes of obtaining a reduced rate of withholding under an income tax treaty, a non-U.S. holder will generally be required to provide a U.S. taxpayer identification number as well as certain information concerning the holder’s country of residence and entitlement to tax treaty benefits. A non-U.S. holder can generally meet the certification requirement by providing a properly executed IRS Form W-8BEN (if the holder is claiming the benefits of an income tax treaty) or Form W-8ECI (if the dividends are effectively connected with a trade or business in the United States) or suitable substitute form.
Sale or redemption
A non-U.S. holder generally will not be subject to U.S. federal income or withholding tax on gain realized on the sale, exchange or other disposition (other than a redemption, which may be subject to withholding tax or certification requirements under certain circumstances) of our common stock unless (i) the non-U.S. holder is a non-resident alien individual present in the United States for 183 or more days in the taxable year of the sale or disposition and certain other conditions are met, or (ii) the gain is effectively connected with the conduct by the non-U.S. holder of a trade or business within the United States (and, if an income tax treaty applies, is attributable to a U.S. permanent establishment maintained by such non-U.S. holder).
Federal estate tax
Common stock owned or treated as owned by an individual who is not a citizen or resident of the United States (as specially defined for U.S. federal estate tax purposes) at the time of death will be included in the individual’s gross estate for U.S. federal estate tax purposes, unless an applicable estate tax or other treaty provides otherwise, and therefore may be subject to U.S. federal estate tax. The status of the U.S. federal estate tax is uncertain as of the time of this writing. You should consult your own tax advisor as to the U.S. federal estate tax consequences of the ownership of our common stock.
Information reporting and backup withholding
Payment of dividends, and the tax withheld with respect thereto, is subject to information reporting requirements. These information reporting requirements apply regardless of whether withholding was reduced or eliminated by an applicable income tax treaty. Under the provisions of an applicable income tax treaty or agreement, copies of the information returns reporting such dividends and withholding may also be made available to the tax authorities in the country in which the non-U.S. holder resides. U.S. backup withholding will generally apply on payment of dividends to non-U.S. holders unless such non-U.S. holders furnish to the payor a Form W-8BEN (or other applicable form), or otherwise establish an exemption and the payor does not have actual knowledge or reason to know that the holder is a U.S. person, as defined under the Code, that is not an exempt recipient.
Payment of the proceeds of a sale of our common stock within the United States or conducted through certain U.S.-related financial intermediaries is subject to information reporting and, depending on the circumstances, backup withholding, unless the non-U.S. holder, or beneficial owner thereof, as applicable, certifies that it is a
147
Table of Contents
Index to Financial Statements
non-U.S. holder on Form W-8BEN (or other applicable form), or otherwise establishes an exemption and the payor does not have actual knowledge or reason to know the holder is a U.S. person, as defined under the Code, that is not an exempt recipient.
Backup withholding is not an additional tax. Any amount withheld under the backup withholding rules from a payment to a non-U.S. holder is allowable as a credit against such non-U.S. holder’s U.S. federal income tax, which may entitle the non-U.S. holder to a refund, provided that the non-U.S. holder timely provides the required information to the IRS. Moreover, certain penalties may be imposed by the IRS on a non-U.S. holder who is required to furnish information but does not do so in the proper manner. Non-U.S. holders should consult their tax advisors regarding the application of backup withholding in their particular circumstances and the availability of and procedure for obtaining an exemption from backup withholding under current Treasury regulations.
New reporting requirements
On March 18, 2010, President Obama signed into law the Hiring Incentives to Restore Employment Act (the “Act”). The Act imposes a 30% withholding tax on certain withholdable payments, including dividends and proceeds from the sale of stock, made to foreign financial institutions and non-financial foreign entities that do not satisfy substantial new reporting requirements. The Act generally applies to payments made after December 31, 2012.
Generally, a foreign financial institution will satisfy these new reporting requirements by entering into an agreement with the U.S. Treasury to report the identities, account balances, and account transaction activity with respect to its U.S. accounts. A foreign financial institution must also agree to comply with any request by the U.S. Treasury for additional information relating to such accounts and any withholdable payments it receives. Generally, a non-financial foreign entity satisfies its reporting requirements by providing the withholding agent with either (i) a certification that it does not have any direct or indirect substantial U.S. owners or (ii) the name, address, and tax identification number of each of its substantial U.S. owners. Certain foreign entities, including publicly traded foreign corporations and foreign governments, are excluded from the new reporting requirements. Prospective non-U.S. holders should consult their own tax advisors regarding these changes in the tax law.
148
Table of Contents
Index to Financial Statements
We and the selling stockholders are offering the shares of common stock described in this prospectus through a number of underwriters. J.P. Morgan Securities LLC and Goldman, Sachs & Co. are acting as joint book-running managers of the offering and as representatives of the underwriters. Barclays Capital Inc. and Morgan Stanley & Co. Incorporated are also acting as joint book-running managers of the offering. We and the selling stockholders have entered into an underwriting agreement with the underwriters. Subject to the terms and conditions of the underwriting agreement among us, the selling stockholders and the underwriters, we and the selling stockholders have agreed to sell to the underwriters, and each underwriter has severally agreed to purchase, at the public offering price less the underwriting discounts and commissions set forth on the cover page of this prospectus, the number of shares of our common stock listed next to its name in the following table:
| Name | Number of shares |
|||
| J.P. Morgan Securities LLC |
||||
| Goldman, Sachs & Co. |
||||
| Barclays Capital Inc. |
||||
| Morgan Stanley & Co. Incorporated |
||||
| PNC Capital Markets LLC |
||||
| Raymond James & Associates, Inc. |
||||
| Wells Fargo Securities, LLC |
||||
| Total |
12,675,000 | |||
The underwriters are committed to purchase all the shares of our common stock offered by us and the selling stockholders if they purchase any shares. The underwriting agreement also provides that if an underwriter defaults, the purchase commitments of non-defaulting underwriters may also be increased or the offering may be terminated.
The underwriters propose to offer the common stock directly to the public at the initial public offering price set forth on the cover page of this prospectus and to certain dealers at that price less a concession not in excess of $ per share. Any such dealers may resell shares to certain other brokers or dealers at a discount of up to $ per share from the initial public offering price. After the initial public offering of the shares, the offering price and other selling terms may be changed by the underwriters. Sales of shares made outside the United States may be made by affiliates of the underwriters. The representatives have advised us that the underwriters do not intend to confirm discretionary sales in excess of 5% of the common stock offered in this offering. The offering of the shares by the underwriters is subject to receipt and acceptance and subject to the underwriters’ right to reject any order in whole or in part.
The underwriters have an option to buy up to 1,901,250 additional shares of our common stock from the selling stockholders to cover over-allotments, if any. The underwriters have 30 days from the date of this prospectus to exercise this over-allotment option. If any shares are purchased with this over-allotment option, the underwriters will purchase shares in approximately the same proportion as shown in the table above. If any additional shares of our common stock are purchased, the underwriters will offer the additional shares on the same terms as those on which the shares are being offered.
149
Table of Contents
Index to Financial Statements
The underwriting fee is equal to the public offering price per share of our common stock less the amount paid by the underwriters to us and the selling stockholders per share of our common stock. The underwriting fee is $ per share. The following table shows the per share and total underwriting discounts and commissions to be paid to the underwriters assuming both no exercise and full exercise of the underwriters’ option to purchase additional shares.
| Per share | Total | |||||||||||||||
| Without over- allotment |
With over- allotment |
Without over- allotment |
With over- allotment |
|||||||||||||
| Underwriting discounts and commissions paid by us |
||||||||||||||||
| Underwriting discounts and commissions paid by selling stockholders |
||||||||||||||||
We estimate that the total expenses of this offering, including registration, filing and listing fees, printing fees and legal and accounting expenses, but excluding the underwriting discounts and commissions, will be approximately $3,650,000, and will be paid by us.
A prospectus in electronic format may be made available on the websites maintained by one or more underwriters, or selling group members, if any, participating in the offering. The underwriters may agree to allocate a number of shares to underwriters and selling group members for sale to their online brokerage account holders. Internet distributions will be allocated by the representatives to underwriters and selling group members that may make Internet distributions on the same basis as other allocations.
For a period of 180 days after the date of this prospectus, we have agreed that we will not (i) offer, pledge, announce the intention to sell, sell, contract to sell, sell any option or contract to purchase, purchase any option or contract to sell, grant any option, right or warrant to purchase, or otherwise transfer or dispose of, directly or indirectly, or file with the SEC a registration statement under the Securities Act relating to, any shares of our common stock or any securities convertible into or exercisable or exchangeable for any shares of our common stock, or publicly disclose the intention to make any offer, sale, pledge, disposition or filing, or (ii) enter into any swap or other agreement that transfers, in whole or in part, any of the economic consequences of ownership of any of the shares of our common stock or any such other securities, whether any such transaction described in clause (i) or (ii) above is to be settled by delivery of shares of our common stock or such other securities, in cash or otherwise, without the prior written consent of J.P. Morgan Securities LLC and Goldman, Sachs & Co., other than the shares of our common stock to be sold hereunder and any shares of our common stock issued upon the exercise of options granted under our stock-based compensation plans. Notwithstanding the foregoing, if (1) during the last 17 days of the 180-day restricted period, we issue an earnings release or material news or a material event relating to our company occurs; or (2) prior to the expiration of the 180-day restricted period, we announce that we will release earnings results during the 16-day period beginning on the last day of the 180-day period, the restrictions described above shall continue to apply until the expiration of the 18-day period beginning on the issuance of the earnings release or the occurrence of the material news or material event.
Before the sale of any shares to be sold in this offering, our directors and executive officers, and our existing stockholders (subject to certain exceptions), have entered into lock-up agreements with the underwriters pursuant to which each of these persons or entities, with limited exceptions, for a period of 180 days after the date of this prospectus, may not, without the prior written consent of J.P. Morgan Securities LLC and Goldman, Sachs & Co., (1) offer, pledge, sell, contract to sell, sell any option or contract to purchase, purchase any option or contract to sell, grant any option, right or warrant to purchase, or otherwise transfer or dispose of, directly or indirectly, any shares of our common stock or any securities convertible into or exercisable or exchangeable for common stock (including without limitation, common stock or such other securities which may be deemed to be
150
Table of Contents
Index to Financial Statements
beneficially owned by such directors, executive officers and existing stockholders in accordance with the rules and regulations of the SEC and securities which may be issued upon exercise of a stock option or warrant), or publicly disclose the intention to make any offer, sale, pledge or disposition, (2) enter into any swap or other agreement that transfers, in whole or in part, any of the economic consequences of ownership of our common stock or such other securities, whether any such transaction described in clause (1) or (2) above is to be settled by delivery of our common stock or such other securities, in cash or otherwise or (3) make any demand for or exercise any right with respect to the registration of any shares of our common stock or any security convertible into or exercisable or exchangeable for our common stock, in each case other than (A) the securities to be sold by such directors, executive officers and existing stockholders pursuant to the underwriting agreement, (B) transfers of shares of our common stock or any security, directly or indirectly, convertible into common stock as a bona fide gift or gifts, (C) distributions of shares of our common stock or any security, directly or indirectly, convertible into common stock to limited or general partners, members, stockholders or affiliates (as defined under Rule 12b-2 of the Exchange Act) of such directors, executive officers and existing stockholders, as applicable, (D) transfers to immediate family members, trusts for the benefit of such directors, executive officers and existing stockholders or immediate family members of such directors, executive officers and existing stockholders, or limited partnerships the partners of which are such directors, executive officers and existing stockholders and/or immediate family members of such directors, executive officers and existing stockholders, in each case, for estate planning purposes, (E) transfers of shares of common stock by will or intestacy and (F) transfers of shares of common stock or any security, directly or indirectly, convertible into common stock to the affiliates of such directors, executive officers and existing stockholders or to any investment fund or other entity controlled or managed by such directors, executive officers and existing stockholders; provided that in the case of any transfer or distribution pursuant to clauses (B) (except in the case of a transfer by such directors, executive officers and existing stockholders on the date of the underwriting agreement to the charitable organizations scheduled in the underwriting agreement, so long as any such shares of common stock or any shares of common stock resulting from the conversion, exercise or exchange of any other such securities convertible into or exercisable or exchangeable for common stock are sold by such charitable organizations as part of the public offering pursuant to the underwriting agreement (such transfer, a permitted donation)), (C) (except in the case of a distribution to facilitate a permitted donation), (D), (E) or (F) (except in the case of a transfer to facilitate a permitted donation), each donee, distributee or transferee shall execute and deliver to the representatives a lock-up letter in the form of this paragraph; and provided, further that in the case of any transfer or distribution pursuant to clause (B), (C), (D) and (F), no filing by any party (donor, donee, transferor or transferee) under the Exchange Act or other public announcement (except for any public announcement of a permitted donation made in the prospectus) shall be required or shall be made voluntarily in connection with such transfer or distribution (other than a filing on a Form 5 made after the expiration of the lock-up period or, in the case of certain selling stockholders, a filing on Form 3 or Form 4 in connection with a transfer or distribution that does not result in a change in the aggregate number of shares of common stock or other securities convertible into or exchangeable for common stock, beneficially owned by such selling stockholders). For purposes of the lock-up agreement, “immediate family” shall mean any relationship by blood, marriage or adoption, not more remote than a first cousin. Notwithstanding the foregoing, such directors, executive officers and existing stockholders may (1) transfer shares of our common stock purchased by such directors, executive officers and existing stockholders on the open market following the public offering if and only if (i) no filing by any party (donor, donee, transferor or transferee) under the Exchange Act or other public announcement shall be required or shall be made voluntarily in connection with such transfer or distribution (other than a filing on a Form 5 made after the expiration of the lock-up period), (2) conduct a “net” or “cashless” exercise of options to acquire shares of our common stock in accordance with their terms, provided that any common stock received upon such exercise shall be subject to the restrictions contained in the lock-up agreement, (3) forfeit shares of restricted common stock that vest during the lock-up period to us only to satisfy tax withholding requirements, and (4) enter into a sales plan in accordance with Rule 10b5-1 promulgated under the Exchange Act if permitted by
151
Table of Contents
Index to Financial Statements
us, provided that no sales may be made pursuant to such plan until the expiration of the lock-up period. Further notwithstanding, if (1) during the last 17 days of the 180-day restricted period, the Company issues an earnings release or material news or a material event relating to the Company occurs; or (2) prior to the expiration of the 180-day restricted period, the Company announces that it will release earnings results during the 16-day period beginning on the last day of the 180-day period, the restrictions imposed by this Letter Agreement shall continue to apply until the expiration of the 18-day period beginning on the issuance of the earnings release or the occurrence of the material news or material event. Further notwithstanding, if (1) during the last 17 days of the 180-day restricted period, we issue an earnings release or material news or a material event relating to our company occurs; or (2) prior to the expiration of the 180-day restricted period, we announce that we will release earnings results during the 16-day period beginning on the last day of the 180-day period, the restrictions described above shall continue to apply until the expiration of the 18-day period beginning on the issuance of the earnings release or the occurrence of the material news or material event.
We and the selling stockholders have agreed to indemnify the several underwriters against certain liabilities, including liabilities under the Securities Act.
In connection with this offering, the underwriters may engage in stabilizing transactions, which involve making bids for, purchasing and selling shares of our common stock in the open market for the purpose of preventing or retarding a decline in the market price of our common stock while this offering is in progress. These stabilizing transactions may include making short sales of our common stock, which involve the sale by the underwriters of a greater number of shares of our common stock than they are required to purchase in this offering, and purchasing shares of our common stock in the open market to cover positions created by short sales. Short sales may be “covered” shorts, which are short positions in an amount not greater than the underwriters’ over-allotment option referred to above, or may be “naked” shorts, which are short positions in excess of that amount. The underwriters may close out any covered short position either by exercising their over-allotment option, in whole or in part, or by purchasing shares in the open market. In making this determination, the underwriters will consider, among other things, the price of shares available for purchase in the open market compared to the price at which the underwriters may purchase shares through the over-allotment option. A naked short position is more likely to be created if the underwriters are concerned that there may be downward pressure on the price of our common stock in the open market that could adversely affect investors who purchase shares in this offering. To the extent that the underwriters create a naked short position, they will purchase shares in the open market to cover the position.
The underwriters have advised us that, pursuant to Regulation M of the Securities Act, they may also engage in other activities that stabilize, maintain or otherwise affect the price of our common stock, including the imposition of penalty bids. This means that, if the representatives of the underwriters purchase our common stock in the open market in stabilizing transactions or to cover short sales, the representatives can require the underwriters that sold those shares as part of this offering to repay the underwriting discount received by them.
These activities may have the effect of raising or maintaining the market price of our common stock or preventing or retarding a decline in the market price of our common stock, and, as a result, the price of our common stock may be higher than the price that otherwise might exist in the open market. If the underwriters commence these activities, they may discontinue them at any time. The underwriters may carry out these transactions on the New York Stock Exchange, in the over-the-counter market or otherwise.
Prior to this offering, there has been no public market for our common stock. The initial public offering price will be determined by negotiations between us, the selling stockholders and the representatives of the underwriters. In determining the initial public offering price, we and the representatives of the underwriters expect to consider a number of factors including:
| • | the information set forth in this prospectus and otherwise available to the representatives; |
152
Table of Contents
Index to Financial Statements
| • | our prospects and the history and prospects for the industry in which we compete; |
| • | an assessment of our management; |
| • | our prospects for future earnings; |
| • | the general condition of the securities markets at the time of this offering; |
| • | the recent market prices of, and demand for, publicly traded common stock of generally comparable companies; and |
| • | other factors deemed relevant by the underwriters and us. |
Neither we nor the underwriters can assure investors that an active trading market will develop for our common stock, or that the shares will trade in the public market at or above the initial public offering price.
Other than in the United States, no action has been taken by us or the underwriters that would permit a public offering of the securities offered by this prospectus in any jurisdiction where action for that purpose is required. The securities offered by this prospectus may not be offered or sold, directly or indirectly, nor may this prospectus or any other offering material or advertisements in connection with the offer and sale of any such securities be distributed or published in any jurisdiction, except under circumstances that will result in compliance with the applicable rules and regulations of that jurisdiction. Persons into whose possession this prospectus comes are advised to inform themselves about and to observe any restrictions relating to the offering and the distribution of this prospectus. This prospectus does not constitute an offer to sell or a solicitation of an offer to buy any securities offered by this prospectus in any jurisdiction in which such an offer or a solicitation is unlawful.
This document is only being distributed to and is only directed at (i) persons who are outside the United Kingdom or (ii) to investment professionals falling within Article 19(5) of the Financial Services and Markets Act 2000 (Financial Promotion) Order 2005 (the “Order”) or (iii) high net worth entities, and other persons to whom it may lawfully be communicated, falling with Article 49(2)(a) to (d) of the Order (all such persons together being referred to as “relevant persons”). The securities are only available to, and any invitation, offer or agreement to subscribe, purchase or otherwise acquire such securities will be engaged in only with, relevant persons. Any person who is not a relevant person should not act or rely on this document or any of its contents.
In relation to each Member State of the European Economic Area that has implemented the Prospectus Directive (each, a “Relevant Member State”), from and including the date on which the European Union Prospectus Directive (the “EU Prospectus Directive”) is implemented in that Relevant Member State (the “Relevant Implementation Date”), an offer of securities described in this prospectus may not be made to the public in that Relevant Member State prior to the publication of a prospectus in relation to the shares that has been approved by the competent authority in that Relevant Member State or, where appropriate, approved in another Relevant Member State and notified to the competent authority in that Relevant Member State, all in accordance with the EU Prospectus Directive, except that it may, with effect from and including the Relevant Implementation Date, make an offer of shares to the public in that Relevant Member State at any time:
| • | to legal entities that are authorized or regulated to operate in the financial markets or, if not so authorized or regulated, whose corporate purpose is solely to invest in securities; |
| • | to any legal entity that has two or more of (1) an average of at least 250 employees during the last financial year; (2) a total balance sheet of more than €43,000,000 and (3) an annual net turnover of more than €50,000,000, as shown in its last annual or consolidated accounts; |
| • | to fewer than 100 natural or legal persons (other than qualified investors as defined in the EU Prospectus Directive) subject to obtaining the prior consent of the book-running managers for any such offer; or |
153
Table of Contents
Index to Financial Statements
| • | in any other circumstances that do not require the publication by the issuer of a prospectus pursuant to Article 3 of the Prospectus Directive. |
For the purposes of this provision, the expression an “offer of securities to the public” in relation to any securities in any Relevant Member State means the communication in any form and by any means of sufficient information on the terms of the offer and the securities to be offered so as to enable an investor to decide to purchase or subscribe for the securities, as the same may be varied in that Member State by any measure implementing the EU Prospectus Directive in that Relevant Member State and the expression EU Prospectus Directive means Directive 2003/71/EC and includes any relevant implementing measure in each Relevant Member State.
The shares may not be offered or sold by means of any document other than (i) in circumstances which do not constitute an offer to the public within the meaning of the Companies Ordinance (Cap.32, Laws of Hong Kong), or (ii) to “professional investors” within the meaning of the Securities and Futures Ordinance (Cap.571, Laws of Hong Kong) and any rules made thereunder, or (iii) in other circumstances which do not result in the document being a “prospectus” within the meaning of the Companies Ordinance (Cap.32, Laws of Hong Kong), and no advertisement, invitation or document relating to the shares may be issued or may be in the possession of any person for the purpose of issue (in each case whether in Hong Kong or elsewhere), which is directed at, or the contents of which are likely to be accessed or read by, the public in Hong Kong (except if permitted to do so under the laws of Hong Kong) other than with respect to shares which are or are intended to be disposed of only to persons outside Hong Kong or only to “professional investors” within the meaning of the Securities and Futures Ordinance (Cap. 571, Laws of Hong Kong) and any rules made thereunder.
This prospectus has not been registered as a prospectus with the Monetary Authority of Singapore. Accordingly, this prospectus and any other document or material in connection with the offer or sale, or invitation for subscription or purchase, of the shares may not be circulated or distributed, nor may the shares be offered or sold, or be made the subject of an invitation for subscription or purchase, whether directly or indirectly, to persons in Singapore other than (i) to an institutional investor under Section 274 of the Securities and Futures Act, Chapter 289 of Singapore (the “SFA”), (ii) to a relevant person, or any person pursuant to Section 275(1A), and in accordance with the conditions, specified in Section 275 of the SFA or (iii) otherwise pursuant to, and in accordance with the conditions of, any other applicable provision of the SFA.
Where the shares are subscribed or purchased under Section 275 by a relevant person which is: (a) a corporation (which is not an accredited investor) the sole business of which is to hold investments and the entire share capital of which is owned by one or more individuals, each of whom is an accredited investor; or (b) a trust (where the trustee is not an accredited investor) whose sole purpose is to hold investments and each beneficiary is an accredited investor, shares, debentures and units of shares and debentures of that corporation or the beneficiaries’ rights and interest in that trust shall not be transferable for 6 months after that corporation or that trust has acquired the shares under Section 275 except: (1) to an institutional investor under Section 274 of the SFA or to a relevant person, or any person pursuant to Section 275(1A), and in accordance with the conditions, specified in Section 275 of the SFA; (2) where no consideration is given for the transfer; or (3) by operation of law.
The securities have not been and will not be registered under the Financial Instruments and Exchange Law of Japan (the Financial Instruments and Exchange Law) and each underwriter has agreed that it will not offer or sell any securities, directly or indirectly, in Japan or to, or for the benefit of, any resident of Japan (which term as used herein means any person resident in Japan, including any corporation or other entity organized under the laws of Japan), or to others for re-offering or resale, directly or indirectly, in Japan or to a resident of Japan, except pursuant to an exemption from the registration requirements of, and otherwise in compliance with, the Financial Instruments and Exchange Law and any other applicable laws, regulations and ministerial guidelines of Japan.
154
Table of Contents
Index to Financial Statements
The underwriters and their respective affiliates are full service financial institutions engaged in various activities, which may include securities trading, commercial and investment banking, financial advisory, investment management, principal investment, hedging, financing and brokerage activities. Certain of the underwriters and their affiliates have provided in the past to us and our affiliates and may provide from time to time in the future certain commercial banking, financial advisory, investment banking and other services to us and those affiliates in the ordinary course of their business, for which they have received and may continue to receive customary fees and commissions. In particular, J.P. Morgan Securities LLC is the lead arranger and sole bookrunner under our 2005 Credit Facility and an affiliate of J.P. Morgan Securities LLC is the administrative agent, collateral agent and a lender under our 2005 Credit Facility. In addition, certain of the underwriters or their affiliates may be lenders under the 2005 Credit Facility and affiliates of J.P. Morgan Securities LLC, Goldman, Sachs & Co., Barclays Capital Inc., Morgan Stanley & Co. Incorporated, PNC Capital Markets LLC, Raymond James & Associates, Inc. and Wells Fargo Securities, LLC have provided commitments for an additional tranche of revolving loans under the 2005 Credit Facility. In addition, from time to time, certain of the underwriters and their affiliates may effect transactions for their own account or the accounts of customers, and hold on behalf of themselves or their customers, long or short positions in our debt or equity securities or loans, and may do so in the future. In the ordinary course of their various business activities, the underwriters and their respective affiliates may make or hold a broad array of investments and actively trade debt and equity securities (or related derivative securities) and financial instruments (including bank loans) for their own account and for the accounts of their customers and may at any time hold long and short positions in such securities and instruments. Such investment and securities activities may involve securities and instruments of the issuer.
155
Table of Contents
Index to Financial Statements
The validity of the shares of common stock offered by this prospectus will be passed upon for us by our counsel, King & Spalding LLP. The underwriters have been represented in connection with this offering by Cravath, Swaine & Moore LLP, New York, New York.
The consolidated financial statements of FleetCor Technologies, Inc. and subsidiaries at December 31, 2009 and 2008, and for each of the three years in the period ended December 31, 2009, appearing in this Prospectus and Registration Statement have been audited by Ernst & Young LLP, independent registered public accounting firm, as set forth in their report thereon appearing elsewhere herein, and are included in reliance upon such report given on the authority of such firm as experts in accounting and auditing.
The consolidated financial statements of CLC Group, Inc. and subsidiaries as of and for the year ended December 31, 2008 have been included herein and in the registration statement in reliance upon the report of KPMG LLP, an independent auditor, appearing elsewhere herein, and upon the authority of such firm as experts in accounting and auditing.
Where you can find more information
We have filed with the SEC a registration statement on Form S-1, including exhibits and schedules, under the Securities Act of 1933, as amended with respect to the shares of our common stock to be sold in this offering. This prospectus does not contain all of the information set forth in the registration statement and exhibits and schedules to the registration statement. For further information with respect to our Company and the shares of common stock to be sold in this offering, reference is made to the registration statement, including the exhibits and schedules to the registration statement. Statements contained in this prospectus as to the contents of any contract is an exhibit to the registration statement, each statement is qualified in all respects by the exhibit to which the reference relates.
In addition, as a result of this offering, we will become subject to the information and periodic reporting requirements of the Securities Exchange Act of 1934, as amended, and will file annual, quarterly and current reports and other information with the SEC. Our SEC filings, including the registration statement on Form S-1 and all filed exhibits and schedules thereto, are available to the public on the SEC’s website at http://www.sec.gov. To receive copies of public records not posted to the SEC’s web site at prescribed rates, you may complete an online form at http://www.sec.gov, send a fax to (202) 772-9337 or submit a written request to the SEC, Office of FOIA/PA Operations, 100 F Street, N.E., Washington, D.C. 20549. Please call the SEC at 1-800-SEC-0330 for further information.
156
Table of Contents
Index to Financial Statements
F-1
Table of Contents
Index to Financial Statements
Report of independent registered public accounting firm
The Board of Directors and Stockholders of FleetCor Technologies, Inc. and Subsidiaries
We have audited the accompanying consolidated balance sheets of FleetCor Technologies, Inc. and subsidiaries as of December 31, 2009 and 2008, and the related consolidated statements of income, stockholders’ equity and comprehensive income (loss), and cash flows for each of the three years in the period ended December 31, 2009. These financial statements are the responsibility of the Company’s management. Our responsibility is to express an opinion on these financial statements based on our audits.
We conducted our audits in accordance with the standards of the Public Company Accounting Oversight Board (United States). Those standards require that we plan and perform the audit to obtain reasonable assurance about whether the consolidated financial statements are free of material misstatement. We were not engaged to perform an audit of the Company’s internal control over financial reporting. Our audits included consideration of internal control over financial reporting as a basis for designing audit procedures that are appropriate in the circumstances, but not for the purpose of expressing an opinion on the effectiveness of the Company’s internal control over financial reporting. Accordingly, we express no such opinion. An audit also includes examining, on a test basis, evidence supporting the amounts and disclosures in the financial statements, assessing the accounting principles used and significant estimates made by management, and evaluating the overall financial statement presentation. We believe that our audits provide a reasonable basis for our opinion.
In our opinion, the financial statements referred to above present fairly, in all material respects, the consolidated financial position of FleetCor Technologies, Inc. and subsidiaries at December 31, 2009 and 2008, and the consolidated results of their operations and their cash flows for each of the three years in the period ended December 31, 2009, in conformity with U.S. generally accepted accounting principles.
As discussed in Note 2 to the consolidated financial statements, in 2009 the Company retrospectively adopted Financial Accounting Standard Board Interpretation No. 48, Accounting for Uncertainty in Income Taxes (codified in FASB Accounting Standards Codification ASC 740, Income Taxes).
| /s/ Ernst & Young LLP | ||||
| Atlanta, Georgia |
||||
| April 15, 2010, except | ||||
| Note 18 as to | ||||
| which the date | ||||
| is November 29, 2010 | ||||
F-2
Table of Contents
Index to Financial Statements
FleetCor Technologies, Inc. and subsidiaries
Consolidated balance sheets
| December 31 | ||||||||
| (In thousands, except share and par value amounts) | 2008 | 2009 | ||||||
| Assets |
||||||||
| Current assets: |
||||||||
| Cash and cash equivalents |
$ | 70,355 | $ | 84,701 | ||||
| Restricted cash |
71,222 | 67,979 | ||||||
| Accounts receivable (less allowance for doubtful accounts of $10,407 and $14,764, respectively) |
158,007 | 163,461 | ||||||
| Prepaid expenses and other current assets |
30,589 | 24,113 | ||||||
| Deferred income taxes |
7,917 | 6,988 | ||||||
| Total current assets |
338,090 | 347,242 | ||||||
| Property and equipment |
60,147 | 72,091 | ||||||
| Less accumulated depreciation and amortization |
(40,106 | ) | (44,868 | ) | ||||
| Net property and equipment |
20,041 | 27,223 | ||||||
| Goodwill |
407,437 | 590,336 | ||||||
| Other intangibles, net |
111,522 | 197,430 | ||||||
| Other assets |
51,972 | 47,314 | ||||||
| Total assets |
$ | 929,062 | $ | 1,209,545 | ||||
| Liabilities and stockholders’ equity |
||||||||
| Current liabilities: |
||||||||
| Accounts payable |
$ | 131,092 | $ | 175,578 | ||||
| Accrued expenses |
35,219 | 46,746 | ||||||
| Customer deposits |
78,183 | 75,796 | ||||||
| Current portion of notes payable and other obligations |
10,563 | 22,621 | ||||||
| Total current liabilities |
255,057 | 320,741 | ||||||
| Notes payable and other obligations, less current portion |
360,184 | 328,930 | ||||||
| Deferred income taxes |
40,557 | 85,825 | ||||||
| Total noncurrent liabilities |
400,741 | 414,755 | ||||||
| Commitments and contingencies |
||||||||
| Stockholders’ equity: |
||||||||
| Convertible preferred stock, $.001 par value; 1,919,135 shares authorized and issued and 1,668,449 shares outstanding for Series D-1 at 2008 and 2009; 230,769 shares authorized and issued and 201,923 shares outstanding for Series D-2 at 2008 and 2009; 3,995,413 shares authorized, issued and outstanding for Series D-3 at 2008 and 2009; 8,164,281 shares authorized, issued and outstanding for Series D-4 at 2008 and 2009; 3,400,000 shares authorized, issued and outstanding for Series E at 2009; and 1,000,000 shares authorized for blank check preferred stock and none issued at 2008 and 2009 (aggregate liquidation preference of $235,702 and $400,634, respectively) |
212,864 | 330,654 | ||||||
| Common stock, $.001 par value; 130,000,000 shares authorized, 65,892,313 shares issued 130,000,000 shares authorized, 65,332,533 shares issued and 33,465,393 shares outstanding at 2008 and 34,125,163 shares outstanding at 2009 |
65 | 66 | ||||||
| Additional paid-in capital |
92,564 | 94,996 | ||||||
| Retained earnings |
162,464 | 235,726 | ||||||
| Accumulated other comprehensive loss |
(19,278 | ) | (12,173 | ) | ||||
| Less treasury stock (31,867,140 shares at 2008 and 2009, respectively) |
(175,220 | ) | (175,220 | ) | ||||
| Less notes issued for purchase of shares of preferred stock |
(195 | ) | — | |||||
| Total stockholders’ equity |
273,264 | 474,049 | ||||||
| Total liabilities and stockholders’ equity |
$ | 929,062 | $ | 1,209,545 | ||||
See accompanying notes.
F-3
Table of Contents
Index to Financial Statements
FleetCor Technologies, Inc. and subsidiaries
Consolidated statements of income
| Year ended December 31 | ||||||||||||
| (In thousands, except share data) | 2007 | 2008 | 2009 | |||||||||
| Revenues, net |
$ | 264,086 | $ | 341,053 | $ | 354,073 | ||||||
| Expenses: |
||||||||||||
| Merchant commissions |
39,358 | 38,539 | 39,709 | |||||||||
| Processing |
34,060 | 51,406 | 57,997 | |||||||||
| Selling |
22,625 | 23,778 | 30,579 | |||||||||
| General and administrative |
41,986 | 47,635 | 51,375 | |||||||||
| 126,057 | 179,695 | 174,413 | ||||||||||
| Depreciation and amortization |
20,293 | 27,240 | 28,368 | |||||||||
| Operating income |
105,764 | 152,455 | 146,045 | |||||||||
| Other income, net |
(1,554 | ) | (2,488 | ) | (933 | ) | ||||||
| Interest expense, net |
19,735 | 20,256 | 17,363 | |||||||||
| Total other expense |
18,181 | 17,768 | 16,430 | |||||||||
| Income before income taxes |
87,583 | 134,687 | 129,615 | |||||||||
| Provision for income taxes |
25,998 | 37,405 | 40,563 | |||||||||
| Net income |
61,585 | 97,282 | 89,052 | |||||||||
| Calculation of income attributable to common shareholders: |
||||||||||||
| Convertible preferred stock accrued dividends |
(10,810 | ) | (11,357 | ) | (15,789 | ) | ||||||
| Income attributable to common shareholders for basic earnings per share |
$ | 50,775 | $ | 85,925 | $ | 73,263 | ||||||
| Earnings per share: |
||||||||||||
| Basic earnings per share |
$ | 1.59 | $ | 2.60 | $ | 2.17 | ||||||
| Diluted earnings per share |
$ | .86 | $ | 1.35 | $ | 1.13 | ||||||
| Weighted average shares outstanding: |
||||||||||||
| Basic weighted average shares outstanding |
31,885 | 33,033 | 33,802 | |||||||||
| Diluted weighted average shares outstanding |
71,720 | 71,913 | 78,854 | |||||||||
See accompanying notes.
F-4
Table of Contents
Index to Financial Statements
FleetCor Technologies, Inc. and subsidiaries
Consolidated statements of stockholders’ equity and comprehensive income (loss)
| (In thousands, except for share data) | Preferred stock |
Common stock |
Additional paid-in capital |
Retained earnings |
Treasury stock |
Notes for preferred stock |
Accumulated other comprehensive income (loss) |
Total | ||||||||||||||||||||||||||||
| Balance at December 31, 2006 |
$ | 195,084 | $ | 63 | $ | 78,874 | $ | 26,278 | $ | (142,005 | ) | $ | (207 | ) | $ | 394 | $ | 158,482 | ||||||||||||||||||
| Net income |
— | — | — | 61,585 | — | — | — | 61,585 | ||||||||||||||||||||||||||||
| Cumulative effect of adoption of provisions related to uncertain tax positions |
— | — | — | (780 | ) | — | — | — | (780 | ) | ||||||||||||||||||||||||||
| Fair value of interest rate swaps, net of tax of $1,053 |
— | — | — | — | — | — | (1,718 | ) | (1,718 | ) | ||||||||||||||||||||||||||
| Other comprehensive income from currency exchange, net of tax of $— |
— | — | — | — | — | — | 1,710 | 1,710 | ||||||||||||||||||||||||||||
| Total comprehensive income |
60,797 | |||||||||||||||||||||||||||||||||||
| Repurchase of 2,141,155 shares of common stock and 626,715 shares of preferred stock |
(4,121 | ) | — | 7,835 | — | (33,215 | ) | — | — | (29,501 | ) | |||||||||||||||||||||||||
| Payment of note for preferred stock |
— | — | — | — | 12 | — | 12 | |||||||||||||||||||||||||||||
| Issuance of restricted stock |
— | — | 220 | — | — | — | — | 220 | ||||||||||||||||||||||||||||
| Issuance of common stock |
— | 1 | 1,218 | — | — | — | — | 1,219 | ||||||||||||||||||||||||||||
| Accretion of convertible preferred stock |
10,517 | — | — | (10,517 | ) | — | — | — | — | |||||||||||||||||||||||||||
| Balance at December 31, 2007 |
201,480 | 64 | 88,147 | 76,566 | (175,220 | ) | (195 | ) | 386 | 191,229 | ||||||||||||||||||||||||||
| Net income |
— | — | — | 97,282 | — | — | — | 97,282 | ||||||||||||||||||||||||||||
| Fair value of interest rate swaps, net of tax of $3,047 |
— | — | — | — | — | — | (4,969 | ) | (4,969 | ) | ||||||||||||||||||||||||||
| Other comprehensive income from currency exchange, net of tax of $— |
— | — | — | — | — | — | (14,695 | ) | (14,695 | ) | ||||||||||||||||||||||||||
| Total comprehensive income |
77,618 | |||||||||||||||||||||||||||||||||||
| Issuance of restricted stock |
— | — | 1 | — | — | — | — | 1 | ||||||||||||||||||||||||||||
| Issuance of common stock |
— | 1 | 4,415 | — | — | — | — | 4,416 | ||||||||||||||||||||||||||||
| Accretion of convertible preferred stock |
11,384 | — | — | (11,384 | ) | — | — | — | — | |||||||||||||||||||||||||||
| Balance at December 31, 2008 |
212,864 | 65 | 92,564 | 162,464 | (175,220 | ) | (195 | ) | (19,278 | ) | 273,264 | |||||||||||||||||||||||||
| Net income |
— | — | — | 89,052 | — | — | — | 89,052 | ||||||||||||||||||||||||||||
| Fair value of interest rate swaps, net of tax of $(1,674) |
— | — | — | — | — | — | 2,731 | 2,731 | ||||||||||||||||||||||||||||
| Other comprehensive income from currency exchange, net of tax of $500 |
— | — | — | — | — | — | 4,374 | 4,374 | ||||||||||||||||||||||||||||
| Total comprehensive income |
96,157 | |||||||||||||||||||||||||||||||||||
| Payment of note for preferred stock |
— | — | — | — | — | 195 | — | 195 | ||||||||||||||||||||||||||||
| Issuance of common stock |
— | 1 | 2,930 | — | — | — | — | 2,931 | ||||||||||||||||||||||||||||
| Issuance of preferred stock |
102,000 | — | — | — | — | — | — | 102,000 | ||||||||||||||||||||||||||||
| Preferred stock issuance costs |
— | — | (498 | ) | — | — | — | — | (498 | ) | ||||||||||||||||||||||||||
| Accretion of convertible preferred stock |
15,790 | — | — | (15,790 | ) | — | — | — | — | |||||||||||||||||||||||||||
| Balance at December 31, 2009 |
$ | 330,654 | $ | 66 | $ | 94,996 | $ | 235,726 | $ | (175,220 | ) | $ | — | $ | (12,173 | ) | $ | 474,049 | ||||||||||||||||||
See accompanying notes.
F-5
Table of Contents
Index to Financial Statements
FleetCor Technologies, Inc. and subsidiaries
Consolidated statements of cash flows
| Year ended December 31 | ||||||||||||
| (In thousands) | 2007 | 2008 | 2009 | |||||||||
| Operating activities |
||||||||||||
| Net income |
$ | 61,585 | $ | 97,282 | $ | 89,052 | ||||||
| Adjustments to reconcile net income to net cash provided by operating activities: |
||||||||||||
| Depreciation |
7,870 | 8,608 | 9,648 | |||||||||
| Stock-based compensation |
1,165 | 2,758 | 2,666 | |||||||||
| Provision for losses on accounts receivable |
15,380 | 34,924 | 32,993 | |||||||||
| Amortization of deferred financing costs |
895 | 1,123 | 1,842 | |||||||||
| Amortization of intangible assets |
9,825 | 12,038 | 13,900 | |||||||||
| Amortization of premium on receivables |
1,702 | 5,471 | 3,257 | |||||||||
| Deferred income taxes |
3,356 | 8,728 | 4,395 | |||||||||
| Changes in operating assets and liabilities (net of acquisitions): |
||||||||||||
| Restricted cash |
(12,781 | ) | 5,575 | 3,243 | ||||||||
| Accounts receivable |
(79,319 | ) | (9,372 | ) | 1,945 | |||||||
| Prepaid expenses and other current assets |
(4,563 | ) | (13,317 | ) | 11,002 | |||||||
| Other assets |
(3,823 | ) | (7,555 | ) | (370 | ) | ||||||
| Accounts payable, accrued expenses and income taxes |
59,559 | (87,154 | ) | 4,367 | ||||||||
| Deferred revenue |
(4,902 | ) | (124 | ) | 850 | |||||||
| Net cash provided by operating activities |
55,949 | 58,985 | 178,790 | |||||||||
| Investing activities |
||||||||||||
| Acquisitions, net of cash acquired |
(33,704 | ) | (55,924 | ) | (231,097 | ) | ||||||
| Purchases of property and equipment |
(7,101 | ) | (7,088 | ) | (9,677 | ) | ||||||
| Net cash used in investing activities |
(40,805 | ) | (63,012 | ) | (240,774 | ) | ||||||
| Financing activities |
||||||||||||
| Repurchase of common stock |
(24,255 | ) | — | — | ||||||||
| Repurchase of preferred stock |
(7,521 | ) | — | — | ||||||||
| Premium paid on repurchase of receivables |
(14,314 | ) | — | — | ||||||||
| Proceeds from notes payable |
89,825 | 50,000 | — | |||||||||
| Proceeds from issuance of common stock |
257 | 763 | 266 | |||||||||
| Proceeds from the issuance of preferred stock, net |
— | — | 93,696 | |||||||||
| Deferred financing costs |
(2,963 | ) | (1,715 | ) | — | |||||||
| Principal payments on notes payable |
(10,092 | ) | (34,720 | ) | (21,658 | ) | ||||||
| Principal payments on capital leases |
(38 | ) | (293 | ) | (66 | ) | ||||||
| Net cash provided by financing activities |
30,899 | 14,035 | 72,238 | |||||||||
| Effect of foreign currency exchange rates on cash |
4,630 | (8,517 | ) | 4,092 | ||||||||
| Net increase in cash |
50,673 | 1,491 | 14,346 | |||||||||
| Cash and cash equivalents at beginning of year |
18,191 | 68,864 | 70,355 | |||||||||
| Cash and cash equivalents at end of year |
$ | 68,864 | $ | 70,355 | $ | 84,701 | ||||||
| Supplemental cash flow information |
||||||||||||
| Cash paid for interest |
$ | 20,224 | $ | 37,474 | $ | 22,242 | ||||||
| Cash paid for income taxes |
$ | 17,906 | $ | 38,756 | $ | 28,094 | ||||||
| Non-cash investing activity |
||||||||||||
| Non-cash issuance of preferred stock |
$ | — | $ | — | $ | 8,000 | ||||||
See accompanying notes.
F-6
Table of Contents
Index to Financial Statements
FleetCor Technologies, Inc. and subsidiaries
Notes to consolidated financial statements
1. Description of business
FleetCor Technologies Inc. and its subsidiaries (the Company) are a leading independent global providers of specialized payment products and services to commercial fleets, major oil companies, lodging clients, and petroleum marketers. The Company serves more than 530,000 commercial accounts in 18 countries in North America, Europe, Africa and Asia. The Company provides payment products and services in a variety of combinations to create customized payment solutions for customers. The Company sells its products and services directly and indirectly through major oil companies and petroleum marketers with whom it has strategic relationships. The Company provides customers with various card products that function like a charge card to purchase fuel, lodging and related products and services at participating locations. The Company’s payment programs enable businesses to better manage and control employee spending and provide card-accepting merchants with a high volume customer base that can increase their sales and customer loyalty. To support the payment products, the Company also provides a range of services, such as issuing and processing, as well as specialized information services that provide customers with value-added functionality and data. Customers can use this data to track important business productivity metrics, combat fraud and employee misuse, streamline expense administration and lower overall operating costs. The Company’s reporting segments, North America and International, reflect the Company’s global organization. Within its segments, services are provided to commercial fleets, major oil companies, and petroleum marketers. The Company also provides lodging and transportation management services in North America.
2. Summary of significant accounting policies
Revenue recognition and presentation
Revenue is derived from the Company’s merchant and network relationships as well as from customers and partners. The Company recognizes revenue on fees generated through services to commercial fleets, major oil companies and petroleum marketers and is recorded revenue net of the wholesale cost of the underlying products and services based on the following: (i) the Company is not the primary obligor in the fuel arrangement and is not responsible for fulfillment and the acceptability of the product; (ii) the Company has no inventory risk, does not bear the risk of product loss and does not make any changes to the fuel or have any involvement in the product specifications; (iii) the Company does not have significant latitude with respect to establishing the price for fuel and (iv) the amount the Company earns for its services is fixed.
Through the Company’s merchant and network relationships the Company provides fuel, vehicle maintenance or lodging services to its customers. The Company derives its revenue from the Company’s merchant and network relationships based on the difference between the price charged to a customer for a transaction and the price paid to the merchant or network for the same transaction. The Company’s net revenue consists of margin on fuel sales and fees for technical support, processing, communications and reporting. The price paid to a merchant or network may be calculated as (i) the merchant’s wholesale cost of fuel plus a markup; (ii) the transaction purchase price less a percentage discount; or (iii) the transaction purchase price less a fixed fee per unit. The difference between the price the Company pays to a merchant and the merchant’s wholesale cost for the underlying products and services is considered a merchant commission and is recognized as expense when the transaction is executed. The Company recognizes revenue from merchant and network relationships when persuasive evidence of an arrangement exists, the services have been provided to the customer, the sales price is fixed or determinable and collectibility is reasonably assured. The Company has entered into agreements with major oil companies and petroleum marketers that specify that a transaction is deemed to be captured when the
F-7
Table of Contents
Index to Financial Statements
FleetCor Technologies, Inc. and subsidiaries
Notes to consolidated financial statements (continued)
2. Summary of significant accounting policies (continued)
Revenue recognition and presentation (continued)
Company has validated that the transaction has no errors and have accepted and posted the data to the Company’s records. Revenue is recognized on lodging and transportation management services when the lodging stay or transportation service is completed.
The Company also derives revenue from customers and partners from a variety of program fees including transaction fees, card fees, network fees, report fees and other transaction-based fees which typically are calculated based on measures such as percentage of dollar volume processed, number of transactions processed, or some combination thereof. Such services are provided through proprietary networks or through the use of third-party networks. Transaction fees and other transaction-based fees generated from our proprietary networks and third-party networks are recognized at the time the transaction is captured. Card fees, network fees and program fees are recognized as the Company fulfills its contractual service obligations. In addition, the Company recognizes revenue from late fees and finance charges. Such fees are recognized net of a provision for estimated uncollectible amounts, at the time the fees and finance charges are assessed.
Use of estimates
The preparation of consolidated financial statements in conformity with accounting principles generally accepted in the United States requires management to make estimates and assumptions that affect the reported amounts of assets and liabilities and disclosure of contingent assets and liabilities at the date of the consolidated financial statements and the reported amounts of revenues and expenses during the reporting period. Actual results could differ from those estimates.
Principles of consolidation
The Company prepared the Consolidated Financial Statements following U.S. generally accepted accounting principles (GAAP). The financial statements include all normal and recurring adjustments that are necessary for a fair presentation of financial position and operating results.
The accompanying consolidated financial statements include the accounts of FleetCor Technologies, Inc. and its wholly owned subsidiaries. All significant intercompany balances and transactions have been eliminated.
Credit risk and reserve for losses on receivables
The Company controls credit risk by performing periodic credit evaluations of its customers. Payments from customers are generally due within 30 days of billing. The Company routinely reviews its accounts receivable balances and makes provisions for probable doubtful accounts based primarily on the aging of those balances. Accounts receivable are deemed uncollectible and removed from accounts receivable and the allowance for doubtful accounts when internal collection efforts have been exhausted and accounts have been turned over to a third-party collection agency.
Fair value measurements
The Company’s financial instruments include cash and cash equivalents, accounts receivable, accounts payable, derivative instruments, notes payable and short and long-term debt. The carrying values for current financial
F-8
Table of Contents
Index to Financial Statements
FleetCor Technologies, Inc. and subsidiaries
Notes to consolidated financial statements (continued)
2. Summary of significant accounting policies (continued)
Fair value measurements (continued)
assets and liabilities, including cash and cash equivalents, accounts receivable and accounts payable, approximate their fair values due to the short maturity of such instruments. The fair values of the Company’s derivative instruments are recorded in the Consolidated Balance Sheets and are disclosed in Note 3. The fair values of certain of the Company’s short and long-term debt approximates their carrying values as they bear interest at varying rates.
Business combinations
Business combinations completed by the Company have been accounted for under the purchase method of accounting. The cost of each acquired business is allocated to the assets acquired and liabilities assumed based on their estimated fair values.
These estimates are revised during an allocation period as necessary when, and if, information becomes available to further define and quantify the value of the assets acquired and liabilities assumed. The allocation period does not exceed one year from the date of the acquisition. To the extent additional information to refine the original allocation becomes available during the allocation period, the allocation of the purchase price is adjusted. Should information become available after the allocation period, those items are included in operating results. The direct costs of the acquisition are recorded as operating expenses in 2009. Prior to 2009, the costs of an enterprise acquired in a business combination included the direct cost of the acquisition. Some of the 2008 and earlier acquisitions include additional contingent consideration related to future earnouts based on the growth of the market. When the contingencies are resolved and additional consideration is distributable, the Company will record the consideration issued as additional cost of the acquired company, or goodwill. The operating results of entities acquired are included in the Consolidated Statements of Income from the completion date of the applicable transaction. Goodwill represents the excess of the purchase price over the fair value of the tangible and intangible assets acquired and any liabilities assumed.
Impairment of long-lived assets and intangibles
The Company tests its other long-lived assets for impairment in accordance with relevant authoritative guidance. The Company evaluates if impairment indicators related to its property, plant and equipment and other long-lived assets are present. These impairment indicators may include a significant decrease in the market price of a long-lived asset or asset group, a significant adverse change in the extent or manner in which a long-lived asset or asset group is being used or in its physical condition, or a current-period operating or cash flow loss combined with a history of operating or cash flow losses or a forecast that demonstrates continuing losses associated with the use of a long-lived asset or asset group. If impairment indicators are present, the Company estimates the future cash flows for the asset or group of assets. The sum of the undiscounted future cash flows attributable to the asset or group of assets is compared to its carrying amount. The cash flows are estimated utilizing various projections of revenues and expenses, working capital and proceeds from asset disposals on a basis consistent with the strategic plan. If the carrying amount exceeds the sum of the undiscounted future cash flows, the Company determines the assets’ fair value by discounting the future cash flows using a discount rate required for a similar investment of like risk and records an impairment charge as the difference between the fair value and
F-9
Table of Contents
Index to Financial Statements
FleetCor Technologies, Inc. and subsidiaries
Notes to consolidated financial statements (continued)
2. Summary of significant accounting policies (continued)
Impairment of long-lived assets and intangibles (continued)
the carrying value of the asset group. Generally, the Company performs its testing of the asset group at the business-line level, as this is the lowest level for which identifiable cash flows are available.
The Company evaluates goodwill for impairment annually in the fourth quarter at the reporting unit level, which is one level below the operating segment level. The Company also tests for impairment if events and circumstances indicate that it is more likely than not that the fair value of a reporting unit is below its carrying amount. If the carrying amount of the reporting unit is greater than the fair value, impairment may be present. The Company assesses the fair value of each reporting unit for its goodwill impairment test based on an earnings multiple or an actual sales offer received from a prospective buyer, if available. Estimates critical to the Company’s fair value estimates using earnings multiples include the projected financial performance of the reporting unit and the applicable earnings multiple.
The Company measures the amount of any goodwill impairment based upon the estimated fair value of the underlying assets and liabilities of the reporting unit, including any unrecognized intangible assets, and estimates the implied fair value of goodwill. An impairment charge would be recognized to the extent the recorded goodwill exceeds the implied fair value of goodwill.
The Company also evaluates indefinite-lived intangible assets (primarily trademarks and trade names) for impairment annually. The Company also tests for impairment if events and circumstances indicate that it is more likely than not that the fair value of an indefinite-lived intangible asset is below its carrying amount. Estimates critical to the Company’s evaluation of indefinite-lived intangible assets for impairment include the discount rate, royalty rates used in its evaluation of trade names, projected average revenue growth and projected long-term growth rates in the determination of terminal values. An impairment charge is recorded if the carrying amount of an indefinite-lived intangible asset exceeds the estimated fair value on the measurement date.
Property, plant and equipment and definite-lived intangible assets
Property, plant and equipment are stated at cost. Depreciation expense is calculated principally on the straight-line basis. Definite-lived intangible assets, consisting primarily of customer relationships, are stated at fair value. Definite-lived intangible assets are amortized on a straight-line basis. Customer relationship useful lives are estimated using historical customer attrition rates.
Income taxes
The Company accounts for income taxes in accordance with relevant authoritative literature. Income taxes are accounted for under the asset and liability method. Deferred tax assets and liabilities are recognized for the future tax consequences attributable to differences between the financial statement carrying amounts of existing assets and liabilities and their respective tax bases. Deferred tax assets and liabilities are measured using enacted tax rates expected to apply to taxable income in the years in which those temporary differences are expected to be recovered or settled. The effect on deferred tax assets and liabilities of a change in tax rates is recognized in the period that includes the enactment date. The realizability of deferred tax assets must also be assessed.
The ultimate realization of deferred tax assets is dependent upon the generation of future taxable income during the periods in which the associated temporary differences became deductible. A valuation allowance must be established for deferred tax assets which are not believed to more likely than not be realized in the future.
F-10
Table of Contents
Index to Financial Statements
FleetCor Technologies, Inc. and subsidiaries
Notes to consolidated financial statements (continued)
2. Summary of significant accounting policies (continued)
Income taxes (continued)
The Company does not provide deferred taxes for the undistributed earnings of the Company’s foreign subsidiaries that are considered to be indefinitely reinvested outside of the United States in accordance with authoritative literature. The Company includes any estimated interest and penalties on tax related matters in income taxes payable and income tax expense.
The Company retrospectively adopted the provisions of relevant authoritative literature with respect to uncertainty in income taxes as of January 1, 2007. This guidance clarifies the accounting for uncertainty in income taxes recognized in an entity’s financial statements and prescribes threshold and measurement attributes for financial statement disclosure of tax positions taken or expected to be taken on a tax return. Under the relevant authoritative literature, the impact of an uncertain income tax position on the income tax return must be recognized at the largest amount that is more likely than not to be sustained upon audit by the relevant taxing authority. An uncertain income tax position will not be recognized if it has less than a 50 percent likelihood of being sustained.
As a result of adopting the provisions of the authoritative literature regarding uncertain tax positions, the Company recognized a reduction in shareholders’ equity of $779,810 on January 1, 2007 reflecting the cumulative effect of adoption. This adjustment resulted from changes in the amount of tax benefits related to uncertain tax positions and the accrual of potential interest and penalties on those uncertain tax positions. In addition, the Company’s financial statements as of and for the years ended December 31, 2007 and December 31, 2008 have been restated to give effect to the Company’s adoption as of January 1, 2007.
Cash equivalents
Cash equivalents consist of cash on hand and highly liquid investments with maturities of three months or less when purchased. Restricted cash represents customer deposits repayable on demand.
Derivative financial instruments
Derivative financial instruments are generally used to manage certain interest rate risks through the use of interest rate swaps. These instruments, when settled, impact the Company’s cash flows from operations. On the date in which the Company enters into a derivative, the derivative is designated as a hedge of the identified exposure. The Company measures effectiveness of its hedging relationships both at hedge inception and on an ongoing basis.
Gains and losses on interest rate swaps designated as cash flow hedges, to the extent that the hedge relationship has been effective, are deferred in other comprehensive income and recognized in interest expense over the period in which the Company recognizes interest expense on the related debt instrument. Any ineffectiveness on these instruments is immediately recognized in interest expense in the period that the ineffectiveness occurs. No significant ineffectiveness was recorded on designated hedges in the years ended December 31 2009, 2008 and 2007, respectively.
F-11
Table of Contents
Index to Financial Statements
FleetCor Technologies, Inc. and subsidiaries
Notes to consolidated financial statements (continued)
2. Summary of significant accounting policies (continued)
Foreign currency translation
Assets and liabilities of foreign subsidiaries are translated into U.S. dollars at the rates of exchange in effect at period-end. The related translation adjustments are made directly to accumulated other comprehensive income. Income and expenses are translated at the average monthly rates of exchange in effect during the year. Gains and losses from foreign currency transactions of these subsidiaries are included in net income. The company recognized foreign exchange gains for the years ended December 31, 2009, 2008 and 2007 of $0.9 million, $1.4 million and $1.3 million, respectively, which are classified within other income, net in the Consolidated Statements of Income.
Stock-based compensation
The Company accounts for employee stock options and restricted stock in accordance with relevant authoritative literature, which requires companies to recognize compensation cost for stock options and other stock-based awards based on the estimated fair value as measured on the grant date. The Company has selected the Black-Scholes model for estimating the grant date fair value of share-based payments.
Stock-based compensation cost is measured at the grant date based on the value of the award and is recognized as expense over the requisite service period based on the number of awards for which the requisite service is expected to be rendered. For performance-based restricted stock awards, the Company must also make assumptions regarding the likelihood of achieving performance goals. If actual results differ significantly from these estimates, stock-based compensation expense and the Company’s results of operations could be materially affected.
Deferred financing costs
Costs incurred to obtain financing, net of accumulated amortization, are included in other long-term assets and are amortized over the term of the related debt. At December 31, 2009 and 2008, the Company had net deferred financing costs of $4.5 million and $6.3 million, respectively.
Comprehensive income (loss)
Comprehensive income (loss) is defined as the total of net income and all other changes in equity that result from transactions and other economic events of a reporting period other than transactions with owners. The Company discloses comprehensive income (loss) in the Consolidated Statements of Stockholders’ Equity and Comprehensive Income (Loss). The Company’s accumulated other comprehensive income (loss) includes foreign currency translation gains (losses) of $(8.2) million, $(12.6) million and $2.1 million and the unrealized loss on interest rate swaps of $4.0 million, $6.7 million and $1.7 million for the years ended December 31, 2009, 2008 and 2007, respectively.
Accounts receivable
The Company maintains a $500 million revolving trade accounts receivable securitization facility (the Facility). Pursuant to the terms of the Facility, the Company transfers certain of its domestic receivables, on a revolving basis, to FleetCor Funding LLC (Funding) a wholly-owned bankruptcy remote subsidiary. In turn, Funding sells, without recourse, on a revolving basis, up to $500 million of undivided ownership interests in this pool of accounts receivable to a multi-seller, asset-backed commercial paper conduit (Conduit). Funding maintains a
F-12
Table of Contents
Index to Financial Statements
FleetCor Technologies, Inc. and subsidiaries
Notes to consolidated financial statements (continued)
2. Summary of significant accounting policies (continued)
Accounts receivable (continued)
subordinated interest, in the form of over collateralization, in a portion of the receivables sold to the conduit. Purchases by the conduit are financed with the sale of highly-rated commercial paper. On February 25, 2010, the Company extended the term of the Facility to February 24, 2011.
The Company utilizes proceeds from the sale of its accounts receivable as an alternative to other forms of debt, effectively reducing its overall borrowing costs. The Company has agreed to continue servicing the sold receivables for the financial institution at market rates, which approximates the Company’s cost of servicing. The Company retains a residual interest in the accounts receivable sold as a form of credit enhancement. The residual interest’s fair value approximates carrying value due to its short-term nature.
Funding determines the level of funding achieved by the sale of trade accounts receivable, subject to a maximum amount. Funding retains a residual interest in the eligible receivables transferred to the trust, such that amounts payable in respect of such residual interest will be distributed to Funding upon payment in full of all amounts owed by Funding to the financial institutions.
The Company’s accounts receivable includes the following at December 31 (in thousands):
| 2009 | 2008 | |||||||
| Gross domestic retained receivables |
$ | 36,583 | $ | 53,797 | ||||
| Residual interest in eligible receivables sold to the Facility |
33,184 | 28,294 | ||||||
| Gross foreign receivables |
108,458 | 86,323 | ||||||
| Total gross receivables |
178,225 | 168,414 | ||||||
| Less allowance for doubtful accounts |
(14,764 | ) | (10,407 | ) | ||||
| Net accounts receivable |
$ | 163,461 | $ | 158,007 | ||||
Cash flows arising from the residual interest are classified within operating activities.
A rollforward of the Company’s allowance for doubtful accounts related to accounts receivable not included in the Facility for the years ended December 31 is as follows (in thousands):
| 2009 | 2008 | 2007 | ||||||||||
| Allowance for doubtful accounts beginning of year |
$ | 10,407 | $ | 6,180 | $ | 5,327 | ||||||
| Add: |
||||||||||||
| Provision for bad debts |
32,593 | 37,546 | 15,380 | |||||||||
| Less: |
||||||||||||
| Write-offs |
(28,236 | ) | (33,319 | ) | (14,527 | ) | ||||||
| Allowance for doubtful accounts end of year |
$ | 14,764 | $ | 10,407 | $ | 6,180 | ||||||
Receivables sold under the Facility are accounted for as sales in accordance with relevant authoritative literature. Trade accounts receivable sold to the Facility are excluded from accounts receivable in the consolidated financial statements. At December 31, 2009 and 2008, the undivided interest in accounts receivable sold to the conduit was $223.0 million and $173.0 million, respectively.
F-13
Table of Contents
Index to Financial Statements
FleetCor Technologies, Inc. and subsidiaries
Notes to consolidated financial statements (continued)
2. Summary of significant accounting policies (continued)
Accounts receivable (continued)
The Company recognized revenue, which is included in revenues, net in the Consolidated Statements of Income, related to the securitization program for the years ended December 31 as follows (in millions):
| 2009 | 2008 | 2007 | ||||||||||
| Revenue on receivables sold to Funding |
$ | 80.3 | $ | 76.6 | $ | 43.8 | ||||||
| Less: |
||||||||||||
| Provision for bad debts |
(21.9 | ) | (27.4 | ) | (11.3 | ) | ||||||
| Interest expense |
(5.3 | ) | (15.8 | ) | (16.2 | ) | ||||||
| Net revenue on receivables sold to Funding |
$ | 53.1 | $ | 33.4 | $ | 16.3 | ||||||
All foreign receivables are company owned receivables and are not included in the Company’s receivable securitization program.
Purchase of receivables
The Company recorded a premium on the purchase of receivables, which represented the amount paid in excess of the fair value of the receivables at the time of purchase. This premium is included in other long-term assets and is being amortized over its remaining useful life. At December 31, 2009 and 2008 the remaining net premium on the purchase of receivables was $29.5 million and $32.7 million, respectively.
Advertising
The Company expenses advertising costs as incurred. Advertising expense was $9.8 million, $6.4 million and $3.4 million for the years ended December 31, 2009, 2008 and 2007, respectively.
Earnings per share
Basic earnings per share is calculated using the weighted average of common stock and non vested restricted shares outstanding unadjusted for dilution and net income is adjusted for preferred stock accrued dividends to arrive at income attributable to common shareholders.
Diluted earnings per share is calculated using weighted average shares outstanding and contingently issuable shares less weighted average shares recognized during the period. The net outstanding shares have been adjusted for the dilutive effect of shares issuable upon the assumed conversion of the Company’s convertible preferred stock and common stock equivalents, which consist of outstanding stock options, unvested restricted stock units, and warrants for certain periods.
Recent accounting pronouncements
In June 2009, the FASB issued authoritative guidance limiting the circumstances in which a financial asset may be derecognized when the transferor has not transferred the entire financial asset or has continuing involvement with the transferred asset. The concept of a qualifying special-purpose entity, which had previously facilitated sale accounting for certain asset transfers, is removed by this standard. This guidance is effective for the Company on January 1, 2010. As a result of the adoption of such guidance, effective January 1, 2010, the
F-14
Table of Contents
Index to Financial Statements
FleetCor Technologies, Inc. and subsidiaries
Notes to consolidated financial statements (continued)
2. Summary of significant accounting policies (continued)
Recent accounting pronouncements (continued)
Company will consolidate Funding and the securitization of accounts receivable related to Funding will be accounted for as a secured borrowing rather than as a sale. Accordingly, the Consolidated Balance Sheets will include accounts receivable and short-term debt related to the securitization. In addition, subsequent to the adoption, the Company’s Consolidated Statements of Income will no longer include securitization activities in revenue, net. Subsequent to such adoption, the Company will report interest income, provision for bad debts and interest expense associated with the debt securities issued from Funding to the Conduit.
Subsequent events
The Company evaluated all subsequent events through November 29, 2010, the date of issuance of the Company’s financial statements. No significant events occurred subsequent to the balance sheet date but prior to the issuance of the financial statement that would have a material impact on the Consolidated Financial Statements.
3. Fair value measurements
Accounting principles generally accepted in the U.S. define fair value as the price that would be received to sell an asset or transfer a liability in an orderly transaction between market participants.
As such, fair value is a market-based measurement that should be determined based on assumptions that market participants would use in pricing an asset or liability. The authoritative guidance discusses valuation techniques, such as the market approach (comparable market prices), the income approach (present value of future income or cash flow), and the cost approach (cost to replace the service capacity of an asset or replacement cost). These valuation techniques are based upon observable and unobservable inputs. Observable inputs reflect market data obtained from independent sources, while unobservable inputs reflect the Company’s market assumptions.
As the basis for evaluating such inputs, a three-tier value hierarchy prioritizes the inputs used in measuring fair value as follows:
| • | Level 1: Observable inputs such as quoted prices for identical assets or liabilities in active markets. |
| • | Level 2: Observable inputs other than quoted prices that are directly or indirectly observable for the asset or liability, including quoted prices for similar assets or liabilities in active markets; quoted prices for similar or identical assets or liabilities in markets that are not active; and model-derived valuations whose inputs are observable or whose significant value drivers are observable. |
| • | Level 3: Unobservable inputs that reflect the reporting entity’s own assumptions. |
The Company’s financial assets and liabilities adjusted to fair value at least annually are its money market fund investments included in cash and cash equivalents, its residual interest in eligible receivables sold to the Facility included with net accounts receivable, and its derivative instruments, which are primarily included in accrued expenses. As the Company adjusts the value of its investments and derivative instruments to fair value each reporting period, no adjustment to retained earnings resulted from the adoption of the authoritative guidance on fair value in 2008.
The Company determines the fair value of its mutual fund investments based on quoted market prices.
F-15
Table of Contents
Index to Financial Statements
FleetCor Technologies, Inc. and subsidiaries
Notes to consolidated financial statements (continued)
3. Fair value measurements (continued)
Level 2 fair value determinations are derived from directly or indirectly observable (market based) information. Such inputs are the basis for the fair values of the Company’s derivative instruments. The Company generally uses derivatives for hedging purposes pursuant to the relevant authoritative guidance, and the Company’s derivatives are interest rate swaps.
Level 3 fair value determinations are derived from the Company’s estimate of recovery based on historical collection trends. Activity related to level 3 assets is not significant.
The Company determines the fair value of its derivative instruments based on Level 2 inputs in the fair value hierarchy.
The following tables present the Company’s financial assets and liabilities which are measured at fair value on a recurring basis and that are subject to the disclosure requirements of the authoritative guidance as of December 31, 2009 and 2008 (in millions):
| Description | Fair value | Level 1 | Level 2 | Level 3 | ||||||||||||
| December 31, 2009 |
||||||||||||||||
| Assets: |
||||||||||||||||
| Money market fund investments |
$ | 14.7 | $ | 14.7 | $ | — | $ | — | ||||||||
| Residual interest in eligible receivables sold to the Facility |
— | — | — | 33.2 | ||||||||||||
| Total |
$ | 14.7 | $ | 14.7 | $ | — | $ | 33.2 | ||||||||
| Liabilities: |
||||||||||||||||
| Interest rate swaps |
$ | 6.4 | $ | — | $ | 6.4 | $ | — | ||||||||
| Total |
$ | 6.4 | $ | — | $ | 6.4 | $ | — | ||||||||
| December 31, 2008 |
||||||||||||||||
| Assets: |
||||||||||||||||
| Money market fund investments |
$ | 12.3 | $ | 12.3 | $ | — | $ | — | ||||||||
| Residual interest in eligible receivables sold to the Facility |
— | — | — | 28.3 | ||||||||||||
| Total |
$ | 12.3 | $ | 12.3 | $ | — | $ | 28.3 | ||||||||
| Liabilities: |
||||||||||||||||
| Interest rate swaps |
$ | 10.8 | $ | — | $ | 10.8 | $ | — | ||||||||
| Total |
$ | 10.8 | $ | — | $ | 10.8 | $ | — | ||||||||
On January 1, 2009, the Company adopted the provisions of the fair value measurement accounting and disclosure guidance related to nonfinancial assets and liabilities recognized or disclosed at fair value on a nonrecurring basis. The Company’s nonfinancial assets which are measured at fair value on a nonrecurring basis include property, plant and equipment, goodwill and other intangible assets. As necessary, the Company generally uses projected cash flows, discounted as necessary, to estimate the fair values of the assets using key inputs such as management’s projections of cash flows on a held-and-used basis (if applicable), management’s projections of cash flows upon disposition and discount rates. Accordingly, these fair value measurements fall in level 3 of the fair value hierarchy. These assets and certain liabilities are measured at fair value on a nonrecurring basis as part of the Company’s impairment assessments and as circumstances require.
F-16
Table of Contents
Index to Financial Statements
FleetCor Technologies, Inc. and subsidiaries
Notes to consolidated financial statements (continued)
4. Preferred stock transactions
Convertible Preferred Stock consists of the following (proceeds and cumulative dividends in thousands):
| Series | Date of issuance | Gross proceeds |
Net proceeds | Shares issued | Cumulative dividends at December 31, 2009 |
|||||||||||||
| D-1 through D-3 |
June 29, 2005 | $ | — | $ | — | 5,865,785 | $ | 23,453 | ||||||||||
| D-4 |
June 29, 2005 | — | — | 5,769,231 | 18,678 | |||||||||||||
| September 7, 2006 | — | — | 575,854 | 1,368 | ||||||||||||||
| December 19, 2006 | — | — | 1,819,196 | 3,821 | ||||||||||||||
| E |
April 1, 2009 | 102,000 | 94,000 | 3,400,000 | 3,857 | |||||||||||||
| $ | 51,177 | |||||||||||||||||
On June 29, 2005, the Company exchanged, for no proceeds, all outstanding Series A, Series B, and Series C Preferred Stock for Series D Preferred Stock. The Series D and Series E Preferred Stock are convertible on a one-for-one basis into common stock and the stockholders are entitled to receive 2% cumulative preferential dividends, compounded semiannually. The Series D and E Preferred Stock also carry certain voting rights.
Upon any conversion of shares of Series D and Series E Preferred Stock into shares of common stock, all unpaid accrued dividends are forgiven, except with respect to Series D-3 and Series E which could be converted into shares of common stock in a Public Offering. Upon this occurrence, with regard to Series D-3, the Company is obligated to pay three-eighths of all unpaid Series D-3 prior accruing dividends. With regard to Series E, the Company is obligated to convert at the greater of the Series E liquidation value divided by the offering price or $18 divided by the offering price if the public offering price is below a predetermined minimum value. Assuming the Series E Preferred Stock liquidation value is less than $18 per share (such per share amount as adjusted for the stock split, stock dividends and share combinations) at the time of a public offering, the Company would be obligated to issue 112.5 11.25, 4.5, or 2.55 shares of common stock for each share of Series E Preferred Stock if the public offering price was $.4, $4, $10 or $17.60 per common share, respectively. Upon conversion of the Series E Preferred Stock into shares of common stock, all unpaid accrued dividends are forgiven. Further, where the offering price is equal to or greater than $45 (such per share amount as adjusted for stock splits, stock dividends and share combinations), each share of Series E Preferred Stock is convertible into one share of common stock.
In the event of any liquidation, before payment of any amount shall be made in respect of any class or series of stock, the holder of each share of Series E Preferred Stock shall be entitled to the greater of the applicable initial liquidation preference or the amount per share that would have been payable if converted to common stock immediately prior to such liquidation. After the distribution to the holders of the Series E but before any payment of any amount shall be made in respect of the common stock, the holder of each share of Series D Preferred Stock shall be entitled to the greater of the applicable initial liquidation preference or the amount per share that would have been payable if converted to common stock immediately prior to such liquidation, plus any accrued unpaid dividends.
F-17
Table of Contents
Index to Financial Statements
FleetCor Technologies, Inc. and subsidiaries
Notes to consolidated financial statements (continued)
5. Share based compensation
The Company accounts for stock-based compensation pursuant to relevant authoritative guidance, which requires measurement of compensation cost for all stock awards at fair value on the date of grant and recognition of compensation, net of estimated forfeitures, over the requisite service period for awards expected to vest.
The Company has a Stock Incentive Plan (the Plan) pursuant to which the Company’s board of directors may grant stock options or restricted stock to key employees. The Company is authorized to issue grants of restricted stock and options to purchase up to 20,213,150 shares for the years ended December 31, 2009 and 2008, and 17,713,150 for the year ended December 31, 2007. There were 41,570 additional options available for grant under the Plan at December 31, 2009.
Stock options
Stock options are granted with an exercise price estimated to be greater than or equal to the fair market value on the date of grant. Options granted have vesting provisions ranging from two to four years. Stock option grants are generally subject to forfeiture if employment terminates prior to vesting. All options were granted at estimated fair market value as authorized by the Company’s board of directors.
Restricted stock
Awards of restricted stock and restricted stock units are independent of stock option grants and are generally subject to forfeiture if employment terminates prior to vesting. The vesting of the shares granted in 2009 is contingent on the sale of the Company or a public offering of the Company’s common stock, subject to certain other conditions. With the exception of 830,000 restricted stock awards, awards granted prior to 2008 are fully vested. The remaining 830,000 shares of restricted stock vest upon the sale of the Company or a public offering of the Company’s common stock.
The table below summarizes the expense related to share-based payments for the years ended December 31 (in thousands):
| 2009 | 2008 | 2007 | ||||||||||
| Stock options |
$ | 2,666 | $ | 2,757 | $ | 1,155 | ||||||
| Restricted stock |
— | 1 | 10 | |||||||||
| Stock-based compensation |
$ | 2,666 | $ | 2,758 | $ | 1,165 | ||||||
The tax benefits recorded on stock-based compensation were $679,000, $578,000 and $466,000 for the years ended December 31, 2009, 2008 and 2007, respectively.
F-18
Table of Contents
Index to Financial Statements
FleetCor Technologies, Inc. and subsidiaries
Notes to consolidated financial statements (continued)
5. Share based compensation (continued)
The following table summarizes information about stock options outstanding at December 31, 2009 (shares in thousands):
| Exercise price | Options outstanding | Weighted average remaining vesting life in years |
Options exercisable | |||||||||||||
| $ 0.15 |
233 | — | 233 | |||||||||||||
| 1.20 – 1.56 |
1,150 | — | 1,150 | |||||||||||||
| 2.00 – 2.31 |
1,305 | — | 1,305 | |||||||||||||
| 5.20 |
1,250 | — | 1,250 | |||||||||||||
| 6.55 |
260 | 0.50 | 243 | |||||||||||||
| 10.00 – 10.07 |
1,727 | 2.05 | 637 | |||||||||||||
| 12.00 – 14.00 |
1,887 | 1.95 | 705 | |||||||||||||
| 18.00 |
250 | 4.00 | — | |||||||||||||
| 8,062 | 5,523 | |||||||||||||||
The fair value of stock option awards granted was estimated using the Black-Scholes option pricing model with the following weighted-average assumptions for the years ended December 31 as follows:
| 2009 | 2008 | 2007 | ||||||||||
| Risk-free interest rate |
2.61% | 2.55% | 4.60% | |||||||||
| Dividend yield |
— | — | — | |||||||||
| Expected volatility |
31.14% | 29.27% | 30.58% | |||||||||
| Expected life (in years) |
3.33 | 3.72 | 3.79 | |||||||||
The Company considered the retirement and forfeiture provisions of the options and utilized its historical experience to estimate the expected life of the options.
We estimate the volatility of the share price of the Company’s common stock by considering the historical volatility of the stock of similar public entities. In determining the appropriateness of the public entities included in the volatility assumption we considered a number of factors, including the entity’s life cycle stage, size, financial leverage, and products offered.
F-19
Table of Contents
Index to Financial Statements
FleetCor Technologies, Inc. and subsidiaries
Notes to consolidated financial statements (continued)
5. Share based compensation (continued)
The following summarizes the changes in the number of shares of common stock under option for the following periods (shares and aggregate intrinsic value in thousands):
| Shares | Weighted price |
Options Exercisable of year |
Weighted average exercise price of exercisable options |
Weighted granted during |
Aggregate intrinsic value |
|||||||||||||||||||
| Outstanding at December 31, 2006 |
6,315 | $ | 2.56 | 2,743 | $ | 1.98 | $ | 94,975 | ||||||||||||||||
| Granted |
1,390 | 11.02 | $ | 3.33 | ||||||||||||||||||||
| Exercised |
(215 | ) | 1.27 | 3,590 | ||||||||||||||||||||
| Forfeited |
(33 | ) | 5.55 | |||||||||||||||||||||
| Tendered |
(552 | ) | 1.45 | |||||||||||||||||||||
| Outstanding at December 31, 2007 |
6,905 | 4.75 | 3,345 | 2.80 | 91,507 | |||||||||||||||||||
| Granted |
1,513 | 14.00 | 3.62 | |||||||||||||||||||||
| Exercised |
(398 | ) | 1.19 | 6,672 | ||||||||||||||||||||
| Forfeited |
(425 | ) | 8.80 | |||||||||||||||||||||
| Outstanding at December 31, 2008 |
7,595 | 6.55 | 4,375 | 3.82 | 76,629 | |||||||||||||||||||
| Granted |
1,375 | 11.46 | 2.96 | |||||||||||||||||||||
| Exercised |
(215 | ) | 1.23 | 3,608 | ||||||||||||||||||||
| Forfeited |
(693 | ) | 7.42 | |||||||||||||||||||||
| Outstanding at December 31, 2009 |
8,062 | 7.45 | 5,523 | 5.15 | 70,958 | |||||||||||||||||||
| Vested and expected to vest at December 31, 2009 |
8,062 | $ | 7.45 | |||||||||||||||||||||
The weighted-average remaining contractual life for options outstanding was 1.04 years as of December 31, 2009.
The following table summarizes the changes in the number of shares of restricted stock and restricted stock units for the following periods (shares in thousands):
| Shares | Weighted average grant date fair value |
|||||||
| Outstanding at December 31, 2006 |
3,970 | $ | 1.66 | |||||
| Granted |
18 | 12.00 | ||||||
| Repurchased |
(693 | ) | .15 | |||||
| Forfeited |
(25 | ) | .15 | |||||
| Cancelled |
(125 | ) | 6.55 | |||||
| Outstanding at December 31, 2007 |
3,145 | 1.87 | ||||||
| Granted |
80 | 14.00 | ||||||
| Outstanding at December 31, 2008 |
3,225 | 2.17 | ||||||
| Granted |
853 | 11.35 | ||||||
| Cancelled |
(63 | ) | 14.00 | |||||
| Outstanding at December 31, 2009 |
4,015 | 4.41 | ||||||
| Vested at December 31, 2009 |
2,332 | .24 | ||||||
F-20
Table of Contents
Index to Financial Statements
FleetCor Technologies, Inc. and subsidiaries
Notes to consolidated financial statements (continued)
5. Share based compensation (continued)
The following table summarizes the Company’s total unrecognized compensation cost related to stock-based compensation as of December 31, 2009 (in millions):
| (in millions) | Unrecognized compensation cost |
Weighted average period of expense recognition (in years) |
||||||
| Stock options |
$ | 7.3 | 1.96 | |||||
| Restricted stock |
14.9 | — | ||||||
| Total |
$ | 22.2 | ||||||
In connection with making fair value estimates related to the Company’s stock option and restricted stock grants management considered various factors including third-party equity transactions and certain commonly used valuation techniques. The Company sold convertible preferred stock to third parties in 2005, 2006 and 2009. In addition, in 2007 the Company repurchased common stock and preferred stock from the holders at a negotiated value which the Company believed represented fair value. These third-party transactions served as a basis for determining the fair value of our common stock at various dates. In situations where we sold preferred stock that included conversion and dividend features we considered such features in those instruments and the fact that such instruments could not be freely traded in determining a fair value for the Company’s common stock. Generally, the Company concluded that the fair value of its common stock was 10% to 25% less than the preferred stock at the date of such third-party transactions due to the features attributable to the preferred stock holders. In periods prior to third-party transactions and in intervening periods subsequent to the third-party transactions the Company utilized various earnings and revenue multiples to estimate the fair value of its common stock or to serve as an additional factor in determining fair value.
6. Acquisitions
2009 Acquisitions
The Company acquired all of the outstanding stock of CLC Group, Inc. and Subsidiaries (CLC) on April 1, 2009. The purpose of the transaction was to expand the Company’s service offerings to include lodging and transportation management services. The results of CLC are included in the Company’s consolidated financial statements from the date of the acquisition. The total consideration for this acquisition was $169.1 million, consisting of cash paid of $161.1 million and the issuance of $8 million of Series E Preferred Stock. The purchase price allocation is not complete because the Company is in the process of developing a valuation of identifiable intangible assets and tangible assets with assistance from an independent third party. As of December 31, 2009, the Company recorded values for the intangible assets acquired including customer relationships and contracts of $53.3 million, tradename and trademarks of $5.7 million, internally developed software of $3.6 million, vendor network of $7.5 million, and deferred revenue of $1.4 million.
The Company acquired all of the outstanding stock of ReD Fuel Cards (Europe) Limited (ReD) on August 13, 2009. The purpose of the transaction was to expand the Company’s European commercial fleet card offerings. The results of ReD are included in the Company’s consolidated financial statements from the date of the
F-21
Table of Contents
Index to Financial Statements
FleetCor Technologies, Inc. and subsidiaries
Notes to consolidated financial statements (continued)
6. Acquisitions (continued)
2009 Acquisitions (continued)
acquisition. The total consideration for this acquisition was cash of $62.9 million. The purchase price allocation is not complete because the Company is in the process of developing a valuation of identifiable intangible assets and tangible assets with assistance from an independent third party. As of December 31, 2009, the Company recorded preliminary values for the intangibles including customer relationships of $21.9 million, merchant networks of $0.4 million, and internally developed software of $0.96 million. Pro forma results of operations for historical periods would not be materially different and therefore are not presented.
In addition, during 2009 the Company completed several other acquisitions with an aggregate purchase price of $7.4 million.
2008 Acquisitions
The Company acquired all of the outstanding stock of Petrol Plus Region (PPR) on July 15, 2008. The purpose of the transaction was to expand the Company’s commercial fleet card offerings. The results of PPR are included in the Company’s consolidated financial statements from the date of acquisition. The total consideration for this acquisition was $49 million including direct acquisition costs of $1.5 million. The acquisition was partially financed through the issuance of $11.9 million in debt. The Company completed the valuation of tangible and intangible assets with the assistance of an independent third party. As of December 31, 2008, the Company estimated values for the intangibles including customer relationships of $21.6 million, merchant networks of $2.63 million, internally developed software of $0.47 million tradenames and trademarks of $1.96 million, call option of $0.24 million and noncompete agreements of $0.2 million. The Company finalized its valuations in 2009 with no material adjustments. Pro forma results of operations for historical periods would not be materially different and therefore are not presented.
The Company acquired all of the outstanding stock of Abbey Group (Oxon) Limited and affiliated entities (Abbey) on April 2, 2008. The purpose of the transaction was to expand the Company’s fuel card reseller business in the UK. The results of Abbey are included in the Company’s consolidated financial statements from the date of the acquisition. The total consideration for this acquisition was $15 million including direct acquisition costs of $0.3 million. The acquisition was financed through cash on hand. The Company completed the valuation of tangible and intangible assets with the assistance of an independent third party. As of December 31, 2008, the Company estimated values for the intangibles including customer relationships of $5.3 million, tradenames and trademarks of $60,000, internally developed software of $40,000 and noncompete agreements of $50,000. The Company finalized its valuations in 2009 with no material adjustments. Pro forma results of operations for historical periods would not be materially different and therefore are not presented.
The Company acquired all of the outstanding stock of ICP International Card Products, B.V. (ICP) on April 28, 2008. The purpose of the transaction was to expand the Company’s presence in the commercial fuel card processing services to oil customers in Europe, Asia and Africa. The results of ICP are included in the Company’s consolidated financial statements from the date of the acquisition. The total consideration for this acquisition was $7.3 million, including direct acquisition costs of $84,000. The acquisition was financed by cash on hand and through the issuance of a note payable of $1.4 million. The Company completed the valuation of tangible and intangible assets with the assistance of an independent third party. As of December 31, 2008, the Company estimated values for the intangibles including customer relationships of $2.4 million, tradenames or
F-22
Table of Contents
Index to Financial Statements
FleetCor Technologies, Inc. and subsidiaries
Notes to consolidated financial statements (continued)
6. Acquisitions (continued)
2008 Acquisitions (continued)
trademarks of $40,000, internally developed software of $150,000 and noncompete agreements of $50,000. The Company finalized its valuations in 2009 with no material adjustments. Pro forma results of operations for historical periods would not be materially different and therefore are not presented.
The following table summarizes the allocation of the purchase price for the acquisitions for the years ended December 31, 2009 and 2008 (in thousands):
| 2009 Acquisitions |
2008 Acquisitions |
|||||||
| Trade and other receivables |
$40,072 | $21,776 | ||||||
| Prepaid expenses and other |
6,708 | 1,686 | ||||||
| Property and equipment |
6,793 | 408 | ||||||
| Goodwill |
182,899 | 25,261 | ||||||
| Other intangible assets |
99,820 | 35,370 | ||||||
| Notes and other liabilities assumed |
(103,855 | ) | (29,263 | ) | ||||
| Purchase price |
$232,437 | $55,238 | ||||||
The purchase price is net of cash and cash equivalents acquired totaling $3.0 million and $5.6 million for the 2009 and 2008 acquisitions, respectively. Included within goodwill, are $39.2 million and $2.8 million, respectively, of deferred income tax liabilities recorded as part of the purchase price allocation. At December 31, 2009, approximately $235 million of the Company’s goodwill is deductible for tax purposes.
Intangible assets allocated in connection with the purchase price allocations consisted of the following (in thousands):
| Weighted average useful lives (in years) |
2009 Acquisitions |
2008 Acquisitions |
||||||||||
| Customer relationships |
9 to 20 | $ | 80,863 | $ | 29,720 | |||||||
| Trade names and trademarks—indefinite |
n/a | 5,926 | 2,060 | |||||||||
| Merchant network |
5 to 15 | 7,930 | 2,630 | |||||||||
| Non compete agreements |
2 to 5 | 581 | 300 | |||||||||
| Software |
3 to 10 | 4,520 | 660 | |||||||||
| $ | 99,820 | $ | 35,370 | |||||||||
The following unaudited pro forma statements of income for the years ended December 31, 2009 and 2008 have been prepared to give effect to the CLC acquisition described above assuming that it occurred on January 1 of each fiscal year presented. The pro forma statements of income are presented for illustrative purposes only and are not necessarily indicative of the results of operations that would have been obtained had this transaction actually occurred at the beginning of the periods presented, nor do they intend to be a projection of future results of operations. The pro forma statements of income have been prepared from the Company’s and CLC’s historical audited consolidated statements of income for the years ended December 31, 2009 and 2008.
F-23
Table of Contents
Index to Financial Statements
FleetCor Technologies, Inc. and subsidiaries
Notes to consolidated financial statements (continued)
6. Acquisitions (continued)
2008 Acquisitions (continued)
The pro forma information is based on estimates and assumptions that have been made solely for purposes of developing such pro forma information, including without limitation, purchase accounting adjustments. The pro forma financial information presented below also includes depreciation and amortization based on the valuation of CLC’s tangible and intangible assets resulting from the acquisition. The pro forma financial information does not include any synergies or operating cost reductions that may be achieved from the combined operations.
| Pro forma statements of income for the year ended December 31 (unaudited) (in thousands except per share data) |
||||||||
| 2009 | 2008 | |||||||
| Income statement data |
||||||||
| Revenues, net |
$ | 370,381 | $ | 399,668 | ||||
| Income before income taxes |
137,092 | 159,828 | ||||||
| Net income |
93,413 | 112,225 | ||||||
| Earnings per share: |
||||||||
| Basic |
$ | 2.33 | $ | 2.97 | ||||
| Diluted |
1.15 | 1.40 | ||||||
| Weighted average shares outstanding: |
||||||||
| Basic |
33,802 | 33,033 | ||||||
| Diluted |
80,979 | 80,413 | ||||||
7. Goodwill and other intangible assets
Other intangible assets consisted of the following at December 31 (in thousands):
| 2009 | 2008 | |||||||||||||||||||||||||
| Useful lives (years) |
Gross carrying amount |
Accumulated amortization |
Net carrying amount |
Gross carrying amount |
Accumulated amortization |
Net carrying amount |
||||||||||||||||||||
| Customer and vendor agreements |
5 to 20 | $ | 204,617 | $ | (27,741 | ) | $ | 176,876 | $ | 115,824 | $ | (15,232 | ) | $ | 100,592 | |||||||||||
| Trade names and trademarks—indefinite lived |
n/a | 12,626 | — | 12,626 | 6,700 | — | 6,700 | |||||||||||||||||||
| Trade names and trademarks—other |
3 to 15 | 3,160 | (754 | ) | 2,406 | 3,160 | (514 | ) | 2,646 | |||||||||||||||||
| Software |
3 to 10 | 5,530 | (1,111 | ) | 4,419 | 1,010 | (237 | ) | 773 | |||||||||||||||||
| Non compete agreements |
2 to 5 | 1,871 | (768 | ) | 1,103 | 1,290 | (479 | ) | 811 | |||||||||||||||||
| Total other intangibles |
$ | 227,804 | $ | (30,374 | ) | $ | 197,430 | $ | 127,984 | $ | (16,462 | ) | $ | 111,522 | ||||||||||||
Amortization expense related to intangible assets for the years ended December 31, 2009, 2008, and 2007 was $13.9 million, $12.0 million, and $9.8 million, respectively.
F-24
Table of Contents
Index to Financial Statements
FleetCor Technologies, Inc. and subsidiaries
Notes to consolidated financial statements (continued)
7. Goodwill and other intangible assets (continued)
The future estimated amortization of intangibles at December 31, 2009 is as follows (in thousands):
| 2010 |
$ | 16,671 | ||
| 2011 |
16,541 | |||
| 2012 |
16,342 | |||
| 2013 |
15,929 | |||
| 2014 |
14,887 | |||
| Thereafter |
104,434 | |||
A summary of changes in the Company’s goodwill by reportable business segment is as follows (in thousands):
| Segment | December 31, 2008 |
Acquisitions | Purchase price adjustments |
Foreign currency |
December 31, 2009 |
|||||||||||||||
| North America |
$ | 153,033 | $ | 120,353 | $ | 1,543 | $ | — | $ | 274,929 | ||||||||||
| International |
254,404 | 53,255 | 6,572 | 1,176 | 315,407 | |||||||||||||||
| $ | 407,437 | $ | 173,608 | $ | 8,115 | $ | 1,176 | $ | 590,336 | |||||||||||
| Segment | December 31, 2007 |
Acquisitions | Purchase price adjustments |
Foreign currency |
December 31, 2008 |
|||||||||||||||
| North America |
$ | 150,870 | $ | — | $ | 2,163 | $ | — | $ | 153,033 | ||||||||||
| International |
238,497 | 21,253 | (2,904 | ) | (2,442 | ) | 254,404 | |||||||||||||
| $ | 389,367 | $ | 21,253 | $ | (741 | ) | $ | (2,442 | ) | $ | 407,437 | |||||||||
Goodwill adjustments in 2009 represent earnouts of $1.5 million related to acquisitions in 2004 and 2005, plus adjustments of $6.57 million related to prior year foreign acquisitions. Goodwill adjustments in 2008 represent earnouts of $2.16 million related to acquisitions in 2003 and 2005, less adjustments of $2.90 million related to prior year foreign acquisitions.
8. Property, plant and equipment
Property, plant and equipment, net consisted of the following at December 31 (in thousands):
| Estimated useful lives (in years) |
2009 | 2008 | ||||||||||||||
| Computer hardware and software |
3 to 7 | $ | 55,255 | $ | 48,709 | |||||||||||
| Card-reading equipment |
5 | 8,316 | 7,909 | |||||||||||||
| Furniture, fixtures, and vehicles |
3 to 6 | 4,269 | 3,223 | |||||||||||||
| Buildings and improvements |
10 to 30 | 4,251 | 306 | |||||||||||||
| 72,091 | 60,147 | |||||||||||||||
| Less: accumulated depreciation |
(44,868 | ) | (40,106 | ) | ||||||||||||
| Property, plant and equipment, net |
$ | 27,223 | $ | 20,041 | ||||||||||||
F-25
Table of Contents
Index to Financial Statements
FleetCor Technologies, Inc. and subsidiaries
Notes to consolidated financial statements (continued)
8. Property, plant and equipment (continued)
Depreciation expense related to property and equipment for the years ended December 31, 2009, 2008, and 2007 was $9.6 million, $8.6 million, and $7.9 million, respectively. Depreciation expense includes $3.7 million, $3.4 million, and $3.4 for capitalized computer software costs for the years ended December 31, 2009, 2008, and 2007, respectively. At December 31, 2009 and 2008, the Company had unamortized computer software costs of $10.6 million and $8.6 million, respectively.
9. Accrued expenses
Accrued expenses consisted of the following at December 31 (in thousands):
| 2009 | 2008 | |||||||
| Accrued bonuses |
$ | 3,759 | $ | 3,425 | ||||
| Accrued interest |
1,267 | 1,304 | ||||||
| Accrued taxes |
16,502 | 2,975 | ||||||
| Interest rate swap |
6,383 | 10,788 | ||||||
| Other |
18,835 | 16,727 | ||||||
| $ | 46,746 | $ | 35,219 | |||||
10. Notes payable and credit agreements
The Company’s debt instruments at December 31, 2009 and 2008, consist primarily of term notes as follows (in thousands):
| 2009 | 2008 | |||||||
| Term note payable—domestic(a) |
$ | 276,250 | $ | 290,250 | ||||
| Term note payable—foreign(b) |
61,576 | 66,906 | ||||||
| Other debt |
13,725 | 13,591 | ||||||
| Total notes payable |
351,551 | 370,747 | ||||||
| Less current portion |
(22,621 | ) | (10,563 | ) | ||||
| Total notes payable excluding current portion |
$ | 328,930 | $ | 360,184 | ||||
| (a) | The Company entered into a $130 million term loan and a $30 million revolving line of credit on June 29, 2005. On April 30, 2007, the Company amended and restated the facility increasing the term loan to $250 million, increasing the revolving line of credit facility to $50 million and entering into a $50 million delayed draw term loan facility. In April 2008, the Company borrowed the additional $50 million from the delayed draw term loan facility. The revolving line of credit facility is comprised of a $30 million US tranche and a $20 million global tranche and is collateralized by the assets and operations of the respective country where the borrowings are incurred. At December 31, 2009 and 2008, the Company had no borrowings on the revolving line of credit facility. Interest on the term loan is payable at a rate per annum equal to the sum of the Base Rate plus 1.25% or the Eurodollar Rate plus 2.25% beginning. Interest on the line of credit ranges from the sum of the Base Rate plus 1.00% to 1.50% or the Eurodollar Rate plus 2.00% to 2.50%. The term loan is payable in quarterly installments of .25% of the initial aggregate principal amount of the loans and is due on the last business day of each March, June, September, and December with the final principal payment due in April 2013. Principal payments of $14.0 million and $7.9 million were made on the term loan during 2009 and 2008, respectively. |
| (b) | On December 7, 2006, one of the Company’s foreign subsidiaries entered into foreign term loans in the Czech Republic denominated in Czech Koruna. The Facility A term loan was for $47 million and the Facility B term loan was for $33 million. Interest on the Facility A term loan is payable at a rate per annum equal to the sum of PRIBOR (Prague Interbank Offered Rate) plus 1.75% to .95% and (2.71% and 5.06% at December 31, 2009 and 2008, respectively). Interest on the Facility B term loan is payable at a rate per annum equal to the sum of PRIBOR plus 2.9% to 2% (3.56% and 6.20% at December 31, 2009 and 2008, respectively). The Facility A term loan is payable in semiannual payments in |
F-26
Table of Contents
Index to Financial Statements
FleetCor Technologies, Inc. and subsidiaries
Notes to consolidated financial statements (continued)
10. Notes payable and credit agreements (continued)
| June and December of each year beginning in June 2007 and ending in December 2013. Principal payments of $7.0 million and $18.0 million were made in 2009 and 2008, respectively. The Facility B term loan is payable in a lump sum in December 2014. The outstanding balance of the note payable increased $1.7 million in 2009 and decreased $.5 million in 2008 due to the change in translation in the exchange rate. The term loans have financial covenants, one of which requires the Company to maintain cash and cash equivalents to satisfy a specific liquidity ratio. |
The Company was in compliance with all financial covenants at December 31 2009 and 2008, respectively.
The contractual maturities of the Company’s notes payable at December 31, 2009 are as follows (in thousands):
| 2010 |
$ | 22,621 | ||
| 2011 |
10,730 | |||
| 2012 |
10,263 | |||
| 2013 |
10,185 | |||
| 2014 |
36,502 | |||
| Thereafter |
261,250 | |||
In 2005, the Company entered into an interest rate collar agreement with a notional value of $45 million which matured in October 2008. In November 2007, the Company also entered into an interest rate swap agreement with a notional value of $175 million which matures in November 2010. Both agreements convert a portion of the Company’s variable rate debt exposure to a fixed rate.
The Company records any differences paid or received on these interest rate agreements as adjustments to interest expense over the lives of the agreements. These interest rate agreements have been designated as cash flow hedges and the changes in the fair value of the agreements are recorded to accumulated other comprehensive income. During the years ended December 31, 2009, 2008 and 2007, no gains or losses were recognized on these instruments and there was no effect on income from hedge ineffectiveness. The net difference between interest paid and interest received related to these agreements resulted in $7 million, $3 million and $(0.2) increases (decreases) in interest expense for the years ended December 31, 2009, 2008 and 2007, respectively.
11. Income taxes
Income before the provision for income taxes is attributable to the following jurisdictions (in thousands) for years ended December 31:
| 2009 | 2008 | 2007 | ||||||||||
| United States |
$ | 83,561 | $ | 84,773 | $ | 46,385 | ||||||
| Foreign |
46,054 | 49,914 | 41,198 | |||||||||
| Total |
$ | 129,615 | $ | 134,687 | $ | 87,583 | ||||||
F-27
Table of Contents
Index to Financial Statements
FleetCor Technologies, Inc. and subsidiaries
Notes to consolidated financial statements (continued)
11. Income taxes (continued)
The provision (benefit) for income taxes for the years ended December 31, 2009, 2008 and 2007 consists of the following (in thousands):
| 2009 | 2008 | 2007 | ||||||||||
| Current: |
||||||||||||
| Federal |
$ | 16,636 | $ | 22,610 | $ | 11,758 | ||||||
| State |
1,321 | 1,145 | 730 | |||||||||
| Foreign |
13,355 | 13,806 | 10,154 | |||||||||
| 31,312 | 37,561 | 22,642 | ||||||||||
| Deferred: |
||||||||||||
| Federal |
10,558 | 2,075 | 4,470 | |||||||||
| State |
900 | 391 | 236 | |||||||||
| Foreign |
(2,207 | ) | (2,622 | ) | (1,350 | ) | ||||||
| 9,251 | (156 | ) | 3,356 | |||||||||
| $ | 40,563 | $ | 37,405 | $ | 25,998 | |||||||
The provision for income taxes differs from amounts computed by applying the U.S. federal tax rate of 35% to income before income taxes for the years ended December 31, 2009, 2008 and 2007 due to the following (in thousands):
| 2009 | 2008 | 2007 | ||||||||||||||||||||||
| Computed “expected” tax expense |
$ | 45,365 | 35.00% | $ | 47,140 | 35.00% | $ | 30,653 | 35.00% | |||||||||||||||
| Changes resulting from: |
||||||||||||||||||||||||
| Foreign income tax differential |
(6,025 | ) | (4.65 | ) | (6,238 | ) | (4.63 | ) | (3,401 | ) | (3.88 | ) | ||||||||||||
| State taxes net of federal benefits |
1,490 | 1.15 | 999 | 0.74 | 523 | 0.60 | ||||||||||||||||||
| Foreign-sourced non taxable income |
(2,825 | ) | (2.18 | ) | (5,236 | ) | (3.89 | ) | (2,796 | ) | (3.19 | ) | ||||||||||||
| Other |
2,558 | 1.98 | 740 | 0.55 | 1,019 | 1.15 | ||||||||||||||||||
| Provision for income taxes |
$ | 40,563 | 31.30% | $ | 37,405 | 27.77% | $ | 25,998 | 29.68% | |||||||||||||||
F-28
Table of Contents
Index to Financial Statements
FleetCor Technologies, Inc. and subsidiaries
Notes to consolidated financial statements (continued)
11. Income taxes (continued)
The tax effects of temporary differences that give rise to significant portions of the deferred tax assets and liabilities at December 31 are as follows (in thousands):
| 2009 | 2008 | |||||||
| Deferred tax assets: |
||||||||
| Accounts receivable, principally due to the allowance for doubtful accounts |
$ | 2,897 | $ | 3,102 | ||||
| Interest rate derivatives |
2,746 | 4,100 | ||||||
| Accrued expenses not currently deductible for tax |
1,345 | 715 | ||||||
| Foreign tax credit carry forwards |
177 | — | ||||||
| Stock based compensation |
1,516 | 958 | ||||||
| Net operating loss carryforwards |
1,831 | 2,053 | ||||||
| Other |
98 | 62 | ||||||
| Deferred tax assets before valuation allowance |
10,610 | 10,990 | ||||||
| Valuation allowance |
(902 | ) | (619 | ) | ||||
| Deferred tax assets, net |
9,708 | 10,371 | ||||||
| Deferred tax liabilities: |
||||||||
| Property and equipment, principally due to differences between book and tax depreciation |
(2,405 | ) | (2,350 | ) | ||||
| Intangibles—including goodwill |
(86,140 | ) | (40,661 | ) | ||||
| Deferred tax liabilities |
(88,545 | ) | (43,011 | ) | ||||
| Net deferred tax liabilities |
$ | (78,837 | ) | $ | (32,640 | ) | ||
The Company’s deferred tax balances are classified in its balance sheets based on net current items and net non-current items as of December 31 as follows (in thousands):
| 2009 | 2008 | |||||||
| Current deferred tax assets and liabilities: |
||||||||
| Current deferred tax assets |
$ | 6,988 | $ | 7,917 | ||||
| Long term deferred tax assets and liabilities: |
||||||||
| Long term deferred tax assets |
2,720 | 2,454 | ||||||
| Long term deferred tax liabilities |
(88,545 | ) | (43,011 | ) | ||||
| Net long term deferred tax liabilities |
(85,825 | ) | (40,557 | ) | ||||
| Net deferred tax liabilities |
$ | (78,837 | ) | $ | (32,640 | ) | ||
We reduce federal and state income taxes payable by the tax benefits associated with the exercise of certain stock options. To the extent realized tax deductions for options exceed the amount previously recognized as deferred tax benefits related to share-based compensation for these option awards, we record an excess tax benefit in stockholders’ equity. We recorded no excess tax benefits during the year ended December 31, 2009, and $0.9 million and $2.3 million for the years ended December 31, 2008 and 2007, respectively.
At December 31, 2009, U.S. taxes were not provided on earnings of the Company’s foreign subsidiaries. These earnings are intended to be permanently reinvested outside the U.S. If in the future these earnings are repatriated
F-29
Table of Contents
Index to Financial Statements
FleetCor Technologies, Inc. and subsidiaries
Notes to consolidated financial statements (continued)
11. Income taxes (continued)
to the U.S, or if the Company determines that the earnings will be remitted in the foreseeable future, an additional tax provision and related liability may be required. If such earnings were distributed, U.S. income taxes would be partially reduced by available credits for taxes paid to the jurisdictions in which the income was earned. Cumulative undistributed earnings of non-U.S. subsidiaries for which U.S. taxes have not been provided are included in consolidated retained earnings in the amount of approximately $139.5 million, $93.4 million and $43.5 million at December 31, 2009, 2008, and 2007, respectively.
As of December 31, 2009, the Company had net operating loss carryforwards for state income tax purposes of approximately $53 million, which are available to offset future state taxable income through 2022. During the year ended December 31, 2009, a $0.9 million valuation allowance was placed against the Louisiana NOL carryforwards in 2009 and prior years.
The Company retrospectively adopted relevant authoritative guidance regarding accounting for uncertain tax positions on January 1, 2007. This guidance prescribes a minimum threshold and measurement methodology that a tax position taken or expected to be taken in a tax return is required to meet before being recognized in the financial statements. It also provides guidance for derecognition, classification, interest and penalties, accounting in interim periods, disclosure and transition.
The Company recognizes interest and penalties on unrecognized tax benefits (including interest and penalties calculated on uncertain tax positions on which the Company believes will ultimately prevail) within the provision for income taxes on continuing operations in the consolidated financial statements. This policy is a continuation of the Company’s policy prior to adoption of the guidance regarding uncertain tax positions. As of December 31, 2009 and 2008, the Company had recorded accrued interest and penalties related to the unrecognized tax benefits of $.9 million and $.5 million, respectively.
The Company files numerous consolidated and separate income tax returns in the U.S. federal jurisdiction and various state and foreign jurisdictions. The statute of limitations for the Company’s U.S. federal income tax returns has expired for years prior to 2006.
A reconciliation of the beginning and ending balances of the total amounts of gross unrecognized tax benefits including interest for the years ended December 31, 2009, 2008 and 2007 is as follows (in thousands):
| Unrecognized tax benefits balance at January 1, 2007 |
$ | 417 | ||
| Cumulative effect of adoption of provision related to uncertain tax positions |
780 | |||
| Additions based on tax provisions related to the current year |
1,216 | |||
| Unrecognized tax benefits at December 31, 2007 |
2,413 | |||
| Additions based on tax provisions related to the current year |
1,188 | |||
| Unrecognized tax benefits at December 31, 2008 |
3,601 | |||
| Additions based on tax provisions related to the current year |
859 | |||
| Deductions based on settlement/expiration of prior year tax positions |
(417 | ) | ||
| Unrecognized tax benefits at December 31, 2009 |
$ | 4,043 | ||
It is not anticipated that there are any unrecognized tax benefits that will significantly increase or decrease within the next twelve months.
F-30
Table of Contents
Index to Financial Statements
FleetCor Technologies, Inc. and subsidiaries
Notes to consolidated financial statements (continued)
12. Leases
The Company enters into noncancelable operating lease agreements for equipment, buildings and vehicles. The minimum lease payments for the noncancelable operating lease agreements are as follows (in thousands):
| 2010 |
$ | 5,251 | ||
| 2011 |
4,519 | |||
| 2012 |
3,522 | |||
| 2013 |
2,279 | |||
| 2014 |
514 | |||
| Thereafter |
415 | |||
Rent expense for noncancelable operating leases approximated $4.7 million, $3.9 million, and $3.6 million for the years ended December 31, 2009, 2008, and 2007, respectively. The leases are generally renewable at the Company’s option for periods of one to five years.
13. Commitments and contingencies
In the ordinary course of business, the Company is involved in various pending or threatened legal actions. The Company has recorded reserves for certain legal proceedings. The amounts recorded are estimated and as additional information becomes available, the Company will reassess the potential liability related to its pending litigation and revise its estimate in the period that information becomes known. In the opinion of management, the amount of ultimate liability, if any, with respect to these actions will not have a material adverse effect on the Company’s consolidated financial position, results of operations, or liquidity.
14. Related-party notes
The Company issued 1,325,000 shares of Series B preferred stock (subsequently reclassified to Series D-2 preferred stock as further discussed in Footnote 4) at $.20 per share in May 2002. The Company executed promissory notes with the holders, payable in seven years or within 120 days of termination of employment. The notes were paid in full as of December 31, 2009.
15. Earnings per share
The Company reports a dual presentation of basic and diluted EPS. Basic EPS is computed by dividing net income attributable to shareholders of the Company by the weighted average number of common shares outstanding during the reported period. Diluted EPS reflects the potential dilution related to equity-based incentives using the if-converted and treasury stock methods, where applicable.
F-31
Table of Contents
Index to Financial Statements
FleetCor Technologies, Inc. and subsidiaries
Notes to consolidated financial statements (continued)
15. Earnings per share (continued)
The calculation and reconciliation of basic and diluted earnings per share for the years ended December 31 (in thousands, except per share data):
| 2009 | 2008 | 2007 | ||||||||||
| Numerator for basic earnings per share: |
||||||||||||
| Net income |
$ | 89,052 | $ | 97,282 | $ | 61,585 | ||||||
| Convertible preferred stock accrued dividends |
(15,789 | ) | (11,357 | ) | (10,810 | ) | ||||||
| Earnings attributable to common shareholders for basic earnings per share |
73,263 | 85,925 | 50,775 | |||||||||
| Numerator for diluted earnings per share: |
||||||||||||
| Income attributable to common shareholders for basic earnings per share |
$ | 73,263 | $ | 85,925 | $ | 50,775 | ||||||
| Effect of convertible preferred stock |
15,789 | 11,357 | 10,810 | |||||||||
| Net earnings for diluted earnings per share |
89,052 | 97,282 | 61,585 | |||||||||
| Denominator for basic and diluted earnings per share: |
||||||||||||
| Weighted-average shares outstanding |
32,522 | 32,255 | 30,958 | |||||||||
| Share-based payment awards classified as participating securities |
1,280 | 778 | 927 | |||||||||
| Denominator for basic earnings per share |
33,802 | 33,033 | 31,885 | |||||||||
| Dilutive securities |
3,602 | 3,488 | 3,787 | |||||||||
| Warrants |
— | 317 | 662 | |||||||||
| Convertible preferred stock |
41,450 | 35,075 | 35,386 | |||||||||
| Denominator for diluted earnings per share |
78,854 | 71,913 | 71,720 | |||||||||
| Basic earnings per share |
$ | 2.17 | $ | 2.60 | $ | 1.59 | ||||||
| Diluted earnings per share |
1.13 | 1.35 | .86 | |||||||||
16. Segments
The Company reports information about its operating segments in accordance with the authoritative guidance related to segments. The Company’s reportable segments represent components of the business for which separate financial information is evaluated regularly by the chief operating decision maker in determining how to allocate resources and in assessing performance. The Company operates in two reportable segments, North America and International. The Company has identified these segments due to commonality of the products in each of their business lines having similar economic characteristics, services, customers and processes. There were no significant inter-segment sales.
F-32
Table of Contents
Index to Financial Statements
FleetCor Technologies, Inc. and subsidiaries
Notes to consolidated financial statements (continued)
16. Segments (continued)
The Company’s segment results are as follows as of and for the years ended December 31 (in thousands):
| 2009 | 2008 | 2007 | ||||||||||
| Revenues, net |
||||||||||||
| North America |
$ | 227,373 | $ | 205,468 | $ | 161,364 | ||||||
| International |
126,700 | 135,585 | 102,722 | |||||||||
| $ | 354,073 | $ | 341,053 | $ | 264,086 | |||||||
| Operating income |
||||||||||||
| North America |
$ | 91,715 | $ | 88,286 | $ | 64,556 | ||||||
| International |
54,330 | 64,169 | 41,208 | |||||||||
| $ | 146,045 | $ | 152,455 | $ | 105,764 | |||||||
| Depreciation and amortization |
||||||||||||
| North America |
$ | 15,990 | $ | 16,058 | $ | 11,624 | ||||||
| International |
12,378 | 11,182 | 8,669 | |||||||||
| $ | 28,368 | $ | 27,240 | $ | 20,293 | |||||||
| Capital expenditures |
||||||||||||
| North America |
$ | 5,097 | $ | 4,659 | $ | 4,923 | ||||||
| International |
4,580 | 2,429 | 2,178 | |||||||||
| $ | 9,677 | $ | 7,088 | $ | 7,101 | |||||||
| 2009 | 2008 | |||||||
| Long lived assets (excluding goodwill) |
||||||||
| North America |
$ | 121,519 | $ | 58,060 | ||||
| International |
150,448 | 125,475 | ||||||
| $ | 271,967 | $ | 183,535 | |||||
The table below presents certain financial information related to the Company’s significant foreign operations as of and for the years ended December 31 (in millions):
| 2009 | 2008 | 2007 | ||||||||||
| Revenues, net |
||||||||||||
| Czech Republic |
$ | 48.6 | $ | 54.6 | $ | 43.4 | ||||||
| United Kingdom |
55.7 | 61.8 | 57.2 | |||||||||
| Long-lived assets (excluding goodwill) |
||||||||||||
| Czech Republic |
$ | 59.5 | $ | 55.4 | ||||||||
| United Kingdom |
66.3 | 43.5 | ||||||||||
For the years ended December 31, 2009 and 2008, two customers represented 25.1% and 20.5%, respectively of the Company’s net revenue in North America. For the year ended December 31, 2007, a single customer represented 18.3% of the Company’s net revenue in North America.
F-33
Table of Contents
Index to Financial Statements
FleetCor Technologies, Inc. and subsidiaries
Notes to consolidated financial statements (continued)
17. Selected quarterly financial data (unaudited)
| Fiscal quarters | ||||||||||||||||
| Year ended December 31, 2009 | First | Second | Third | Fourth | ||||||||||||
| Revenues, net |
$ | 68,076 | $ | 88,110 | $ | 100,575 | $ | 97,312 | ||||||||
| Operating income |
23,051 | 33,928 | 47,867 | 41,200 | ||||||||||||
| Net income |
13,414 | 20,808 | 29,882 | 24,948 | ||||||||||||
| Income per share |
||||||||||||||||
| Basic |
$ | .31 | $ | .49 | $ | .76 | $ | .61 | ||||||||
| Diluted |
.19 | .26 | .37 | .31 | ||||||||||||
| Weighted average shares outstanding |
||||||||||||||||
| Basic |
33,766 | 33,767 | 33,792 | 33,883 | ||||||||||||
| Diluted |
71,690 | 80,463 | 81,687 | 81,575 | ||||||||||||
| Fiscal quarters | ||||||||||||||||
| Year ended December 31, 2008 | First | Second | Third | Fourth | ||||||||||||
| Revenues, net |
$ | 72,305 | $ | 80,072 | $ | 97,418 | $ | 91,259 | ||||||||
| Operating income |
31,831 | 40,337 | 48,262 | 32,025 | ||||||||||||
| Net income |
19,473 | 24,806 | 30,642 | 22,362 | ||||||||||||
| Income per share |
||||||||||||||||
| Basic |
$ | .51 | $ | .67 | $ | .84 | $ | .58 | ||||||||
| Diluted |
.27 | .34 | .43 | .31 | ||||||||||||
| Weighted average shares outstanding |
||||||||||||||||
| Basic |
32,770 | 32,969 | 32,973 | 33,415 | ||||||||||||
| Diluted |
71,962 | 71,962 | 71,903 | 71,878 | ||||||||||||
The sum of the quarterly earnings per common share amounts for 2009 and 2008 do not equal the earnings per common share for the years ended December 31, 2009 and 2008 due to rounding.
18. Subsequent event
On November 29, 2010, the Company amended its certificate of incorporation to increase the authorized common stock to 130,000,000 shares, retain the par value of .001 per share, and to provide for a two and one-half-for-one Common Stock split. All common share and per common share amounts within the consolidated financial statements and footnotes have been adjusted for all periods to reflect the stock split.
F-34
Table of Contents
Index to Financial Statements
FleetCor Technologies, Inc. and subsidiaries
Condensed consolidated balance sheets
(Unaudited)
| (In thousands, except share and par value amounts) | December 31, 2009* |
September 30, 2010 |
Pro Forma September 30, 2010 |
|||||||||
| Assets |
||||||||||||
| Current assets: |
||||||||||||
| Cash and cash equivalents |
$ | 84,701 | $ | 110,773 | $ | 110,773 | ||||||
| Restricted cash |
67,979 | 65,927 | 65,927 | |||||||||
| Accounts receivable |
163,461 | 256,634 | 256,634 | |||||||||
| Securitized accounts receivable – restricted for securitization investors |
— | 167,000 | 167,000 | |||||||||
| Prepaid expenses and other current assets |
24,113 | 40,212 | 40,212 | |||||||||
| Deferred income taxes |
6,988 | 7,101 | 7,101 | |||||||||
| Total current assets |
347,242 | 647,647 | 647,647 | |||||||||
| Property and equipment |
72,091 | 76,514 | 76,514 | |||||||||
| Less accumulated depreciation and amortization |
(44,868 | ) | (50,930 | ) | (50,930 | ) | ||||||
| Net property and equipment |
27,223 | 25,584 | 25,584 | |||||||||
| Goodwill |
590,336 | 594,812 | 594,812 | |||||||||
| Other intangibles, net |
197,430 | 190,871 | 190,871 | |||||||||
| Other assets |
47,314 | 44,613 | 44,613 | |||||||||
| Total assets |
$ | 1,209,545 | $ | 1,503,527 | $ | 1,503,527 | ||||||
| Liabilities and Stockholders’ Equity |
||||||||||||
| Current liabilities: |
||||||||||||
| Accounts payable |
$ | 175,578 | $ | 226,348 | $ | 226,348 | ||||||
| Accrued expenses |
46,746 | 46,257 | 46,257 | |||||||||
| Customer deposits |
75,796 | 72,875 | 72,875 | |||||||||
| Securitization facility |
— | 167,000 | 167,000 | |||||||||
| Current portion notes payable and other obligations |
22,621 | 10,801 | 10,801 | |||||||||
| Dividends payable |
— | — | 7,311 | |||||||||
| Total current liabilities |
320,741 | 523,281 | 530,592 | |||||||||
| Notes payable and other obligations, less current portion |
328,930 | 323,525 | 323,525 | |||||||||
| Deferred income taxes |
85,825 | 84,792 | 84,792 | |||||||||
| Total noncurrent liabilities |
414,755 | 408,317 | 408,317 | |||||||||
| Commitments and contingencies |
||||||||||||
| Stockholders’ equity: |
||||||||||||
| Convertible preferred stock, $.001 par value; 1,919,135 shares authorized and issued and 1,668,449 shares outstanding for Series D-1 at 2009 and 2010; 230,769 shares authorized and issued and 201,923 shares outstanding for Series D-2 at 2009 and 2010; 3,995,413 shares authorized, issued and outstanding for Series D-3 at 2009 and 2010; 8,164,281 shares authorized, issued and outstanding for Series D-4 at 2009 and 2010; 8,499,984 shares authorized, issued and outstanding for Series E at 2009 and 2010; 3,400,000 and 1,000,000 shares authorized for blank check preferred stock and none issued at 2009 and 2010 (aggregate liquidation preference of $400,634 and $409,996, respectively) |
330,654 | 344,018 | — | |||||||||
| Common stock, $.001 par value; 130,000,000 shares authorized, 65,892,313 shares issued and 34,025,173 shares outstanding at 2009; and 130,000,000 shares authorized, 66,041,342 shares issued and 34,125,163 shares outstanding at 2010 |
66 | 66 | 110 | |||||||||
| Additional paid-in capital |
94,996 | 97,928 | 377,361 | |||||||||
| Retained earnings |
235,726 | 312,742 | 369,972 | |||||||||
| Accumulated other comprehensive loss |
(12,173 | ) | (7,605 | ) | (7,605 | ) | ||||||
| Less treasury stock (31,816,178 shares at 2009 and 31,916,178 shares at 2010) |
(175,220 | ) | (175,220 | ) | (175,220 | ) | ||||||
| Total stockholders’ equity |
474,049 | 571,929 | 564,618 | |||||||||
| Total liabilities and stockholders’ equity |
$ | 1,209,545 | $ | 1,503,527 | $ | 1,503,527 | ||||||
| * | Derived from the audited Consolidated Balance Sheet |
See accompanying notes.
F-35
Table of Contents
Index to Financial Statements
FleetCor Technologies, Inc. and subsidiaries
Condensed consolidated statements of income
(Unaudited)
| Nine Months Ended September 30 |
||||||||
| (In thousands, except earnings per share amounts) | 2009 | 2010 | ||||||
| Revenues, net |
$ | 256,761 | $ | 327,294 | ||||
| Expenses: |
||||||||
| Merchant commissions |
28,860 | 39,549 | ||||||
| Processing |
43,099 | 52,608 | ||||||
| Selling |
21,470 | 23,155 | ||||||
| General and administrative |
38,251 | 40,025 | ||||||
| 125,081 | 171,957 | |||||||
| Depreciation and amortization |
20,235 | 25,238 | ||||||
| Operating income |
104,846 | 146,719 | ||||||
| Other income, net |
(369 | ) | (767 | ) | ||||
| Interest expense, net |
13,023 | 16,352 | ||||||
| Total other expense |
12,654 | 15,585 | ||||||
| Income before income taxes |
92,192 | 131,134 | ||||||
| Provision for income taxes |
28,088 | 40,752 | ||||||
| Net income |
64,104 | 90,382 | ||||||
| Calculation of income attributable to common shareholders: |
||||||||
| Convertible preferred stock accrued dividends |
(11,478 | ) | (13,365 | ) | ||||
| Income attributable to common shareholders for basic earnings per share |
$ | 52,626 | $ | 77,017 | ||||
| Earnings per share: |
||||||||
| Basic earnings per share |
$ | 1.56 | $ | 2.26 | ||||
| Diluted earnings per share |
$ | .82 | $ | 1.10 | ||||
| Weighted average shares outstanding: |
||||||||
| Basic weighted average shares outstanding |
33,775 | 34,025 | ||||||
| Diluted weighted average shares outstanding |
77,978 | 82,240 | ||||||
| Pro forma September 30, 2010 earnings per share: |
||||||||
| Net income |
$ | 90,382 | ||||||
| Calculation of income attributable to common shareholders: |
||||||||
| Series D-3 preferred stock dividend |
(7,311 | ) | ||||||
| Income attributable to common shareholders for pro forma basic and diluted earnings per share |
$ | 83,071 | ||||||
| Pro forma basic earnings per share |
$ | 1.07 | ||||||
| Pro forma diluted earnings per share |
$ | 1.01 | ||||||
| Pro forma weighted average shares outstanding: |
||||||||
| Pro forma basic weighted average shares outstanding |
77,600 | |||||||
| Pro forma diluted weighted average shares outstanding |
82,240 | |||||||
See accompanying notes.
F-36
Table of Contents
Index to Financial Statements
FleetCor Technologies, Inc. and subsidiaries
Condensed consolidated statements of cash flows
(Unaudited)
| Nine Months Ended September 30 |
||||||||
| (In thousands) | 2009 | 2010 | ||||||
| Operating activities |
||||||||
| Net income |
$ | 64,104 | $ | 90,382 | ||||
| Adjustments to reconcile net income to net cash provided by operating activities: |
||||||||
| Depreciation |
6,842 | 8,562 | ||||||
| Stock-based compensation |
1,999 | 2,453 | ||||||
| Provision for losses on accounts receivable |
25,424 | 15,097 | ||||||
| Amortization of deferred financing costs |
1,169 | 1,480 | ||||||
| Amortization of intangible assets |
9,782 | 12,749 | ||||||
| Amortization of premium on receivables |
2,442 | 2,447 | ||||||
| Deferred income taxes |
(968 | ) | (3,107 | ) | ||||
| Changes in operating assets and liabilities (net of acquisitions): |
||||||||
| Restricted cash |
(2,263 | ) | 2,052 | |||||
| Accounts receivable |
(31,289 | ) | (60,301 | ) | ||||
| Prepaid expenses and other current assets |
23,071 | (10,969 | ) | |||||
| Other assets |
(967 | ) | (408 | ) | ||||
| Accounts payable, accrued expenses and income taxes and deferred revenue |
50,883 | 46,415 | ||||||
| Net cash provided by operating activities |
150,229 | 106,852 | ||||||
| Investing activities |
||||||||
| Acquisitions, net of cash acquired |
(225,554 | ) | (6,216 | ) | ||||
| Purchases of property and equipment |
(7,524 | ) | (7,074 | ) | ||||
| Net cash used in investing activities |
(233,078 | ) | (13,290 | ) | ||||
| Financing activities |
||||||||
| Proceeds from issuance of common stock |
107 | 480 | ||||||
| Payments on securitization facility, net |
— | (51,000 | ) | |||||
| Deferred financing costs paid |
— | (1,067 | ) | |||||
| Proceeds from issuance of preferred stock |
93,501 | — | ||||||
| Principal payments on notes payable |
(16,961 | ) | (17,585 | ) | ||||
| Principal payments on other obligations |
(444 | ) | (15 | ) | ||||
| Net cash provided by (used in) financing activities |
76,203 | (69,187 | ) | |||||
| Effect of foreign currency exchange rates on cash |
5,310 | 1,697 | ||||||
| Net (decrease) increase in cash |
(1,336 | ) | 26,072 | |||||
| Cash and cash equivalents at beginning of period |
70,355 | 84,701 | ||||||
| Cash and cash equivalents at end of period |
$ | 69,019 | $ | 110,773 | ||||
| Supplemental cash flow information |
||||||||
| Cash paid for interest |
$ | 13,862 | $ | 16,851 | ||||
| Cash paid for income taxes |
$ | 13,382 | $ | 40,604 | ||||
| Adoption of new accounting guidance related to asset securitization facility |
$ | — | $ | 218,000 | ||||
See accompanying notes.
F-37
Table of Contents
Index to Financial Statements
FleetCor Technologies, Inc. and subsidiaries
Notes to condensed consolidated financial statements
1. Basis of presentation
We prepared the accompanying interim condensed consolidated financial statements in accordance with the instructions of Regulation S-X. Accordingly, they do not include all of the information and footnotes required by U.S. generally accepted accounting principles for complete financial statements. The Company believes these condensed consolidated financial statements reflect all adjustments (consisting of only normal recurring accruals) considered necessary for a fair presentation. Operating results for the nine month period ended September 30, 2010 are not necessarily indicative of the results that may be expected for the year ending December 31, 2010. The unaudited condensed consolidated interim financial statements should be read in conjunction with the audited consolidated financial statements and the notes thereto included elsewhere in this prospectus.
Pro forma information (unaudited)
In conjunction with an initial public offering of the Company’s Common Stock, all outstanding shares of Convertible Preferred Stock automatically convert to Common Stock and all previously accrued cumulative dividends are forgiven except a portion of the cumulative dividends related to Series D-3 Convertible Preferred Stock. The shares of Series D-3 Convertible Preferred Stock are entitled to receive three-eighths of cumulative accrued dividends payable in cash. As such, the effect of the conversion, the accrual of the cash dividend and the forgiveness of all other dividends has been reflected in the unaudited pro forma balance sheet at September 30, 2010. Each share of the convertible preferred stock is convertible into one share of common stock.
The effect of the conversion and the payment of the three-eighths of all unpaid Series D-3 prior accruing dividends, has been reflected in the unaudited pro forma earnings per share computations for the nine month period ended September 30, 2010. The computation assumes an offering price of $20 per share.
Subsequent events
The Company evaluated all subsequent events through November 29, 2010 the date of issuance of the Company’s financial statements. No significant events occurred subsequent to the balance sheet date but prior to the issuance of the financial statement that would have a material impact on the Condensed Consolidated Financial Statements.
Comprehensive income (loss)
Comprehensive income (loss) is defined as the total of net income and all other changes in equity that result from transactions and other economic events of a reporting period other than transactions with owners. The Company’s accumulated other comprehensive income (loss) includes foreign currency translation losses of $6.8 million and $11.1 million and the unrealized loss on interest rate swaps of $0.8 million and $4.9 million as of September 30, 2010 and 2009, respectively.
Derivative financial instruments
Derivative financial instruments are generally used to manage certain interest rate risks through the use of interest rate swaps. These instruments, when settled, impact the Company’s cash flows from operations. On the date in which the Company enters into a derivative, the derivative is designated as a hedge of the identified exposure. The Company measures effectiveness of its hedging relationships both at hedge inception and on an ongoing basis.
F-38
Table of Contents
Index to Financial Statements
FleetCor Technologies, Inc. and subsidiaries
Notes to condensed consolidated financial statements (continued)
1. Basis of presentation (continued)
Gains and losses on interest rate swaps designated as cash flow hedges, to the extent that the hedge relationship has been effective, are deferred in other comprehensive income and recognized in interest expense over the period in which the Company recognizes interest expense on the related debt instrument. Any ineffectiveness on these instruments is immediately recognized in interest expense in the period that the ineffectiveness occurs. No significant ineffectiveness was recorded on designated hedges in the nine month periods ended September 30, 2010 and 2009, respectively.
2. Recent accounting pronouncements
The Company maintains a $500 million revolving trade accounts receivable securitization facility (the Facility). Pursuant to the terms of the Facility, the Company transfers its domestic accounts receivable, on a revolving basis, to FleetCor Funding LLC (Funding) a wholly-owned bankruptcy remote subsidiary (qualified special purpose entity or QSPE). In turn, Funding sells, without recourse, on a revolving basis, up to $500 million of undivided ownership interests in this pool of accounts receivable to a multi-seller, asset backed commercial paper conduit (Conduit). Funding maintains a subordinated interest in the form of over collateralization in a portion of the accounts receivable sold to the Conduit. There are no restrictions on the accounts receivable sold. Purchases by the Conduit are financed with the sale of highly-rated commercial paper.
In June 2009, the FASB issued guidance limiting the circumstances in which a financial asset may be derecognized when the transferor has not transferred the entire financial asset or has continuing involvement with the transferred asset. The concept of a qualifying special purpose-entity, which had previously facilitated sale accounting for certain asset transfers, was removed by this guidance. In addition, the guidance also shifts the determination of which enterprise should consolidate a variable interest entity (VIE) to a current control approach, such that an entity that has both the power to make decisions and the right to receive benefits or absorb losses that could potentially be significant to the VIE will consolidate a VIE. The guidance also requires ongoing assessments related to who should consolidate the VIE. These updates were effective as of January 1, 2010.
The Company analyzed the impact of the changes to the accounting guidance and concluded that it should consolidate Funding. The Company concluded it should consolidate this VIE because the Company maintains significant decision-making rights and receives all the benefits or is required to absorb all the losses of Funding. Accordingly, effective January 1, 2010, the Company consolidated its QSPE. Using the carrying amounts of the assets and liabilities of the QSPE as prescribed by the accounting guidance and any corresponding elimination of activity between the QSPE and the Company resulting from the consolidation on January 1, 2010, the Company recorded a $218 million increase in total assets, a $218 million increase in total liabilities and non-cash financing activities of $218 million. Beginning January 1, 2010, the Company’s consolidated balance sheet and statement of income no longer reflect activity related to its retained residual interest in eligible accounts receivable sold to Funding, but instead reflect the activity related to its securitized accounts receivable and the corresponding securitized debt, including interest income, fees generated from late payments, provision for losses on accounts receivable and interest expense. Interest expense and the provision for losses on accounts receivable associated with the securitized accounts receivable are no longer included as a deduction from revenues, net in the consolidated statement of income, resulting in an increase of $21.4 million of revenues, net in the nine month period ended September 30, 2010 compared to the same period in 2009. The cash flows from borrowings and repayments, associated with the securitized debt, are now presented as cash flows from financing activities. The
F-39
Table of Contents
Index to Financial Statements
FleetCor Technologies, Inc. and subsidiaries
Notes to condensed consolidated financial statements (continued)
2. Recent accounting pronouncements (continued)
Company’s consolidated statement of income for the nine month period ended September 30, 2009 and its balance sheet as of December 31, 2009 have not been retrospectively adjusted to reflect the adoption of this accounting guidance. Therefore, current period results and balances will not be comparable to prior period amounts, particularly with regard to accounts receivable, the securitization facility, the provision for losses on accounts receivable, interest expense and revenues, net.
On February 25, 2010, the Company extended the term of its asset securitization facility to February 24, 2011. The Company capitalized $1.1 million in deferred financing fees in connection with this extension.
3. Accounts receivable
The Company utilizes proceeds from the sale of its accounts receivable as an alternative to other forms of debt, effectively reducing its overall borrowing costs. The Company’s continuing involvement with accounts receivable that are sold consists of servicing such receivables for the financial institutions at market rates, which approximates the Company’s cost of servicing and are not significant to the Company’s consolidated financial statements. The assets of Funding consist of certain credit card receivables which are restricted to settle its obligations and are not expected to be available to the Company or its creditors. The liabilities of Funding consist of short term debt obligations for which creditors or beneficial interest holders do not have recourse to the general credit of the Company. The assets and liabilities of Funding approximate fair value due to their short-term nature.
Funding determines the level of funding achieved by the sale of trade accounts receivable, subject to a maximum amount. Prior to the adoption of the new accounting guidance on January 1, 2010, Funding retained a residual interest in the eligible receivables transferred to Funding, such that amounts payable in respect of such residual interest were distributed to Funding upon payment in full of all amounts owed by Funding to the financial institutions.
The Company’s accounts receivable and securitized accounts receivable include the following (in thousands) at September 30, 2010 and December 31, 2009:
| September 30, 2010 |
December 31, 2009 |
|||||||
| Gross domestic receivables |
$ | 148,920 | $ | 36,583 | ||||
| Securitized accounts receivable |
167,000 | — | ||||||
| Residual interest in eligible accounts receivable sold to Funding |
— | 33,184 | ||||||
| Gross foreign receivables |
122,756 | 108,458 | ||||||
| Total gross receivables |
438,676 | 178,225 | ||||||
| Less allowance for doubtful accounts |
(15,042 | ) | (14,764 | ) | ||||
| Net accounts receivable and securitized accounts receivable |
$ | 423,634 | $ | 163,461 | ||||
F-40
Table of Contents
Index to Financial Statements
FleetCor Technologies, Inc. and subsidiaries
Notes to condensed consolidated financial statements (continued)
3. Accounts receivable (continued)
A rollforward of the Company’s allowance for doubtful accounts is as follows for the nine month periods ended September 30 (in thousands):
| Nine Months Ended September 30 |
||||||||
| 2010 | 2009 | |||||||
| Beginning allowance for doubtful accounts |
$ | 14,764 | $ | 10,407 | ||||
| Add: |
||||||||
| Provision for bad debts |
15,097 | 25,424 | ||||||
| Less: |
||||||||
| Write-offs |
(14,819 | ) | (22,720 | ) | ||||
| Ending allowance for doubtful accounts |
$ | 15,042 | $ | 13,111 | ||||
All foreign receivables are Company owned receivables and are not included in securitized accounts receivable and the Company’s accounts receivable securitization program. At September 30, 2010, there was $167 million of short-term debt outstanding under the Company’s accounts receivable securitization facility.
4. Fair value measurements
Accounting principles generally accepted in the U.S. define fair value as the price that would be received to sell an asset or transfer a liability in an orderly transaction between market participants.
As such, fair value is a market-based measurement that should be determined based on assumptions that market participants would use in pricing an asset or liability. The authoritative guidance discusses valuation techniques, such as the market approach (comparable market prices), the income approach (present value of future income or cash flow), and the cost approach (cost to replace the service capacity of an asset or replacement cost). These valuation techniques are based upon observable and unobservable inputs. Observable inputs reflect market data obtained from independent sources, while unobservable inputs reflect the Company’s market assumptions.
As the basis for evaluating such inputs, a three-tier value hierarchy prioritizes the inputs used in measuring fair value as follows:
Level 1: Observable inputs such as quoted prices for identical assets or liabilities in active markets.
Level 2: Observable inputs other than quoted prices that are directly or indirectly observable for the asset or liability, including quoted prices for similar assets or liabilities in active markets; quoted prices for similar or identical assets or liabilities in markets that are not active; and model-derived valuations whose inputs are observable or whose significant value drivers are observable.
Level 3: Unobservable inputs that reflect the reporting entity’s own assumptions.
The Company’s financial assets and liabilities adjusted to fair value consist of its money market fund investments included in cash and cash equivalents and its derivative instruments, which are included in accrued expenses. As the Company adjusts the value of its investments and derivative instruments to fair value each reporting period, no adjustment to retained earnings resulted from the adoption of the authoritative guidance on fair value.
F-41
Table of Contents
Index to Financial Statements
FleetCor Technologies, Inc. and subsidiaries
Notes to condensed consolidated financial statements (continued)
4. Fair value measurements (continued)
The Company determines the fair value of its mutual fund investments based on quoted market prices.
Level 2 fair value determinations are derived from directly or indirectly observable (market based) information. Such inputs are the basis for the fair values of the Company’s derivative instruments. The Company generally uses derivatives for hedging purposes pursuant to the relevant authoritative guidance, and the Company’s derivatives consist of interest rate swaps.
The Company determines the fair value of its derivative instruments based on Level 2 inputs in the fair value hierarchy.
The following tables present the Company’s financial assets and liabilities which are measured at fair value on a recurring basis and that are subject to the disclosure requirements of the authoritative guidance as of September 30, 2010 and December 31, 2009 (in millions):
| Fair Value | Level 1 | Level 2 | Level 3 | |||||||||||||
| September 30, 2010 |
||||||||||||||||
| Assets: |
||||||||||||||||
| Money market fund investments |
$ | 10.6 | $ | 10.6 | $ | — | $ | — | ||||||||
| Total |
$ | 10.6 | $ | 10.6 | $ | — | $ | — | ||||||||
| Liabilities: |
||||||||||||||||
| Interest rate swap |
$ | 1.2 | $ | — | $ | 1.2 | $ | — | ||||||||
| Total |
$ | 1.2 | $ | — | $ | 1.2 | $ | — | ||||||||
| December 31, 2009 |
||||||||||||||||
| Assets: |
||||||||||||||||
| Money market fund investments |
$ | 14.7 | $ | 14.7 | $ | — | $ | — | ||||||||
| Residual interest in eligible receivables sold to the Facility |
— | — | — | 33.2 | ||||||||||||
| Total |
$ | 14.7 | $ | 14.7 | $ | — | $ | 33.2 | ||||||||
| Liabilities: |
||||||||||||||||
| Interest rate swaps |
$ | 6.4 | $ | — | $ | 6.4 | $ | — | ||||||||
| Total |
$ | 6.4 | $ | — | $ | 6.4 | $ | — | ||||||||
The Company’s nonfinancial assets which are measured at fair value on a nonrecurring basis include property, plant and equipment, goodwill and other intangible assets. The Company generally uses projected cash flows, discounted as necessary, to estimate the fair values of the assets using key inputs such as management’s projections of cash flows on a held-and-used basis (if applicable), management’s projections of cash flows upon disposition and discount rates. Accordingly, these fair value measurements fall in level 3 of the fair value hierarchy. These assets and certain liabilities are measured at fair value on a nonrecurring basis as part of the Company’s impairment assessments and as circumstances require.
F-42
Table of Contents
Index to Financial Statements
FleetCor Technologies, Inc. and subsidiaries
Notes to condensed consolidated financial statements (continued)
5. Share based compensation
The Company accounts for stock-based compensation pursuant to relevant authoritative guidance, which requires measurement of compensation cost for all stock awards at fair value on the date of grant and recognition of compensation cost, net of estimated forfeitures, over the requisite service period for awards expected to vest.
The Company has a Stock Incentive Plan (the Plan) pursuant to which the Company’s board of directors may grant stock options or restricted stock to key employees. The Company is authorized to issue grants of restricted stock and options to purchase up to 26,963,150 and 20,213,150 shares as of September 30, 2010 and December 31, 2009, respectively. There were 6,775,007 and 41,570 additional options available for grant under the Plan at September 30, 2010 and December 31, 2009, respectively.
Stock options
Stock options are granted with an exercise price estimated to be greater than or equal to the fair market value on the date of grant. Options granted have vesting provisions ranging from two to four years. Stock option grants are generally subject to forfeiture if employment terminates prior to vesting. All options were granted at estimated fair market value as authorized by the Company’s board of directors.
Restricted stock
Awards of restricted stock and restricted stock units are independent of stock option grants and are generally subject to forfeiture if employment terminates prior to vesting. The vesting of the shares granted in 2009 is contingent on the sale of the Company or a public offering of the Company’s common stock, subject to certain other conditions. With the exception of 830,000 restricted stock awards, awards granted prior to 2009 are fully vested. The remaining 830,000 shares of restricted stock vest upon the sale of the Company or a public offering of the Company’s common stock.
The table below summarizes the compensation expense related to share-based payments for the nine month periods ended September 30 (in thousands):
| 2010 | 2009 | |||||||
| Stock options |
$ | 2,453 | $ | 1,999 | ||||
The tax benefits recorded on stock-based compensation were $527,826 and $509,141 for the nine month periods ended September 30, 2010 and 2009, respectively.
F-43
Table of Contents
Index to Financial Statements
FleetCor Technologies, Inc. and subsidiaries
Notes to condensed consolidated financial statements (continued)
5. Share based compensation (continued)
The following summarizes the changes in the number of shares of common stock under option for the nine month period ended September 30, 2010 (shares and aggregate intrinsic value in thousands):
| Shares | Weighted Average Exercise Price |
Options Period |
Weighted Average Exercise Price of Exercisable Options |
Aggregate Intrinsic Value |
||||||||||||||||
| Outstanding at January 1, 2010 |
8,062 | $ | 7.45 | 5,523 | $ | 5.15 | $ | 70,958 | ||||||||||||
| Granted |
385 | 20.00 | ||||||||||||||||||
| Exercised |
(125 | ) | 4.28 | 1,966 | ||||||||||||||||
| Forfeited |
(387 | ) | 11.61 | |||||||||||||||||
| Outstanding at September 30, 2010 |
7,935 | 7.91 | 6,060 | 6.03 | 84,687 | |||||||||||||||
| Expected to vest as of September 30, 2010 |
7,935 | 7.91 | ||||||||||||||||||
The weighted-average remaining contractual life for options outstanding was .79 years as of September 30, 2010.
The following table summarizes the changes in the number of shares of restricted stock and restricted stock units for the nine month period ended September 30, 2010 (shares in thousands):
| Shares | Weighted Average |
|||||||
| Outstanding at December 31, 2009 |
4,015 | $ | 4.41 | |||||
| Granted |
479 | 20.00 | ||||||
| Cancelled |
(88 | ) | 20.00 | |||||
| Outstanding at September 30, 2010 |
4,406 | $ | 5.29 | |||||
| Vested as of September 30, 2010 |
2,332 | $ | .24 | |||||
F-44
Table of Contents
Index to Financial Statements
FleetCor Technologies, Inc. and subsidiaries
Notes to condensed consolidated financial statements (continued)
6. Goodwill and other intangible assets
Other intangible assets consisted of the following (in thousands):
| September 30, 2010 | December 31, 2009 | |||||||||||||||||||||||||
| Useful Lives (Years) |
Gross Carrying |
Accumulated Amortization |
Net Carrying |
Gross Carrying Amount |
Accumulated Amortization |
Net Carrying Amount |
||||||||||||||||||||
| Customer and vendor agreements |
5 to 20 | $ | 210,806 | $ | (39,168 | ) | $ | 171,638 | $ | 204,617 | $ | (27,741 | ) | $ | 176,876 | |||||||||||
| Trade names and trademarks—indefinite lived |
N/A | 12,626 | — | 12,626 | 12,626 | — | 12,626 | |||||||||||||||||||
| Trade names and trademarks—other |
3 to 15 | 3,160 | (925 | ) | 2,235 | 3,160 | (754 | ) | 2,406 | |||||||||||||||||
| Software |
3 to 10 | 5,530 | (1,990 | ) | 3,540 | 5,530 | (1,111 | ) | 4,419 | |||||||||||||||||
| Noncompete agreements |
2 to 5 | 1,871 | (1,039 | ) | 832 | 1,871 | (768 | ) | 1,103 | |||||||||||||||||
| Total other intangible assets |
$ | 233,993 | $ | (43,122 | ) | $ | 190,871 | $ | 227,804 | $ | (30,374 | ) | $ | 197,430 | ||||||||||||
Amortization expense related to intangible assets for the nine month periods ended September 30, 2010 and 2009 was $12.7 million, and $9.8 million, respectively.
A summary of changes in the Company’s goodwill by reportable business segment is as follows (in thousands):
| December 31, 2009 |
Purchase Price Adjustments |
Foreign Currency |
September 30, 2010 |
|||||||||||||
| North America |
$ | 274,929 | $ | 1,000 | $ | — | $ | 275,929 | ||||||||
| International |
315,407 | 3,599 | (123 | ) | 318,883 | |||||||||||
| $ | 590,336 | $ | 4,599 | $ | (123 | ) | $ | 594,812 | ||||||||
7. Notes payable, credit agreements and securitization facility
The Company’s debt instruments consist primarily of term notes as follows (in thousands):
| September 30, 2010 |
December 31, 2009 |
|||||||
| Term note payable—domestic(a) |
$ | 274,000 | $ | 276,250 | ||||
| Term note payable—foreign(b) |
59,209 | 61,576 | ||||||
| Other debt |
1,117 | 13,725 | ||||||
| Total notes payable |
334,326 | 351,551 | ||||||
| Securitization facility(c) |
167,000 | — | ||||||
| Total notes payable, credit agreements and securitization facility |
$ | 501,326 | $ | 351,551 | ||||
| (a) | The Company entered into a $130 million term loan and a $30 million revolving line of credit on June 29, 2005. On April 30, 2007, the Company amended and restated the facility increasing the term loan to $250 million, increasing the revolving line of credit facility to $50 million and entering into a $50 million delayed draw term loan facility. In April 2008, the Company borrowed the additional $50 million from the delayed |
F-45
Table of Contents
Index to Financial Statements
FleetCor Technologies, Inc. and subsidiaries
Notes to condensed consolidated financial statements (continued)
7. Notes payable, credit agreements and securitization facility (continued)
| draw term loan facility. The revolving line of credit facility is comprised of a $30 million US tranche and a $20 million global tranche and is collateralized by the assets and operations of the respective country where the borrowings are incurred. At September 30, 2010, the Company had no borrowings on the revolving line of credit. Interest on the term loan is payable at a rate per annum equal to the sum of the Base Rate plus 1.25% or the Eurodollar Rate plus 2.25%. Interest on the line of credit ranges from the sum of the Base Rate plus 1.00% to 1.50% or the Eurodollar Rate plus 2.00% to 2.50%. The term loan is payable in quarterly installments of .25% of the initial aggregate principal amount of the loans and is due on the last business day of each March, June, September, and December with the final principal payment due in April 2013. Principal payments of $2.3 million were made on the term loan during the nine month period ended September 30, 2010. |
| (b) | On December 7, 2006, one of the Company’s foreign subsidiaries entered into foreign term loans in the Czech Republic denominated in Czech Koruna. The Facility A term loan was for $47 million and the Facility B term loan was for $33 million. Interest on the Facility A term loan is payable at a rate per annum equal to the sum of PRIBOR (Prague Interbank Offered Rate) plus 1.75% to .95% (2.15% at September 30, 2010). Interest on the Facility B term loan is payable at a rate per annum equal to the sum of PRIBOR plus 2.9% to 2% (3% at September 30, 2010). The Facility A term loan is payable in semiannual payments in June and December of each year beginning in June 2007 and ending in December 2013. The Facility B term loan is payable in a lump sum in December 2014. The outstanding balance of the note payable increased $.7 million in 2010 due to the change in translation in the exchange rate. The term loans have financial covenants, one of which requires the Company to maintain cash and cash equivalents to satisfy a specific liquidity ratio. Principal payments of $3.1 million were made on the Facility A term loan during the nine month period ended September 30, 2010. |
| (c) | The Company is party to a receivables purchase agreement (securitization facility) that was amended and restated for the fourth time as of October 29, 2007 and which has been amended three times since then to add or remove purchasers and to extend the facility termination date. The current purchase limit under the securitization facility is $500 million and the facility termination date is February 24, 2011. Interest on the securitization facility is payable at a rate per annum equal to 1.53% as of September 30, 2010. The unused facility fee is payable at a rate of .60% per annum as of September 30, 2010. The securitization facility provides for certain termination events, upon the occurrence of which the administrator may declare the facility termination date to have occurred, may exercise certain enforcement rights with respect to the receivables, and may appoint a successor servicer, among other things. Termination events include nonpayment, noncompliance with covenants, default under any indebtedness in excess of $10.0 million, the failure to maintain certain ratios related to defaults, delinquencies and dilution, change in control, failure to maintain a leverage ratio of not greater than 2.25 to 1 through December 31, 2010 and 2.00 to 1 for the periods thereafter (measured quarterly), failure to maintain an interest coverage ratio of not less than 4.00 to 1 (measured quarterly) and failure to perform under a performance guaranty. |
The Company was in compliance with all financial covenants at September 30, 2010.
In 2007, the Company entered into an interest rate swap agreement with a notional value of $175 million, which matured in November 2010. The agreement converts a portion of the Company’s variable rate debt exposure to a fixed rate.
The Company records any differences paid or received on this interest rate agreement as adjustments to interest expense over the life of the agreement, which expired in November 2010. This interest rate agreement has been designated as a cash flow hedge and the changes in the fair value of the agreement are recorded to accumulated other comprehensive income. During the nine month period ended September 30, 2010, no gain or loss was recognized on this instrument and there was no effect on income from hedge ineffectiveness. The net difference between interest paid and interest received related to this agreement resulted in a $5.4 million increase in interest expense and $2.2 million in accumulated other comprehensive income for the nine month period ended September 30, 2010.
F-46
Table of Contents
Index to Financial Statements
FleetCor Technologies, Inc. and subsidiaries
Notes to condensed consolidated financial statements (continued)
8. Income taxes
The provision for income taxes differs from amounts computed by applying the U.S. federal tax rate of 35% to income before income taxes for the nine month periods ended September 30, 2010 and 2009 due to the following (dollars in thousands):
| 2010 | 2009 | |||||||
| Computed “expected” tax expense |
$ | 45,897 | $ | 32,267 | ||||
| Changes resulting from: |
||||||||
| Foreign income tax differential |
(6,078 | ) | (4,148 | ) | ||||
| State taxes net of federal benefits |
2,838 | 2,028 | ||||||
| Foreign–sourced nontaxable income |
(1,968 | ) | (2,119 | ) | ||||
| Other |
63 | 60 | ||||||
| Provision for income taxes |
$ | 40,752 | $ | 28,088 | ||||
9. Earnings per share
The Company reports a dual presentation of basic and diluted earnings per share (EPS). Basic EPS is computed by dividing net income attributable to shareholders of the Company by the weighted average number of common shares outstanding during the reported period. Diluted EPS reflects the potential dilution related to equity-based incentives using the if-converted and treasury stock methods, where applicable.
The calculation and reconciliation of basic and diluted earnings per share for the nine months ended September 30 (in thousands, except per share data):
| Nine Months Ended September 30 |
||||||||
| 2010 | 2009 | |||||||
| Numerator for basic earnings per share: |
||||||||
| Net income |
$ | 90,382 | $ | 64,104 | ||||
| Convertible preferred stock accrued dividends |
(13,365 | ) | (11,478 | ) | ||||
| Earnings attributable to common shareholders for basic earnings per share |
77,017 | 52,626 | ||||||
| Numerator for diluted earnings per share: |
||||||||
| Income attributable to common shareholders for basic earnings per share |
77,017 | 52,626 | ||||||
| Net earnings for diluted earnings per share |
90,382 | 64,104 | ||||||
| Denominator for basic and diluted earnings per share: |
||||||||
| Weighted-average shares outstanding |
32,222 | 32,612 | ||||||
| Shared-based payment awards classified as participating securities |
1,803 | 1,163 | ||||||
| Denominator for basic earnings per share: |
34,025 | 33,775 | ||||||
| Dilutive securities |
4,640 | 3,430 | ||||||
| Convertible preferred stock |
43,575 | 40,773 | ||||||
| Denominator for diluted earnings per share: |
82,240 | 77,978 | ||||||
| Basic earnings per share |
$ | 2.26 | $ | 1.56 | ||||
| Diluted earnings per share |
$ | 1.10 | $ | .82 | ||||
F-47
Table of Contents
Index to Financial Statements
FleetCor Technologies, Inc. and subsidiaries
Notes to condensed consolidated financial statements (continued)
10. Segments
The Company reports information about its operating segments in accordance with the authoritative guidance related to segments. The Company’s reportable segments represent components of the business for which separate financial information is evaluated regularly by the chief operating decision maker in determining how to allocate resources and in assessing performance. The Company operates in two reportable segments, North America and International. The Company has identified these segments due to commonality of the products in each of their business lines having similar economic characteristics, services, customers and processes. There were no significant inter-segment sales.
The Company’s segment results are as follows for the nine month periods ended September 30 (in thousands):
| Nine Months Ended September 30 |
||||||||
| 2010 | 2009 | |||||||
| Revenues, net |
||||||||
| North America |
$ | 219,447 | $ | 167,002 | ||||
| International |
107,847 | 89,759 | ||||||
| $ | 327,294 | $ | 256,761 | |||||
| Operating income |
||||||||
| North America |
$ | 95,185 | $ | 65,978 | ||||
| International |
51,534 | 38,868 | ||||||
| $ | 146,719 | $ | 104,846 | |||||
| Depreciation and amortization |
||||||||
| North America |
$ | 15,251 | $ | 11,381 | ||||
| International |
9,987 | 8,854 | ||||||
| $ | 25,238 | $ | 20,235 | |||||
| Capital expenditures |
||||||||
| North America |
$ | 4,860 | $ | 4,166 | ||||
| International |
2,214 | 3,358 | ||||||
| $ | 7,074 | $ | 7,524 | |||||
Long lived assets by operating segment are as follows (in thousands):
| September 30, 2010 |
December 31, 2009 |
|||||||
| Long lived assets (excluding goodwill) |
||||||||
| North America |
$ | 114,315 | $ | 121,519 | ||||
| International |
146,753 | 150,448 | ||||||
| $ | 261,068 | $ | 271,967 | |||||
F-48
Table of Contents
Index to Financial Statements
FleetCor Technologies, Inc. and subsidiaries
Notes to condensed consolidated financial statements (continued)
10. Segments (continued)
The table below presents revenues related to the Company’s significant foreign operations for the nine month periods ended September 30 (in thousands):
| Nine Months Ended September 30 |
||||||||
| 2010 | 2009 | |||||||
| Revenues, net |
||||||||
| Czech Republic |
$ | 39,224 | $ | 36,929 | ||||
| United Kingdom |
57,975 | 41,084 | ||||||
For the nine month periods ended September 30, 2010 and 2009, two customers represented 30.5% and 24.0%, respectively of the Company’s net revenues in North America.
Revenues, net in North America for the nine month periods ended September 30, 2010 and 2009 were predominately generated in the United States.
The table below presents long-lived assets related to the Company’s significant foreign operations (in thousands):
| September 30, 2010 |
December 31, 2009 |
|||||||
| Long-lived assets (excluding goodwill) |
||||||||
| Czech Republic |
$ | 57,057 | $ | 59,475 | ||||
| United Kingdom |
66,240 | 66,322 | ||||||
11. Subsequent event
On November 29, 2010, the Company amended its certificate of incorporation to increase the authorized common stock to 130,000,000 shares, retain the par value of .001 per share, and to provide for a two and one-half-for-one Common Stock split. All common share and per common share amounts within the consolidated financial statements and footnotes have been adjusted for all periods to reflect the stock split.
F-49
Table of Contents
Index to Financial Statements
The Board of Directors
CLC Group, Inc. and subsidiaries:
We have audited the accompanying consolidated balance sheet of CLC Group, Inc. and subsidiaries (the Company) as of December 31, 2008, and the related consolidated statements of operations, stockholders’ equity, and cash flows for the year then ended. These consolidated financial statements are the responsibility of the Company’s management. Our responsibility is to express an opinion on these consolidated financial statements based on our audit.
We conducted our audit in accordance with auditing standards generally accepted in the United States of America. Those standards require that we plan and perform the audit to obtain reasonable assurance about whether the financial statements are free of material misstatement. An audit includes consideration of internal control over financial reporting as a basis for designing audit procedures that are appropriate in the circumstances, but not for the purpose of expressing an opinion on the effectiveness of the Company’s internal control over financial reporting. Accordingly, we express no such opinion. An audit also includes examining, on a test basis, evidence supporting the amounts and disclosures in the financial statements, assessing the accounting principles used and significant estimates made by management, as well as evaluating the overall financial statement presentation. We believe that our audit provides a reasonable basis for our opinion.
In our opinion, the consolidated financial statements referred to above present fairly, in all material respects, the financial position of CLC Group, Inc. and subsidiaries as of December 31, 2008, and the results of their operations and their cash flows for the year then ended in conformity with U.S. generally accepted accounting principles.
/s/ KPMG LLP
Kansas City, Missouri
April 1, 2009
F-50
Table of Contents
Index to Financial Statements
CLC Group, Inc. and subsidiaries
Consolidated balance sheet
December 31, 2008
(Dollars in thousands)
| Assets | ||||
| Current assets: |
||||
| Cash and cash equivalents |
$ | 13,675 | ||
| Accounts receivable, less allowance of $60 as of December 31, 2008 |
25,096 | |||
| Deferred tax assets |
1,061 | |||
| Other current assets |
1,245 | |||
| Total current assets |
41,077 | |||
| Property, equipment, and capitalized software, net |
2,624 | |||
| Debt issuance costs, net of accumulated amortization |
29 | |||
| Goodwill |
43,440 | |||
| Identifiable intangible assets, net of accumulated amortization |
12,864 | |||
| Other |
27 | |||
| Total assets |
$ | 100,061 | ||
| Liabilities and Stockholders’ Equity | ||||
| Current liabilities: |
||||
| Accounts payable |
$ | 22,084 | ||
| Accrued liabilities |
4,632 | |||
| Income tax payable |
1,812 | |||
| Current portion of long-term debt |
25,400 | |||
| Total current liabilities |
53,928 | |||
| Deferred tax liabilities |
4,765 | |||
| Total liabilities |
58,693 | |||
| Stockholders’ equity: |
||||
| Common stock, $0.001 par value. Authorized 160,000 shares; issued and outstanding 58,023 shares |
— | |||
| Additional paid-in capital |
4,313 | |||
| Retained earnings |
37,055 | |||
| Total stockholders’ equity |
41,368 | |||
| Total liabilities and stockholders’ equity |
$ | 100,061 | ||
See accompanying notes to consolidated financial statements.
F-51
Table of Contents
Index to Financial Statements
CLC Group, Inc. and subsidiaries
Consolidated statement of operations
Year ended December 31, 2008
(Dollars in thousands)
| Fee revenue |
$ | 58,615 | ||
| Less: |
||||
| Operating expenses |
25,828 | |||
| Depreciation and amortization |
2,890 | |||
| Management fee to related party |
500 | |||
| Income from operations |
29,397 | |||
| Other income (expense): |
||||
| Interest income |
245 | |||
| Interest expense |
(2,226 | ) | ||
| Other |
(82 | ) | ||
| Total other expense |
(2,063 | ) | ||
| Income before taxes |
27,334 | |||
| Provision for income taxes |
10,812 | |||
| Net income |
$ | 16,522 | ||
See accompanying notes to consolidated financial statements.
F-52
Table of Contents
Index to Financial Statements
CLC Group, Inc. and subsidiaries
Consolidated statement of stockholders’ equity
Year ended December 31, 2008
(Dollars in thousands)
| Common stock |
Additional paid-in capital |
Retained earnings |
Total stockholders’ equity |
|||||||||||||
| Balance at December 31, 2007 |
$ | — | $ | 4,313 | $ | 20,533 | $ | 24,846 | ||||||||
| Net income |
— | — | 16,522 | 16,522 | ||||||||||||
| Balance at December 31, 2008 |
$ | — | $ | 4,313 | $ | 37,055 | $ | 41,368 | ||||||||
See accompanying notes to consolidated financial statements.
F-53
Table of Contents
Index to Financial Statements
CLC Group, Inc. and subsidiaries
Consolidated statement of cash flows
Year ended December 31, 2008
(Dollars in thousands)
| Cash flows from operating activities: |
||||
| Net income |
$ | 16,522 | ||
| Adjustments to reconcile net income to net cash provided by operating activities: |
||||
| Depreciation and amortization |
2,890 | |||
| Amortization of debt issue costs |
200 | |||
| Deferred income taxes |
276 | |||
| Change in assets and liabilities: |
||||
| Accounts receivable |
(9,715 | ) | ||
| Other current assets |
(1,042 | ) | ||
| Accounts payable |
1,094 | |||
| Accrued liabilities |
2,684 | |||
| Income tax receivable/payable |
1,926 | |||
| Net cash provided by operating activities |
14,835 | |||
| Cash flows from investing activity: |
||||
| Purchase of property, equipment, and capitalized software |
(2,424 | ) | ||
| Net cash used in investing activity |
(2,424 | ) | ||
| Cash flows from financing activities: |
||||
| Borrowings under revolving credit facility |
3,600 | |||
| Repayments under revolving credit facility |
(6,350 | ) | ||
| Repayments of long-term debt |
(3,600 | ) | ||
| Net cash used in financing activities |
(6,350 | ) | ||
| Net increase in cash and cash equivalents |
6,061 | |||
| Cash and cash equivalents at beginning of year |
7,614 | |||
| Cash and cash equivalents at end of year |
$ | 13,675 | ||
| Supplemental disclosures of cash flow information: |
||||
| Cash paid during the year for interest |
$ | 2,237 | ||
| Cash paid during the year for income taxes |
8,606 | |||
See accompanying notes to consolidated financial statements.
F-54
Table of Contents
Index to Financial Statements
CLC Group, Inc. and subsidiaries
Notes to consolidated financial statements
December 31, 2008
(Dollars in thousands, except share data)
(1) Summary of significant accounting policies
(a) Nature of formation/operations
CLC Group, Inc. (CLCG) (the Company), formerly known as Corporate Lodging Holdings, Inc., and its wholly owned subsidiary, CLC Services, Inc. (CLCS), formerly known as Corporate Lodging, Inc., were formed on June 10, 2003 for the sole purpose of acquiring Corporate Lodging Consultants, Inc. (CLC); Crew Transport Services, Inc. (CTS); and Crew Transportation Specialists, Inc. (CTSI) from their sole shareholder. The Company commenced operations with the closing of the purchase transaction (the Transaction) on June 18, 2003.
CLC provides lodging management services to customers for a transaction fee. Services of CLC include the negotiation of hotel room rates and the processing of hotel stay transactions. CLC also provides nonlodging vendor management and payment processing services. CTSI provides transportation management services, including negotiation of transportation rates and processing transaction, to its customers for a fee. CTS has been inactive since February 2006.
On April 1, 2009, the stockholders signed a stock purchase agreement to sell 100% of the outstanding shares to Fleetcor Technologies Operating Company, LLC. On the same day, all outstanding debt was repaid as part of the closing. The sale resulted in additional vesting of options under the 2003 Stock Option/Stock Issuance Plan and a cash bonus payable under the 2006 Management Bonus Plan.
(b) Principles of consolidation
The consolidated financial statements include CLCG and its wholly owned subsidiaries, CLCS, CLC, CTS, and CTSI. Intercompany accounts and transactions have been eliminated in consolidation.
(c) Cash and cash equivalents
For purposes of the consolidated statement of cash flows, the Company considers all highly liquid investments with original maturities of three months or less to be cash equivalents. Cash and cash equivalents include $19,566 of overnight repurchase agreements at December 31, 2008.
(d) Accounts receivable
Accounts receivable are recorded at the invoiced amount and do not bear interest. The allowance for doubtful accounts is the Company’s best estimate of the amount of probable credit losses to the Company in the Company’s existing accounts receivable based upon historical experience, the current receivable aging, and knowledge of specific customer issues. The Company’s customers are primarily in the railroad and trucking industries or U.S. government agencies and are affected by general economic activity in the United States. Net write-offs for 2008 were $116.
(e) Revenue recognition
The Company contracts with customers to provide them with lodging and transportation management services, which includes both negotiation of rates and administration of the billings. Revenue is recognized when the
F-55
Table of Contents
Index to Financial Statements
CLC Group, Inc. and subsidiaries
Notes to consolidated financial statements (continued)
December 31, 2008
(Dollars in thousands, except share data)
lodging or transportation services are completed. The Company also provides certain services to vendors for a fee, which is recognized at the time services are performed.
The Company contracts with lodging and transportation vendors to supply the lodging or transportation. Upon receipt of an invoice from a vendor for the cost of the lodging or transportation, the Company invoices its customers for the cost of the lodging or transportation plus the transaction fee. Generally, the Company only pays vendors after receipt of payment by the customer. The Company’s contracts with vendors typically provide that the Company will process payments received from customers, but that the Company is not ultimately responsible for noncollection from customers. As a result, the Company recognizes the transaction fee as net revenue in accordance with Emerging Issues Task Force (EITF) Issue No. 99-19, Reporting Revenue Gross as a Principal versus Net as an Agent.
In addition, the Company provides vendor management and payment processing services on a project basis. In 2007, the Company entered into a two-year contract to provide program administration and transaction processing services in support of a federal government program sponsored by the National Telecommunication and Information Association (NTIA). The Company has concluded that the contract deliverables do not meet the separation criteria and, therefore, treats the deliverables as a single element, in accordance with EITF Issue No. 00-21, Revenue Arrangements with Multiple Deliverables. Revenue is recognized when the services are provided and the payment amount is not contingent on any future event. As of December 31, 2008, $1,903 of deferred revenue related to the program is included in accrued liabilities on the consolidated balance sheet.
(f) Property, equipment, and capitalized software
Property, equipment, and capitalized software are stated at cost. Additions of new equipment and software are capitalized. Repairs and minor replacements, as well as incremental software modifications that do not materially increase values or extend useful lives, are charged to expense.
Depreciation or amortization is computed on the straight-line method over the estimated useful lives of the related assets, as follows:
| Years | ||||
| Office, furniture, and equipment |
3 – 7 | |||
| Software and software development |
2 – 5 | |||
| Leasehold improvements |
5 | |||
Leasehold improvements are amortized over the shorter of the estimated useful life of improvements and the lease term, which is 5 years.
Certain internal and external costs incurred in connection with developing or obtaining software for internal use are capitalized in accordance with the American Institute of Certified Public Accountants’ Statement of Position No. 98-1, Accounting for the Costs of Computer Software Developed or Obtained for Internal Use. These capitalized costs are included in property, plant, and equipment and are subject to amortization over their estimated useful lives, beginning when the software project is put in service. The Company periodically reviews the lives and values of its capitalized software and makes adjustments if necessary.
F-56
Table of Contents
Index to Financial Statements
CLC Group, Inc. and subsidiaries
Notes to consolidated financial statements (continued)
December 31, 2008
(Dollars in thousands, except share data)
(g) Debt issuance costs
Debt issuance costs are being amortized over the life of the corresponding debt on a straight-line basis, which approximates the effective-interest method.
(h) Goodwill and other intangible assets
Goodwill represents the excess of the purchase price over the fair value of assets acquired and liabilities assumed in a purchase business combination. The goodwill is assigned to CLC and is deductible for income tax purposes.
The Company adopted Statement of Financial Accounting Standards (SFAS) No. 142, Goodwill and Other Intangible Assets, at its inception on June 18, 2003. SFAS No. 142 requires that goodwill no longer be amortized, but instead tested for impairment at least annually in accordance with the provisions of SFAS No. 142. Accordingly, the Company has not recorded any goodwill amortization. During 2008, the Company performed its annual impairment review of goodwill and concluded that there was no impairment.
(i) Long-lived assets
In accordance with SFAS No. 144, Accounting for the Impairment or Disposal of Long-Lived Assets, purchased intangibles subject to amortization and long-lived assets, such as property, equipment, and capitalized software, are reviewed for impairment whenever events or changes in circumstances indicate that the carrying amount of an asset may not be recoverable. Recoverability of assets to be held and used is measured by a comparison of the carrying amount of an asset to estimated undiscounted future cash flows expected to be generated by the asset. If the carrying amount of an asset exceeds its estimated future cash flows, an impairment charge is recognized by the amount by which the carrying amount of the asset exceeds the fair value of the asset.
(j) Income taxes
The Company and its subsidiaries file consolidated federal tax returns. The Company also files and pays income taxes in Kansas, Virginia, and Connecticut. Deferred tax assets and liabilities are recognized for the future tax consequences attributable to differences between the consolidated financial statement carrying amounts of existing assets and liabilities and their respective tax bases. Deferred tax assets and liabilities are measured using enacted tax rates expected to apply to taxable income in the years in which those temporary differences are expected to be recovered or settled. The effect on deferred tax assets and liabilities for a change in tax rates is recognized in income in the period that includes the enactment date. Valuation allowances are provided for deferred tax assets where it is considered more likely than not that the Company will not realize the benefit of such assets.
(k) Stock option plan
Effective January 1, 2006, the Company adopted Financial Accounting Standards Board (FASB) Statement No. 123(R), Share-Based Payment (SFAS 123(R)). This statement replaces FASB Statement No. 123, Accounting for Stock-Based Compensation (SFAS 123), and supersedes Accounting Principles Board (APB) Opinion No. 25, Accounting for Stock Issued to Employees. SFAS 123(R) requires that all stock-based
F-57
Table of Contents
Index to Financial Statements
CLC Group, Inc. and subsidiaries
Notes to consolidated financial statements (continued)
December 31, 2008
(Dollars in thousands, except share data)
compensation be recognized as an expense in the financial statements and that such cost be measured at the fair value of the award. As the Company previously used the minimum value method, as defined by SFAS 123, for purposes of measuring the fair value of share options, SFAS 123(R) was adopted using the prospective method of application, which requires the Company to recognize compensation cost on a prospective basis. Under this method, the Company did not record stock-based compensation expense for awards granted prior to, but not yet vested as of, January 1, 2006, using the fair value amounts estimated under SFAS 123. For stock-based awards granted after January 1, 2006, the Company computes compensation expense based on estimated grant date fair value using the Black-Scholes option valuation model. However, this compensation expense was immaterial and, therefore, not recorded.
(l) Foreign currency transactions
The Company has certain customers and vendors located in Canada with which it transacts business in Canadian currency. The Company maintains bank accounts in Canada in connection with this business. Gains and losses resulting from transactions denominated in a foreign currency are included in income at the time of the transactions and were insignificant in 2008.
(m) Comprehensive income
The Company’s comprehensive income consists of net income, as there is no other comprehensive income.
(n) Use of estimates
The preparation of the consolidated financial statements in conformity with accounting principles generally accepted in the United States of America requires the Company to make estimates and assumptions that affect the reported amounts of assets and liabilities and the disclosures of contingent assets and liabilities at the date of the consolidated financial statements and the reported amounts of revenues and expenses during the reporting period. Actual results could differ from those estimates.
(o) Commitments and contingencies
Liabilities for loss contingencies arising from claims, assessments, litigation, fines and penalties, and other sources are recorded when it is probable that a liability has been incurred and the amount of the assessment and/or remediation can be reasonably estimated. Legal costs incurred in connection with loss contingencies are expensed as incurred.
(p) Recently issued accounting standards
FASB Interpretation No. (FIN) 48, Accounting for Uncertainty in Income Taxes—an Interpretation of FASB Statement No. 109.
FIN 48 clarifies the accounting for uncertainty in income taxes recognized in a company’s financial statements. It prescribes a recognition of a tax position threshold and measurement attributes for financial statement recognition and measurement of a tax position taken or expected to be taken in a tax return. On December 30,
F-58
Table of Contents
Index to Financial Statements
CLC Group, Inc. and subsidiaries
Notes to consolidated financial statements (continued)
December 31, 2008
(Dollars in thousands, except share data)
2008, the FASB issued FASB Staff Position (FSP) 48-3, Effective Date of FASB Interpretation No. 48 for Certain Nonpublic Enterprises, which deferred the effective date of FIN 48 for nonpublic entities that have not already issued a complete set of financial statements fully reflecting the FIN 48 requirements. As a result, the provisions of FIN 48 are effective for the 2009 fiscal year with cumulative effective of the change in accounting principle recorded as an adjustment to opening balance of retained earnings. The Company does not expect the adoption of FIN 48 to have a significant impact.
(2) Property, equipment, and capitalized software
Property, equipment, and capitalized software consist of the following at December 31, 2008:
| Leasehold improvements |
$ | 1,637 | ||
| Office, furniture, and equipment |
1,640 | |||
| Software and software development |
797 | |||
| 4,074 | ||||
| Less accumulated depreciation and amortization |
1,450 | |||
| $ | 2,624 | |||
Depreciation and amortization expense with respect to property, equipment, and capitalized software for the year ended December 31, 2008 amounted to $817.
(3) Identifiable intangible assets
The Company has identifiable intangible assets consisting of the following as of December 31, 2008:
| Gross carrying amount |
Weighted average amortization period |
Accumulated amortization |
||||||||||
| Amortizing intangible assets: |
||||||||||||
| Customer relationships |
$ | 22,000 | 12 years | $ | 10,144 | |||||||
| Software |
1,600 | 12 years | 738 | |||||||||
| Noncompetition agreements |
700 | 7 years | 553 | |||||||||
| Tradename |
130 | 5 years | 130 | |||||||||
| Total |
$ | 24,430 | $ | 11,565 | ||||||||
Aggregate amortization expense for amortizing intangible assets was $2,079 for the year ended December 31, 2008. Estimated amortization expense for the next five years is $2,067 in 2009, $2,013 in 2010, $1,967 in 2011, $1,967 in 2012, and $1,967 in 2013.
F-59
Table of Contents
Index to Financial Statements
CLC Group, Inc. and subsidiaries
Notes to consolidated financial statements (continued)
December 31, 2008
(Dollars in thousands, except share data)
(4) Debt
Debt at December 31, 2008 consists of the following:
| Senior term loan, due June 30, 2009 |
$ | 25,400 | ||
| Revolving credit facility, due June 30, 2009 |
— | |||
| Total debt |
25,400 | |||
| Less current portion |
25,400 | |||
| Long-term debt |
$ | — | ||
The senior term loan and the revolving credit facility (the Loans) are secured by substantially all of the assets of the Company’s subsidiaries and the repayment of the Loans is guaranteed by CLCG. The Loans mature on June 30, 2009. The senior term loan requires quarterly principal payments and mandatory prepayments under certain circumstances. The credit agreement requires the Company to comply with certain covenants, including the maintenance of certain financial ratios. The financial covenants include maintaining a maximum leverage ratio of 2.75 to 1, a minimum fixed charge coverage ratio of 1.10 to 1, and a minimum interest coverage ratio of 3.75 to 1, and also restricting capital expenditures to $1,500 per year plus carryforward amounts from the prior years. These ratios change in future years in which some become more restrictive. The Loans bear interest at the Borrowers’ option at either (i) LIBOR plus 2.75% (3.26% at December 31, 2008) or (ii) prime rate plus 1.50% (4.75% at December 31, 2008). The Borrowers must pay a commitment fee of 1/2% per annum on the unused portion of the revolving credit facility.
(5) Income taxes
Income tax expense consists of the following for the year ended December 31, 2008:
| Current | Deferred | Total | ||||||||||
| U.S. federal |
$ | 8,661 | $ | 250 | $ | 8,911 | ||||||
| State and local |
1,875 | 26 | 1,901 | |||||||||
| $ | 10,536 | $ | 276 | $ | 10,812 | |||||||
Income tax expense was $10,812 for the year ended December 31, 2008, and differed from the amounts computed by applying the U.S. federal income tax rate of 35% to income before taxes as a result of the following:
| Computed “expected” tax expense |
$ | 9,566 | ||
| Increase in income taxes resulting from: |
||||
| State and local income taxes, net of federal income tax benefit |
1,236 | |||
| Other, net |
10 | |||
| $ | 10,812 | |||
F-60
Table of Contents
Index to Financial Statements
CLC Group, Inc. and subsidiaries
Notes to consolidated financial statements (continued)
December 31, 2008
(Dollars in thousands, except share data)
The tax effects of temporary differences that give rise to significant portions of the deferred tax assets and deferred tax liabilities at December 31, 2008 are presented below:
| Deferred tax assets: |
||||
| Accrued liabilities |
$ | 1,814 | ||
| Allowance for bad debt |
24 | |||
| Total gross deferred tax assets |
1,838 | |||
| Deferred tax liabilities: |
||||
| Other current assets |
344 | |||
| Goodwill and identifiable intangibles |
5,088 | |||
| Property, equipment, and capitalized software |
110 | |||
| Total gross deferred tax liabilities |
5,542 | |||
| Net deferred tax liability |
$ | 3,704 | ||
The Company is required to establish a valuation allowance for any portion of the gross deferred tax asset that management believes will not be realized. In the opinion of management, it is more likely than not the Company will realize the benefit of the deferred income tax assets through deductions against future earnings and, therefore, no such allowance has been established.
The Company utilizes a FASB Statement No. 5, Accounting for Contingencies, analysis to quantify uncertain tax positions and accrue tax accordingly. The Company has determined that there are no such accruals necessary.
(6) Leases
The Company leases two offices located in Overland Park and Wichita, Kansas. The Overland Park lease expires in October 2011 and monthly rental payments total approximately $7. The Wichita lease expires in July 2013. Monthly rental payments under the Wichita lease total approximately $45, which include all charges for operating expenses such as maintenance, taxes, insurance, and utilities. In accordance with the terms of the lease, the monthly rental payments are subject to annual adjustment based on changes in certain operating expenses.
Future minimum lease payments under noncancelable operating leases (with initial or remaining lease terms in excess of one year) as of December 31, 2008 are:
| Year ending December 31: |
||||
| 2009 |
$ | 659 | ||
| 2010 |
661 | |||
| 2011 |
649 | |||
| 2012 |
580 | |||
| 2013 |
484 | |||
| Thereafter |
— | |||
| Total minimum future lease payments |
$ | 3,033 | ||
F-61
Table of Contents
Index to Financial Statements
CLC Group, Inc. and subsidiaries
Notes to consolidated financial statements (continued)
December 31, 2008
(Dollars in thousands, except share data)
Minimum rent payments under operating leases are recognized on a straight-line basis over the term of the lease including any periods of free rent. A leasehold improvement allowance received from the landlord is recorded as a deferred rent credit and is amortized over the term of the lease. As of December 31, 2008, $1,093 of leasehold improvement allowance is included in accrued liabilities on the consolidated balance sheet. Rental expense for the year ended December 31, 2008 amounted to $577 and is included in operating expenses in the consolidated statement of operations.
(7) Common stock
Holders of common stock are entitled to one vote per share, and to receive dividends, and upon liquidation or dissolution, are entitled to receive all assets available for distribution to stockholders.
(8) Related-party transactions
The Company pays a management fee of $500 per year, payable quarterly in arrears, to Nautic Partners V, LP and its affiliates (Nautic). Nautic is a holder of a majority of the Company’s common stock. Included in accrued liabilities for December 31, 2008 is $125 representing the management fee due for the fourth quarter of the year.
Barry Downing, previous owner of CLC, CTS, and CTSI, has ongoing relationships with the Company. As of December 31, 2008, he holds 10,000 shares of common stock in CLC Group, Inc. He serves as chairman of the Company’s board of directors. He is also a minority owner of Lodging Enterprises, Inc. (LEI). LEI is an owner of various hotel facilities, which the Company does business under a marketing agreement. In 2008, the Company derived fee revenue of approximately $526 from LEI.
(9) Commitments and contingencies
The Company is subject to various legal proceedings and claims that arise in the ordinary course of business. In the opinion of management, the ultimate disposition of these matters will not have a material adverse effect on the Company’s consolidated financial position, results of operations, or liquidity.
At December 31, 2008, the Company had a reserve of $1,476 recorded in accrued liabilities in the consolidated balance sheets, which is intended to cover any liabilities or future costs associated with the wind-down of certain lodging programs operated for FEMA. The reserve is management’s best estimate based on the volume of business conducted and the results of similar previous programs for any potential future liabilities for this FEMA program.
(10) Concentration of risk
Since October 2005, the Company has entered into various contracts with the FEMA. These contracts last for various durations, and in certain cases, provide the government with unilateral extension options. For the year ended December 31, 2008, the Company derived 11% of its revenue from FEMA. Included in accounts receivable at year end was $862 due from FEMA. In 2007, the Company entered into a two-year contract to provide multiple deliverables for financial processing and other services in support of a federal government program sponsored by the NTIA. For the year ended December 31, 2008, the Company derived 49% of its revenues from the NTIA program contract. Included in accounts receivable at year end was $5,418 related to the NTIA program contract.
F-62
Table of Contents
Index to Financial Statements
CLC Group, Inc. and subsidiaries
Notes to consolidated financial statements (continued)
December 31, 2008
(Dollars in thousands, except share data)
(11) Stock option plans
On June 18, 2003, the board of directors approved the 2003 Stock Option/Stock Issuance Plan (the Stock Plan) under which stock options may be granted to employees. The Stock Plan authorizes the grants of options to purchase up to 10,229 shares of authorized but unissued common stock. The Stock Plan is divided into two separate equity programs: (i) the Option Grant Program under which eligible persons may, at the discretion of the Plan administrator, be granted options to purchase shares of common stock and (ii) the Stock Issuance Program under which eligible persons may be issued shares of common stock directly, either through the immediate purchase of such shares or as a bonus for services rendered the Company or any subsidiary. The Option Grant Program is the only program out of which options have been granted. The term of the stock options granted is 10 years. The vesting period provides that 50% of the options vest in equal installments over five years, beginning the first anniversary of option grant date. The remaining 50% will vest only upon consummation of an initial public offering of the Company or upon the occurrence of a change in control of the Company. Upon termination of service from the Company, the option holder has three months from the date of termination to exercise its options. After three months, any unexercised options are automatically forfeited.
No options for shares were issued in 2008. Prior to adoption of SFAS 123(R), the Company recorded no compensation expense, as the exercise price of the options was greater than the estimated fair value of the common stock at the date of grant. All of the options have an exercise price of $606.
A summary of the status of the Company’s stock option plan as of December 31, 2008 and changes during the year then ended is presented below:
| Options | Number of shares |
Weighted average remaining contractual term |
||||||
| Outstanding at beginning of year |
6,543 | |||||||
| Granted |
— | |||||||
| Forfeited |
(60 | ) | ||||||
| Exercised |
— | |||||||
| Outstanding at end of year |
6,483 | 5.0 years | ||||||
| Options exercisable at year-end |
3,025 | 4.9 years | ||||||
(12) Management bonus plan
Effective November 1, 2006, the board of directors approved the 2006 Management Bonus Plan (Bonus Plan) to provide a means by which key employees of the Company may be given an opportunity to participate in the proceeds of a “corporate transaction,” which is defined as a merger, consolidation, exchange, conveyance, or sale of the Company or if the Company completes a public offering pursuant to the Securities Act of 1933, as amended. Upon the consummation of a corporate transaction, each participant shall become entitled to receive a cash bonus payment calculated in accordance with the Bonus Plan. As management did not deem a qualifying transaction probable as of December 31, 2008, no amounts have been recorded in the consolidated financial statements.
F-63
Table of Contents
Index to Financial Statements
CLC Group, Inc. and subsidiaries
Condensed consolidated balance sheets
(Unaudited)
| (In thousands, except share and par value amounts) | * December 31, 2008 |
March 31, 2009 |
||||||
| Assets |
||||||||
| Current assets: |
||||||||
| Cash and cash equivalents |
$ | 13,675 | $ | 21,231 | ||||
| Accounts receivable (less allowance for doubtful accounts of $60 and $80, at 2008 and 2009, respectively) |
25,096 | 19,227 | ||||||
| Other current assets |
1,245 | 1,261 | ||||||
| Deferred and accrued income taxes |
1,061 | 1,191 | ||||||
| Total current assets |
41,077 | 42,910 | ||||||
| Property, equipment, and capitalized software, net |
2,624 | 2,528 | ||||||
| Goodwill |
43,440 | 43,440 | ||||||
| Other intangibles, net |
12,864 | 12,348 | ||||||
| Other assets |
56 | 42 | ||||||
| Total assets |
$ | 100,061 | $ | 101,268 | ||||
| Liabilities and stockholders’ equity |
||||||||
| Current liabilities: |
||||||||
| Accounts payable |
$ | 22,084 | $ | 17,548 | ||||
| Accrued expenses |
6,444 | 7,263 | ||||||
| Current portion of notes payable and other obligations |
25,400 | 25,400 | ||||||
| Total current liabilities |
53,928 | 50,211 | ||||||
| Deferred income taxes |
4,765 | 5,006 | ||||||
| Total liabilities |
58,693 | 55,217 | ||||||
| Stockholders’ equity: |
||||||||
| Common stock, $0.001 par value. Authorized 160,000; issued and outstanding 58,023 shares |
— | — | ||||||
| Additional paid-in capital |
4,313 | 4,313 | ||||||
| Retained earnings |
37,055 | 41,738 | ||||||
| Total stockholders’ equity |
41,368 | 46,051 | ||||||
| Total liabilities and stockholders’ equity |
$ | 100,061 | $ | 101,268 | ||||
See accompanying notes.
| * | Derived from the audited consolidated balance sheet. |
F-64
Table of Contents
Index to Financial Statements
CLC Group, Inc. and subsidiaries
Condensed consolidated statements of income
(Unaudited)
| Quarter ended March 31 | ||||||||
| (In thousands, except share amounts) | 2008 | 2009 | ||||||
| Fee revenue |
$ | 11,782 | $ | 16,308 | ||||
| Operating expenses |
4,757 | 7,186 | ||||||
| Management fee to related party |
125 | 132 | ||||||
| Depreciation and amortization |
737 | 790 | ||||||
| Income from operations |
6,163 | 8,200 | ||||||
| Interest expense, net |
554 | 253 | ||||||
| Income before income taxes |
5,609 | 7,947 | ||||||
| Provision for income taxes |
2,244 | 3,266 | ||||||
| Net income |
$ | 3,365 | $ | 4,681 | ||||
See accompanying notes.
F-65
Table of Contents
Index to Financial Statements
CLC Group, Inc. and subsidiaries
Condensed consolidated statement of cash flows
(Dollars in thousands)
(Unaudited)
| Quarter ended March 31 | ||||||||
| 2008 | 2009 | |||||||
| Cash flows from operating activities: |
||||||||
| Net income |
$ | 3,365 | $ | 4,768 | ||||
| Adjustments to reconcile net income to net cash provided by operating activities: |
||||||||
| Depreciation and amortization |
737 | 791 | ||||||
| Deferred and accrued income taxes |
1,941 | 1,133 | ||||||
| Change in accounts receivable, other current assets, accounts payable, accrued liabilities, and income tax receivable/payable: |
(3,786 | ) | 1,025 | |||||
| Net cash provided by operating activities |
2,257 | 7,717 | ||||||
| Cash flows from investing activity: |
||||||||
| Purchase of property, equipment, and capitalized software |
(208 | ) | (163 | ) | ||||
| Net cash used in investing activity |
(208 | ) | (163 | ) | ||||
| Cash flows from financing activities: |
||||||||
| Borrowings under revolving credit facility net of repayments |
(3,645 | ) | — | |||||
| Net cash used in financing activities |
(3,645 | ) | — | |||||
| Net (decrease) increase in cash and cash equivalents |
(1,596 | ) | 7,554 | |||||
| Cash and cash equivalents at beginning of period |
1,785 | 13,677 | ||||||
| Cash and cash equivalents at end of period |
$ | 189 | $ | 21,231 | ||||
See accompanying notes to consolidated financial statements.
F-66
Table of Contents
Index to Financial Statements
CLC Group, Inc. and subsidiaries
Notes to condensed consolidated financial statements
(Dollars in thousands)
1. Basis of Presentation
We prepared the accompanying interim condensed consolidated financial statements in accordance with the instructions of regulation S-X. Accordingly, they do not include all of the information and footnotes required by U.S. generally accepted accounting principles for complete financial statements. The Company believes these condensed consolidated financial statements reflect all adjustments (consisting of only normal recurring accruals) considered necessary for a fair presentation. Operating results for the quarter ended March 31, 2009 are not necessarily indicative of the results that may be expected for the year ending December 31, 2008. The unaudited condensed consolidated interim financial statements should be read in conjunction with the audited consolidated financial statements and the notes thereto included elsewhere in this Form S-1.
2. Adoption of New Accounting Standards
The Company’s adoption of any other new accounting standards is presented below.
Expanded Disclosure for Derivative Instruments and Hedging Activities
On January 1, 2009, the Company adopted ASC 815-10-50, “Derivatives and Hedging-Overall-Disclosure,” which requires expanded disclosures about an entity’s derivative instruments and hedging activities, including requirements that interim financial statements include certain disclosures for derivative instruments. ASC 815-10-50 did not change any accounting requirements, but instead relates only to disclosures. Since the Company has not entered into any derivative instruments the adoption did not have any impact on the Company’s condensed consolidated financial statements.
Noncontrolling Interests in Consolidated Financial Statements
On January 1, 2009, the Company adopted ASC 810-10-65-1, “Consolidation-Overall-Transition and Open Effective Date Information,” which revised the classification of noncontrolling interests in consolidated statements of financial position and the accounting for and reporting of transactions between the reporting entity and holders of such noncontrolling interests. Under this new guidance, noncontrolling interests are considered equity and the practice of classifying minority interests within a mezzanine section of the balance sheet was eliminated. Net (loss) income encompasses the total (loss) income of all consolidated subsidiaries and there is separate disclosure on the face of the statement of operations of the attribution of that (loss) income between the controlling and noncontrolling interests. Increases and decreases in the noncontrolling ownership interest amounts are accounted for as equity transactions. Any future issuance of noncontrolling interests that causes the controlling interest to lose control and deconsolidate a subsidiary will be accounted for by full gain or loss recognition. As the Company does not have any noncontrolling interest the adoption of ASC 810-10-65-1 did not impact the Company’s condensed consolidated financial statements.
Business Combinations
On January 1, 2009, the Company adopted ASC 805, “Business Combinations.” ASC 805 changed many well-established business combination accounting practices and significantly affected how acquisition transactions are reflected in the financial statements. ASC 805 changed the accounting treatment for certain acquisition-related
F-67
Table of Contents
Index to Financial Statements
CLC Group, Inc. and subsidiaries
Notes to condensed consolidated financial statements
(Dollars in thousands)
activities that occur after its adoption including (a) recording contingent consideration at the acquisition date at fair value, (b) expensing acquisition-related costs as incurred, and (c) expensing restructuring costs associated with the acquired business. ASC 805 also introduced certain new disclosure requirements. Since ASC 805 uses an expanded definition of a business, the Company was required to evaluate its reporting units at adoption. The adoption of ASC 805 did not have an impact on the Company’s condensed consolidated financial statements. However, it could have a significant impact on the accounting for any future acquisitions.
3. Share based compensation
The Company accounts for stock-based compensation pursuant to relevant authoritative guidance, which requires measurement of compensation cost for all stock awards at fair value on the date of grant and recognition of compensation cost, net of estimated forfeitures, over the requisite service period for awards expected to vest. There were not any grants of stock based compensation and there were not any stock options exercised during the quarter ended March 31, 2009.
All outstanding options as of December 31, 2008 vest upon a liquidity event. Therefore, no compensation expense was recorded during the quarter ended March 31, 2009. See footnote 9 for further discussion of the compensation costs recorded related to the non-vested options on April 1, 2009 in connection with the acquisition of the Company by FleetCor Technologies, Inc.
4. Identifiable intangible assets
The Company has identifiable intangible assets consisting of the following for the quarter ended March 31, 2009:
| Gross carrying amount |
Weighted average amortization period |
Accumulated amortization |
||||||||||
| Amortizing intangible assets |
||||||||||||
| Customer relationships |
$ | 22,000 | 12 years | $ | 10,602 | |||||||
| Software |
1,600 | 12 years | 771 | |||||||||
| Noncompetition agreements |
700 | 7 years | 577 | |||||||||
| Tradename |
130 | 5 years | 130 | |||||||||
| Total |
$ | 24,430 | $ | 12,080 | ||||||||
Aggregate amortization expense for amortizing intangible assets for the quarter ended March 31, 2009 and 2008 was $515 and $668 respectively.
F-68
Table of Contents
Index to Financial Statements
CLC Group, Inc. and subsidiaries
Notes to condensed consolidated financial statements
(Dollars in thousands)
5. Debt
Debt at March 31, 2009 consists of the following:
| Senior term loan, due June 30, 2009 |
$ | 25,400 | ||
| Revolving credit facility, due June 30, 2009 |
— | |||
| Total debt |
25,400 | |||
| Less current portion |
(25,400 | ) | ||
| Long-term debt |
$ | — | ||
The senior term loan and the revolving credit facility (the Loans) are secured by substantially all of the assets of the Company’s subsidiaries and the repayment of the Loans is guaranteed by CLCG. The Loans mature on June 30, 2009. The senior term loan requires quarterly principal payments and mandatory prepayments under certain circumstances. The credit agreement requires the Company to comply with certain covenants, including the maintenance of certain financial ratios. The financial covenants include maintaining a maximum leverage ratio of 2.75 to 1, a minimum fixed charge coverage ratio of 1.10 to 1, and a minimum interest coverage ratio of 3.75 to 1, and also restricting capital expenditures to $1,500 per year plus carryforward amounts from the prior years. These ratios change in future years in which some become more restrictive. The Loans bear interest at the Borrowers’ option at either (i) LIBOR plus 2.75% or (ii) prime rate plus 1.50%. The Borrowers must pay a commitment fee of 1/2% per annum on the unused portion of the revolving credit facility.
6. Income taxes
The provision for income taxes differs from amounts computed by applying the U.S. federal tax rate of 35% to income before income taxes for the quarters ended March 31, 2010 and 2009 due to the following (dollars in thousands):
| 2009 | 2008 | |||||||||||||||
| Computed “expected” tax expense |
$ | 2,781 | 35% | $ | 1,963 | 35% | ||||||||||
| Changes resulting from: |
||||||||||||||||
| State taxes net of federal benefits |
336 | 4% | 278 | 5% | ||||||||||||
| Other |
149 | 2% | 3 | 0% | ||||||||||||
| Provision for income taxes |
$ | 3,266 | 41% | $ | 2,244 | 40% | ||||||||||
7. Commitments and contingencies
The Company is subject to various legal proceedings and claims that arise in the ordinary course of business. In the opinion of management, the ultimate disposition of these matters will not have a material adverse effect on the Company’s condensed consolidated financial position, results of operations, or liquidity.
At March 31, 2009, the Company had a reserve of $1.5 million recorded in ,accrued liabilities in the consolidated balance sheets, which is intended to cover any liabilities or future costs associated with the wind-down of certain
F-69
Table of Contents
Index to Financial Statements
CLC Group, Inc. and subsidiaries
Notes to condensed consolidated financial statements
(Dollars in thousands)
lodging programs operated for FEMA. The reserve is management’s best estimate based on the volume of business conducted and the results of similar previous programs for any potential future liabilities for this FEMA program.
8. Related-party transactions
The Company pays a management fee of $500 per year, payable quarterly in arrears, to Nautic Partners V, LP and its affiliates (Nautic). Nautic is a holder of a majority of the Company’s common stock. Included in accrued liabilities for March 31, 2009 is $125 representing the management fee due for the first quarter of 2009.
Barry Downing, previous owner of CLC, CTS, and CTSI, has ongoing relationships with the Company. As of March 31, 2009, he holds 10,000 shares of common stock in CLC Group, Inc. He serves as chairman of the Company’s board of directors. He is also a minority owner of Lodging Enterprises, Inc. (LEI). LEI is an owner of various hotel facilities, which the Company does business under a marketing agreement. For the period ended March 31, 2009 the Company derived fee revenue of approximately $108 from LEI.
9. Subsequent events
On April 1, 2009 FleetCor Technologies, Inc. (FleetCor) acquired all of the outstanding stock of the Company. All outstanding non-vested options as of March 31, 2009 vested upon the acquisition and compensation expense of $830 was recorded in connection with this transaction in April of 2009.
Prior to the closing of the acquisition by FleetCor, the Company recorded additional compensation expense in April 2009 related to the 2006 Management Bonus Plan aggregating $4,800 as a result of the consummation of the FleetCor acquisition.
The Company determined that achievement of the performance condition for recognition of these awards was not probable of achievement until the closing of the acquisition when the awards vested.
F-70
Table of Contents
Index to Financial Statements
12,675,000 Shares
Common Stock
PROSPECTUS
| J.P. Morgan | Goldman, Sachs & Co. | |||
| Barclays Capital | Morgan Stanley | |||
| PNC Capital Markets LLC | Raymond James |
Wells Fargo Securities | ||
Until , 2011, all dealers effecting transactions in these Securities, whether or not participating in this offering, may be required to deliver a prospectus. This is in addition to a dealer’s obligation to deliver a prospectus when acting as an underwriter and with respect to an unsold allotment or subscription.
Table of Contents
Index to Financial Statements
Part II: Information not required in the prospectus
Item 13. Other expenses of issuance and distribution.
The following table sets forth all fees and expenses, other than underwriting discounts and commissions, payable solely by the registrant in connection with the offer and sale of the securities being registered. All amounts shown are estimated except for the registration fee of the Securities and Exchange Commission and the listing fee of the New York Stock Exchange.
| SEC registration fee |
$ | 27,022 | ||
| FINRA filing fee |
50,500 | |||
| New York Stock Exchange listing fee |
250,000 | |||
| Accounting fees and expenses |
1,100,000 | |||
| Legal fees and expenses |
990,000 | |||
| Printing fees and expenses |
250,000 | |||
| Transfer agent and registrar fees and expenses |
22,000 | |||
| Director and officer insurance |
850,000 | |||
| Miscellaneous |
110,478 | |||
| Total |
$ | 3,650,000 | ||
Item 14. Indemnification of directors and officers.
FleetCor Technologies, Inc. is a Delaware corporation. Section 145(a) of the Delaware General Corporation Law (the “DGCL”) provides that a Delaware corporation may indemnify any person who was or is a party or is threatened to be made a party to any threatened, pending or completed action, suit or proceeding, whether civil, criminal, administrative or investigative, other than an action by or in the right of the corporation, by reason of the fact that such person is or was a director, officer, employee or agent of the corporation, or is or was serving at the request of the corporation as a director, officer, employee or agent of another corporation, partnership, joint venture, trust or other enterprise, against expenses (including attorneys’ fees), judgments, fines and amounts paid in settlement actually and reasonably incurred by the person in connection with such action, suit or proceeding if the person acted in good faith and in a manner the person reasonably believed to be in or not opposed to the best interests of the corporation, and, with respect to any criminal action or proceeding, had no reasonable cause to believe the person’s conduct was unlawful.
Section 145(b) of the DGCL provides that a Delaware corporation may indemnify any person who was or is a party or is threatened to be made a party to any threatened, pending or completed action or suit by or in the right of the corporation to procure a judgment in its favor by reason of the fact that such person acted in any of the capacities set forth above, against expenses (including attorneys’ fees) actually and reasonably incurred by such person in connection with the defense or settlement of such action or suit if the person acted in good faith and in a manner the person reasonably believed to be in or not opposed to the best interests of the corporation, except that no indemnification shall be made in respect of any claim, issue or matter as to which such person shall have been adjudged to be liable to the corporation, unless and only to the extent that the Court of Chancery or the court in which such action or suit was brought shall determine upon application that, despite the adjudication of liability but in view of all the circumstances of the case, such person is fairly and reasonably entitled to indemnity for such expenses which the court shall deem proper.
II-1
Table of Contents
Index to Financial Statements
Further subsections of DGCL Section 145 provide that:
| • | to the extent a present or former director or officer of a corporation has been successful on the merits or otherwise in the defense of any action, suit or proceeding referred to in subsections (a) and (b) of Section 145 or in the defense of any claim, issue or matter therein, such person shall be indemnified against expenses, including attorneys’ fees, actually and reasonably incurred by such person in connection therewith; |
| • | the indemnification and advancement of expenses provided for pursuant to Section 145 shall not be deemed exclusive of any other rights to which those seeking indemnification or advancement of expenses may be entitled under any bylaw, agreement, vote of stockholders or disinterested directors or otherwise; and |
| • | the corporation shall have the power to purchase and maintain insurance of behalf of any person who is or was a director, officer, employee or agent of the corporation, or is or was serving at the request of the corporation as a director, officer, employee or agent of another corporation, partnership, joint venture, trust or other enterprise, against any liability asserted against such person and incurred by such person in any such capacity, or arising out of such person’s status as such, whether or not the corporation would have the power to indemnify such person against such liability under Section 145. |
As used in this Item 14, the term “proceeding” means any threatened, pending, or completed action, suit, or proceeding, whether or not by or in the right of Registrant, and whether civil, criminal, administrative, investigative or otherwise.
Section 145 of the DGCL makes provision for the indemnification of officers and directors in terms sufficiently broad to indemnify officers and directors of each of the registrants incorporated in Delaware under certain circumstances from liabilities (including reimbursement for expenses incurred) arising under the Securities Act of 1933, as amended (the “Act”). FleetCor may, in its discretion, similarly indemnify its employees and agents.
The amended and restated certificate of incorporation and amended and restated bylaws of FleetCor provide that, to the fullest extent and under the circumstances permitted by Section 145 of the DGCL, FleetCor will indemnify any and all persons whom it has the power to indemnify from and against any and all of the expenses, liabilities or other maters referred to in Section 145 of the DGCL. In addition, the amended and restated certificate of incorporation of FleetCor relieves its directors from monetary damages to it or its stockholders for breach of such director’s fiduciary duty as a director to the fullest extent permitted by the DGCL. Under Section 102(b)(7) of the DGCL, a corporation may relieve its directors from personal liability to such corporation or its stockholders for monetary damages for any breach of their fiduciary duty as directors except (i) for a breach of the duty of loyalty, (ii) for failure to act in good faith, (iii) for intentional misconduct or knowing violation of law, (iv) for willful or negligent violations of certain provisions in the DGCL imposing certain requirements with respect to stock repurchases, redemptions and dividends, or (v) for any transactions from which the director derived an improper personal benefit.
FleetCor anticipates entering into indemnification agreements with its directors and officers to provide such officers and directors with additional contractual assurances regarding the scope of their indemnification. FleetCor also intends to purchase and maintain insurance on behalf of any person who is or was a director or officer against any loss arising from any claim asserted against him or her and incurred by him or her in any such capacity, subject to certain exclusions.
In addition, FleetCor has agreed, subject to certain exceptions, pursuant to the sixth amended and restated registration rights agreement, as amended, to indemnify against liabilities resulting from this offering, each selling stockholder that is a party to the registration rights agreement (the “Indemnified Parties”), including owners of 10% or more of our capital stock, such as entities affiliated with Summit Partners, Bain Capital Partners and GCC Investments. In addition, FleetCor has agreed that, in order to provide for just and equitable
II-2
Table of Contents
Index to Financial Statements
contribution to joint liability, if indemnification is not available to the Indemnified Parties, FleetCor and the Indemnified Parties will each contribute to any liability based on the proportion that the price of the shares sold by them relates to the aggregate offering price, subject to certain exceptions.
Item 15. Recent sales of unregistered securities.
Since April 1, 2007, we issued and sold the following securities that were not registered under the Act. The amounts below do not give effect to (1) the automatic conversion of all outstanding shares of our preferred stock into shares of our common stock upon the closing of this offering and (2) a two and one-half-for-one stock split of shares of our common stock effected on November 29, 2010.
1. On January 10, 2008, we issued an aggregate of 25,432 shares of our common stock to three investors upon the exercise of outstanding warrants, and received $89,012 in cash proceeds.
2. On March 28, 2008, we issued 50,000 shares of our common stock to an investor upon the exercise of an outstanding warrant, and received $175,000 in cash proceeds.
3. On October 13, 2008, we issued an aggregate of 146,578 shares of our common stock to two investors upon the exercise of outstanding warrants, and received approximately $1,466 in cash proceeds.
4. On April 1, 2009, in connection with our acquisition of CLC Group, Inc. we issued an aggregate of 3,400,000 new shares of our Series E convertible preferred stock in exchange for consideration of $102,000,000, consisting of $93,999,990 in cash and 3,221.91 shares of stock of CLC Group, Inc.
5. From April 1, 2007 to September 30, 2010, we have granted stock options to purchase an aggregate of 1,643,159 shares of our common stock at exercise prices ranging from $25 to $50 per share to employees under our 2002 Plan.
6. From April 1, 2007 to September 30, 2010, we have issued and sold an aggregate of 429,205 shares of our common stock to employees and directors upon payment of approximately $1,575,253 pursuant to exercises of options granted under our 2002 Plan.
7. From April 1, 2007 to September 30, 2010, we have issued an aggregate of 826,389 shares of our restricted stock to our employees and directors.
None of the foregoing transactions involved any underwriters, underwriting discounts or commissions, or any public offering. The transactions described above were completed without registration under the Securities Act of 1933, as amended, as follows:
| • | the transactions described in paragraphs 1, 2, and 3 were effected in reliance on the exemptions afforded by Section 4(2) of the Securities Act of 1933, as amended, as they did not involve any public offering; |
| • | the transaction described in paragraph 4 was effected in reliance on the exemptions afforded by Rule 506 of Regulation D promulgated under the Securities Act of 1933, as amended, as each investor was an “accredited investor” as defined in Regulation D; and |
| • | the transactions described in paragraphs 5, 6 and 7 were effected in reliance on the exemptions afforded by Rule 701 promulgated under the Securities Act of 1933, as amended. |
The recipients of securities under compensatory benefit plans and contracts relating to compensation were our employees, directors or bona fide consultants and received the securities as compensation for services. Appropriate legends have been affixed to the securities issued in these transactions. Each of the recipients of securities in these transactions had adequate access, through employment, business or other relationships, to
II-3
Table of Contents
Index to Financial Statements
information about us. When we have relied on Rule 506 of Regulation D promulgated under the Securities Act of 1933, as amended, the investors in unregistered securities have been accredited investors. When we have relied on Section 4(2) of the Securities Act of 1933, as amended, we have received affirmative representations from the purchasers of unregistered securities regarding these purchasers’ financial sophistication.
Item 16. Exhibits and financial statements.
(a) The exhibits listed below in the “Index to Exhibits” are part of this Registration Statement on Form S-1 and are numbered in accordance with Item 601 of Regulation S-K.
(b) None.
Item 17. Undertakings.
The undersigned registrant hereby undertakes that:
(1) For purposes of determining any liability under the Securities Act of 1933, the information omitted from the form of prospectus filed as part of this Registration Statement in reliance upon Rule 430A and contained in a form of prospectus filed by the Registrant pursuant to Rule 424(b)(1) or (4) or 497(h) under the Securities Act shall be deemed to be part of this Registration Statement as of the time it was declared effective.
(2) For the purpose of determining any liability under the Securities Act of 1933, each post-effective amendment that contains a form of prospectus shall be deemed to be a new Registration Statement relating to the securities offered therein, and the offering of such securities at that time shall be deemed to be the initial bona fide offering thereof.
(3) The undersigned registrant hereby undertakes to provide to the underwriters, at the closing specified in the underwriting agreement, certificates in such denominations and registered in such names as required by the underwriters to permit prompt delivery to each purchaser.
Insofar as indemnification for liabilities arising under the Securities Act of 1933 may be permitted to directors, officers and controlling persons of the registrant pursuant to the foregoing provisions, or otherwise, the registrant has been advised that in the opinion of the Securities and Exchange Commission such indemnification is against public policy as expressed in the Act and is, therefore, unenforceable. In the event that a claim for indemnification against such liabilities (other than the payment by the registrant of expenses incurred or paid by a director, officer or controlling person of the registrant in the successful defense of any action, suit or proceeding) is asserted by such director, officer or controlling person in connection with the securities being registered, the registrant will, unless in the opinion of its counsel the matter has been settled by controlling precedent, submit to a court of appropriate jurisdiction the question whether such indemnification by it is against public policy as expressed in the Act and will be governed by the final adjudication of such issue.
II-4
Table of Contents
Index to Financial Statements
Signatures
Pursuant to the requirements of the Securities Act of 1933, the registrant has duly caused this amendment to the Registration Statement to be signed on its behalf by the undersigned, thereunto duly authorized, in the City of Norcross, State of Georgia, on November 30, 2010.
| FleetCor Technologies, Inc. | ||
| By: |
/s/ Ronald F. Clarke | |
| Ronald F. Clarke | ||
| President and Chief Executive Officer | ||
Pursuant to the requirements of the Securities Act of 1933, this amendment to the Registration Statement has been signed by the following persons in the capacities set forth opposite their names and on the date indicated above.
| Signature |
Title | |||||
| /s/ Ronald F. Clarke Ronald F. Clarke |
President, Chief Executive Officer and Director (Principal Executive Officer) | |||||
| /s/ Eric R. Dey Eric R. Dey |
Chief Financial Officer (Principal Financial Officer and Principal Accounting Officer) | |||||
| * Andrew B. Balson |
Director | |||||
| * John R. Carroll |
Director | |||||
| * Bruce R. Evans |
Director | |||||
| * Mark A. Johnson |
Director | |||||
| * Richard Macchia |
Director | |||||
| * Glenn W. Marschel |
Director | |||||
| * Steven T. Stull |
Director | |||||
| *By: |
/s/ Ronald F. Clarke | |
| Ronald F. Clarke Attorney-in-fact | ||
Table of Contents
Index to Financial Statements
Index to exhibits
| Exhibit no. |
||
| 1.1* | Form of Underwriting Agreement | |
| 2.1† | Stock Purchase Agreement, dated as of April 1, 2009, among FleetCor Technologies Operating Company, LLC, CLC Group, Inc., and the entities and individuals identified on the signature pages thereto | |
| 3.1† | Form of Amended and Restated Certificate of Incorporation of FleetCor Technologies, Inc. | |
| 3.2† | Form of Amended and Restated Bylaws of FleetCor Technologies, Inc. | |
| 4.1† | Form of Stock Certificate for Common Stock | |
| 5.1* | Opinion of King & Spalding LLP regarding legality of securities being offered | |
| 10.1† | Form of Indemnity Agreement to be entered into between FleetCor and its directors and executive officers | |
| 10.2† | FleetCor Technologies, Inc. Amended and Restated Stock Incentive Plan | |
| 10.3† | First Amendment to FleetCor Technologies, Inc. Amended and Restated Stock Incentive Plan | |
| 10.4† | Second Amendment to FleetCor Technologies, Inc. Amended and Restated Stock Incentive Plan | |
| 10.5† | Third Amendment to FleetCor Technologies, Inc. Amended and Restated Stock Incentive Plan | |
| 10.6† | Fourth Amendment to FleetCor Technologies, Inc. Amended and Restated Stock Incentive Plan | |
| 10.7† | Form of Incentive Stock Option Award Agreement pursuant to the FleetCor Technologies, Inc. Amended and Restated Stock Incentive Plan | |
| 10.8† | Form of Non-Qualified Stock Option Award Agreement pursuant to the FleetCor Technologies, Inc. Amended and Restated Stock Incentive Plan | |
| 10.9† | Form of Performance Share Restricted Stock Agreement pursuant to the FleetCor Technologies, Inc. Amended and Restated Stock Incentive Plan | |
| 10.10† | Form of FleetCor Technologies, Inc. 2010 Equity Compensation Plan | |
| 10.11† | FleetCor Technologies, Inc. Annual Executive Bonus Program | |
| 10.12† | Employee Noncompetition, Nondisclosure and Developments Agreement, dated September 25, 2000, between Fleetman, Inc. and Ronald F. Clarke | |
| 10.13† | Offer Letter, dated September 20, 2002, between FleetCor Technologies, Inc. and Eric R. Dey | |
| 10.14† | Offer Letter, dated September 14, 2009, between FleetCor Technologies, Inc. and Alex P. Hart | |
| 10.15† | Offer Letter, dated March 17, 2009, between FleetCor Technologies, Inc. and Todd W. House | |
| 10.16† | Service Agreement, dated July 9, 2007, between FleetCor Technologies, Inc. and Andrew R. Blazye | |
| 10.17† | Sixth Amended and Restated Registration Rights Agreement, dated April 1, 2009, between FleetCor Technologies, Inc. and each of the stockholders party thereto | |
| 10.18† | Credit Agreement, dated June 29, 2005, among FleetCor Technologies Operating Company, LLC, as Borrower, FleetCor Technologies, Inc., as Parent, JPMorgan Chase Bank, N.A., as Administrative Agent, Collateral Agent and L/C Issuer, PNC Bank, National Association, as Syndication Agent, the other lenders party thereto, and J.P. Morgan Securities Inc. and PNC Capital Markets, Inc. as Co-Lead Arrangers and Joint Bookrunners | |
| 10.19† | Fourth Amended and Restated Receivables Purchase Agreement, dated October 29, 2007, among FleetCor Funding LLC, as Seller, FleetCor Technologies Operating Company, LLC, as Servicer, the various purchaser groups from time to time party thereto and PNC Bank, National Association, as Administrator | |
Table of Contents
Index to Financial Statements
| Exhibit no. |
||
| 10.20† | First Amendment to the Fourth Amended and Restated Receivables Purchase Agreement, dated July 8, 2008, among FleetCor Funding LLC, as Seller, FleetCor Technologies Operating Company, LLC, as Servicer, the various purchaser groups from time to time party thereto and PNC Bank, National Association, as Administrator | |
| 10.21† |
Assignment, Assumption Agreement and Second Amendment to the Fourth Amended and Restated Receivables Purchase Agreement, dated November 10, 2008, among FleetCor Funding LLC, as Seller, FleetCor Technologies Operating Company, LLC, as Servicer, Market Street Funding LLC, as conduit purchaser assignor and as related committed purchaser assignor, Atlantic Asset Securitization LLC, as a conduit purchaser and assignee, Calyon New York Branch, as a related committed purchaser assignee and the purchaser agent for the Atlantic Purchaser Group, the various purchaser agents, conduit purchasers and related committed purchasers listed on the signature pages thereto, and PNC Bank, National Association, as purchaser agent for the Market Street Purchaser Group and Administrator | |
| 10.22† | Third Amendment to the Fourth Amended and Restated Receivables Purchase Agreement, dated February 25, 2010, among FleetCor Funding LLC, as Seller, FleetCor Technologies Operating Company, LLC, as Servicer, the various purchaser groups from time to time party thereto and PNC Bank, National Association, as Administrator | |
| 10.23† | Purchase and Sale Agreement, dated December 20, 2004, among various entities listed on Schedule I thereto, as originators, and FleetCor Funding LLC | |
| 10.24† | First Amendment to Purchase and Sale Agreement, dated February 3, 2005, among FleetCor Funding LLC and each originator party thereto | |
| 10.25† | Second Amendment to Purchase and Sale Agreement, dated March 28, 2005, among FleetCor Funding LLC and each originator party thereto | |
| 10.26† | Third Amendment to Purchase and Sale Agreement, dated August 1, 2005, among FleetCor Funding LLC and each remaining originator listed on Schedule I thereto | |
| 10.27† | Fourth Amendment to Purchase and Sale Agreement, dated October 29, 2007, among FleetCor Funding LLC and each originator listed on the signature pages thereto | |
| 10.28† | Fifth Amendment to Purchase and Sale Agreement, dated July 8, 2008, among FleetCor Funding LLC and each originator listed on the signature pages thereto | |
| 10.29† | Performance Guaranty, dated December 20, 2004, among FleetCor Technologies, Inc. and FleetCor Technologies Operating Company, LLC, in favor of PNC Bank, National Association | |
| 10.30† | First Amendment to Performance Guaranty, dated March 19, 2010, among FleetCor Technologies, Inc., FleetCor Technologies Operating Company, LLC, PNC Bank, National Association and Credit Agricole Corporate and Investment Bank New York Branch | |
| 10.31† | Credit Facilities Agreement, dated December 7, 2006, among FENIKA, s.r.o., CCS Ceská spolecnost pro platební karty a.s. and Bank Austria Creditanstalt AG, as Arranger | |
| 10.32† | First Amendment to Credit Facilities Agreement, dated March 25, 2008, among CCS Ceská spolecnost pro platební karty s.r.o., as Borrower, FleetCor Luxembourg Holding 3 S.à r.l., as Guarantor, Bank Austri Creditanstalt AG, as Facility Agent, and Unicredit Bank Czech Republic, A.S., as lender | |
| 10.33† | Payment Undertaking dated December 7, 2006, among FleetCor Technologies, Inc., CCS Ceská spolecnost pro platební karty a.s., Bank Austria Creditanstalt AG, as Arranger, Original Lender and Facility Agent, and HVB Bank Czech Republic a.s., as Security Agent | |
| 10.34† | Sixth Amended and Restated Stockholders Agreement, dated April 1, 2009, between FleetCor Technologies, Inc. and each of the stockholders party thereto | |
| 10.35† | Series E Convertible Preferred Stock Purchase Agreement, dated as of April 1, 2009, among FleetCor Technologies, Inc. and the purchasers listed on Schedule I thereto | |
Table of Contents
Index to Financial Statements
| Exhibit no. |
||
| 10.36† | Form of First Amendment to Sixth Amended and Restated Registration Rights Agreement | |
| 10.37† | Form of Indemnity Agreement to be entered into between FleetCor and representatives of its major stockholders | |
| 10.38* | Form of Director Restricted Stock Grant Agreement pursuant to the FleetCor Technologies, Inc. 2010 Equity Compensation Plan | |
| 10.39* | Form of Employee Performance Share Restricted Stock Agreement pursuant to the FleetCor Technologies, Inc. 2010 Equity Compensation Plan | |
| 10.40* | Form of Employee Incentive Stock Option Award Agreement pursuant to the FleetCor Technologies, Inc. 2010 Equity Compensation Plan | |
| 10.41* | Form of Employee Non-Qualified Stock Option Award Agreement pursuant to the FleetCor Technologies, Inc. 2010 Equity Compensation Plan | |
| 10.42* | Form of Director Non-Qualified Stock Option Award Agreement pursuant to the FleetCor Technologies, Inc. 2010 Equity Compensation Plan | |
| 10.43* | Amended and Restated Employee Noncompetition, Nondisclosure and Developments Agreement, dated November 29, 2010, between FleetCor Technologies, Inc. and Ronald F. Clarke | |
| 21.1† | List of subsidiaries of FleetCor Technologies, Inc. | |
| 23.1* | Consent of King & Spalding LLP (included as part of its opinion filed as Exhibit 5.1 hereto) | |
| 23.2* | Consent of Ernst & Young LLP, independent registered public accounting firm | |
| 23.3* | Consent of KPMG LLP, independent auditor | |
| 23.4† | Consent of Richard Macchia | |
| 24.1† | Powers of Attorney | |
| 24.2† | Power of Attorney by Richard Macchia | |
| * | Filed herewith. |
| † | Previously filed. |