Attached files
| file | filename |
|---|---|
| 8-K - FORM 8-K - Local Insight Regatta Holdings, Inc. | d8k.htm |
Exhibit 99.1

Exhibit 99.1
BONDHOLDER DUE DILIGENCE MATERIALS
NOVEMBER 2010
STRICTLY CONFIDENTIAL
NOT TO BE SHARED WITH ANY PARTY
OTHER THAN RECIPIENT WITHOUT PRIOR
WRITTEN CONSENT OF THE COMPANY
Disclaimer
Safe Harbor for Forward-Looking Statements; Cautionary Statements
This presentation contains “forward-looking statements” within the meaning of Section 27A of the Securities Act of 1933, as amended, and Section 21E of the Securities Exchange Act of 1934, as amended. In some cases, forward-looking statements can be identified by terminology such as “may,” “will,” “should,” “expects,” “intends,” “plans,” “anticipates,” “believes,” “estimates,” “predicts,” “potential,” “continue,” “assumption” or the negative of these terms or other comparable terminology. Regardless of any identifying phrases, these statements relate to future events or future financial performance, and involve known and unknown risks, uncertainties and other factors that may cause actual results, levels of activity, performance or achievements to be materially different from any future results, levels of activity, performance or achievements expressed or implied by these forward-looking statements. Although Local Insight Media Holdings, Inc. (together with its subsidiaries, the “Company”) believes that the expectations reflected in these forward-looking statements are reasonable, the Company cannot guarantee future results, levels of activity, performance or achievements. The Company cautions that these forward-looking statements are based on assumptions that are subject to a wide range of risks and uncertainties. These and other risks and uncertainties are described in detail in Local Insight Regatta Holdings, Inc.’s (“Regatta”) Annual Report on Form 10-K for the year ended December 31, 2009, Regatta’s Quarterly Report on Form 10-Q fo rthe quarter ended June 30, 2010 and Regatta’s other periodic filings with the SEC, which are available on the SEC’s internet site (http://www.sec.gov). Recipients are urged to consider these factors carefully in evaluating the forward-looking statements and are cautioned not to place undue reliance on such forward-looking statements. The forward-looking statements made herein are only made as of the date of this presentation, and the Company undertakes no obligation to publicly revise or update such forward-looking statements to reflect events or circumstances that occur after the date of this presentation or to reflect the occurrence of any unanticipated event
STRICTLY CONFIDENTIAL
NOT TO BE SHARED WITH ANY PARTY
OTHER THAN RECIPIENT WITHOUT PRIOR
WRITTEN CONSENT OF THE COMPANY
Table of Contents
BERRY LEADS PERFORMANCE 1
FINANCIAL PERFORMANCE DETAIL 3
CAPITAL STRUCTURE AND LIQUIDITY 10
PROJECTED FINANCIALS 13 APPENDIX
STRICTLY CONFIDENTIAL
NOT TO BE SHARED WITH ANY PARTY
OTHER THAN RECIPIENT WITHOUT PRIOR
WRITTEN CONSENT OF THE COMPANY
I Berry Leads Performance
STRICTLY CONFIDENTIAL
NOT TO BE SHARED WITH ANY PARTY
OTHER THAN RECIPIENT WITHOUT PRIOR
WRITTEN CONSENT OF THE COMPANY
BERRY LEADS PERFORMANCE
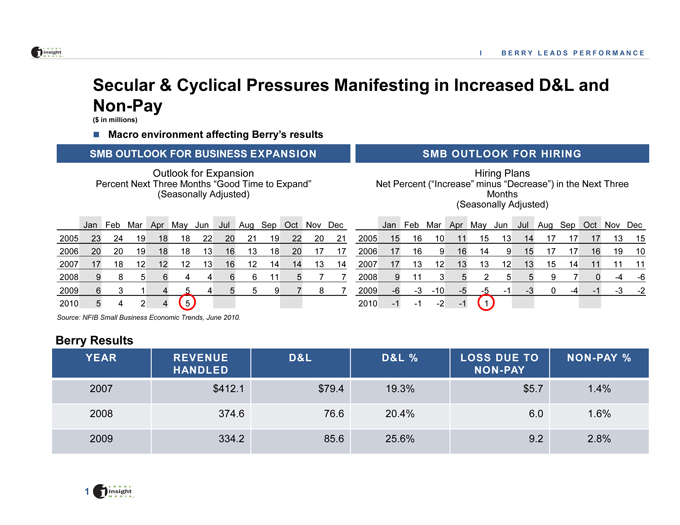
Secular & Cyclical Pressures Manifesting in Increased D&L and Non-Pay
($ in millions)
? Macro environment affecting Berry’s results
Outlook for Expansion Hiring Plans
Percent Next Three Months “Good Time to Expand” Net Percent (“Increase” minus “Decrease”) in the Next Three
(Seasonally Adjusted) Months
(Seasonally Adjusted)
Jan Feb Mar Apr May Jun Jul Aug Sep Oct Nov Dec Jan Feb Mar Apr May Jun Jul Aug Sep Oct Nov Dec
23 24 19 18 18 22 20 21 19 22 20 21 2005 15 16 10 11 15 13 14 17 17 17 13 15
20 20 19 18 18 13 16 13 18 20 17 17 2006 17 16 9 16 14 9 15 17 17 16 19 10
17 18 12 12 12 13 16 12 14 14 13 14 2007 17 13 12 13 13 12 13 15 14 11 11 11
9856446611 577 2008 911 35255970-4-6
| 6 |
|
3 14 5 4 5 5 9 7 8 7 2009 -6 -3 -10 -5 -5 -1-3 0-4 -1 -3 -2 |
| 5 |
|
4 2 4 ^5^ 2010 ~A ~A ~2 ~A ^ |
Source: NFIB Small Business Economic Trends, June 2010.
Berry Results
YEAR REVENUE D&L D&L % LOSS DUE TO NON-PAY NON-PAY %
2007 $412.1 $79.4 19.3% $5.7 1.4%
374.6 76.6 20.4% 6.0 1.6%
334.2 85.6 25.6% 9.2 2.8%
STRICTLY CONFIDENTIAL
NOT TO BE SHARED WITH ANY PARTY
OTHER THAN RECIPIENT WITHOUT PRIOR
WRITTEN CONSENT OF THE COMPANY
BERRY LEADS PERFORMANCE
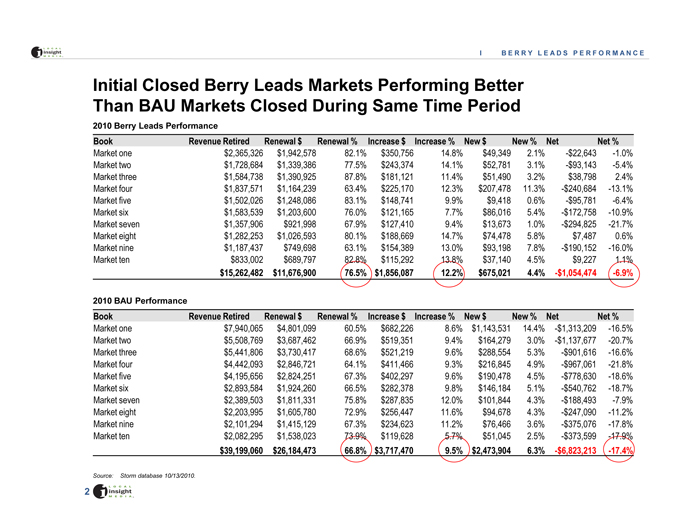
Initial Closed Berry Leads Markets Performing Better Than BAU Markets Closed During Same Time Period
2010 Berry Leads Performance
Book Revenue Retired Renewal $ Renewal % Increase $ Increase % New$ New% Net Net%
Market one $2,365,326 $1,942,578 82.1% $350,756 14.8% $49,349 2.1% -$22,643 -1.0% Market two $1,728,684 $1,339,386 77.5% $243,374 14.1% $52,781 3.1% -$93,143 -5.4% Market three $1,584,738 $1,390,925 87.8% $181,121 11.4% $51,490 3.2% $38,798 2.4% Market four $1,837,571 $1,164,239 63.4% $225,170 12.3% $207,478 11.3% -$240,684 -13.1% Market five $1,502,026 $1,248,086 83.1% $148,741 9.9% $9,418 0.6% -$95,781 -6.4% Market six $1,583,539 $1,203,600 76.0% $121,165 7.7% $86,016 5.4% -$172,758 -10.9% Market seven $1,357,906 $921,998 67.9% $127,410 9.4% $13,673 1.0% -$294,825 -21.7% Market eight $1,282,253 $1,026,593 80.1% $188,669 14.7% $74,478 5.8% $7,487 0.6% Market nine $1,187,437 $749,698 63.1% $154,389 13.0% $93,198 7.8% -$190,152 -16.0% Market ten $833,002 $689,797 82£% $115,292 134% $37,140 4.5% $9,227 $15,262,482 $11,676,900 76.5 $1,856,087 12.2% $675,021 4.4% -$1,054,474 -6.9%
2010 BAU Performance
Book Revenue Retired Renewal $ Renewal % Increase $ Increase % New$ New% Net Net%
Market one $7,940,065 $4,801,099 60.5% $682,226 8.6% $1,143,531 14.4% -$1,313,209 -16.5% Market two $5,508,769 $3,687,462 66.9% $519,351 9.4% $164,279 3.0% -$1,137,677 -20.7% Market three $5,441,806 $3,730,417 68.6% $521,219 9.6% $288,554 5.3% -$901,616 -16.6% Market four $4,442,093 $2,846,721 64.1% $411,466 9.3% $216,845 4.9% -$967,061 -21.8% Market five $4,195,656 $2,824,251 67.3% $402,297 9.6% $190,478 4.5% -$778,630 -18.6% Market six $2,893,584 $1,924,260 66.5% $282,378 9.8% $146,184 5.1% -$540,762 -18.7% Market seven $2,389,503 $1,811,331 75.8% $287,835 12.0% $101,844 4.3% -$188,493 -7.9% Market eight $2,203,995 $1,605,780 72.9% $256,447 11.6% $94,678 4.3% -$247,090 -11.2% Market nine $2,101,294 $1,415,129 67.3% $234,623 11.2% $76,466 3.6% -$375,076 -17.8% Market ten $2,082,295 $1,538,023 Z3£% $119,628 -$373,599 -17.4% $39,199,060 $26,184,473 66.8% $3,717,470 9.5% $2,473,904 6.3% -$6,823,213 -17.4%
Source: Storm database 10/13/2010.
STRICTLY CONFIDENTIAL
NOT TO BE SHARED WITH ANY PARTY
OTHER THAN RECIPIENT WITHOUT PRIOR
WRITTEN CONSENT OF THE COMPANY
II Financial Performance Detail
STRICTLY CONFIDENTIAL
NOT TO BE SHARED WITH ANY PARTY
OTHER THAN RECIPIENT WITHOUT PRIOR
WRITTEN CONSENT OF THE COMPANY
II FINANCIAL PERFORMANCE DETAIL
Overview
? Local Insight Media’s 2010 Corporate Goals:
Committed focus to sustain core print business through secular and economic pressures
Successfully launch our new digital platform
Successfully implement 3L transition
Drive cost reductions to align our expenditures with our strategic objectives
Effective liquidity management
STRICTLY CONFIDENTIAL
NOT TO BE SHARED WITH ANY PARTY
OTHER THAN RECIPIENT WITHOUT PRIOR
WRITTEN CONSENT OF THE COMPANY
II FINANCIAL PERFORMANCE DETAIL
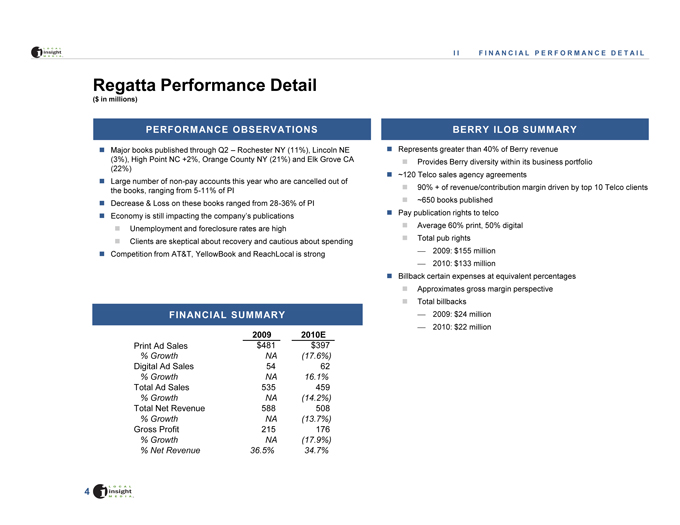
Regatta Performance Detail
($ in millions)
Major books published through Q2—Rochester NY (11 %), Lincoln NE (3%), High Point NC +2%, Orange County NY (21%) and Elk Grove CA (22%)
Large number of non-pay accounts this year who are cancelled out of the books, ranging from 5-11 % of PI
Decrease & Loss on these books ranged from 28-36% of PI
Economy is still impacting the company’s publications
Unemployment and foreclosure rates are high
Clients are skeptical about recovery and cautious about spending
? Competition from AT&T, YellowBook and ReachLocal is strong
2009 2010E
Print Ad Sales $481 $397
% Growth NA (17.6%)
Digital Ad Sales 54 62
% Growth NA 16.1%
Total Ad Sales 535 459
% Growth NA (14.2%)
Total Net Revenue 588 508
% Growth NA (13.7%)
Gross Profit 215 176
% Growth NA (17.9%)
% Net Revenue 36.5% 34.7%
? Represents greater than 40% of Berry revenue
Provides Berry diversity within its business portfolio
? -120 Telco sales agency agreements
90% + of revenue/contribution margin driven by top 10 Telco clients -650 books published
? Pay publication rights to telco
Average 60% print, 50% digital Total pub rights
2009: $155 million
2010: $133 million
? Billback certain expenses at equivalent percentages
Approximates gross margin perspective Total billbacks
2009: $24 million
2010: $22 million
STRICTLY CONFIDENTIAL
NOT TO BE SHARED WITH ANY PARTY
OTHER THAN RECIPIENT WITHOUT PRIOR
WRITTEN CONSENT OF THE COMPANY
II FINANCIAL PERFORMANCE DETAIL
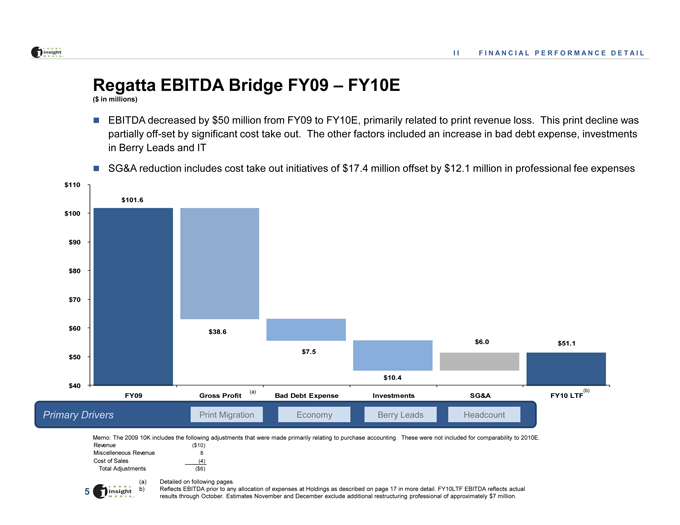
Regatta EBITDA Bridge FY09—FY10E
($ in millions)
EBITDA decreased by $50 million from FY09 to FY10E, primarily related to print revenue loss. This print decline was partially off-set by significant cost take out. The other factors included an increase in bad debt expense, investments in Berry Leads and IT
SG&A reduction includes cost take out initiatives of $17.4 million offset by $12.1 million in professional fee expenses
$101.6
$38.6
$7.5
$6.0
$51.1
$10.4
FY09 Gross Profit (a) Bad Debt Expense Investments SG&A FY10 LTF<b)
Print Migration Economy Berry Leads Headcount
Memo: The 2009 10K includes the following adjustments that were made primarily relating to purchase accounting. These were not included for comparability to 2010E.
Revenue ($10)
Miscellaneous Revenue 8
Cost of Sales (4)
Total Adjustments ($6)
| (a) |
|
Detailed on following pages. |
b) Reflects EBITDA prior to any allocation of expenses at Holdings as described on page 17 in more detail. FY10LTF EBITDA reflects actual results through October. Estimates November and December exclude additional restructuring professional of approximately $7 million.
STRICTLY CONFIDENTIAL
NOT TO BE SHARED WITH ANY PARTY
OTHER THAN RECIPIENT WITHOUT PRIOR
WRITTEN CONSENT OF THE COMPANY
II FINANCIAL PERFORMANCE DETAIL
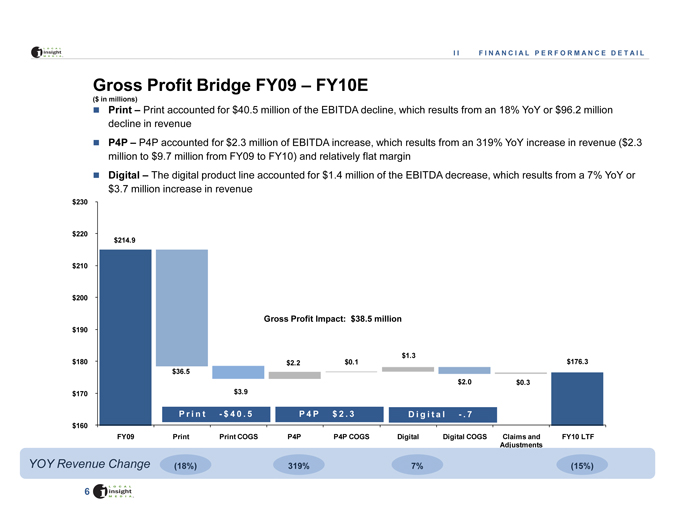
Gross Profit Bridge FY09—FY10E
($ in millions)
Print—Print accounted for $40.5 million of the EBITDA decline, which results from an 18% YoY or $96.2 million decline in revenue
P4P—P4P accounted for $2.3 million of EBITDA increase, which results from an 319% YoY increase in revenue ($2.3 million to $9.7 million from FY09 to FY10) and relatively flat margin
Digital—The digital product line accounted for $1.4 million of the EBITDA decrease, which results from a 7% YoY or $3.7 million increase in revenue
$214.9
Gross Profit Impact: $38.5 million
$2.2 $0.1 $13 $176.3
$36.5
$2.0 $0.3
$3.9
FY09 Print Print COGS P4P P4P COGS Digital Digital COGS Claims and FY10 LTF
Adjustments
Adjustments
YOY Revenue Change (18%) 319% 7% (15%)
STRICTLY CONFIDENTIAL
NOT TO BE SHARED WITH ANY PARTY
OTHER THAN RECIPIENT WITHOUT PRIOR
WRITTEN CONSENT OF THE COMPANY
II FINANCIAL PERFORMANCE DETAIL
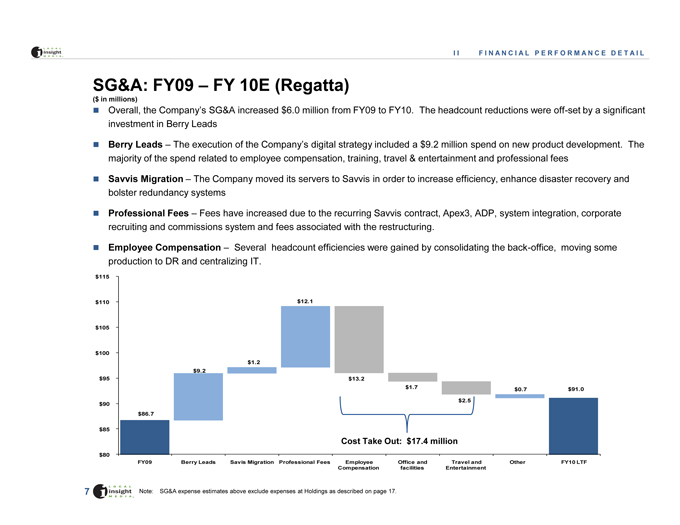
SG&A: FY09—FY 10E (Regatta)
($ in millions)
Overall, the Company’s SG&A increased $6.0 million from FY09 to FY10. The headcount reductions were off-set by a significant investment in Berry Leads
Berry Leads—The execution of the Company’s digital strategy included a $9.2 million spend on new product development. The majority of the spend related to employee compensation, training, travel & entertainment and professional fees
Savvis Migration—The Company moved its servers to Savvis in order to increase efficiency, enhance disaster recovery and bolster redundancy systems
Professional Fees—Fees have increased due to the recurring Savvis contract, Apex3, ADP, system integration, corporate recruiting and commissions system and fees associated with the restructuring.
Employee Compensation—Several headcount efficiencies were gained by consolidating the back-office, moving some production to DR and centralizing IT.
$12.1
$1.2 |
$13.2
$1-7 $0.7 $91.0
Cost Take Out: $17.4 million
FY09 Berry Leads Savis Migration Professional Fees Employee Office and Travel and Other FY10LTF
Compensation facilities Entertainment
Note: SG&A expense estimates above exclude expenses at Holdings as described on page 17.
STRICTLY CONFIDENTIAL
NOT TO BE SHARED WITH ANY PARTY
OTHER THAN RECIPIENT WITHOUT PRIOR
WRITTEN CONSENT OF THE COMPANY
II FINANCIAL PERFORMANCE DETAIL
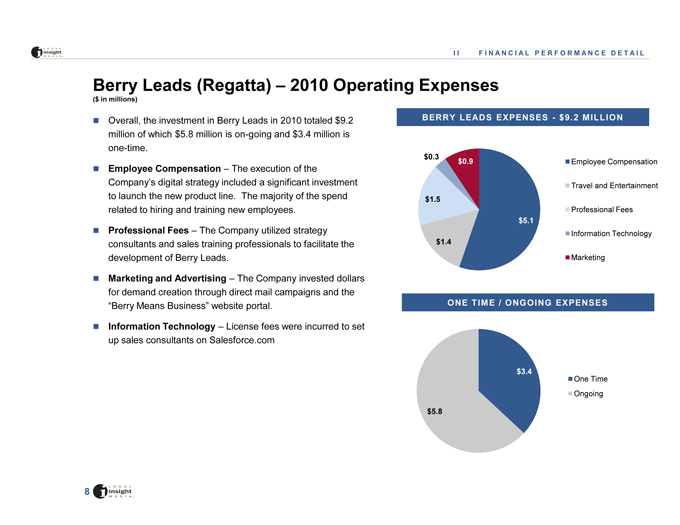
Berry Leads (Regatta)—2010 Operating Expenses
($ in millions)
Overall, the investment in Berry Leads in 2010 totaled $9.2 million of which $5.8 million is on-going and $3.4 million is one-time.
Employee Compensation—The execution of the Company’s digital strategy included a significant investment to launch the new product line. The majority of the spend related to hiring and training new employees.
Professional Fees—The Company utilized strategy consultants and sales training professionals to facilitate the development of Berry Leads.
Marketing and Advertising—The Company invested dollars for demand creation through direct mail campaigns and the “Berry Means Business” website portal.
Information Technology—License fees were incurred to set up sales consultants on Salesforce.com
BERRY LEADS EXPENSES—$9.2 MILLION
$1.5 A
Employee Compensation Travel and Entertainment Professional Fees
Information Technology
Marketing
ONE TIME / ONGOING EXPENSES
$5.8 W
? One Time Ongoing
STRICTLY CONFIDENTIAL
NOT TO BE SHARED WITH ANY PARTY
OTHER THAN RECIPIENT WITHOUT PRIOR
WRITTEN CONSENT OF THE COMPANY
II FINANCIAL PERFORMANCE DETAIL
SG&A Risk and Challenges (Regatta)
Overall, the Company’s SG&A declined by $0.8 million from FY09 to FY10. The headcount reductions were off-set by a significant investment in Berry Leads. These reductions and efficiencies have created a lean organization.
Systems—The core production system implementation began in Q4 2009; system went live in Q1 2010. Issues started to be identified late in Q2 2010 which caused printing errors, delays in production and additional proofing of books. Due to these issues, the decision was made to stop cut-over processes in for books not already converted
Production
Print—Several books have been delayed. Ad copy has been problematic, which will most likely cause an increase in claims & adjustments.
Digital—The backlog has been increasing and fulfillment of orders has been longer than expected.
Additional Resources—Due to the issues which have been identified to date, this will require additional FTEs to address the situation
Accounting -The initial cut-over has caused delays in month-end close for accounting. Application of cash was delayed as well.
Billing—The delays in book production have caused delays in billing. Also, due to the delays in digital fulfillment, bills have been sent prior to final go-live. Both of these have caused increases in claims & adjustment and bad debt.
Professional Fees—Additional fees will likely be necessary, dependent upon the extent of the production and cut-over issues.
Bad Debt—Currently running at -6% but may increase based on the duration of the cyclical downturn
STRICTLY CONFIDENTIAL
NOT TO BE SHARED WITH ANY PARTY
OTHER THAN RECIPIENT WITHOUT PRIOR
WRITTEN CONSENT OF THE COMPANY

Ill Capital Structure and Liquidity
STRICTLY CONFIDENTIAL
NOT TO BE SHARED WITH ANY PARTY
OTHER THAN RECIPIENT WITHOUT PRIOR
WRITTEN CONSENT OF THE COMPANY
Ill CAPITAL STRUCTURE AND LIQUIDITY
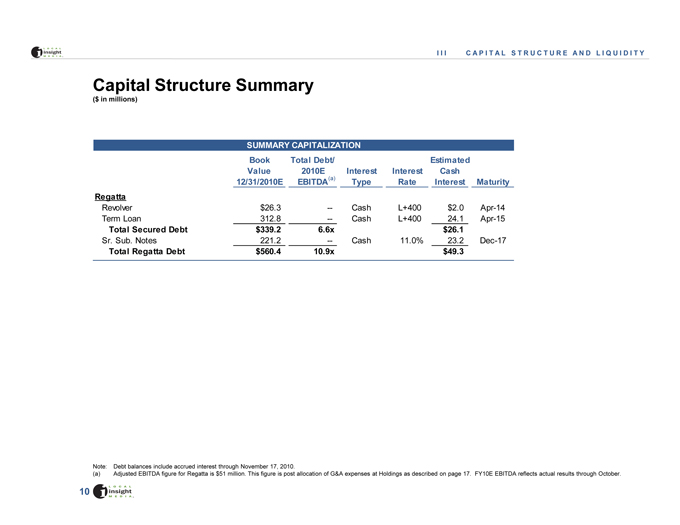
Capital Structure Summary
($ in millions)
Book Total Debt/ Estimated
Value 2010E Interest Interest Cash
12/31/2010E EBITDA(a) Type Rate Interest Maturity
Regatta
Revolver $26.3—Cash L+400 $2.0 Apr-14
Term Loan 312.8 :L_ Cash L+400 24.1 Apr-15
Total Secured Debt $339.2 6.6x $26.1
Sr. Sub. Notes 221.2 -_ Cash 11.0% 23.2 Dec-17
Total Regatta Debt $560.4 10.9x $49.3
Note: Debt balances include accrued interest through November 17, 2010.
(a) Adjusted EBITDA figure for Regatta is $51 million. This figure is post allocation of G&A expenses at Holdings as described on page 17. FY10E EBITDA reflects actual results through October.
STRICTLY CONFIDENTIAL
NOT TO BE SHARED WITH ANY PARTY
OTHER THAN RECIPIENT WITHOUT PRIOR
WRITTEN CONSENT OF THE COMPANY
Ill CAPITAL STRUCTURE AND LIQUIDITY
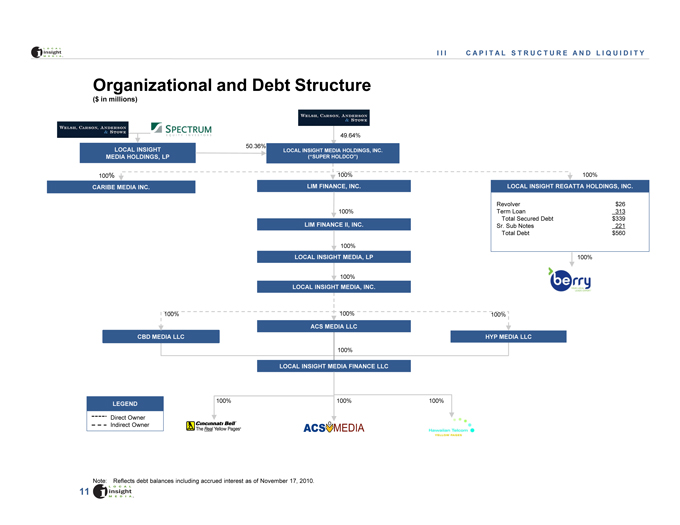
Organizational and Debt Structure
($ in millions)
in iiiiiiiuiis;
49.64%
| 1 |
|
100% |
100% 100%
I
non%”- + iqD%
100% 100% 100% 100%
Direct Owner Indirect Owner
LOCAL INSIGHT REGATTA HOLDINGS, INC.
LOCAL INSIGHT MEDIA HOLDINGS, LP
LOCAL INSIGHT MEDIA FINANCE LLC
ACS MEDIA LLC
LOCAL INSIGHT MEDIA, INC.
LOCAL INSIGHT MEDIA, LP
LIM FINANCE II, INC.
LIM FINANCE, INC.
LOCAL INSIGHT MEDIA HOLDINGS, INC.
_3683(5_+2/’&2´_
CARIBE MEDIA INC.
CBD MEDIA LLC
HYP MEDIA LLC
100%
Revolver $26
Term Loan 313
Total Secured Debt $339
Sr. Sub Notes 221
Total Debt $560
100%
Note: Reflects debt balances including accrued interest as of November 17, 2010.
STRICTLY CONFIDENTIAL
NOT TO BE SHARED WITH ANY PARTY
OTHER THAN RECIPIENT WITHOUT PRIOR
WRITTEN CONSENT OF THE COMPANY
Ill CAPITAL STRUCTURE AND LIQUIDITY
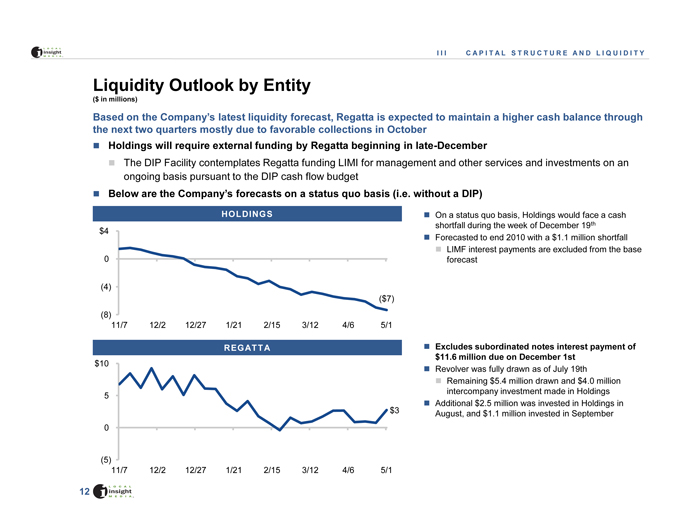
Liquidity Outlook by Entity
($ in millions)
Based on the Company’s latest liquidity forecast, Regatta is expected to maintain a higher cash balance through the next two quarters mostly due to favorable collections in October
? Holdings will require external funding by Regatta beginning in late-December
The DIP Facility contemplates Regatta funding LIMI for management and other services and investments on an ongoing basis pursuant to the DIP cash flow budget
? Below are the Company’s forecasts on a status quo basis (i.e. without a DIP)
HOLDINGS
On a status quo basis, Holdings would face a cash shortfall during the week of December 19th
Forecasted to end 2010 with a $1.1 million shortfall
LIMF interest payments are excluded from the base forecast
($7)
REGATTA
^$3
Excludes subordinated notes interest payment of $11.6 million due on December 1st
Revolver was fully drawn as of July 19th
Remaining $5.4 million drawn and $4.0 million intercompany investment made in Holdings
? Additional $2.5 million was invested in Holdings in August, and $1.1 million invested in September
STRICTLY CONFIDENTIAL
NOT TO BE SHARED WITH ANY PARTY
OTHER THAN RECIPIENT WITHOUT PRIOR
WRITTEN CONSENT OF THE COMPANY

IV Projected Financials
STRICTLY CONFIDENTIAL
NOT TO BE SHARED WITH ANY PARTY
OTHER THAN RECIPIENT WITHOUT PRIOR
WRITTEN CONSENT OF THE COMPANY
IV PROJECTED FINANCIALS
Business Plan Assumptions
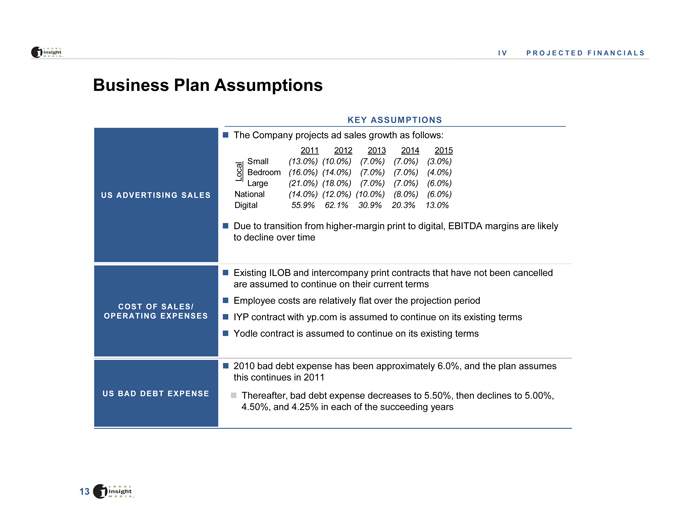
KEY ASSUMPTIONS
The Company projects ad sales growth as follows:
US ADVERTISING SALES
COST OF SALES/ OPERATING EXPENSES
US BAD DEBT EXPENSE
2011 2012 2013 2014 2015
- Small (13.0%) (10.0%) (7.0%) (7.0%) (3.0%)
| 8 |
|
Bedroom (16.0%) (14.0%) (7.0%) (7.0%) (4.0%) |
Large (21.0%) (18.0%) (7.0%) (7.0%) (6.0%)
National (14.0%) (12.0%) (10.0%) (8.0%) (6.0%)
Digital 55.9% 62.1% 30.9% 20.3% 13.0%
Due to transition from higher-margin print to digital, EBITDA margins are likely to decline overtime
Existing ILOB and intercompany print contracts that have not been cancelled are assumed to continue on their current terms
Employee costs are relatively flat over the projection period
IYP contract with yp.com is assumed to continue on its existing terms
Yodle contract is assumed to continue on its existing terms
2010 bad debt expense has been approximately 6.0%, and the plan assumes this continues in 2011
Thereafter, bad debt expense decreases to 5.50%, then declines to 5.00%, 4.50%, and 4.25% in each of the succeeding years
STRICTLY CONFIDENTIAL
NOT TO BE SHARED WITH ANY PARTY
OTHER THAN RECIPIENT WITHOUT PRIOR
WRITTEN CONSENT OF THE COMPANY
IV PROJECTED FINANCIALS
Regatta Business Plan Assumptions
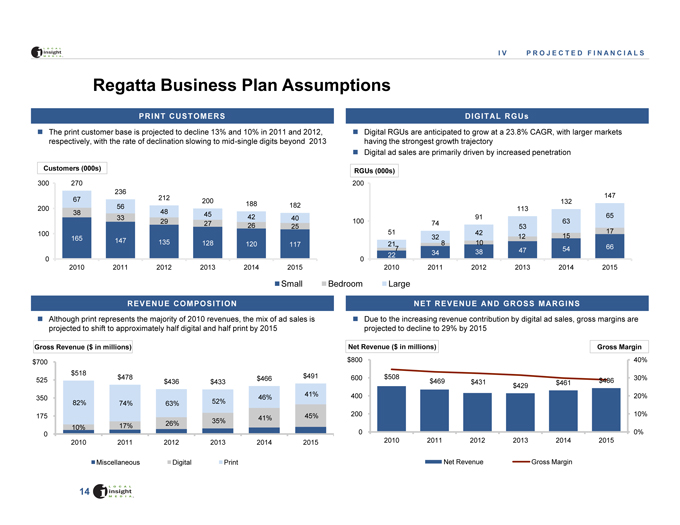
? The print customer base is projected to decline 13% and 10% in 2011 and 2012, respectively, with the rate of declination slowing to mid-single digits beyond 2013
Digital RGUs are anticipated to grow at a 23.8% CAGR, with larger markets having the strongest growth trajectory
Digital ad sales are primarily driven by increased penetration
Customers (000s)
300 270
236
» I » Z m—«
H M — _ S
100
0 I
2010 2011 2012 2013 2014 2015
RGUs (000s)
200
147 132 113
100
51 32 42 12 15 ^_
o i mm o D D D
2010 2011 2012 2013 2014 2015
Bedroom Large
? Although print represents the majority of 2010 revenues, the mix of ad sales is projected to shift to approximately half digital and half print by 2015
? Due to the increasing revenue contribution by digital ad sales, gross margins are projected to decline to 29% by 2015
Gross Revenue ($ in millions)
$700
525 . $518 $478 $436 $433 $466 $491
35°” 82o/0 740/o 63o/o 52o/0 46ro 4iro
175 o, 350/o 41% 45%
10% 17% ^6^ ^5^ ^^^ ^^^
2010 2011 2012 2013 2014 2015
? Miscellaneous Digital Print
Net Revenue ($ in millions) Gross Margin
$800 -I i- 40%
200 10%
2010 2011 2012 2013 2014 2015
Net Revenue —Gross Margin
PRINT CUSTOMERS
DIGITAL RGUs
REVENUE COMPOSITION
NET REVENUE AND GROSS MARGINS
$518 $478 $491 $466 $436 $433
STRICTLY CONFIDENTIAL
NOT TO BE SHARED WITH ANY PARTY
OTHER THAN RECIPIENT WITHOUT PRIOR
WRITTEN CONSENT OF THE COMPANY
IV PROJECTED FINANCIALS
Regatta Business Plan Assumptions (contd)
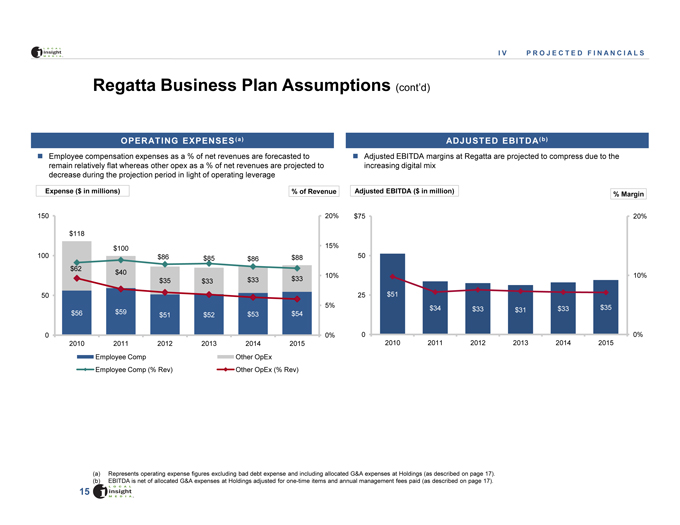
? Employee compensation expenses as a % of net revenues are forecasted to remain relatively flat whereas other opex as a % of net revenues are projected to decrease during the projection period in light of operating leverage
Expense ($ in millions) [jxTof Revenue
? Adjusted EBITDA margins at Regatta are projected to compress due to the increasing digital mix
Adjusted EBITDA ($ in million)
$118
$100
$86 $85 $86 $88
$62 $4Q —? »
$35 $33 $33 $33
2010 2011 2012 2013 2014 201t>
^^” Employee Comp Other OpEx
‘ Employee Comp (% Rev) » Other OpEx (% Rev)
Represents operating expense figures excluding bad debt expense and including allocated G&A expenses at Holdings (as described on page 17).
EBITDA is net of allocated G&A expenses at Holdings adjusted for one-time items and annual management fees paid (as described on page 17).
STRICTLY CONFIDENTIAL
NOT TO BE SHARED WITH ANY PARTY
OTHER THAN RECIPIENT WITHOUT PRIOR
WRITTEN CONSENT OF THE COMPANY
IV PROJECTED FINANCIALS
Regatta Financials
($ in millions)
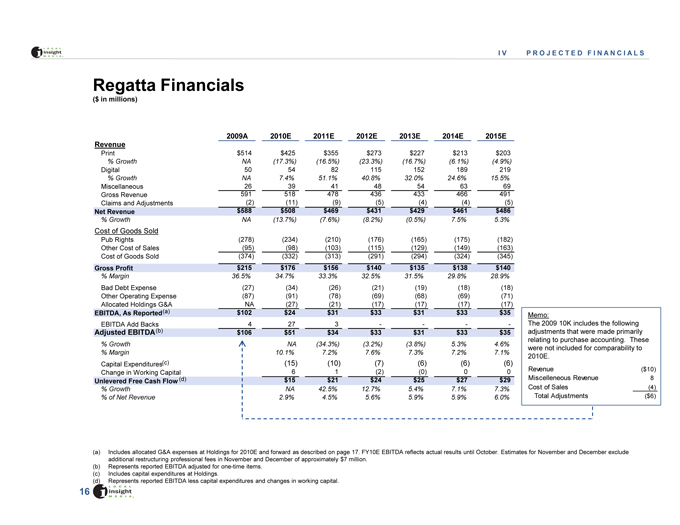
2009A 2010E 2011E 2012E 2013E 2014E 2015E Revenue
Print $514 $425 $355 $273 $227 $213 $203
% Growth NA (17.3%) (16.5%) (23.3%) (16.7%) (6.1%) (4.9%)
Digital 50 54 82 115 152 189 219
%Growth NA 7.4% 51.1% 40.8% 32.0% 24.6% 15.5%
Miscellaneous 26_ 39_ 41_ 48_ 54_ 63_ 69_
Gross Revenue 591 518 478 436 433 466 491
Claims and Adjustments (2)_ (11) (9)_ (5)_ (4)_ (4)_ (5)_
Net Revenue 5588” $508” $”469~ $431” $”429~ $461” $”486~
% Growth NA (13.7%) (7.6%) (8.2%) (0.5%) 7.5% 5.3%
Cost of Goods Sold
Pub Rights (278) (234) (210) (176) (165) (175) (182)
Other Cost of Sales (95) (98) (103) (115) (129) (149) (163)
Cost of Goods Sold (374) (332) (313) (291) (294) (324) (345)
Gross Profit $215 $176 $156 $140 $135 $138 $140
% Margin 36.5% 34.7% 33.3% 32.5% 31.5% 29.8% 28.9%
Bad Debt Expense (27) (34) (26) (21) (19) (18) (18)
Other Operating Expense (87) (91) (78) (69) (68) (69) (71)
Allocated Holdings G&A NA_ (27) (21) (17) (17) (17) (17)
EBITDA, As Reported(a) $102 $24 $31 $33 $31 $33 $35
EBITDA Add Backs 4_ 27_ 3_ -_ -_ -_ -_
Adjusted EBITDA(b> $106 $51 $34 $33 $31 $33 $35
% Growth A NA (34.3%) (3.2%) (3.8%) 5.3% 4.6%
% Margin 10.1% 7.2% 7.6% 7.3% 7.2% 7.1%
Capital Expenditures^) (15) (10) (7) (6) (6) (6)
Change in Working Capital 6 1 (2) (0) 0 0
Unlevered Free Cash Flow <d> $”15 $”21 $”24 $”25 $”27 $”29~
% Growth NA 42.5% 12.7% 5.4% 7.1% 7.3%
% of Net Revenue I 2.9% 4.5% 5.6% 5.9% 5.9% 6.0%
Memo:
The 2009 10K includes the following
adjustments that were made primarily
relating to purchase accounting. These
were not included for comparability to
2010E.
Revenue ($10)
Miscelleneous Revenue 8
Cost of Sales (4)
Total Adjustments ($6)
Includes allocated G&A expenses at Holdings for 2010E and forward as described on page 17. FY10E EBITDA reflects actual results until October. Estimates for November and December exclude additional restructuring professional fees in November and December of approximately $7 million.
Represents reported EBITDA adjusted for one-time items.
Includes capital expenditures at Holdings.
| (d) |
|
Represents reported EBITDA less capital expenditures and changes in working capital. |
STRICTLY CONFIDENTIAL
NOT TO BE SHARED WITH ANY PARTY
OTHER THAN RECIPIENT WITHOUT PRIOR
WRITTEN CONSENT OF THE COMPANY
IV PROJECTED FINANCIALS
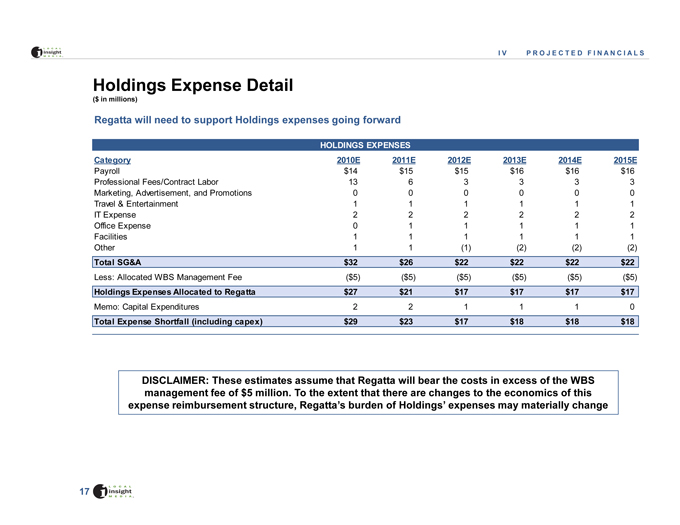
Holdings Expense Detail
($ in millions)
Regatta will need to support Holdings expenses going forward
Category 201OE 2011E 2012E 2013E 2014E 2015E
Payroll $14 $15 $15 $16 $16 $16
Professional Fees/Contract Labor 13 6 3 3 3 3
Marketing, Advertisement, and Promotions 0 0 0 0 0 0
Travel & Entertainment 111111
IT Expense 2 2 2 2 2 2
Office Expense 0 11111
Facilities 111111
Other 1 1 (1) (2) (2) (2)
|Total SG&A~ $32 $26 $22 $22 $22 $22 |
Less: Allocated WBS Management Fee ($5) ($5) ($5) ($5) ($5) ($5)
| Holdings Expenses Allocated to Regatta $27 $21 $17 $17 $17 $17 |
Memo: Capital Expenditures 2 2 1110
[Total Expense Shortfall (including capex) $29 $23 $17 $18 $18 $18 |
DISCLAIMER: These estimates assume that Regatta will bear the costs in excess of the WBS
management fee of $5 million. To the extent that there are changes to the economics of this
expense reimbursement structure, Regatta’s burden of Holdings’ expenses may materially change
STRICTLY CONFIDENTIAL
NOT TO BE SHARED WITH ANY PARTY
OTHER THAN RECIPIENT WITHOUT PRIOR
WRITTEN CONSENT OF THE COMPANY

Appendix
STRICTLY CONFIDENTIAL
NOT TO BE SHARED WITH ANY PARTY
OTHER THAN RECIPIENT WITHOUT PRIOR
WRITTEN CONSENT OF THE COMPANY
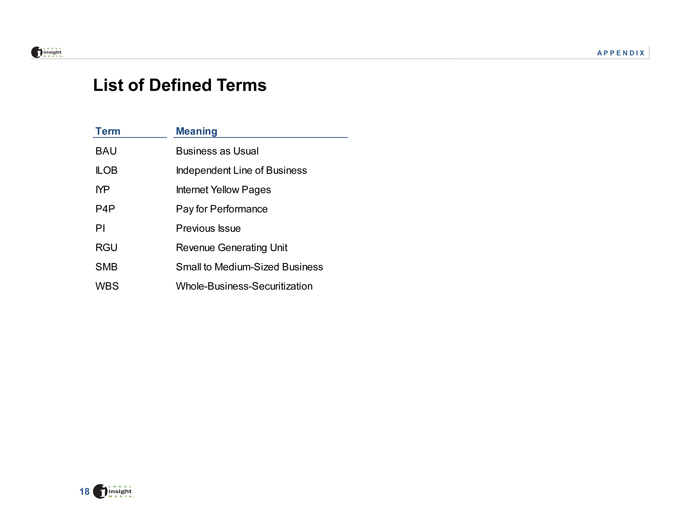
List of Defined Terms
Term Meaning
BAU Business as Usual
ILOB Independent Line of Business
IYP Internet Yellow Pages
P4P Pay for Performance
PI Previous Issue
RGU Revenue Generating Unit
SMB Small to Medium-Sized Business
WBS Whole-Business-Securitization
APPENDIX
STRICTLY CONFIDENTIAL
NOT TO BE SHARED WITH ANY PARTY
OTHER THAN RECIPIENT WITHOUT PRIOR
WRITTEN CONSENT OF THE COMPANY