Attached files
Table of Contents
UNITED STATES
SECURITIES AND EXCHANGE COMMISSION
WASHINGTON, D.C. 20549
FORM 10-K
(Mark One)
| þ | Annual Report Pursuant to Section 13 or 15(d) of the Securities Exchange Act of 1934 |
| For the fiscal year ended September 30, 2010 |
or
| ¨ | Transition Report pursuant to Section 13 or 15(d) of the Securities Exchange Act of 1934 |
| For the transition period from to |
Commission file number 000-22673
Sirona Dental Systems, Inc.
(Exact name of registrant as specified in charter)
| Delaware | 11-3374812 | |||
| (State or other jurisdiction of incorporation or organization) |
(I.R.S. Employer Identification No.) | |||
| 30-30 47th Avenue, Suite 500, Long Island City, New York |
11101 | (718) 937-5765 | ||
| (Address of principal executive offices) | (Zip Code) | (Telephone No.) | ||
Securities Registered Pursuant to Section 12(b) of the Act:
| Title of each class |
Name of each exchange on which registered | |
| Common stock, par value $0.01 per share | The NASDAQ Stock Market LLC |
Securities Registered Pursuant to Section 12(g) of the Act:
None
(Title of class)
Indicate by check mark if the registrant is a well-known seasoned issuer, as defined in Rule 405 of the Securities Act.
Yes þ No ¨
Indicate by check mark if the registrant is not required to file reports pursuant to Section 13 or Section 15(d) of the Act.
Yes ¨ No þ
Indicate by check mark whether the registrant (1) has filed all reports required to be filed by Section 13 or 15(d) of the Securities Exchange Act of 1934 during the preceding 12 months (or for such shorter period that the registrant was required to file such reports), and (2) has been subject to such filing requirements for the past 90 days.
Yes þ No ¨
Indicate by check mark whether the registrant has submitted electronically and posted on its corporate Website, if any, every Interactive Data File required to be submitted and posted pursuant to Rule 405 of Regulation S-T during the preceding 12 months (or for such shorter period that the registrant was required to submit and post such files).
Yes ¨ No ¨
Indicate by check mark if disclosure of delinquent filers pursuant to Item 405 of Regulation S-K is not contained herein, and will not be contained, to the best of registrant’s knowledge, in definitive proxy or information statements incorporated by reference in Part III of this Form 10-K or any amendment to this Form 10-K. ¨
Indicate by check mark whether the registrant is a large accelerated filer, an accelerated filer, a non-accelerated filer, or a smaller reporting company. See the definitions of “large accelerated filer,” “accelerated filer” and “smaller reporting company” in Rule 12b-2 of the Exchange Act. (Check one):
| Large accelerated filer | þ | Accelerated filer | ¨ | |||||
| Non-accelerated filer | ¨ | (Do not check if a smaller reporting company) | Smaller reporting company | ¨ | ||||
Indicate by check mark whether the registrant is a shell company (as defined in Rule 12b-2 of the Act). Yes ¨ No þ
The aggregate market value of common stock held by non-affiliates of the registrant as of March 31, 2010, the last business day of the registrant’s most recently completed second fiscal quarter, was approximately $1,306,687,982. Such aggregate market value is computed by reference to the closing sale price of the Common Stock on such date.
As of November 15, 2010, the number of shares outstanding of the Registrant’s Common Stock, par value $.01 per share, was 55,305,581.
DOCUMENTS INCORPORATED BY REFERENCE:
Portions of the registrant’s definitive proxy statement for its 2010 annual meeting of stockholders, which is expected to be filed with the Securities and Exchange Commission not later than January 28, 2011 are incorporated by reference into Part III of this report on Form 10-K. In the event such proxy statement is not filed by January 28, 2011 the required information will be filed as an amendment to this report on Form 10-K no later than that date.
Table of Contents
FORWARD-LOOKING STATEMENTS
This Form 10-K Annual Report contains forward-looking statements that involve risks and uncertainties. All statements, other than statements of historical facts, included in this Annual Report regarding the Company, its financial position, products, business strategy and plans and objectives of management of the Company for future operations, are forward-looking statements. When used in this Annual Report, words such as “anticipate,” “believe,” “estimate,” “expect,” “intend,” “objectives,” “plans” and similar expressions, or the negatives thereof or variations thereon or comparable terminology as they relate to the Company, its products or its management, identify forward-looking statements. Such forward-looking statements are based on the beliefs of the Company’s management, as well as assumptions made by and information currently available to the Company’s management. Actual results could differ materially from those contemplated by the forward-looking statements as a result of various factors, including, but not limited to, those contained in “Management’s Discussion and Analysis of Financial Condition and Results of Operations” in Item 7 of this Annual Report and the “Risk Factors” set forth in Item 1A of this Annual Report. All forward looking statements speak only as of the date of this Annual Report and are expressly qualified in their entirely by the cautionary statements included in this report. The Company undertakes no obligation to update or revise forward-looking statements which may be made to reflect events or circumstances that arise after the date made or to reflect the occurrence of unanticipated events other than required by law.
Table of Contents
3
Table of Contents
| ITEM 1. | BUSINESS |
Overview
Sirona Dental Systems, Inc. (“Sirona,” the “Company, “we,” “us,” and “our” refer to Sirona Dental Systems, Inc. and its consolidated subsidiaries and their predecessors) is the leading manufacturer of high-quality, technologically-advanced dental equipment, and is focused on developing, manufacturing and marketing innovative solutions for dentists around the world. The Company is uniquely positioned to benefit from several trends in the global dental industry, such as technological innovation, increased use of CAD/CAM systems in restorative dentistry, the shift to digital imaging, favorable demographic trends and growing patient focus on dental health and cosmetic appearance. Sirona provides a broad range of technologically advanced products in each of its four product segments:
| • | Dental CAD/CAM Systems; |
| • | Imaging Systems; |
| • | Treatment Centers; and |
| • | Instruments. |
Sirona markets its products globally to dental practices, clinics and laboratories through an international network of distributors. These dental distributors typically supply both dental equipment and consumables, and have regular contact with the ultimate end-users.
Sirona’s revenue for the fiscal year ended September 30, 2010 was $770.3 million. Sirona sells its products globally, with the U.S. market contributing 31% of revenue, or $239.5 million, the German market contributing 19% of revenue, or $148.3 million, and the rest of the world contributing 50% of revenue, or $382.4 million.
History
Sirona dates back to the establishment of Reiniger, Gebbert & Schall, which introduced the first dental electrical drill in 1882. In 1925, the Company became part of Siemens & Halske Group and in 1934 launched the smallest x-ray in the world, enabling dental x-rays for the first time. In 1956, Siemens introduced Sirona as a brand for treatment centers, and in 1958 the group developed the first ball-bearing turbine for dental drills.
In 1997, funds advised by the financial sponsor, Permira, acquired the Sirona dental business from Siemens in a leveraged buy-out transaction. Following the transaction, Sirona substantially increased its international sales and intensified its focus on product innovation. In November 2003, Permira sold Sirona to the Scandinavian financial sponsor, EQT, and management in a leveraged buy-out transaction that closed on February 16, 2004. On April 30, 2005, funds managed by Madison Dearborn Partners, a private equity firm, and Sirona’s management entered into an agreement to acquire Sirona in a leveraged buy-out transaction that closed on June 30, 2005.
On September 25, 2005, Schick Technologies, Inc. (“Schick”) entered into an Exchange Agreement with Sirona Holdings Luxco S.C.A. (“Luxco”) and Sirona Holding GmbH (“Sirona Holding”) providing for the issuance of 36,972,480 shares of Schick common stock to Luxco in exchange for Luxco’s entire economic interest in Sirona Holding, which consisted of all of the issued and outstanding share capital of Sirona Holding and the existing indebtedness of Sirona Holding owed to Luxco in the principal amount of Euro 151.0 million ($182 million) plus accrued interest (the “Exchange”). On June 20, 2006, the Exchange closed and Schick, a Delaware corporation formed in 1997, was renamed Sirona Dental Systems, Inc. Although Sirona Holding became a subsidiary of Schick upon the completion of the Exchange, Sirona Holding was deemed the acquiring corporation for accounting purposes because Luxco received a controlling ownership interest in the Company, Sirona Holding’s designees constituted a majority of the members of the Company’s board of directors and Sirona Holding’s senior management represented a majority of the senior management of the Company.
Schick’s business was founded in 1992 and completed an initial public offering of its common stock on July 1, 1997. Our common stock is currently traded publicly on the NASDAQ Global Select Market. In connection with the Exchange, we changed our trading symbol to “SIRO” from “SCHK.” Previously, from September 16, 1999 through December 20, 2005, Schick’s common stock was traded on the Over-the-Counter (“OTC”) Bulletin Board under the trading symbol “SCHK.”
4
Table of Contents
Industry/Products
Overview
The global dental market encompasses the diagnosis, treatment and prevention of disease and ailments of the teeth, gums and supporting bone. This market has enjoyed steady growth, driven by a number of factors, including an increased desire for aesthetics, a demographic shift towards an aging population coupled with a desire to retain tooth structure later in life, growth in disposable income, a desire for more convenience on the part of both dentists and patients, a shift towards private pay, a greater need for dental preventative care and technological innovation.
The global dental market has benefited from technological developments, which increase productivity for the dentist. This is particularly important in markets facing increased demand for dental services with little or no increase in the number of dentists servicing those markets. In addition, technological developments allow dentists to offer higher quality treatment to patients. We believe that the high-tech end of the dental market is growing at a faster pace than the overall dental market and that this trend will continue over time.
Recent technological advancements in the dental equipment industry include 3D radiography, digital radiography, CAD/CAM technology, and intra oral cameras.
The market we serve comprises the whole working environment of a dentist or dental technician, including the dentist’s chair, lights, imaging systems and dental CAD/CAM systems, instruments, as well as practice furniture and other dental or lab-based systems. These are important investments by the practitioner, and the products can have an average life cycle of 10-20 years (shorter for instruments and software), depending on the nature and quality of the product.
Products
Our principal products can be generally classified into the following segments: Dental CAD/CAM Systems, Imaging Systems, Treatment Centers and Instruments.
A brief description of each of our segments follows. See Note 23 to our consolidated financial statements for revenues and gross profit by segment for each of the last three fiscal years, and assets by segment, at September 30, 2010 and 2009.
Dental CAD / CAM Systems
Dental CAD/CAM Systems address the worldwide market for dental restorations, which includes several types of restorations, such as inlays, onlays, veneers, crowns, bridges, copings and bridge frameworks made from ceramic, metal or composite blocks. The global market for dental restorations can be divided into two sub-segments: in-mouth fillings and out-of-mouth pre-shaped restorations. CAD/CAM-produced ceramic restorations represent a growing portion of the out-of-mouth restoration market and the number of out-of-mouth restorations prepared with CAD/CAM systems has increased substantially over the past few years. At the same time, the number of dental practitioners and dental laboratories using CAD/CAM technology has increased. Sirona estimates that as of the end of fiscal year 2010, the market penetration for in-office CAD/CAM systems in the United States had grown to approximately 11% and increased to approximately 13% in Germany.
Sirona pioneered the application of high-tech CAD/CAM techniques to the traditional lab-based restoration process with the commercialization of the CEramic REConstruction, or CEREC, method. Sirona’s CEREC system is an in-office application that enables dentists to produce high quality restorations from ceramic material and insert them into the patient’s mouth during a single appointment. CEREC has a number of advantages compared to the traditional out-of-mouth pre-shaped restoration method, as CEREC does not require a physical model, restorations can be created in the dentist’s office and the procedure can be completed in a single visit. The CEREC system consists of an imaging unit and a milling unit. The imaging unit scans the damaged area, captures the image of the tooth or teeth requiring restoration and proposes the specifications for the restoration. The milling unit then mills the ceramic restoration to the required specifications based upon the captured image and the dentist’s design specifications. The result is a biocompatible, non-metallic, natural-looking restoration made of durable, high-quality ceramic materials completed in a single treatment session. Independent studies indicate that CEREC ceramic restorations are as durable as gold and can replace conventional restoration materials for most procedures. In addition, CEREC restorations are aesthetically pleasing and have the benefit of a natural-looking appearance.
In fiscal year 2003, Sirona launched its CEREC 3D product, an important development that allowed the dentist to view the onscreen restoration in three dimensions. This product has been periodically updated, including enhanced software applications. In fiscal year 2007, Sirona launched its next generation milling unit, the MC XL. The MC XL produces a high quality, precisely fitted restoration in half the time that the classic CEREC milling unit requires. Fiscal year 2007 also saw the
5
Table of Contents
roll out of Sirona’s “Biogeneric” software which virtually automates the CAD portion of the CAD/CAM process. This software has been further enhanced to include crowns and bridges and version 3.8 has been launched in fiscal year 2010. In January 2009, Sirona launched the CEREC AC Digital Impression Unit, which is based on the Bluecam technology, further strengthening its leadership position in the dental CAD/CAM market. The AC unit takes digital dental impressions quickly, more accurately and with improved workflow. This advanced digital impression acquisition unit significantly expands the range of clinical indications and gives CEREC dentists the choice of either creating the restoration in-office or sending a digital impression to a laboratory, which then fabricates the restoration from the digital model.
Sirona offers a service contract on its CEREC product, which includes software updates and upgrades and maintenance on software-related hardware.
In addition to CEREC, Sirona also offers CAD/CAM products for dental laboratories, including the inLab restoration fabrication system and the extra-oral inEos scanner. These products are designed to improve efficiency and reduce costs for the dental lab. The inLab system scans the models received from the dentists and then mills ceramic or composite block restorations, such as crown copings and bridge frameworks to the specifications of the captured image. In fiscal year 2007, Sirona launched its next generation inLab milling unit, the inLab MC XL. The new unit features a modern, elegant design with solid, heavy-duty construction. Milling performance and precision have been greatly enhanced and milling time has been considerably reduced. The inEos scanner, which was launched in 2005, is a high speed extra-oral scanner which produces 3D digital images from a single tooth up to a jaw, directly from the plaster model. In fiscal year 2010, the successor model inEos Blue was launched. inEos Blue is based on the Bluecam technology, is easy to use, fast, precise, flexible, and it’s auto capture function allows for substantial time savings.
In fiscal year 2004, Sirona started its central restoration service business for copings and bridge-frameworks in Germany and expanded the service to the United States in fiscal year 2006. The central restoration service allows dental labs to scan a plaster model received from the dentist and then transmit the digital image directly to Sirona via the internet. A bridge or coping is then created at Sirona’s central manufacturing site; with the final product shipped directly back to the lab.
In fiscal year 2008, we expanded our CEREC offering with the introduction of CEREC Connect. CEREC Connect is a web-based service that facilitates the electronic transmission of digital impressions acquired with a CEREC acquisition unit to inLab laboratories. Laboratories can use the digital impression to create final restorations. This process eliminates the need to take physical impressions, resulting in increased accuracy, less reworking of restorations and productivity savings.
The Dental CAD/CAM Systems segment contributed 34%, 35% and 31% to Sirona’s revenue for the fiscal years ended September 30, 2010, 2009 and 2008, respectively.
Imaging Systems
Imaging Systems comprise a broad range of digital and film-based systems for diagnostic imaging in the dental practice. Sirona has developed a comprehensive range of imaging systems for 2D and 3D, panoramic and intra-oral applications that allow the dentist to accommodate the patient in a more efficient manner.
Intra-oral x-ray systems use image-capture devices (film or sensor), which are inserted into the mouth behind the diagnostic area, and typically take images of one or two teeth. Panoramic x-ray systems produce images of the entire jaw structure by means of an x-ray tube and an image capture device, which rotates around the head.
In 2004, Sirona introduced its next generation of digital panoramic x-ray systems, the Orthophos XG line. The flagship model, the Orthophos XG Plus, provides specialists, orthodontists, oral surgeons and implantologists with over 30 programs and a wide variety of diagnostic possibilities. Other models of the family include the Orthophos XG 5 and the basic model Orthophos XG 3, both of which are designed for general dental practitioners.
As a result of the Exchange, we expanded our imaging system product line to include Schick’s CDR (computed digital radiography) system, the leading intra-oral digital imaging system in the United States. Schick’s product line includes an imaging sensor based on CMOS technology and the Schick Pan, a digital panoramic unit.
In fiscal year 2007, Sirona introduced its GALILEOS Comfort 3-D imaging unit. Today, three-dimensional imaging is offering dentists advanced diagnostic and therapeutic options in the fields of surgery, prosthetics, orthodontics, and restorative dentistry. The Company believes GALILEOS integrates these capabilities efficiently into dental practices. In July 2008, Sirona launched GALILEOS Compact, which is specifically tailored to meet the needs of the general practitioner. GALILEOS Comfort and GALILEOS Compact also have the ability to display traditional 2-D panoramic digital images. In fiscal year 2009, Sirona introduced software that facilitates the integration of Galileos 3D X-ray volume (bone level data) with
6
Table of Contents
a CEREC AC CAD/CAM scan (surface level information). This software allows the practitioner to plan both the implant surgery and the prosthetic at the start of the implant treatment session. This integrated process reduces the number of treatment sessions, results in greater accuracy and superior implant alignment. With this new software, the dental practitioner can now place more focus on the desired aesthetic outcome throughout the entire treatment process.
The Imaging Systems segment contributed 33%, 32% and 34% to Sirona’s revenue for the fiscal years ended September 30, 2010, 2009 and 2008, respectively.
Treatment Centers
Treatment Centers comprise a broad range of products from basic dentist chairs to sophisticated chair-based units with integrated diagnostic, hygiene and ergonomic functionalities, as well as specialist centers used in preventative treatment and for training purposes. Sirona offers specifically configured products to meet the preferences of dentists within each region in which it operates. Sirona’s treatment center configurations and system integration are designed to enhance productivity by creating a seamless workflow within the dental practice. Sirona’s centers therefore allow the dentist to both improve productivity and increase patient satisfaction, significant factors in adding value to his or her practice. In October 2004, Sirona acquired one of the leading Chinese manufacturers of basic treatment centers, located in Foshan (South China). This facility manufactures basic products for both the domestic Chinese market and export markets.
In July 2008, Sirona launched its new TENEO Treatment Center, which combines industry-leading technology with a timeless design that provides both patient and dentist with the ultimate in convenience and comfort.
The Treatment Centers segment contributed 21%, 21% and 22% to Sirona’s revenue for the fiscal years ended September 30, 2010, 2009 and 2008, respectively.
Instruments
Sirona offers a wide range of instruments, including handheld and power-operated handpieces for cavity preparation, endodontics, periodontology and prophylaxis. The instruments are supplemented by multi-function tips, supply and suction hoses, as well as care and hygiene systems for instrument preparation. Sirona’s instruments are often sold as packages in combination with treatment centers. During the last several years, Sirona introduced a variety of new products, including SIROLaser, a compact diode laser; PerioScan, an all-in-one ultrasonic scaling unit enabling both diagnosis and treatment of dental calculus with a single device; SIROEndo, a root canal preparation unit; and SIROPure, oil-free, power-driven handpieces.
Sirona intends to continue to strengthen the position of its Instruments segment as a diversified supplier of high-quality, reliable, user-friendly and cost-efficient dental instruments.
The Instruments segment contributed 12%, 12% and 13% to Sirona’s revenue for the fiscal years ended September 30, 2010, 2009 and 2008, respectively.
Manufacturing and Suppliers
Our main manufacturing and assembly activities are located in Bensheim, approximately 60 kilometers south of Frankfurt am Main, Germany. We also operate smaller manufacturing sites in New York, Italy, Denmark and China. All of our facilities are in good condition.
All of our manufacturing facilities have established and maintain a Quality Management System that is registered to ISO 9001:2000 and ISO 13485:2003. Our New York and Bensheim facilities also maintain a Device Establishment Registration with the United States Food and Drug Administration.
Manufacturing consists primarily of assembly, systems integration and testing. We generally outsource manufacturing of parts and components used in the assembly of our products but own the design and tools used by our key component suppliers. We do, however, manufacture most of the precision parts used for our instruments, and we also operate an Electronic Center for the supply of electronic boards and components.
7
Table of Contents
We purchase various components for our products from a number of outside suppliers. We currently have established relationships with approximately 1,300 suppliers, of which we view approximately 250 as “key suppliers.” Each supplier is selected according to stringent quality criteria, which are reviewed regularly. We do not believe we are dependent on one or a small group of suppliers and believe we could locate alternative suppliers if needed. For reasons of quality assurance or cost effectiveness, the Company relies on single sources for certain purchased components, e.g. sensors, which we use in our imaging segment. We work closely with our suppliers to help ensure continuity of supply while maintaining high quality and reliability. We have agreements in place and use a number of techniques, including security or consignment stock commitments, to address potential disruptions of the supply chain. We also own any custom tooling used in manufacturing these components. The Company has not experienced any significant difficulty in the past in obtaining the materials necessary to meet its production schedule. However, the need to replace one of our single source suppliers could cause a disruption in our ability to timely deliver certain of our products or increase costs. See Item 1A Risk Factors — “We are dependent upon a limited number of suppliers for critical components. If these suppliers delay or discontinue the manufacture of these components, we may experience delays in shipments, increased costs and cancellation of orders for our products.”
Sales and Marketing
Our sales and marketing efforts are directed through regional managers who oversee our sales professionals. These professionals work closely with our distribution partners to maximize the efficiency and productivity of their sales efforts. Our marketing initiatives are focused on highlighting Sirona’s leading role as a high-tech systems provider and industry innovator. In order to promote our brand and increase client loyalty, our distribution partners are supported through wide ranging advertising activities. In addition, we have been a key presenter at all major dental exhibitions, which are critical forums for raising brand awareness and new product introductions. Lastly, our product information is actively made available to business publications, dentists, journals, professional organizations and dental schools, and our website (www.sirona.com) is an important interactive platform for end-users as well as for distributors.
Distribution
Sirona distributes its products globally to dental practices, clinics and laboratories through an international network of more than 300 distributors. See Note 23 to our consolidated financial statements for a description of our net sales and long-lived assets by geographic region for the last three fiscal years. Because distributors typically cover both dental equipment and consumables, they have regular contact with the dentist and are therefore optimally positioned to identify new equipment sale opportunities. Sirona’s primary distributors are Patterson Companies and Henry Schein, two of the world’s largest dental distributors. In the United States, Patterson is Sirona’s primary distributor. Outside of the United States, Henry Schein is the company’s largest distributor. Patterson Companies and Henry Schein accounted for 30% and 15%, respectively, of Sirona’s worldwide revenue for the fiscal year ended September 30, 2010. Sirona distributes elsewhere through a well developed network of independent regional distributors. Sirona works closely with its distributors by training their technicians and sales representatives with respect to its products. With over 9,000 sales and service professionals trained each year, Sirona seeks to ensure high standards of quality in after-sale service and the best marketing of its products. The success of Sirona’s products is evidenced by their importance to its distribution partners, and in many cases are among their best selling offerings.
On April 27, 1998, Sirona and Patterson Companies entered into an exclusive distribution agreement (the “Distribution Agreement”) pursuant to which Patterson was appointed as the exclusive distributor of Sirona’s CEREC CAD/CAM products within the United States and Canada. Under the terms of the Distribution Agreement, Patterson’s exclusivity was to terminate on September 30, 2007. On June 30, 2005, Sirona and Patterson entered into an amendment of the Distribution Agreement which extended Patterson’s exclusivity from October 1, 2007 through September 30, 2017. As consideration for the extension of its exclusivity, Patterson agreed to make a one-time payment to Sirona in the amount of $100 million (the “Exclusivity Fee”). In July 2005, Patterson paid the Exclusivity Fee, in its entirety, to Sirona. The full amount of the Exclusivity Fee was recorded as deferred income and is being recognized on a straight-line basis commencing on October 1, 2007. In the event of termination of the Distribution Agreement (a) due to force majeure, (b) by Patterson due to Sirona’s insolvency, or (c) by Sirona as a result of a failure by Patterson to meet its performance obligations, Sirona would be required to refund to Patterson a portion of the Exclusivity Fee as liquidated damages. The amount of the Exclusivity Fee required to be refunded declines by $15 million per year in each of fiscal years 2008 through 2012 and by $5 million per year thereafter. In the event of termination by Patterson due to a breach by Sirona of its exclusivity obligations, the unearned portion of the Exclusivity Fee (as determined on a straight-line basis beginning in fiscal year 2008) must be refunded to Patterson as liquidated damages. The extension did not modify or alter the underlying provisions of the companies’ agreement through 2007, including the performance criteria necessary to maintain the exclusivity. The performance criteria are benchmark thresholds which afford Sirona the opportunity to abandon the exclusivity or to terminate the agreement with Patterson, but do not create minimum purchase obligations under a take-or-pay arrangement.
In April 2000, Schick and Patterson entered into an exclusive distribution agreement covering the United States and Canada; and as of May 1, 2000, Schick began marketing and selling its CDR dental products in the United States and Canada through Patterson. This contract was amended in July 2005, March 2007, and May 2010 and is due to expire on December 31, 2012.
8
Table of Contents
Sirona executes separate contracts with Henry Schein for each product group in each of the various jurisdictions in which Henry Schein distributes its products. The contracts governing most of the products distributed through Henry Schein are non-exclusive. Each of the contracts provides for minimum annual purchases, which are set annually. The contracts have terms of up to five years. Either party is entitled to terminate any of the contracts upon six months’ notice but generally not before the third anniversary of the contract. Sirona may terminate a contract upon 30 days’ notice in case of Henry Schein’s default under the terms of the contract.
Competition
Competition in the global dental market is fragmented by both geography and products. We compete with a variety of companies, including large international companies as well as smaller companies that compete regionally or on a narrower product line. Sirona competes on the basis of its comprehensive and innovative product line and its global distribution network.
Research and Development
Sirona commits significant resources to research and development, with a particular focus on developing products that offer new diagnostic and treatment options, while increasing comfort for both users and patients and streamlining process efficiency. Sirona spent approximately $46 million, $41 million and $49 million on research and development activities in the fiscal years ended September 30, 2010, 2009 and 2008, respectively, which represented approximately 6% of Sirona’s total revenue in each year. Sirona employs 223 professionals in its global research and development departments. Sirona also cooperates in its research efforts with partners in research facilities and dental practices around the world.
Patents, Trade Secrets and Proprietary Rights
We seek to protect our intellectual property through a combination of patent, trademark and trade secret protection. We believe that our future success will depend in part on our ability to obtain and enforce patents for our products and processes, preserve our trade secrets and operate without infringing the proprietary rights of others.
Patents
We have an active corporate patent program, the goal of which is to secure patent protection for our technology. Sirona owns and/or maintains approximately 700 patents and patent applications throughout the world. The patents expire at various dates through 2027. We also license or sublicense some of the technology used in our products from third parties.
Trademarks
We generally attempt to build brand awareness of our products through the use of trademark registrations. “Sirona,” “CEREC,” “Orthophos,” “Heliodent,” “inLab,” “CDR,” and “Schick” are some of our key registered trademarks. In addition, we have common law trademark rights in several other names we use commercially in connection with our products.
Trade Secrets
In addition to patent protection, we own trade secrets and proprietary know-how, which we seek to protect, in part, through appropriate agreements with employees, and, to a limited degree, employment agreements with appropriate individuals. These agreements generally allow assignment of confidential information developed by or made known to the individual by the Company during the course of the individual’s relationship with the Company as confidential and not to be disclosed to third parties, except in specific limited circumstances. The agreements also generally assign to the Company all inventions conceived by the individual in the course of rendering services to the Company. However, there can be no assurance that the Company will be successful in enforcing this policy in each case, that the Company would have adequate remedies available for any breach or that the Company’s trade secrets will not otherwise become known to, or independently developed by, its competitors.
9
Table of Contents
Regulation
Medical Devices
Most of our products require certain forms of regulatory clearance, including, but not limited to, marketing clearance by the United States Food and Drug Administration (the “FDA”) in accordance with the Federal Food, Drug and Cosmetic Act, as amended (the “FD&C Act”) and by our Notified Body in accordance with the European Union’s Medical Device Directive 93/42/EEC (“MDD”).
The FDA and MDD review process typically requires extended proceedings pertaining to product safety and efficacy. We believe that our future success will depend to a large degree upon commercial sales of improved versions of our current products and sales of new products; we will not be able to market such products in the U.S. or in the European Union without FDA or MDD clearance, respectively. There can be no assurance that any products developed by us in the future will be granted clearance by applicable regulatory authorities or that additional regulations will not be adopted or current regulations amended in such a manner as to adversely affect us.
Pursuant to the FD&C Act, the FDA regulates the introduction, manufacture, advertising, labeling, packaging, marketing and distribution of, and record-keeping for dental devices. The FDA classifies medical devices intended for human use into three classes: Class I, Class II, and Class III. The Company’s products are classified by the FDA into Class I or II that renders them subject only to general controls that apply to all medical devices, in particular regulations regarding alteration, misbranding, notification, record-keeping and good manufacturing practices.
The FD&C Act further provides that, unless exempted by regulation, medical devices may not be commercially distributed in the U.S. unless they have been cleared by the FDA. There are two review procedures by which medical devices can receive such clearance. Some products may qualify for clearance under a Section 510(k) procedure, in which the manufacturer submits to the FDA a pre-market notification that it intends to begin marketing the product, and shows that the product is substantially equivalent to another legally marketed product (i.e., that it has the same intended use and that it is as safe and effective as a legally marketed device, and does not raise different questions of safety and effectiveness than does a legally marketed device). Certain Class I devices are exempt from the 510(k) pre-market notification requirement and manufacturers of such products may proceed to market without any submission to the FDA. In some cases, the 510(k) notification must include data from human clinical studies.
Marketing in the U.S. may commence once the FDA issues a clearance letter finding such substantial equivalence. According to FDA regulations, the agency has 90 days in which to respond to a Class I or II 510(k) notification. There can be no assurance, however, that the FDA will provide a timely response, or that it will reach a finding of substantial equivalence.
If a product does not qualify for the 510(k) procedure (either because it is not substantially equivalent to a legally marketed device or because it is a Class III device), the FDA must approve a Pre-Market Approval (“PMA”) application before marketing can begin. PMA applications must demonstrate, among other things, that the medical device is safe and effective. A PMA application is typically a complex submission that includes the results of clinical studies. Preparation of such an application is a detailed and time-consuming process. Once a PMA application has been submitted, the FDA’s review process may be lengthy and include requests for additional data. By statute and regulation, the FDA may take 180 days to review a PMA application, although such time may be extended. Furthermore, there can be no assurance that the FDA will approve a PMA application.
The products that we distribute in the European Union bear the “CE Mark,” a European Union symbol of compliance with the MDD. In order to market our products in the member countries of the European Union, it is necessary that those products conform to the requirements of the MDD. Our Bensheim facility which is engaged in the manufacturing of Class IIa and Class IIb medical devices as defined by the MDD is ISO 13485 certified. It is also necessary that our products comply with any revisions which may be made to these standards or the MDD.
Medical devices are subject to ongoing regulatory oversight by the FDA and a Notified Body. The FD&C Act requires that all medical device manufacturers and distributors register annually with the FDA and submit a list of those medical devices which they distribute commercially. The MDD requires that Class IIa devices or higher bear a CE mark with a Notified Body Number. The FD&C Act and the MDD also requires that all manufacturers of medical devices comply with labeling requirements and manufacture their products and maintain their documents in a prescribed manner with respect to manufacturing, testing, and quality control activities. The FDA’s Medical Device Reporting regulation and the MDD subject medical devices to post-market reporting requirements for death or serious injury, and for certain malfunctions that would be likely to cause or contribute to a death or serious injury if malfunction were to recur. In addition, the FDA and the MDD
10
Table of Contents
prohibit a device which has received marketing clearance from being marketed for applications for which marketing clearance has not been obtained. Furthermore, the FDA generally requires that medical devices not cleared for marketing in the U.S. receive FDA marketing clearance before they are exported, unless an export certification has been granted. The FDA and the ISO Notified Bodies regularly inspect our registered and/or certified facilities.
Failure to comply with applicable regulatory requirements can, among other consequences, result in fines, injunctions, civil penalties, suspensions or loss of regulatory approvals, product recalls, seizure of products, operating restrictions and criminal prosecution. In addition, governmental regulations may be established that could prevent or delay regulatory clearance of our products. Delays in receipt of clearance, failure to receive clearance or the loss of previously received clearance would have a material adverse effect on our business, financial condition and results of operations.
Environmental, Health and Safety Matters
In addition to the laws and regulations discussed above, we are subject to government regulations applicable to all businesses, including, among others, regulations related to occupational health and safety, workers’ benefits and environmental protection. The extent of government regulation that might result from any future legislation or administrative action cannot be accurately predicted. Failure to comply with regulatory requirements could have a material adverse effect on our business, financial condition and results of operations.
Employees
As of September 30, 2010, the Company had 2,345 employees. The Company believes that its relations with its employees are good. No Company employees are represented by labor unions or are subject to a collective bargaining agreement in the United States. Approximately 25% of our German employees are members of the IG Metall union. We have not experienced any work stoppages due to labor disputes.
Executive Officers
See Part III, Item 10 of this 10-K Report for information about Executive Officers of the Company.
Available Information
Information about the Company’s products and services, stockholder information, press releases, and filings with the Securities and Exchange Commission (“SEC”) can be found on the Company’s Internet website at http://www.sirona.com. The information contained on our website is for informational purposes only and is not incorporated by reference into this report. The Company’s Annual Reports on Form 10-K, Quarterly Reports on Form 10-Q, Current Reports on Form 8-K, and other SEC filings, and any amendments to such reports and filings, are available free of charge at the Investor Relations section of the Company’s website as soon as reasonably practical after the Company’s material is filed with, or furnished to, the SEC.
11
Table of Contents
| ITEM 1A. | RISK FACTORS |
These risk factors may be important to understanding any statement in this Annual Report on Form 10-K or elsewhere. The following information should be read in conjunction with Management’s Discussion and Analysis of Financial Condition and Results of Operations (MD&A), and the consolidated financial statements and related notes incorporated by reference in this report.
Our businesses routinely encounter and address risks, some of which will cause our future results to be different - sometimes materially different - than we anticipate. Discussion about the material operational risks that our businesses encounter can be found in our MD&A, in the business descriptions in Item 1 of this report and in previous SEC filings. Below, we have described our present view of the material risks facing our business.
Risks Related to Our Business
We must develop new products and enhancements to existing products to remain competitive.
We are currently developing new products and enhancements to existing products. We cannot assure you that we will initiate, continue with and/or succeed in our efforts to develop or enhance such products. It is expected that we will file 510(k) applications with the Food and Drug Administration, or FDA, and similar filings with governmental authorities in other countries in connection with our future products and certain of our future product enhancements. There can be no assurance that we will file applications for or obtain regulatory approval from the FDA, either in the form of a pre-market clearance or a 510(k) clearance, for any of our future products, or that in order to obtain FDA clearance, we will not be required to submit additional data or meet additional FDA requirements that may substantially delay the application process and result in substantial additional expense. In addition, such pre-marketing clearance, if obtained, may be subject to conditions on marketing or manufacturing which could impede our ability to manufacture and/or market our products. There can be no assurance that any new products will be developed by us, or if developed, will be approved by, or receive marketing clearance from, applicable domestic and/or international governmental or regulatory authorities. If we are unable to develop, obtain regulatory approval for and market new products and enhancements to existing products, our business and results of operations could be harmed.
If we cannot obtain or maintain approval from government agencies, we will not be able to sell our products.
We must obtain certain approvals by, and marketing clearances from, governmental authorities, including the FDA and similar health authorities in foreign countries to market and sell our products in those countries. These regulatory agencies regulate the marketing, manufacturing, labeling, packaging, advertising, sale and distribution of medical devices. The FDA enforces additional regulations regarding the safety of X-ray emitting devices. Our products are currently regulated by such authorities and certain of our new products will require approval by, or marketing clearance from, various governmental authorities, including the FDA. Various states also impose similar regulations.
The FDA review process typically requires extended proceedings pertaining to the safety and efficacy of new products. A 510(k) application is required in order to market a new or modified medical device. If specifically required by the FDA, a pre-market approval, or PMA, may be necessary. Such proceedings, which must be completed prior to marketing a new medical device, are potentially expensive and time consuming. They may delay or hinder a product’s timely entry into the marketplace. Moreover, there can be no assurance that the review or approval process for these products by the FDA or any other applicable governmental authority will occur in a timely fashion, if at all, or that additional regulations will not be adopted or current regulations amended in such a manner as will adversely affect us. The FDA also oversees the content of advertising and marketing materials relating to medical devices which have received FDA clearance. Failure to comply with the FDA’s advertising guidelines may result in the imposition of penalties.
We are also be subject to other federal, state and local laws, regulations and recommendations relating to safe working conditions, laboratory and manufacturing practices. The extent of government regulation that might result from any future legislation or administrative action cannot be accurately predicted. Failure to comply with regulatory requirements could have a material adverse effect on our business.
Similar to the FDA review process, the EU review process typically requires extended proceedings pertaining to the safety and efficacy of new products. Such proceedings, which must be completed prior to marketing a new medical device, are potentially expensive and time consuming and may delay or prevent a product’s entry into the marketplace.
12
Table of Contents
Our business may be negatively affected if we do not continue to adapt to rapid technological change, evolving industry standards and new product introductions.
The market for our products is characterized by rapid and significant technological change, evolving industry standards and new product introductions. Our products require significant planning, design, development and testing which requires significant capital commitments and investment by us. There can be no assurance that our products or proprietary technologies will not become noncompetitive or obsolete as a result of technological change, evolving industry standards or new product introductions or that we will be able to generate any economic return on our investment in product development. If our products or technologies become noncompetitive or obsolete, our business could be negatively affected.
Our profitability may be negatively impacted by adverse general macroeconomic conditions in the geographic markets in which we sell our products.
Our profitability depends in part on the varying economic and other conditions of the global dental market, which in turn is impacted by general macroeconomic conditions in the geographic markets in which we sell our products. Growth in the global dental market over the past few years has been driven by a number of factors, including a growth in disposable income, a shift towards private pay, a greater need for dental preventative care and an increased emphasis on aesthetics. Demand for our products would be negatively impacted by a decline in the economy in general, including interest rate and tax changes, that impact the financial strength of our customers, as well as by changes in the economy in general that reduce disposable income among dental consumers in the markets we sell our products, which would in turn reduce the demand for preventative and aesthetic dental services.
The recent disruptions in the overall world economy and financial markets could reduce disposable income among dental consumers and negatively affect the demand for dental services, which could be harmful to our financial position and results of operations. Furthermore, there can be no assurances that government responses to the disruptions in the financial markets will stabilize the markets or increase liquidity and the availability of credit for our customers. Difficult economic conditions may also result in a higher rate of losses on our accounts receivable. As a result, our business, results of operations or financial condition could be materially adversely affected.
In the last two fiscal years, our business was impacted by the weak global economy, which resulted in a challenging environment for selling dental technologies. We have observed that some dentists are postponing investments in equipment.
We are dependent upon a limited number of distributors for a significant portion of our revenue, and loss of these key distributors could result in a loss of a significant amount of our revenue.
Historically, a substantial portion of our revenue has come from a limited number of distributors. For example, Patterson Dental Company, Inc. accounted for 30% of revenue for the fiscal year ended September 30, 2010. In addition, 15% of our revenue for the fiscal year ended September 30, 2010, was attributable to sales to Henry Schein, Inc. It is anticipated that Patterson and Henry Schein will continue to be the largest contributors to our revenue for the foreseeable future. There can be no assurance that Patterson and Henry Schein will purchase any specified minimum quantity of products from us or that they will continue to purchase any products at all. If Patterson or Henry Schein ceases to purchase a significant volume of products from us, it could have a material adverse effect on our results of operations and financial condition.
Competition in the markets for our products is intense, and we may not be able to compete effectively.
Competition relating to our current products is intense and includes various companies, both within and outside of the United States. We anticipate that competition for our future products will also be intense and include various companies, both within and outside of the United States, Asia and Europe. Our competitors and potential competitors include large companies with substantially greater financial, sales and marketing, and technical resources, larger and more experienced research and development staffs, more extensive physical facilities and substantially greater experience in obtaining regulatory approvals and in marketing products than we have. In addition, we cannot assure you that our competitors are not currently developing, or will not attempt to develop, technologies and products that are more effective than those being developed by us or that would otherwise render our existing and new technology and products obsolete or noncompetitive. We may not be able to compete successfully and may lose market share to our competitors.
Our failure to obtain issued patents and, consequently, to protect our proprietary technology could hurt our competitive position.
Our success will depend in part on our ability to obtain and enforce claims in our patents directed to our products, technologies and processes, both in the United States and in other countries. Risks and uncertainties that we face with respect to our patents and patent applications include the following:
| • | the pending patent applications that we have filed, or to which we have exclusive rights, may not result in issued patents or may take longer than we expect to result in issued patents; |
13
Table of Contents
| • | the allowed claims of any patents that issue may not provide meaningful protection; |
| • | we may be unable to develop additional proprietary technologies that are patentable; |
| • | the patents licensed or issued to us may not provide a competitive advantage; |
| • | other companies may challenge patents licensed or issued to us; |
| • | disputes may arise regarding inventions and corresponding ownership rights in inventions and know-how resulting from the joint creation or use of intellectual property by us and our respective licensors; and |
| • | other companies may design around the technologies patented by us. |
Our revenue and operating results are likely to fluctuate.
Our quarterly operating results have varied in the past, and our operating results are likely to continue to fluctuate in the future. These variations result from a number of factors, many of which are substantially outside of our control, including:
| • | the timing of new product introductions by us and our competitors; |
| • | timing of industry tradeshows, particularly the International Dental Show; |
| • | changes in relationships with distributors; |
| • | developments in government reimbursement policies; |
| • | changes in product mix; |
| • | our ability to supply products to meet customer demand; |
| • | fluctuations in manufacturing costs; |
| • | tax incentives; |
| • | currency fluctuations; and |
| • | general economic conditions, as well as those specific to the healthcare industry and related industries. |
Our financial results may be adversely affected by fluctuations in foreign currency exchange rates.
We are exposed to currency exchange risk with respect to the U.S. Dollar in relation to the Euro, because a large portion of our revenue and expenses are denominated in Euros. In addition, we have an increasing portion of revenue and expenses denominated in other foreign currencies, e.g. Yen, Australian Dollar, and Yuan Renminbi. While we enter into hedging arrangements to protect our business against certain currency fluctuations, these hedging arrangements from time to time do not provide comprehensive protection. We monitor changes in our exposure to exchange rate risk that result from changes in our situation. If we do not enter into effective hedging arrangements in the future, our results of operations and prospects could be materially and adversely affected.
Our hedging transactions may expose us to loss or limit our potential gains.
As part of our risk management program, we use foreign currency exchange forward contracts. While intended to reduce the effects of exchange rate fluctuations, these transactions may limit our potential gains or expose us to loss. Should our counterparties to such transactions or the sponsors of the exchanges through which these transactions are offered fail to honor their obligations due to financial distress or otherwise, we would be exposed to potential losses or the inability to recover anticipated gains from these transactions.
We enter into foreign currency exchange forward contracts as economic hedges of trade commitments or anticipated commitments denominated in currencies other than the functional currency to mitigate the effects of changes in currency rates. Although we do not enter into these instruments for trading purposes or speculation, and although our management believes all of these instruments are economically effective as hedges of underlying physical transactions, these foreign exchange commitments are dependent on timely performance by our counterparties. Their failure to perform could result in our having to close these hedges without the anticipated underlying transaction and could result in losses if foreign currency exchange rates have changed.
14
Table of Contents
Our indebtedness could have material adverse consequences for our business, cash flow, financial condition and results of operations.
We have total bank debt to unrelated parties of $370.7 million as of September 30, 2010. This level of indebtedness, combined with our other financial obligations and contractual commitments, could have important consequences to our business. For example, it could:
| • | increase the risk that we would be unable to generate cash sufficient to pay amounts due on our indebtedness; |
| • | make us more vulnerable to adverse changes in general economic, industry and competitive conditions and to adverse changes in government regulation; |
| • | require us to dedicate a substantial portion of our cash flow from operations to payments on our indebtedness, including any indebtedness we may incur in the future, thereby reducing the availability of our cash flows to fund working capital, capital expenditures, research and development, acquisitions and other general corporate purposes; |
| • | limit our flexibility in planning for, or reacting to, changes in our business and the industry in which we operate; |
| • | place us at a competitive disadvantage compared to our competitors that have less debt; and |
| • | limit our ability to borrow additional amounts or to sell capital stock for working capital, capital expenditures, research and development, acquisitions, debt service requirements or other general corporate purposes. |
Any of these factors could have a material adverse effect on us.
Restrictive covenants and conditions contained in our senior credit agreement impose operating and financial restrictions on our business.
Our senior credit agreement contains a number of restrictive covenants and conditions that impose operating and financial restrictions on our business, including restrictions on our ability to take actions that may be in the best interests of the business. These restrictions and conditions include a mandatory prepayment on a change in control or sale of all or substantially all assets, as well as significant restrictions on mergers and on any business acquisition. Other covenants limit changes to our business, lending activities, investments including joint ventures, further indebtedness, and the payment of dividends and capital share redemptions. The financial covenants require that we maintain a debt coverage ratio of consolidated total net debt to consolidated adjusted EBITDA of no more than 2.50 to 1, and a cash interest coverage ratio of consolidated adjusted EBITDA to cash interest costs of 4.00 to 1 or greater. Failure to comply with these covenants will result in a default under the terms of our senior credit agreement and could result in acceleration of this indebtedness. For more information concerning compliance with these covenants, please see Item 7. Management’s Discussion and Analysis of Financial Conditions and Results of Operations – Liquidity and Capital Resources.
If we lose our key management personnel or are unable to attract and retain qualified personnel, it could adversely affect our results of operations or delay or hurt our research and product development efforts.
Our success is dependent, in part, upon our ability to hire and retain management, sales, technical, research and other personnel who are in high demand and are often subject to competing employment opportunities. It is possible that the loss of the services of one or a combination of our senior executives or key managers could have an adverse effect on our operations.
We may experience difficulties managing our growth, which could adversely affect our results of operations.
It is expected that we will grow in certain areas of our operations as we develop and, assuming receipt of the necessary regulatory approvals, market our products. We will therefore need to recruit personnel, particularly sales and marketing personnel, and expand our capabilities, which may strain our managerial, operational, financial and other resources. To compete effectively and manage our growth, we must:
| • | train, manage, motivate and retain a growing employee base; |
15
Table of Contents
| • | accurately forecast demand for, and revenue from, our product candidates; and |
| • | expand existing operational, financial and management information systems to support our development and planned commercialization activities and the multiple locations of our offices. |
Our failure to manage these challenges effectively could materially harm our business.
Since we operate in markets outside of the United States and Europe, we are subject to additional risks.
We anticipate that sales outside of the United States and Europe will continue to account for a significant percentage of our revenue. Such revenue is subject to a number of uncertainties, including, but not limited to, the following:
| • | economic and political instability; |
| • | import or export licensing requirements; |
| • | trade restrictions; |
| • | longer payment cycles; |
| • | unexpected changes in regulatory requirements and tariffs; |
| • | fluctuations in currency exchange rates; |
| • | potentially adverse tax consequences; and |
| • | potentially weak protection of intellectual property rights. |
These risks may impair our ability to generate revenue from our sales efforts. In addition, many countries outside of the United States and Europe have their own regulatory approval requirements for the sale of products. As a result, the introduction of new products into, and our continued sale of existing products in, these markets could be prevented, and/or costly and/or time-consuming, and we cannot assure you that we will be able to obtain the required regulatory approvals on a timely basis, if at all.
We may be exposed to liabilities under the Foreign Corrupt Practices Act, and any determination that we violated the Foreign Corrupt Practices Act could have a material adverse effect on our business.
To the extent that we operate outside the United States, we are subject to the Foreign Corrupt Practices Act (the “FCPA”) which generally prohibits U.S. companies and their intermediaries from bribing foreign officials for the purpose of obtaining or keeping business or otherwise obtaining favorable treatment. In particular, we may be held liable for actions taken by our strategic or local partners even though such partners are foreign companies that are not subject to the FCPA. Any determination that we violated the FCPA could result in sanctions that could have a material adverse effect on our business.
We may be a party to legal actions that are not covered by insurance.
We may be a party to a variety of legal actions, such as employment and employment discrimination-related suits, employee benefit claims, breach of contract actions, tort claims, stockholder suits, including securities fraud, governmental investigations and intellectual property related litigation. In addition, because of the nature of our business, we are subject to a variety of legal actions relating to our business operations. Although we have maintained insurance coverage for some of these potential liabilities, we cannot assure you that such insurance coverage will continue to be available or, if available, that it can be obtained in sufficient amounts or at reasonable cost or that it will be sufficient to cover any claims that may arise. Other potential liabilities may not be covered by insurance, insurers may dispute coverage, or the amount of insurance may not be sufficient to cover the damages awarded. In addition, certain types of damages, such as punitive damages, may not be covered by insurance and/or insurance coverage for all or certain forms of liability may become unavailable or prohibitively expensive in the future.
16
Table of Contents
We are dependent upon a limited number of suppliers for critical components. If these suppliers delay or discontinue the manufacture of these components, we may experience delays in shipments, increased costs and cancellation of orders for our products.
We rely on key suppliers for various critical components and procure certain components from outside sources which are sole suppliers. The availability and prices of these components may be subject to change due to interruptions in production, changing market conditions and other events. Any delays in delivery of or shortages in these components could interrupt and delay manufacturing of our products and result in the cancellation of orders for our products. In addition, these suppliers could discontinue the manufacture or supply of these components at any time. We may not be able to identify and integrate alternative sources of supply in a timely fashion or at all. Any transition to alternate suppliers may result in delays in shipment and increased expenses and may limit our ability to deliver products to our customers. If we are unable to develop reasonably-priced alternative sources in a timely manner, or if we encounter delays or other difficulties in the supply of such products and other materials from third parties, our business and results of operations may be harmed. In past years, semiconductors have been subject to significant price fluctuations.
While we have, in the past, attempted to mitigate the effects of such potential fluctuations, we cannot assure you that we will continue to do so or that we will be able to successfully mitigate the effect of future price increases on our results of operations and financial condition. See Item 1 Business – Manufacturing and Suppliers.
Our profitability could suffer if third parties infringe upon our proprietary technology.
Our profitability could suffer if third parties infringe upon our intellectual property rights or misappropriate our technologies and trademarks for their own businesses. To protect our rights to our intellectual property, we rely on a combination of patent and trademark law, trade secret protection, confidentiality agreements and contractual arrangements with our employees, strategic partners and others. We cannot assure you that any of our patents, any of the patents of which we are a licensee or any patents which may be issued to us or which we may license in the future, will provide us with a competitive advantage or afford us protection against infringement by others, or that the patents will not be successfully challenged or circumvented by third parties, including our competitors. The protective steps we have taken may be inadequate to deter misappropriation of our proprietary information. We may be unable to detect the unauthorized use of, or take appropriate steps to enforce, our intellectual property rights. Effective patent, trademark and trade secret protection may not be available in every country in which we will offer, or intend to offer, our products. Any failure to adequately protect our intellectual property could devalue our proprietary content and impair our ability to compete effectively. Further, defending our intellectual property rights could result in the expenditure of significant financial and managerial resources.
Our products may infringe on the intellectual property rights of others.
Litigation may be necessary to enforce our patents or to defend against any claims of infringement of patents owned by third parties that are asserted against us. In addition, we may have to participate in one or more interference proceedings declared by the United States Patent and Trademark Office, the European Patent Office or other foreign patent governing authorities, to determine the priority of inventions, which could result in substantial costs.
If we become involved in litigation or interference proceedings, we may incur substantial expense, and the proceedings may divert the attention of our technical and management personnel, even if we ultimately prevail. An adverse determination in proceedings of this type could subject us to significant liabilities, allow our competitors to market competitive products without obtaining a license from us, prohibit us from marketing our products or require us to seek licenses from third parties that may not be available on commercially reasonable terms, if at all. If we cannot obtain such licenses, we may be restricted or prevented from commercializing our products.
The enforcement, defense and prosecution of intellectual property rights, including the United States Patent and Trademark Office’s, the European Patent Office’s and other foreign patent offices’ interference proceedings, and related legal and administrative proceedings in the United States and elsewhere, involve complex legal and factual questions. As a result, these proceedings are costly and time-consuming, and their outcome is uncertain. Litigation may be necessary to:
| • | assert against others or defend us against claims of infringement; |
| • | enforce patents owned by, or licensed to us from, another party; |
| • | protect our trade secrets or know-how; or |
| • | determine the enforceability, scope and validity of our proprietary rights or the proprietary rights of others. |
Changes in the healthcare industry could adversely affect our business.
The healthcare industry has undergone, and is in the process of undergoing, significant changes driven by efforts to reduce costs. These changes include legislative healthcare reform, the reduction of spending budgets by government and private insurance programs, such as Medicare, Medicaid and corporate health insurance plans; trends toward managed care; consolidation of healthcare distribution companies; consolidation of healthcare manufacturers; collective purchasing
17
Table of Contents
arrangements and consolidation among office-based healthcare practitioners; and changes in reimbursements to customers. Some of these potential changes may cause a decrease in demand for and/or reduce the prices of our products. These changes could adversely affect our revenues and profitability. In addition, similar legislative efforts in the future could adversely impact our business.
Product liability claims exposure could be significant.
We may face exposure to product liability claims and recalls for unforeseen reasons from consumers, distributors or others. We may experience material product liability losses in the future, and we may incur significant costs to defend these claims. In addition, if any of our products are or are alleged to be defective; we may be required to participate in a recall involving those products. End-users of our products may look to us for contribution when faced with product recalls or product liability claims. Although we have maintained insurance coverage related to product liability claims, we cannot assure you that product liability insurance coverage will continue to be available or, if available, that it can be obtained in sufficient amounts or at reasonable cost or that it will be sufficient to cover any claims that may arise. We may not maintain any insurance relating to potential recalls of our products. A successful product liability claim brought against us in excess of available insurance coverage or a requirement to participate in any product recall could reduce our profits and/or impair our financial condition, and damage our reputation.
Product warranty claims exposure could be significant.
We generally warrant each of our products against defects in materials and workmanship for a period of one year from the date of shipment plus any extended warranty period purchased by the customer. The future costs associated with providing product warranties could be material. A successful warranty claim brought against us could reduce our profits and/or impair our financial condition, and damage our reputation.
Adverse publicity regarding the safety of our technology or products could negatively impact us.
Despite any favorable safety tests that may be completed with respect to our products, adverse publicity regarding application of X-ray products or other products being developed or marketed by others could negatively affect us. If other researchers’ studies raise or substantiate concerns over the safety of our technology approach or product development efforts generally, our reputation could be harmed, which would adversely impact our business.
Inadequate levels of reimbursement from governmental or other third-party payers for procedures using our products may cause our revenue to decline.
Third-party payers, including government health administration authorities, private health care insurers and other organizations regulate the reimbursement of fees related to certain diagnostic procedures or medical treatments. Third-party payers are increasingly challenging the price and cost-effectiveness of medical products and services. While we cannot predict what effect the policies of government entities and other third-party payers will have on future sales of our products, there can be no assurance that such policies would not cause our revenue to decline.
We have developed and must continue to maintain internal controls.
Effective internal controls are necessary for us to provide assurance with respect to our financial reports and to effectively prevent fraud. If we cannot provide reasonable assurance with respect to our financial reports and effectively prevent fraud, our operating results could be harmed. The Sarbanes-Oxley Act of 2002 requires us to furnish a report by management on internal control over financial reporting, including managements’ assessment of the effectiveness of such control. Internal control over financial reporting may not prevent or detect misstatements because of its certain limitations, including the possibility of human error, the circumvention or overriding of controls, or fraud. As a result, even effective internal controls may not provide reasonable assurances with respect to the preparation and presentation of financial statements. In addition, projections of any evaluation of effectiveness of internal control over financial reporting to future periods are subject to the risk that the control may become either obsolete or inadequate as a result of changes in conditions, or that the degree of compliance with the policies or procedures may deteriorate. If we fail to maintain adequate internal controls, including any failure to implement required new or improved controls, or if we experience difficulties in implementing new or revised controls, our business and operating results could be harmed and we could fail to meet our reporting obligations.
18
Table of Contents
Risks Related to Our Common Stock
Future sales of our common stock may cause the market price for our common stock to decline even if our business is doing well.
Future sales by us or by our existing stockholders of substantial amounts of our common stock in the public market, or the perception that these sales may occur, could cause the market price of our common stock to decline.
Sirona Holdings Luxco SCA, or “Luxco”, requested that we register common stock that they own under the Securities Act pursuant to contractual registration rights, and on August 19, 2008, we filed a registration statement providing for the potential resale of up to 36,972,480 shares of our common stock. In August 2009, December 2009, and February 2010, Luxco sold 8,625,000, 7,100,000, and 7,000,000 shares, respectively, pursuant to underwritten public offerings. We cannot predict the size or timing of actual future sales of our common stock or the effect, if any, that future sales of shares of our common stock, or the expectation of such sales, would have on the market price of our common stock.
Our largest stockholder can exert influence over us and may have interests that diverge from yours.
At September 30, 2010, Luxco owned approximately 25% of our outstanding common stock. As a result, Luxco has the voting power to significantly influence our policies, business and affairs, and the outcome of any corporate transaction or other matter, including mergers, consolidations and the sale of all, or substantially all, of our assets. This concentration in ownership may have the effect of delaying, deterring, or preventing a change in control that otherwise could result in a premium in the price of our common stock.
Luxco may have interests that diverge from those of other holders of our common stock. As a result, Luxco may vote the shares it owns or otherwise cause us to take actions that may conflict with your best interests as a stockholder, which could adversely affect our results of operations and the trading price of our common stock.
Certain provisions of our certificate of incorporation and bylaws and Delaware law could discourage, delay, or prevent a merger or acquisition at a premium price.
The provisions of our certificate of incorporation and bylaws may also deter, delay or prevent a third-party from acquiring us. These provisions include:
| • | limitations on the ability of stockholders to amend our charter documents, including stockholder supermajority voting requirements; |
| • | the authority of the board of directors to adopt amendments to our bylaws without shareholder approval; |
| • | the inability of stockholders to act by written consent or to call special meetings; |
| • | a classified board of directors with staggered three-year terms; |
| • | advance notice requirements for nominations for election to the board of directors and for stockholder proposals; and |
| • | the authority of our board of directors to issue, without stockholder approval, up to 5,000,000 shares of preferred stock with such terms as the board of directors may determine and to issue additional shares of our common stock. |
We are also subject to the protections of Section 203 of the Delaware General Corporation Law, which prevents us from engaging in a business combination with a person who acquires at least 15% of our common stock for a period of three years from the date such person acquired such common stock, unless board or stockholder approval were obtained.
In addition, in the event of a “change of control” as defined in our senior credit agreement, we may be required to, among other things, repay all of our obligations outstanding under the senior credit agreement, with interest thereon, which could materially adversely impact the value of our common stock.
These provisions could have the effect of delaying, deferring or preventing a change in control of our company, discourage others from making tender offers for our shares, lower the market price of our stock or impede the ability of our stockholders to change our management, even if such changes would be beneficial to our stockholders.
19
Table of Contents
The market price of our common stock may fluctuate significantly, and this may make it difficult for holders to resell our common stock when they want or at prices that they find attractive.
The price of our common stock on the NASDAQ Global Select Market constantly changes. We expect that the market price of our common stock will continue to fluctuate. The market price of our common stock may fluctuate as a result of a variety of factors, many of which are beyond our control. These factors include:
| • | changes in market conditions; |
| • | quarterly variations in our operating results; |
| • | operating results that vary from the expectations of management, securities analysts and investors; |
| • | changes in expectations as to our future financial performance; |
| • | announcements of strategic developments, significant contracts, acquisitions and other material events by us, our competitors, or our distribution partners; |
| • | the operating and securities price performance of other companies that investors believe are comparable to us; |
| • | future sales of our equity or equity-related securities; |
| • | changes in the economy and the financial markets; |
| • | departures of key personnel; |
| • | changes in governmental regulations; and |
| • | geopolitical conditions, such as acts or threats of terrorism or military conflicts. |
In addition, in recent years, the stock market in general has experienced extreme price and volume fluctuations. This volatility has had a significant effect on the market price of securities issued by many companies for reasons often unrelated to their operating performance. These broad market fluctuations may adversely affect the market price of our common stock, regardless of our operating results.
20
Table of Contents
| ITEM 1B. | UNRESOLVED STAFF COMMENTS |
None.
| ITEM 2. | PROPERTIES |
The Company has its headquarters in Long Island City, New York. The Company leases space in Long Island City, New York. The lease expires in November 2012. The leased space houses executive offices and group functions including legal affairs and investor relations, sales and marketing, research and development laboratories and production and shipping facilities.
The Company has its largest facility in Bensheim, Germany. It is composed of a number of buildings housing the Company’s primary manufacturing and assembly facility. It also houses executive offices, finance, sales, customer service and marketing, research and development laboratories and shipping facilities. In fiscal year 2010 the Company started to expand the facilities by building a Center of Innovation, which will house the research and development professionals in Germany under one roof. The inauguration of this facility is planned for March 2011. In addition, since September 2007, the Company leased space in Salzburg, Austria. The leased space houses executive offices and group functions including strategy, sales, finance, accounting, human resources, marketing and legal affairs.
The Company also maintains manufacturing facilities in China, Italy and Denmark and certain sales and service offices worldwide.
The Company believes that its properties and facilities will be adequate for its needs for the foreseeable future and that, if such space proves to be inadequate, it will be able to procure additional or replacement space that will be adequate for its needs.
| ITEM 3. | LEGAL PROCEEDINGS |
The Company is involved in various legal proceedings that are incidental to the conduct of the Company’s business. The Company is not involved in any pending or threatened legal proceedings that the Company believes could reasonably be expected to have a material adverse effect on the financial condition or results of operations.
| ITEM 4. | (REMOVED AND RESERVED) |
21
Table of Contents
PART II
| ITEM 5. | MARKET FOR REGISTRANT’S COMMON EQUITY, RELATED STOCKHOLDER MATTERS AND ISSUER PURCHASES OF EQUITY SECURITIES |
Our common stock is currently traded publicly on the NASDAQ Global Select Market. In connection with the Exchange, we changed our trading symbol to “SIRO” from “SCHK”.
The following table presents quarterly information on the price range of our common stock. This information indicates the high and low sale prices, as quoted on NASDAQ commencing October 1, 2008. These prices do not include retail markups, markdowns or commissions.
| Fiscal Year Ended September 30, 2010 |
High | Low | ||||||
| First Quarter |
$ | 36.05 | $ | 26.15 | ||||
| Second Quarter |
38.72 | 30.15 | ||||||
| Third Quarter |
43.45 | 31.66 | ||||||
| Fourth Quarter |
37.65 | 29.55 | ||||||
| Fiscal Year Ended September 30, 2009 |
High | Low | ||||||
| First Quarter |
$ | 22.89 | $ | 8.47 | ||||
| Second Quarter |
15.11 | 9.91 | ||||||
| Third Quarter |
20.96 | 13.78 | ||||||
| Fourth Quarter |
30.61 | 20.17 | ||||||
On November 15, 2010, there were approximately 95 holders of record of the Company’s common stock. However, the Company believes that the number of beneficial owners of its common stock is substantially higher.
In connection with the Exchange, Schick declared a $2.50 per share dividend to stockholders of record as of the close of business on June 19, 2006. Since the Exchange, Sirona has not paid any dividends to holders of its common stock. The Company may consider paying dividends in the future, but currently has no plans to do so. The payment of dividends is within the discretion of the Board of Directors and will depend upon the Company’s earnings, its capital requirements, financial condition and other relevant factors. The payment of dividends is restricted by the terms of our senior credit facility.
No repurchases were made by the Company during the current fiscal year.
Performance Measurement Comparison
The following graph compares the Company’s cumulative stockholder return on its common stock with the return on the Russell 2000 Index and the Dow Jones US Medical Equipment Index from March 31, 2005 through September 30, 2010, the end of the Company’s fiscal year. The graph assumes investments of $100 on March 31, 2005, the last trading day of that fiscal year, in the Company’s common stock, the Russell 2000 Index and the US Medical Equipment Index and assumes the reinvestment of all dividends. In connection with the Exchange, the Company changed its fiscal year end from March 31 to September 30.
22
Table of Contents
COMPARISON OF 6 YEAR CUMULATIVE TOTAL RETURN*
Among Sirona Dental Systems, Inc, The Russell 2000 Index
And The Dow Jones US Medical Equipment Index
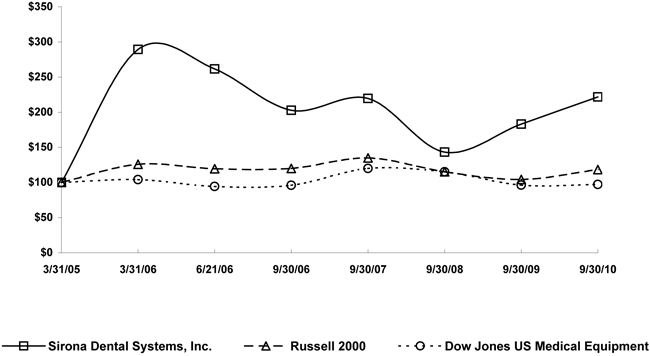
| * | $100 invested on 3/31/05 in stock or index-including reinvestment of dividends. |
| 3.31.2005 | 3.31.2006 | 6.21.2006 | 9.30.2006 | 9.30.2007 | 9.30.2008 | 9.30.2009 | 9.30.2010 | |||||||||||||||||||||||||
| Sirona Dental Systems Inc. |
$ | 100.00 | $ | 289.28 | $ | 261.59 | $ | 202.68 | $ | 219.55 | $ | 143.29 | $ | 183.11 | $ | 221.82 | ||||||||||||||||
| Russell 2000 |
100.00 | 125.85 | 119.52 | 120.05 | 134.86 | 115.33 | 104.32 | 118.24 | ||||||||||||||||||||||||
| Dow Jones US Medical Equipment |
100.00 | 104.18 | 94.39 | 95.92 | 119.89 | 115.22 | 96.33 | 97.23 | ||||||||||||||||||||||||
23
Table of Contents
| ITEM 6. | SELECTED FINANCIAL DATA |
The selected historical consolidated financial data of Sirona included below and elsewhere in this document are not necessarily indicative of future performance. This information is only a summary and should be read in conjunction with the sections entitled “Management’s Discussion and Analysis of Financial Condition and Results of Operations” and the consolidated financial statements contained elsewhere in this document.
| Year ended September 30, 2010 |
Year ended September 30, 2009 |
Year ended September 30, 2008 |
Year ended September 30, 2007 |
Year
ended September 30, 2006 (2) |
||||||||||||||||
| $’000s (except for per share amounts) | ||||||||||||||||||||
| Statement of Income Data: |
||||||||||||||||||||
| Revenue |
$ | 770,276 | $ | 713,294 | $ | 757,111 | $ | 659,949 | $ | 520,604 | ||||||||||
| Cost of sales |
371,266 | 367,152 | 411,489 | 355,475 | 278,685 | |||||||||||||||
| Gross profit |
399,010 | 346,142 | 345,622 | 304,474 | 241,919 | |||||||||||||||
| Operating expenses/(income): |
||||||||||||||||||||
| Selling, general and administrative expense |
235,932 | 225,351 | 242,293 | 203,597 | 148,715 | |||||||||||||||
| Research and development |
46,365 | 40,631 | 48,744 | 46,945 | 33,107 | |||||||||||||||
| Provision for doubtful accounts and notes receivable |
271 | 763 | 824 | 217 | 348 | |||||||||||||||
| Write off of in-process research and development |
— | — | — | — | 6,000 | |||||||||||||||
| Net other operating (income)/expense |
(11,661 | ) | (5,689 | ) | (10,000 | ) | (162 | ) | 1,733 | |||||||||||
| Operating income |
128,103 | 85,086 | 63,761 | 53,877 | 52,016 | |||||||||||||||
| Non-operating expense, net |
12,877 | 21,805 | 24,825 | 32,100 | 43,683 | |||||||||||||||
| Income before taxes |
115,226 | 63,281 | 38,936 | 21,777 | 8,333 | |||||||||||||||
| Income tax provision/(benefit) |
23,780 | 9,297 | 9,337 | (34,877 | ) | 7,360 | ||||||||||||||
| Net income |
91,446 | 53,984 | 29,599 | 56,654 | 973 | |||||||||||||||
| Less: Net income attributable to noncontrolling interests |
1,457 | 629 | 160 | 185 | 218 | |||||||||||||||
| Net income attributable to Sirona Dental Systems, Inc. |
$ | 89,989 | $ | 53,355 | $ | 29,439 | $ | 56,469 | $ | 755 | ||||||||||
| Income per share (attributable to Sirona Dental Systems, Inc. shareholders): |
||||||||||||||||||||
| - Basic |
1.63 | 0.97 | 0.54 | 1.03 | 0.02 | |||||||||||||||
| - Diluted |
1.59 | 0.96 | 0.53 | 1.02 | 0.02 | |||||||||||||||
| As of September 30, 2010 |
As of September 30, 2009 |
As of September 30, 2008 |
As of September 30, 2007 |
As of September 30, 2006 |
||||||||||||||||
| $’000s | ||||||||||||||||||||
| Balance Sheet Data (at end of period): |
||||||||||||||||||||
| Cash and cash equivalents |
$ | 251,767 | $ | 181,098 | $ | 149,663 | $ | 99,842 | $ | 80,560 | ||||||||||
| Working capital (1) |
297,606 | 251,070 | 214,361 | 131,871 | 101,765 | |||||||||||||||
| Total assets |
1,592,937 | 1,648,075 | 1,659,005 | 1,657,743 | 1,541,004 | |||||||||||||||
| Non-current liabilities |
625,219 | 758,910 | 857,637 | 885,807 | 929,009 | |||||||||||||||
| Total liabilities |
785,304 | 903,320 | 998,036 | 1,048,193 | 1,052,895 | |||||||||||||||
| Retained earnings (accumulated deficit) |
181,846 | 91,857 | 38,502 | 9,063 | (47,406 | ) | ||||||||||||||
| Shareholders’ equity (Sirona Dental Systems, Inc.) |
805,411 | 743,438 | 660,343 | 609,066 | 487,846 | |||||||||||||||
| Total shareholders’ equity |
807,633 | 744,755 | 660,969 | 609,550 | 488,109 | |||||||||||||||
| (1) | Working capital is defined as current assets less current liabilities. |
24
Table of Contents
| (2) | On September 25, 2005, Schick, a Delaware Corporation, which on June 20, 2006 was renamed Sirona Dental Systems, Inc. (“Sirona” or the “Company”), entered into an agreement with Luxco and Sirona Holding providing for the issuance of 36,972,480 shares of Schick common stock to Luxco in exchange for Luxco’s entire economic interest in Sirona Holding, which consisted of all of the issued and outstanding share capital of Sirona Holding and the existing indebtedness of Sirona Holding owed to Luxco in the principal amount of Euro 151 million plus accrued interest (the “Exchange”). The Exchange closed on June 20, 2006. For accounting purposes, the Exchange is accounted for as a reverse acquisition of Schick by Sirona Holding. The historical financial statements of Sirona Holding and its predecessor and the historical financial statements of the Company, and the acquisition by Sirona Holding of the assets and liabilities of Schick are accounted for under the purchase method of accounting. Results of operations of Schick and its wholly owned subsidiary have been included in financial statements from June 20, 2006, the effective date of the Exchange. |
25
Table of Contents
| ITEM 7. | MANAGEMENT’S DISCUSSION AND ANALYSIS OF FINANCIAL CONDITION AND RESULTS OF OPERATIONS |
The following discussion should be read in conjunction with the Consolidated Financial Statements included elsewhere in this Report. This discussion contains forward-looking statements based on current expectations that involve risks and uncertainties. Actual results and the timing of certain events may differ significantly from those projected in such forward-looking statements due to a number of factors, including those set forth in “Results of Operations” in this Item and elsewhere in this Report. Except as otherwise disclosed all amounts are reported in U.S. Dollars ($).
Overview
Sirona Dental Systems Inc. (“Sirona”, the “Company”, “we”, “us”, and “our” refer to Sirona Dental Systems, Inc. and its consolidated subsidiaries and their predecessors) is the leading manufacturer of high-quality, technologically advanced dental equipment, and is focused on developing, manufacturing and marketing innovative systems and solutions for dentists around the world. The Company is uniquely positioned to benefit from several trends in the global dental industry, such as technological innovation, increased use of CAD/CAM systems in restorative dentistry, the shift to digital imaging, favorable demographic trends and growing patient focus on dental health and cosmetic appearance. The Company has its headquarters in Long Island City, New York and its largest facility in Bensheim, Germany.
Sirona has a long tradition of innovation in the dental industry. The Company introduced the first dental electric drill approximately 130 years ago, the first dental X-ray unit approximately 100 years ago, the first dental computer-aided design/computer-aided manufacturing (“CAD/CAM”) system 25 years ago, and numerous other significant innovations in dentistry. Sirona continues to make significant investments in research and development, and its track record of innovative and profitable new products continues today with numerous, recent product launches including: the Galileos and CEREC combination (launched in September 2009), the CEREC AC unit (launched in January 2009), the Galileos Compact 3D imaging system (launched in July 2008), the TENEO treatment center (launched in July 2008) and the CAD/CAM milling unit MC XL (launched in fiscal year 2007).
Sirona manages its business on both a product and geographic basis and has four segments: Dental CAD/CAM Systems, Imaging Systems, Treatment Centers, and Instruments. Sirona has the broadest product portfolio in the industry, and is capable of fully outfitting and integrating a dental practice. Products from each category are marketed in all geographical sales regions.
The Company’s business has grown substantially over the past five years, driven by numerous high-tech product introductions, a continued expansion of its global sales and service infrastructure, strong relationships with key distribution partners, namely Patterson and Henry Schein, and an international dealer network. Due to the international nature of the Company’s business, movements in global foreign exchange rates have a significant effect on financial results.
The U.S. market is the largest individual market for Sirona, followed by Germany. Between fiscal years 2004 and 2010, the Company increased U.S. revenues from $88.2 million to $239.5 million, driven by innovative products, particularly in the CAD/CAM and imaging segments and the Schick acquisition. Patterson made a payment of $100 million to Sirona in July 2005 in exchange for the exclusive distribution rights for CAD/CAM products in the U.S. and Canada until 2017 (the “Patterson exclusivity payment”). The amount received was recorded as deferred income and is being recognized on a straight-line basis commencing at the beginning of the extension of the exclusivity period in fiscal year 2008.
In addition to strong U.S. market growth, Sirona has pursued expansion in non-U.S. and non-German markets. Between fiscal years 2004 and 2010, the Company increased revenues in non-U.S. and non-German markets from $190.9 million to $382.4 million. To support this growth, Sirona expanded its local presence and distribution channels by establishing sales and service locations e.g. in Japan, Australia, China, Korea, Italy, France, and the UK. The expansion helped to increase market share but also contributed to higher SG&A expenses.
The weak global economy in 2009 resulted in a challenging environment for selling dental technology, which impacted Sirona’s revenue and financial performance. In fiscal year 2009, total Company revenues increased 1.3% on a constant currency basis, with successful new product launches, including the CEREC AC, partially offsetting the weak economic trends. To deal with the weakened economy, the Company undertook certain targeted actions in 2009 to reduce operating costs and to increase efficiency on a longer term basis.
While the global economy improved in 2010, it did not fully recover and we continued to experience economic headwinds in fiscal year 2010. Despite these headwinds, Sirona increased revenues by 7.9% constant currency in fiscal year 2010, with strong growth in our Imaging segment driven by our Galileos 3D imaging system. In fiscal year 2010, our net
26
Table of Contents
income benefited from this revenue growth, but also from margin expansion, expense management initiatives, and debt reduction. Our targeted cost-saving actions were on plan, and we started reinvesting some of these cost savings in the second half of fiscal year 2010. Cash flow from operations was strong, mainly driven by higher cash flow from operations and lower interest payments.
Significant Factors that Affect Sirona’s Results of Operations
The MDP Transaction and the Exchange
On June 30, 2005, Sirona Holdings Luxco S.C.A. (“Luxco”), a Luxembourg-based holding entity owned by funds managed by Madison Dearborn Partners, Beecken Petty O’Keefe, management and employees of Sirona, obtained control over the Sirona business. The transaction was effected by using new legal entities, Sirona Holding GmbH (formerly Blitz 05-118 GmbH) and its wholly owned subsidiary Sirona Dental Services GmbH, to acquire 100% of the interest in Sirona Dental Systems Beteiligungs- und Verwaltungs GmbH, the former parent of the Sirona business through a leveraged buy-out transaction (the “MDP Transaction”).
The assets and liabilities acquired in the MDP Transaction and the Exchange were partially stepped up to fair value, and a related deferred tax liability was recorded. The excess of the total purchase price over the fair value of the net assets acquired, including IPR&D, which were expensed at the date of closing of the MDP Transaction and the Exchange, was allocated to goodwill and is subject to periodic impairment testing.
Sirona’s cost of goods sold, research and development, selling, general and administrative expense and operating result have been and will continue to be materially affected by depreciation and amortization costs resulting from the step-up to fair value of Sirona’s assets and liabilities.
Fluctuations in U.S. Dollar/Euro Exchange Rate
Although the U.S. Dollar is Sirona’s reporting currency, its functional currencies vary depending on the country of operation. For the fiscal year ended September 30, 2010, approximately 45% of Sirona’s revenue and approximately 71% of its expenses were in Euro. During the periods under review, the U.S. Dollar/Euro exchange rate has fluctuated significantly, thereby impacting Sirona’s financial results. Between October 1, 2007 and September 30, 2010, the U.S. Dollar/Euro exchange rate used to calculate items included in Sirona’s financial statements varied from a low of $1.1919 to a high of $1.6017. Although Sirona does not apply hedge accounting, Sirona has entered into foreign exchange forward contracts to manage foreign currency exposure. As of September 30, 2010, these contracts had notional amounts totaling $33.5 million. As these agreements are relatively short-term (generally six months), continued fluctuation in the U.S. Dollar/Euro exchange rate could materially affect Sirona’s results of operations.
Certain revenue information above and under “Results of Operations” below is presented on a constant currency basis. This information is a non-GAAP financial measure. Sirona supplementally presents revenue on a constant currency basis because it believes this information facilitates a comparison of Sirona’s operating results from period to period without regard to changes resulting solely from fluctuations in currency rates. Sirona calculates constant currency revenue growth by comparing current period revenues to prior period revenues with both periods converted at the U.S. Dollar/Euro average foreign exchange rate for each month of the current period. The average exchange rate for the fiscal year ended September 30, 2010, was $1.35730 and varied from $1.48990 to $1.22161. For the fiscal year ended September 30, 2009, the weighted average quarterly exchange rate used in converting Euro denominated revenues into U.S. Dollars in the Company’s financial statements prepared in accordance with U.S. GAAP was $1.35475 based on the average of the exchange rates for the individual quarters included within the year.
Loans made to Sirona under the Senior Facilities Agreement entered into on November 22, 2006 are denominated in the functional currency of the respective borrowers. See “Liquidity and Capital Resources” for a discussion of our Senior Facilities Agreement. However, intra-group loans are denominated in the functional currency of only one of the parties to the loan agreements. Where intra-group loans are of a long-term investment nature, the potential non-cash fluctuations in exchange rates are reflected within other comprehensive income. These fluctuations may be significant in any period due to changes in the exchange rates between the Euro and the U.S. Dollar.
27
Table of Contents
Fluctuations in Quarterly Operating Results
Sirona’s quarterly operating results have varied in the past and are likely to vary in the future. These variations result from a number of factors, many of which are substantially outside its control, including:
| • | the timing of new product introductions by us and our competitors; |
| • | timing of industry tradeshows, particularly the International Dental Show; |
| • | changes in relationships with distributors; |
| • | developments in government reimbursement policies; |
| • | changes in product mix; |
| • | our ability to supply products to meet customer demand; |
| • | fluctuations in manufacturing costs; |
| • | tax incentives; |
| • | currency fluctuations; and |
| • | general economic conditions, as well as those specific to the healthcare industry and related industries. |
Due to the variations which Sirona has experienced in its quarterly operating results, it does not believe that period-to-period comparisons of results of operations of Sirona are necessarily meaningful or reliable as indicators of future performance.
Effective Tax Rate
Sirona’s effective tax rate may vary significantly from period to period. As a global enterprise, the Company’s effective tax rate is affected by many factors. These factors include, but are not limited to, the actual distribution of profits across the different jurisdictions, tax planning initiatives, varying local tax rates, tax characteristics of income, as well as the timing and deductibility of expenses for tax purposes. The distribution of lower-taxed foreign earnings to the U.S. would generally increase the Company’s effective tax rate.
Results of Operations
The table below sets forth Sirona’s results of operations for the fiscal periods presented:
| Year ended September 30, 2010 |
Year ended September 30, 2009 |
Year ended September 30, 2008 |
||||||||||
| $’000 (except per share amounts) | ||||||||||||
| Revenue |
$ | 770,276 | $ | 713,294 | $ | 757,111 | ||||||
| Cost of sales |
371,266 | 367,152 | 411,489 | |||||||||
| Gross profit |
399,010 | 346,142 | 345,622 | |||||||||
| Operating expenses/(income): |
||||||||||||
| Selling, general and administrative expense |
235,932 | 225,351 | 242,293 | |||||||||
| Research and development |
46,365 | 40,631 | 48,744 | |||||||||
| Provision for doubtful accounts and notes receivable |
271 | 763 | 824 | |||||||||
| Net other operating (income) and restructuring costs |
(11,661 | ) | (5,689 | ) | (10,000 | ) | ||||||
| Operating income |
128,103 | 85,086 | 63,761 | |||||||||
| Foreign currency transactions loss/(gain), net |
7,160 | (1,248 | ) | (8,935 | ) | |||||||
| (Gain)/loss on derivative instruments |
(6,102 | ) | 151 | 6,660 | ||||||||
| Interest expense, net |
11,043 | 22,497 | 26,795 | |||||||||
| Other expense |
776 | 405 | 305 | |||||||||
| Income before taxes |
115,226 | 63,281 | 38,936 | |||||||||
| Income tax provision |
23,780 | 9,297 | 9,337 | |||||||||
| Net income |
91,446 | 53,984 | 29,599 | |||||||||
| Less: Net income attributable to noncontrolling interests |
1,457 | 629 | 160 | |||||||||
| Net income attributable to Sirona Dental Systems, Inc. |
$ | 89,989 | $ | 53,355 | $ | 29,439 | ||||||
| Income per share (attributable to Sirona Dental Systems, Inc. common shareholders): |
||||||||||||
| - Basic |
$ | 1.63 | $ | 0.97 | $ | 0.54 | ||||||
| - Diluted |
$ | 1.59 | $ | 0.96 | $ | 0.53 | ||||||
28
Table of Contents
Fiscal Year Ended September 30, 2010 compared to Fiscal Year Ended September 30, 2009
Revenue
Revenue for the fiscal year ended September 30, 2010 was $770.3 million, an increase of $57.0 million, or 8.0%, as compared with the fiscal year ended September 30, 2009. On a constant currency basis, adjusting for the fluctuations in the U.S. Dollar/Euro exchange rate, total revenue increased by 7.9%. By segment, Imaging Systems increased 11.4% (up 11.3% on a constant currency basis), Instruments increased 7.3% (up 7.1% on a constant currency basis), Treatment Centers increased 6.3% (up 6.1% on a constant currency basis), and CAD/CAM Systems increased 6.1% (up 6.0% on a constant currency basis). We were able to grow our revenues due to the demand for our innovative products, and we continue to benefit from our global sales and service infrastructure. Our products enable dental professionals to improve their clinical results and to increase the profitability of their practices.
Imaging segment revenues increased 11.4%, benefiting from the continued strong demand for digital products. Sales growth was particularly driven by the success of our Galileos 3D panoramic unit helped by the CEREC meets Galileos offering. Instruments segment revenues increased 7.3% and benefited from strong hygiene sales and high volume projects in several non-US markets.
The Treatment Centers segment revenues increased 6.3%. Continued strong Teneo sales as well as larger volume projects in non-US, non-European markets contributed to this development.
Dental CAD/CAM Systems segment revenues grew 6.1%, driven by the continued demand for this technology. The CEREC AC trade-in program for existing CEREC users supported the growth.
Revenue in the U.S. for the fiscal year ended September 30, 2010 was up 8.3% compared to prior year. Revenue growth was mainly driven by the Imaging segment and the success of Galileos. Revenue outside the U.S. increased by 7.9%. On a constant currency basis, adjusting for the fluctuations in the U.S. Dollar/Euro exchange rate, these revenues increased by 7.7%. Revenue growth was particularly strong in the Asia Pacific region and the Middle East. European markets showed solid performance.
Revenue growth on a constant currency basis was mainly volume driven. Prices in general remained stable, with the exception of pricing pressure and product mix shifts in the 2D and 3D panoramic imaging product lines.
29
Table of Contents
Cost of Sales
Cost of sales for the fiscal year ended September 30, 2010 was $371.3 million, a increase of $4.1 million, or 1.1%, as compared with the fiscal year ended September 30, 2009. Gross profit as a percentage of revenue was 51.8% compared to 48.5% in the prior year. Cost of sales included amortization and depreciation expense resulting from the step-up to fair values of tangible and intangible assets of $56.1 million as well as non-cash share-based compensation expense of $0.1 million for the fiscal year ended September 30, 2010, compared to amortization and depreciation expense resulting from the step-up to fair values of tangible and intangible assets of $66.1 million and non-cash share-based compensation expense of $0.3 million for the fiscal year ended September 30, 2009. Excluding these amounts, cost of sales as a percentage of revenue was 40.9% for the fiscal year ended September 30, 2010, compared with 42.2% for the fiscal year ended September 30, 2009, and therefore gross profit as a percentage of revenue was 59.1% compared to 57.8% in the prior year. The expansion in the gross profit margin was mainly due to product and regional mix and showed in all segments.
Selling, General and Administrative
For the fiscal year ended September 30, 2010, SG&A expense was $235.9 million, a increase of $10.6 million, or 4.7%, as compared with the fiscal year ended September 30, 2009. SG&A expense included amortization and depreciation resulting from the step-up to fair values of tangible and intangible assets of $3.3 million as well as non-cash share-based compensation expense in the amount of $13.3 million for the fiscal year ended September 30, 2010, compared with $4.0 million and $14.9 million, respectively, for the fiscal year ended September 30, 2009. Excluding these amounts, as a percentage of revenue, SG&A expense slightly decreased to 28.5% for the fiscal year ended September 30, 2010 as compared with 28.9% for the fiscal year ended September 30, 2009. The increase in the absolute SG&A expense is mainly driven by investments in sales and service infrastructure in international markets.
Research and Development
R&D expense for the fiscal year ended September 30, 2010 was $46.4 million, a increase of $5.7 million, or 14.1%, as compared with the fiscal year ended September 30, 2009.
R&D expense included non-cash share-based compensation expense in the amount of $0.2 million for the fiscal year ended September 30, 2010, compared with $0.5 million for the fiscal year ended September 30, 2009. Excluding this amount, as a percentage of revenue, R&D expense increased to 6.0% for the fiscal year ended September 30, 2010, compared to 5.6% for the fiscal year ended September 30, 2009.
The increase of the absolute R&D expense was primarily driven by the timing of new product launches.
Net Other Operating Income and Restructuring Costs
Net other operating income for the fiscal years ended September 30, 2010 and September 30, 2009 was $11.7 million and $5.7 million, respectively. In both periods, net other operating income included $10.0 million of income resulting from the amortization of the deferred income relating to the Patterson exclusivity payment. In the fiscal year ended September 30, 2010, net other operating income included a gain of $- 0.8 million from the release of the remaining accrued restructuring costs as well as a gain from the sale of a subsidiary in Italy of $0.9 million. In the fiscal year ended September 30, 2009, net other operating income included restructuring costs of $8.2 million, and a gain from the sale of a sales and service subsidiary in Spain of $3.9 million.
Restructuring Costs
In fiscal year 2009, we incurred restructuring costs of $8.2 million included in net other operating income for certain actions to reduce operating costs and thereby to improve the efficiency of our organization.
30
Table of Contents
As of September 30, 2009, we had accrued restructuring costs in the amount of $4.2 million. In the fiscal year ended September 30, 2010, we completed our restructuring efforts and released the remaining accrual of $- 0.8 million, as actual expenses were lower than the estimated restructuring costs. The development of restructuring costs in the current fiscal year is presented in the following table:
| Provision at October 1, 2009 |
Restructuring Costs/(Release) |
Payments | Currency translation adjustment |
Provision at September 30, 2010 |
||||||||||||||||
| $’000s | ||||||||||||||||||||
| Severance costs |
$ | 3,660 | $ | (755 | ) | $ | 2,567 | $ | (338 | ) | $ | — | ||||||||
| Consulting costs |
581 | — | 585 | 4 | — | |||||||||||||||
| Total |
$ | 4,241 | $ | (755 | ) | $ | 3,152 | $ | (334 | ) | $ | — | ||||||||
Loss/(Gain) on Foreign Currency Transactions
Loss on foreign currency transactions for the fiscal year ended September 30, 2010 amounted to $7.2 million compared to a gain of $1.2 million for the fiscal year ended September 30, 2009. For fiscal year 2010, the loss included an unrealized non-cash foreign currency loss of $5.7 million on the U.S. Dollar denominated deferred income from the translation adjustment of Patterson’s exclusivity payment and an unrealized non-cash foreign currency loss on the U.S. Dollar denominated short term intra-group loans to our Austrian entity of $5.1 million. Excluding these amounts, foreign currency transactions for fiscal year 2010 resulted in a gain of $3.6 million.
The gain for the fiscal year ended September 30, 2009 included an unrealized non-cash foreign currency gain of $1.5 million on the U.S. Dollar denominated deferred income from the translation adjustment of Patterson´s exclusivity payment, as well as a non-cash unrealized foreign currency gain on the U.S. Dollar denominated short term intra-group loans to our Austrian entity of $1.4 million. Excluding these amounts, foreign currency transactions for fiscal year 2009 resulted in a loss of $1.7 million.
(Gain)/Loss on Derivative Instruments
The gain on derivative instruments for the fiscal year ended September 30, 2010, amounted to $6.1 million compared to a loss of $0.2 million for the fiscal year ended September 30, 2009. For the fiscal year ended September 30, 2010, the gain included an unrealized non-cash gain of $6.4 million on interest swaps, as well as an unrealized non-cash loss on foreign currency hedges of $0.3 million. The loss for the fiscal year ended September 30, 2009, included an unrealized non-cash loss of $3.8 million on interest swaps, as well as a non-cash gain on foreign currency hedges of $3.7 million.
Interest Expense
Net interest expense for the fiscal year ended September 30, 2010, was $11.0 million, compared to $22.5 million for the fiscal year ended September 30, 2009. This decrease resulted from lower interest rates and lower overall debt levels.
Other Expenses
In December 2009, Luxco sold 7,100,000 shares pursuant to an underwritten follow-on public offering. The Company incurred $0.4 million of costs pursuant to the terms of a registration rights agreement.
In February 2010, Luxco sold 7,000,000 shares pursuant to an underwritten follow-on public offering. The Company incurred $0.4 million of costs pursuant to the terms of a registration rights agreement.
For the fiscal year ended September 30, 2009, Luxco sold 8,625,000 shares in August 2009 pursuant to an underwritten secondary public offering. $0.4 million of costs were incurred by the Company pursuant to the terms of a registration rights agreement.
Income Tax Provision
For the fiscal years ended September 30, 2010 and 2009, Sirona recorded a profit before income taxes of $115.2 million and $63.3 million, respectively. The average actual effective tax rate for these years was 20.6% and 14.7%, respectively. The income tax provision for the fiscal years ended September 30, 2010 and 2009 was $23.8 and $9.3 million, respectively. The income tax provision for the fiscal year ended September 30, 2009 included credits of $1.6 million to adjust for prior year items. In addition, a lower level of non tax-deductible items in relation to pre-tax income positively impacted the effective tax rate for the fiscal year ended September 30, 2009.
31
Table of Contents
Net Income
Sirona’s net income for the fiscal year ended September 30, 2010 was $91.4 million, an increase of $37.5 million, as compared with the fiscal year ended September 30, 2009. Major influencing factors on net income were the increase in revenues, lower costs resulting from the effects of restructuring and other cost-savings initiatives, the lower amortization of assets acquired in past business combinations, partially offset by the increase in the effective tax rate. The effective tax rate for fiscal year 2010 was 20.6%, up from 14.7% in fiscal year 2009. Fiscal year 2010 net income included amortization and depreciation expense resulting from the step-up to fair values of intangible and tangible assets related to past business combinations (i.e. the Exchange and the MDP Transaction - deal related amortization and depreciation) of $59.5 million ($47.2 million net of tax), unrealized, non-cash foreign currency losses on the deferred income from the Patterson exclusivity payment of $5.7 million ($4.5 million net of tax), losses on the revaluation of short-term intra-group loans of $5.1 million ($4.0 million net of tax), a gain on interest swaps of $6.4 million ($5.1 million net of tax), a gain on the release of the unused restructuring accrual of $0.8 million ($0.6 million net of tax), and a gain on a sale of a subsidiary of $0.9 million ($0.7 million net of tax).
Sirona’s net income for the fiscal year ended September 30, 2009 included deal related amortization and depreciation of assets acquired in past business combinations of $70.1 million ($59.8 million net of tax), currency revaluation gains on the Patterson exclusivity payment of $1.5 million ($1.3 million after tax), a loss on interest swaps of $3.9 million ($3.3 million net of tax), a gain on the revaluation of short-term intra-group loans of $1.4 million ($1.2 million net of tax), and a gain on the sale of a subsidiary of $3.9 million ($3.3 million net of tax).
Share-based compensation expense was $13.6 million ($10.8 million net of tax) in fiscal year 2010, compared to $15.7 million ($13.4 million net of tax) in fiscal year 2009.
Fiscal Year Ended September 30, 2009 compared to Fiscal Year Ended September 30, 2008
Revenue
Revenue for the fiscal year ended September 30, 2009 was $713.3 million, a decrease of $43.8 million, or 5.8%, as compared with the fiscal year ended September 30, 2008. On a constant currency basis, adjusting for the fluctuations in the U.S. Dollar/Euro exchange rate, total revenue increased by 1.3%. By segment, CAD/CAM Systems increased 3.4% (up 9.3% on a constant currency basis), Instruments decreased 9.1% (up 0.5% on a constant currency basis), Treatment Centers decreased 9.7% (flat on a constant currency basis), and Imaging Systems decreased 10.7% (down 5.4% on a constant currency basis).
All segments were impacted by the weak global economy, which resulted in a challenging environment for selling dental technology. In the current slowdown, we are seeing that some dentists are postponing investments in equipment. At the same time, they continue to demand innovative high tech products that improve their competitive position and increase their practice income; such products in general include CAD/CAM systems, digital imaging and Galileos 3D imaging systems. In fiscal year 2009, revenues were positively impacted by our new product launches, particularly the CEREC AC and TENEO, orders from the bi-annual international trade show “IDS” and larger projects from non-U.S., non-European markets.
Dental CAD/CAM Systems segment revenue growth benefited from the strong global reception of our new acquisition unit CEREC AC. The CEREC AC trade-in program for existing CEREC users supported the growth.
Despite the weak economic environment, Sirona’s Treatment Center revenue was flat on a constant currency basis. The Treatment Centers segment benefited from the TENEO treatment center launch and strong business in non-U.S., non-European markets.
Instruments segment revenue increased 0.5% on a constant currency basis, also impacted by the weak economic conditions. Instruments benefited from strong hygiene product sales as well as larger projects in several non-U.S. markets.
Imaging segment revenues were impacted by pricing pressure and the weak economic environment. However, Sirona maintained and in many regions expanded its market share in the segment. 3D imaging systems sales showed a solid performance.
Revenue in the U.S. for the fiscal year ended September 30, 2009 was flat compared to prior year. This overall development was driven by strong CAD/CAM sales, which was offset by lower sales in other segments.
Revenue outside the U.S. decreased by 8.2%. On a constant currency basis, adjusting for the fluctuations in the U.S. Dollar/Euro exchange rate, these revenues increased by 1.8%, with mixed results among the various countries. Revenue growth was particularly solid in Germany, Japan, Australia, and some other non-European markets. This solid growth was partly offset by declines in Spain, South Korea, Russia and the UK.
32
Table of Contents
Revenue growth on a constant currency basis was mainly volume driven. Prices in general remained stable, with the exception of pricing pressure and product mix shifts particularly in the 2D and 3D panoramic imaging product lines.
Cost of Sales
Cost of sales for the fiscal year ended September 30, 2009 was $367.2 million, a decrease of $44.3 million, or 10.8%, as compared with the fiscal year ended September 30, 2008. Gross profit as a percentage of revenue was 48.5% compared to 45.7% in the prior year. Cost of sales included amortization and depreciation expense resulting from the step-up to fair values of tangible and intangible assets of $66.1 million as well as non-cash option expense of $0.3 million for the fiscal year ended September 30, 2009, compared to amortization and depreciation expense resulting from the step-up to fair values of tangible and intangible assets of $85.0 million and non-cash option expense of $0.7 million for the fiscal year ended September 30, 2008. Excluding these amounts, cost of sales as a percentage of revenue was 42.2% for the fiscal year ended September 30, 2009, compared with 43.1% for the fiscal year ended September 30, 2008, and therefore gross profit as a percentage of revenue was 57.8% compared to 56.9% in the prior year. The increase in gross profit margin was due to product and regional mix.
Gross profit margins were impacted by the fluctuations in the Euro/U.S. Dollar exchange rate, as the majority of expenses are Euro denominated. The gross profit margin for the Instrument, Imaging Systems and Treatment Center segments were at or below the prior year levels, while CAD/CAM Systems margins expanded. The Imaging Systems gross profit margin in fiscal year 2009 was the result of a favorable product mix offset by pricing pressure.
Selling, General and Administrative
For the fiscal year ended September 30, 2009, SG&A expense was $225.4 million, a decrease of $16.9 million, or 7.0%, as compared with the fiscal year ended September 30, 2008. SG&A expense included amortization and depreciation resulting from the step-up to fair values of tangible and intangible assets of $4.0 million as well as non-cash option expense in the amount of $14.9 million for the fiscal year ended September 30, 2009, compared with $5.4 million and $13.8 million, respectively, for the fiscal year ended September 30, 2008. Excluding these amounts, as a percentage of revenue, SG&A expense decreased to 28.9% for the fiscal year ended September 30, 2009 as compared with 29.5% for the fiscal year ended September 30, 2008.
The decrease in SG&A was primarily due to the weaker Euro relative to the U.S. Dollar (as most of the expenses are Euro denominated), partially offset by increased expenses related to our expanded presence in Japan and Italy, and expenses for IDS. Fiscal year 2009 results benefited from short-term cost savings and deferral initiatives.
Research and Development
R&D expense for the fiscal year ended September 30, 2009 was $40.6 million, a decrease of $8.1 million, or 16.6%, as compared with the fiscal year ended September 30, 2008.
R&D expense included non-cash stock option expense in the amount of $0.5 million for the fiscal year ended September 30, 2009, compared with $1.0 million for the fiscal year ended September 30, 2008. Excluding this amount, as a percentage of revenue, R&D expense decreased to 5.6% for the fiscal year ended September 30, 2009, compared to 6.3% for the fiscal year ended September 30, 2008.
The decrease of the absolute R&D expense was primarily driven by the weaker Euro relative to the U.S. Dollar, as most R&D expenses were Euro denominated, and the timing of new product launches.
Net Other Operating Income and Restructuring Costs
Net other operating income for the fiscal year ended September 30, 2009, was $5.7 million, compared to $10.0 million for the fiscal year ended September 30, 2008. In both periods net other operating income included $10.0 million resulting from the amortization of the deferred income relating to the Patterson exclusivity payment. See Note 14 to our consolidated financial statements included elsewhere in this report for further information about the Patterson exclusivity payment.
33
Table of Contents
In the fiscal year ended September 30, 2009, net other operating income included a gain from the sale of a sales and service subsidiary of $3.9 million.
In December 2008, we announced certain actions to reduce operating costs and to improve the efficiency of our organization. These actions predominantly relate to overhead functions in Germany including increased automation of our processes, the optimization of the supply chain and increased efficiency in our administrative functions. For the fiscal year ended September 30, 2009, we incurred restructuring and other related costs of $8.2 million, consisting of employee severance pay and benefits and outside consulting fees directly related to the restructuring plan. Of these costs, $4.3 million have been paid in fiscal year 2009; the residual amount is expected to be paid in the first half of fiscal year 2010. No material increases in expenses or revenue reductions directly related to this plan are expected going forward. The Company anticipates annual cost savings from these initiatives to be approximately $10 million starting in fiscal year 2010. It is expected that these cost savings will impact future cost of goods sold in all segments, as well as SG&A and R&D expenses going forward.
The development of restructuring costs in the current fiscal year is presented in the following table:
| Provision at October 1, 2008 |
Restructuring Costs |
Payments | Currency translation adjustment |
Provision at September 30, 2009 |
||||||||||||||||
| $’000s | ||||||||||||||||||||
| Severance costs |
$ | — | $ | 4,825 | $ | 1,447 | $ | 282 | $ | 3,660 | ||||||||||
| Consulting costs |
— | 3,383 | 2,851 | 49 | 581 | |||||||||||||||
| Total |
$ | — | $ | 8,208 | $ | 4,298 | $ | 331 | $ | 4,241 | ||||||||||
Gain on Foreign Currency Transactions
Gain on foreign currency transactions for the fiscal year ended September 30, 2009 amounted to $1.2 million compared to a gain of $8.9 million for the fiscal year ended September 30, 2008. For fiscal year 2009, the gain mainly included realized and unrealized foreign currency gains due to fluctuations of the U.S. Dollar/Euro and Yen/Euro exchange rate. Additionally, the fiscal year 2009 gain included realized foreign currency gain and unrealized non-cash foreign currency gain of $1.5 million on the U.S. Dollar denominated deferred income from the translation adjustment of Patterson’s exclusivity payment and a non-cash unrealized foreign currency gain on the U.S. Dollar denominated short term intra-group loans to our Austrian entity of $1.4 million.
The gain for the fiscal year ended September 30, 2008 included realized foreign currency gain and unrealized non-cash foreign currency gain of $1.4 million on the U.S. Dollar denominated deferred income from the translation adjustment of Patterson’s exclusivity payment, as well as a non-cash foreign currency gain on the U.S. Dollar denominated short term intra-group loans to our Austrian entity of $0.6 million.
Loss on Derivative Instruments
The loss on derivative instruments for the fiscal year ended September 30, 2009, amounted to $0.1 million compared to a loss of $6.7 million for the fiscal year ended September 30, 2008. For the fiscal year ended September 30, 2009, the loss included an unrealized non-cash loss of $3.8 million on interest swaps, as well as an unrealized non-cash gain on foreign currency hedges of $3.7 million. The loss for the fiscal year ended September 30, 2008, included an unrealized non-cash loss of $2.1 million on interest swaps, as well as a non-cash loss on foreign currency hedges of $4.5 million.
Interest Expense
Net interest expense for the fiscal year ended September 30, 2009, was $22.5 million, compared to $26.8 million for the fiscal year ended September 30, 2008. This decrease resulted from variations in the U.S. Dollar/Euro exchange rates, lower interest rates and lower overall debt levels.
34
Table of Contents
Other Expenses
In August 2009, Luxco sold 8,625,000 shares pursuant to an underwritten secondary public offering. $0.4 million of costs were incurred by the Company pursuant to the terms of a registration rights agreement. For the fiscal year ended September 30, 2008, other expenses related to $0.3 million of real estate transfer taxes.
Income Tax Provision
For the fiscal years ended September 30, 2009 and 2008, Sirona recorded a profit before income taxes and minority interest of $63.3 million and $38.9 million, respectively. The average actual effective tax rate for these years was 14.7% and 24.0%, respectively. The income tax provision for the fiscal years ended September 30, 2009 and 2008 was $9.3 million, in each year. The income tax provision for the fiscal year ended September 30, 2009 included credits of $1.6 million to adjust for prior year items. In addition, a lower level of non tax-deductible items in relation to pre-tax income positively impacted the effective tax rate for the fiscal year ended September 30, 2009.
Net Income
Sirona’s net income for the fiscal year ended September 30, 2009 was $54.0 million, an increase of $24.4 million, as compared with the fiscal year ended September 30, 2008. Major influencing factors on net income were the lower effective tax rate, the lower amortization of assets acquired in past business combinations, partially offset by restructuring expenses. The effective tax rate for fiscal year 2009 was 14.7%, down from 24.0% in fiscal year 2008. Fiscal year 2009 net income included amortization and depreciation expense resulting from the step-up to fair values of intangible and tangible assets related to past business combinations (i.e. the Exchange and the MDP Transaction - deal related amortization and depreciation) of $70.1 million ($59.8 million net of tax), unrealized, non-cash foreign currency gains on the deferred income from the Patterson exclusivity payment of $1.5 million ($1.3 million net of tax), gains on the revaluation of short-term intra-group loans of $1.4 million ($1.2 million net of tax) and restructuring expenses of $8.2 million ($7.0 million net of tax), and a gain on a sale of a subsidiary of $3.9 million ($3.3 million net of tax).
Sirona’s net income for the fiscal year ended September 30, 2008 included deal related amortization and depreciation of assets acquired in past business combinations of $90.4 million ($68.7 million net of tax), currency revaluation losses on the Patterson exclusivity payment of $1.4 million ($1.1 million after tax) and a gain on the revaluation of short-term intra-group loans of $0.6 million ($0.5 million net of tax).
Option expense was $15.7 million ($13.4 million net of tax) in fiscal year 2009, compared to $15.6 million ($11.9 million net of tax) in fiscal year 2008.
Liquidity and Capital Resources
Historically, Sirona’s principal uses of cash, apart from operating requirements, including research and development expenses, have been for interest payments, debt repayment and acquisitions. Operating capital expenditures are approximately equal to operating depreciation (excluding any effects from the increased amortization and depreciation expense resulting from the step-up to fair values of Sirona’s and Schick’s assets and liabilities required under purchase accounting). Sirona’s management believes that Sirona’s working capital is sufficient for its present requirements.
The Senior Facilities Agreement contains restrictive covenants that limit Sirona’s ability to make loans, make investments (including in joint ventures), incur additional indebtedness, make acquisitions or pay dividends, subject to agreed exceptions. The Company has agreed to certain financial debt covenants in relation to the financing. The covenants stipulate that the Company must maintain certain ratios in respect of interest payments and defined earnings measures. If the Company breaches any of the covenants, the loans will be become repayable on demand.
35
Table of Contents
The financial covenants require that the Company maintain a debt coverage ratio (“Debt Cover Ratio”) of consolidated total net debt to consolidated adjusted EBITDA (“Consolidated Adjusted EBITDA”) of no more than 2.50 to 1, and a cash interest coverage ratio (“Cash Interest Cover Ratio”) of consolidated adjusted EBITDA to cash interest costs of 4.00 to 1 or greater. The Company is required to test its ratios as of September 30 and March 31. As calculated in accordance with the Senior Facilities Agreement, the following table presents the Company’s actual Debt Cover Ratio and Cash Interest Cover Ratio, and their respective components, for required testing periods in fiscal year 2010:
| Year
Ended September 30 2010 |
LTM March 31 2010 |
|||||||
| $’000s | ||||||||
| Consolidated Total Net Debt |
$ | 119.2 | $ | 205.2 | ||||
| Cash Interest Costs |
$ | 6.9 | $ | 11.1 | ||||
| Consolidated Adjusted EBITDA |
$ | 233.7 | $ | 248.1 | ||||
| Debt Cover Ratio |
0.51 | 0.83 | ||||||
| as set by covenants (less than or equal to) |
2.50 | 2.50 | ||||||
| Cash Interest Cover Ratio |
33.93 | 22.39 | ||||||
| as set by covenants (greater than or equal to) |
4.00 | 4.00 | ||||||
“Consolidated Adjusted EBITDA” means for the relevant period: the consolidated income before taxes from ordinary activities plus: (i) any consolidated net finance charges; (ii) any items treated as exceptional or extraordinary items, (iii) any realized or unrealized gains or losses with respect to borrowings due to movements in exchange rates occurring during such period to the extent the same has not resulted in a cash receipt or payment; (iv) any refinancing costs related to the senior facility and the Company’s former mezzanine facility and any costs related to the 2005 acquisition by MDP; (v) any amount attributable to the amortization of refinancing costs or costs of intangible assets or the depreciation of tangible assets and current assets or write off of research and development currently in progress incurred in connection with purchase price accounting (fair market value adjustments/step-up); (vi) option or similar non-cash expenses; and (vii) any non-recurring costs and expenses incurred in order to ensure compliance with Sarbanes-Oxley Act of 2002, less (i) the amount of any profit (and adding the loss) attributable to minority interests; and (ii) the amount of any profit of any investment or entity (which is not itself a member of the consolidated group) to the extent that the amount of such profit exceeds the amount received in cash. Set forth below is a reconciliation of Consolidated Adjusted EBITDA, as calculated under the Senior Facilities Agreement, to EBITDA and net income for the 12 months ended September 30, 2010 (in thousands). The measure Consolidated Adjusted EBITDA presented below is calculated in a different manner than EBITDA, presented elsewhere in this MD&A.
| Year Ended September 30 2010 |
LTM March 31 2010 |
|||||||
| $’000s | ||||||||
| Income before taxes |
$ | 115,226 | $ | 117,149 | ||||
| Consolidated Net Finance Charge |
10,027 | 18,997 | ||||||
| Exceptional or Extraordinary items (restructuring costs) |
(754 | ) | 5,438 | |||||
| Non-cash gains or losses due to movements in exchange rates – unrealized |
10,821 | (977 | ) | |||||
| Refinancing Costs |
1,016 | 1,186 | ||||||
| Profit attributable to noncontrolling interests |
(1,457 | ) | (1,840 | ) | ||||
| Depreciation/Amortization |
82,724 | 89,571 | ||||||
| Pension interest costs |
2,508 | 2,633 | ||||||
| Share-based compensation or similar non-cash expenses |
13,616 | 15,981 | ||||||
| Consolidated Adjusted EBITDA |
$ | 233,727 | $ | 248,138 | ||||
36
Table of Contents
Cash Flow
| Year ended September 30, 2010 |
Year ended September 30, 2009 |
Year ended September 30, 2008 |
||||||||||
| $’000s | ||||||||||||
| Net cash provided by operating activities |
$ | 175,669 | $ | 119,899 | $ | 94,685 | ||||||
| Net cash used in investing activities |
(23,206 | ) | (15,962 | ) | (36,794 | ) | ||||||
| Net cash used in financing activities |
(73,932 | ) | (78,418 | ) | (8,538 | ) | ||||||
| Increase in cash during the period |
$ | 78,532 | $ | 25,519 | $ | 49,353 | ||||||
Net Cash Provided by Operating Activities
Net cash provided by operating activities represents net cash from operations, returns on investments, and payments for interest and taxation. Net cash provided by operating activities was $175.7 million for fiscal year 2010 compared to $119.9 million for fiscal year 2009, and $94.7 million for fiscal year 2008. The primary contributing factors to the increase in cash provided by operating cash flows in fiscal year 2010 were (i) increase in operating income; (ii) improvement in working capital; and (iii) lower interest payments, driven by lower interest rates and lower debt. Net cash provided by operating activities for fiscal years 2009 and 2008 was impacted by (i) increases in operating income, partly offset by restructuring costs in fiscal year 2009; (ii) income tax refunds received in fiscal year 2009 in the amount of $10.8 million; and (iii) income tax payments, net of refunds, for the fiscal year and for prior years in the amount of $20.6 million and $43.1 million in fiscal year 2009 and fiscal year 2008, respectively.
Net Cash Used in Investing Activities
Net cash used in investing activities represents cash used for capital expenditures in the normal course of operating activities, financial investments, acquisitions and long-lived asset disposals. The primary contributors to the investing cash outflow in the periods presented are capital expenditures in the course of normal operating activities and the cash effect from the sale of a subsidiary in fiscal year 2010 as well as fiscal year 2009.
Net cash used in investing activities was $23.2 million for the fiscal year ended September 30, 2010, compared to $16.0 million for the fiscal year ended September 30, 2009, and $36.8 million for the fiscal year ended September 30, 2008. The primary contributors to the investing cash outflow in fiscal year 2010 were (i) capital expenditures and software developed for sale, related to product launches, partially offset by (ii) proceeds from the sale of a manufacturing subsidiary in Italy, and (iii) a subsequent payment resulting from a purchase price adjustment for a manufacturing subsidiary in China. The primary contributors in 2009 were investments in special tools and software developed for sale, related to product launches, partially offset by proceeds from the sale of a sales and service subsidiary in Spain; and the primary contributors in 2008 were investments in special tools and software developed for sale, related to product launches.
Net Cash Used in Financing Activities
Net cash used in financing activities was $73.9 million for the fiscal year ended September 30, 2010, compared to net cash used in financing activities of $78.4 million for the fiscal year ended September 30, 2009 and net cash used in financing activities of $8.5 million for the fiscal year ended September 30, 2008. Net cash used in financing activities in fiscal year 2010 relates mainly to the early repayment of senior debt that was originally due in November 2010 eight months ahead of schedule. Net cash used in financing activities in fiscal year 2009 related mainly to the early repayment of senior debt that was originally due in November 2009 six months ahead of schedule. Net cash used in financing activities in fiscal year 2008 related mainly to the repayment of the revolving credit facility of the Company.
Sirona believes that its operating cash flows and available cash (including restricted cash), together with its long-term debt borrowings, will be sufficient to fund its working capital needs, research and development expenses, anticipated capital expenditures, and debt service requirements for the foreseeable future.
37
Table of Contents
Other Financial Data:
| Year ended September 30, 2010 |
Year ended September 30, 2009 |
Year ended September 30, 2008 |
||||||||||
| $’000s | ||||||||||||
| Net income attributable to Sirona Dental Systems, Inc. |
$ | 89,989 | $ | 53,355 | $ | 29,439 | ||||||
| Net interest expense |
11,043 | 22,497 | 26,795 | |||||||||
| Provision for income taxes |
23,780 | 9,297 | 9,337 | |||||||||
| Depreciation |
21,880 | 20,110 | 17,744 | |||||||||
| Amortization |
60,844 | 71,486 | 91,649 | |||||||||
| EBITDA |
$ | 207,536 | $ | 176,745 | $ | 174,964 | ||||||
EBITDA is a non-GAAP financial measure that is reconciled to net income, its most directly comparable U.S. GAAP measure, in the accompanying financial tables. EBITDA is defined as net earnings before interest, taxes, depreciation, and amortization. Sirona’s management utilizes EBITDA as an operating performance measure in conjunction with U.S. GAAP measures, such as net income and gross margin calculated in conformity with U.S. GAAP. EBITDA should not be considered in isolation or as a substitute for net income prepared in accordance with U.S. GAAP. There are material limitations associated with making the adjustments to Sirona’s earnings to calculate EBITDA and using this non-GAAP financial measure. For instance, EBITDA does not include:
| • | interest expense, and because Sirona has borrowed money in order to finance its operations, interest expense is a necessary element of its costs and ability to generate revenue; |
| • | depreciation and amortization expense, and because Sirona uses capital and intangible assets, depreciation and amortization expense is a necessary element of its costs and ability to generate revenue; and |
| • | tax expense, and because the payment of taxes is part of Sirona’s operations, tax expense is a necessary element of costs and impacts Sirona’s ability to operate. |
In addition, other companies may define EBITDA differently. EBITDA, as well as the other information in this filing, should be read in conjunction with Sirona’s consolidated financial statements and footnotes.
In addition to EBITDA, the accompanying financial tables also set forth certain supplementary information that Sirona believes is useful for investors in evaluating Sirona’s underlying operations. This supplemental information includes gains/losses recorded in the periods presented which relate to the early extinguishment of debt, share based compensation, revaluation of the U.S. Dollar-denominated exclusivity payment and borrowings where the functional currency is the Euro, and the Exchange. Sirona’s management believes that these items are either nonrecurring or non-cash in nature, and should be considered by investors in assessing Sirona’s financial condition, operating performance and underlying strength.
Sirona’s management uses EBITDA together with this supplemental information as an integral part of its reporting and planning processes and as one of the primary measures to, among other things:
| (i) | monitor and evaluate the performance of Sirona’s business operations; |
| (ii) | facilitate management’s internal comparisons of the historical operating performance of Sirona’s business operations; |
| (iii) | facilitate management’s external comparisons of the results of its overall business to the historical operating performance of other companies that may have different capital structures and debt levels; |
| (iv) | analyze and evaluate financial and strategic planning decisions regarding future operating investments; and |
38
Table of Contents
| (v) | plan for and prepare future annual operating budgets and determine appropriate levels of operating investments. |
Sirona’s management believes that EBITDA and the supplemental information provided is useful to investors as it provides them with disclosures of Sirona’s operating results on the same basis as that used by Sirona’s management.
Supplemental Information
| Year ended September 30, 2010 |
Year ended September 30, 2009 |
Year ended September 30, 2008 |
||||||||||
| $’000s | ||||||||||||
| Share-based compensation |
$ | 13,616 | $ | 15,726 | $ | 15,556 | ||||||
| Unrealized, non-cash loss/(gain) on revaluation of the carrying value of the $-denominated exclusivity fee |
5,713 | (1,482 | ) | (1,424 | ) | |||||||
| Unrealized, non-cash loss/(gain) on revaluation of the carrying value of short-term intra-group loans |
5,108 | (1,380 | ) | (565 | ) | |||||||
| $ | 24,437 | $ | 12,864 | $ | 13,567 | |||||||
Long-term debt
Senior Facilities Agreement
On November 22, 2006, Sirona Dental Systems, Inc. entered into a senior facilities agreement (the “Senior Facilities Agreement”) as original guarantor, with Schick Technologies, Inc., a New York company and wholly owned subsidiary of Sirona (“Schick NY”), as original borrower and original guarantor, with Sirona Dental Systems GmbH, as original borrower and original guarantor, with Sirona Dental Services GmbH, as original borrower and original guarantor and with Sirona Dental Systems LLC, Sirona Holding GmbH (subsequently merged with Sirona Dental Services GmbH) and Sirona Immobilien GmbH as original guarantors. Initial borrowings under the Senior Facilities Agreement plus excess cash were used to retire the outstanding borrowings under the Company’s previous credit facilities.
The Senior Facilities Agreement includes: (1) a term loan A1 in an aggregate principal amount of $150 million (the “tranche A1 term loan”) available to Sirona’s subsidiary, Schick NY, as borrower; (2) a term loan A2 in an aggregate principal amount of Euro 275 million (the “tranche A2 term loan”) available to Sirona’s subsidiary, Sirona Dental Services GmbH, as borrower; and (3) a $150 million revolving credit facility available to Sirona Dental Systems GmbH, Schick NY and Sirona Dental Services GmbH, as initial borrowers. The revolving credit facility is available for borrowing in Euro, U.S. Dollars, Yen or any other freely available currency agreed to by the facility agent. The facilities are made available on an unsecured basis. Subject to certain limitations, each European guarantor guarantees the performance of each European borrower, except itself, and each U.S. guarantor guarantees the performance of each U.S. borrower, except itself. There are no cross-border guarantees since all guarantees are by entities that have the same functional currency as the currency in which the respective guaranteed borrowing is denominated.
Each of the senior term loans has a five year maturity and is to be repaid in three annual installments beginning on November 24, 2009 and ending on November 24, 2011. Of the amounts borrowed under the term loan facilities, 15% was due on November 24, 2009, 15% was due on November 24, 2010 and 70% is due on November 24, 2011. The senior debt repayment tranche originally scheduled for November 24, 2009 was prepaid on May 11, 2009 in the amount of $78.6 million, and the senior debt repayment tranche originally scheduled for November 24, 2010 was prepaid on March 31, 2010 in the amount of $78.1 million. At the Company’s current Debt Cover Ratio, the facilities bear interest of Euribor, for Euro-denominated loans, and Libor for the other loans, plus a margin of 45 basis points for both.
The Senior Facilities Agreement contains a margin ratchet. Pursuant to this provision, which applies from November 24, 2007 onwards, the applicable margin will vary between 90 basis points and 45 basis points per annum according to the Company’s leverage multiple (i.e. the ratio of consolidated total net debt to consolidated adjusted EBITDA as defined in the Senior Facilities Agreement). Interest rate swaps were established for 66.6% of the interest until March 2010. These swaps
39
Table of Contents
expired on March 31, 2010 and were not renewed. The interest rate swaps fixed the LIBOR or EURIBOR element of interest payable on 66.7% of the principal amount of the loans for defined twelve and thirteen month interest periods over the lifetime of the swaps, respectively. The defined interest rates fixed for each twelve or thirteen month interest period ranged from 3.50% to 5.24%. Settlement of the swaps was required on a quarterly basis.
The Senior Facilities Agreement contains restrictive covenants that limit Sirona’s ability to make loans, make investments (including in joint ventures), incur additional indebtedness, make acquisitions or pay dividends, subject to agreed exceptions. The Company has agreed to certain financial debt covenants in relation to the financing. The covenants stipulate that the Company must maintain certain ratios in respect of interest payments and defined earnings measures. If the Company breaches any of the covenants, the loans will be become repayable on demand.
Debt issuance costs of $5.6 million were incurred in relation to the new financing and were capitalized as deferred charges and are amortized using the effective interest method over the term of the loan.
Contractual Obligations and Commercial Commitments
The following table summarizes contractual obligations and commercial commitments as of September 30, 2010.
| Payments due by period | ||||||||||||||||||||
| Total | Less than 1 year |
1-3 years | 3-5 years | More than 5 years |
||||||||||||||||
| $’000s | ||||||||||||||||||||
| Long-term debt |
$ | 370,736 | $ | 2,935 | $ | 367,801 | $ | — | $ | — | ||||||||||
| Operating lease obligations |
47,392 | 9,522 | 13,282 | 5,061 | 19,527 | |||||||||||||||
| Pension |
26,309 | 2,650 | 4,829 | 4,881 | 13,949 | |||||||||||||||
| Purchase commitments |
57,066 | — | 57,066 | — | — | |||||||||||||||
| Total |
$ | 501,503 | $ | 15,107 | $ | 442,978 | $ | 9,942 | $ | 33,476 | ||||||||||
The amounts disclosed above include interest of $0.3 million on long-term debt accreted at September 30, 2010; future variable interest payments are not included.
Off-Balance Sheet Arrangements
In July 2005, Sirona entered into a sale and leaseback agreement regarding unused land on the Bensheim site of Sirona in Germany. The land was sold for Euro 0.9 million ($1.2 million at the U.S. Dollar/Euro exchange rate of September 30, 2010) to an unrelated property development company, who constructed an office building based on Sirona’s specifications on the site. Sirona leases the building from the property development company through an 20-year lease. Rental payments started in April 2007 when the building was ready for occupancy. Under the terms of the lease, rent is fixed at Euro 1.2 million ($1.6 million at the U.S. Dollar/Euro exchange rate of September 30, 2010) per annum until 2013. After 2013, rent is subject to adjustment according to an inflation index. The land remains an asset on Sirona’s balance sheet and the building has been accounted for as an operating lease.
Sirona does not have other off-balance sheet financing arrangements other than its derivatives.
Critical Accounting Policies
The preparation of financial statements in conformity with U.S. GAAP requires Sirona to make estimates and assumptions that affect amounts reported in its consolidated financial statements and accompanying notes. These estimates and assumptions are evaluated on an ongoing basis based on historical developments, market conditions, industry trends and other information Sirona believes to be reasonable under the circumstances. There can be no assurance that actual results will conform to Sirona’s estimates and assumptions, and that reported results of operations will not be materially adversely affected by the need to make accounting adjustments to reflect changes in its estimates and assumptions from time to time. The following accounting policies are those that Sirona believes to be the most sensitive to its estimates and assumptions.
40
Table of Contents
Revenue Recognition
Revenue, net of related discounts and allowances, is recognized when persuasive evidence of the arrangement exists, the price is fixed or determinable, collectability is reasonably assured and title and risk of loss has passed to customers based on the shipping terms. Returns of products, excluding warranty related returns, are infrequent and insignificant. Revenue related to products that contain software that is more than incidental to the product is recognized in accordance with ASC 985-605, Software – Revenue Recognition. For orders which contain one or more elements to be delivered at a future date, but do not include software that is more than incidental to the other elements, the Company recognizes revenue in accordance with ASC 605-25, Revenue Recognition – Multiple-Element Arrangements. For revenue on certain CEREC units recognized in accordance with both ASC 985-605 and ASC 605-25, the Company allocates revenues between the various elements using the relative fair value method because vendor-specific objective evidence of fair value (“VSOE”) exists for all elements. Under the relative fair value method, as applied by the Company, the revenue is allocated between the elements of the arrangement in proportion to the VSOE of each element. The revenue allocated to the service contract is deferred until the service is provided. For revenue on certain GALILEOS units recognized in accordance with both ASC 985-605 and ASC 605-25, the Company allocates revenues between the various elements using the residual method because VSOE exists for the undelivered service contract but does not exist for the delivered product. Under the residual method, as applied by the Company, the revenue is allocated first to the undelivered elements based on VSOE and the residual contract amount is then allocated to the delivered element. The revenue allocated to the service contract is deferred until the service is provided.
The revenue allocated to the CEREC or GALILEOS product sold, which contains software and hardware the functionality of which is dependent on the software and for which the software is integral (i.e., software-related hardware), is recognized as revenue upon delivery which is when the risk and rewards of ownership are transferred. The VSOE of products and service contracts is based on the price charged when the same element is sold separately to customers or, in the case of GALILEOS service contracts that are sold together with the GALILEOS product, based on the service contract renewal rate.
The Company offers its customers an option to purchase extended warranties on certain products. The Company recognizes revenue on these extended warranty contracts ratably over the life of the contract. The costs associated with these extended warranty contracts are recognized when incurred.
The Company offers discounts to its distributors if certain conditions are met. Discounts and allowances are primarily based on the volume of products purchased or targeted to be purchased by the individual customer or distributor, but may also be involved in trade-in programs. Discounts are deducted from revenue at the time of sale or when the discount is granted, whichever is later. The Company estimates volume discounts based on the individual customer’s historical and estimated future product purchases.
Amounts received from customers in advance of product shipment are classified as deferred income until the revenue can be recognized in accordance with the Company’s revenue recognition policy.
Pensions and 401(k) Plan
The Company has defined benefit and defined contribution pension plans and an early retirement plan.
As of September 30, 2007, the Company adopted the recognition provisions of ASC 715-30, Compensation-Retirement Benefits – Defined Benefit Plans-Pension. Upon adoption, Sirona recognized as an adjustment to accumulated other comprehensive income the funded status of its benefit plans, measured as the difference between the fair value of plan assets and benefit obligations as of September 30, 2007, net of related tax effects. Beginning in fiscal year 2008, Sirona recognizes changes in the funded status of its benefit plans, not yet recognized in the income statement, in other comprehensive income until they are amortized as a component of net periodic benefit cost.
Pension expense is recognized on an accrual basis over the employee’s approximate service periods. Defined benefit pension costs are determined by using an actuarial method, which provides for the deferral of actuarial gains and losses (in excess of a specified corridor) that result from changes in assumptions or actual experience differing from that assumed. Costs relating to changes in the benefit plan as well as the transition obligation are amortized. Disclosure of the components of periodic pension cost is also required. When purchase accounting is applied, pension liabilities are recognized for the projected benefit obligation in excess of plan assets.
41
Table of Contents
The key assumption used in the actuarial calculations for the defined benefit pension plans is the selection of the appropriate discount rate. The discount rate has been selected by reference to market interest rates. The discount rate used reflects the rates available on high quality fixed income investment of appropriate duration at the measurement dates of each year. Fluctuations in market interest rates could impact the amount of pension expense recorded for these plans. The discount rate assumption changed from 5.50% at September 30, 2009 to 4.75% at September 30, 2010, thereby affecting the amount of pension obligation recorded at September 30, 2010.
Plan assets consist of insurance policies with a guaranteed minimum return by the insurance company and an excess profit participation feature for a portion of the benefits. Sirona pays the premiums on the insurance policies but does not manage the investment of the funds; the insurance company makes all decisions on investment of funds, including the allocation to asset groups. The fair value of the plan assets such as equity securities, fixed-income investments, and others is based on the cash surrender values reported by the insurance company.
Contributions made to the defined contribution pension plans and the 401(k) savings plan for U.S. employees are accrued based on the contributions required by the plan.
The Company also has an early retirement plan, Altersteilzeit (“ATZ”), which allows certain German employees who have been accepted into the plan to retire at 60 rather than at the legal retirement age of 67. Eligible employees are those who have attained the age of 55 by calendar year 2009 and have been accepted to participate in the ATZ plan. The ATZ plan can cover a period between the ages of 58 to 63 of the participating employees and is split into an active service period, where the employees work full time for the Company, and an inactive service period, where the employees do not work for the Company. During the active service period, the employees receive 50% of their salary and the remaining 50% of their salary, plus a bonus payment equal to 35% of their salary is paid during the inactive service period. The Company recognizes the salary component of the ATZ plan over the period from the beginning of the ATZ period to the end of the active service period. The Company recognizes the bonus component over the period from the point at which the employee signs the ATZ contract until the end of the active service period.
Income Taxes
Sirona recognizes deferred tax assets and liabilities based on the differences between the financial statement carrying amounts and the tax basis of assets and liabilities. Sirona regularly reviews its deferred tax assets for recoverability and establishes a valuation allowance, as necessary, based on historical taxable income, projected future taxable income, the expected timing of the reversals of existing temporary differences and the implementation of tax-planning strategies. If Sirona is unable to generate sufficient future taxable income in certain tax jurisdictions, or if there is a material change in the actual effective tax rates or time period within which the underlying temporary differences become taxable or deductible, it could be required to increase its valuation allowance against its deferred tax assets resulting in an increase in its effective tax rate and an adverse impact on operating results. As of September 30, 2010, Sirona had recorded valuation allowances against its deferred tax assets in the amount of $2.2 million. Further information on income taxes is provided in Note 10 to the consolidated financial statements appearing elsewhere in this report.
Effective at the beginning of fiscal year 2008, the Company adopted the provisions of ASC 740, Income Taxes. Further information may be found in Note 10, “Income Taxes” in the Notes to Consolidated Financial Statements of this Form 10-K.
Management believes it is more likely than not that forecasted income, including income that may be generated as a result of certain tax planning strategies, together with the tax effects of the deferred tax liabilities, will be sufficient to fully recover the remaining deferred tax assets. In the event that the Company determines all or part of the net deferred tax assets are not realizable in the future, the Company will make an adjustment to the valuation allowance that would be charged to earnings in the period such determination is made. In addition, the calculation of tax liabilities involves significant judgment in estimating the impact of uncertainties in the application of ASC 740 and other complex tax laws. Resolution of these uncertainties in a manner inconsistent with management’s expectations could have a material impact on the Company’s financial condition and operating results.
Impairment of Long-Lived and Finite-Lived Assets
Sirona assesses all its long-lived assets for impairment whenever events or circumstances indicate their carrying value may not be recoverable. Sirona’s management assesses whether there has been an impairment by comparing anticipated undiscounted future cash flows from operating activities with the carrying value of the asset. The factors considered by
42
Table of Contents
Sirona’s management in this assessment include operating results, trends and prospects, as well as the effects of obsolescence, demand, competition and other economic factors. If an impairment is deemed to exist, management records an impairment charge equal to the excess of the carrying value over the fair value of the impaired assets. This could result in a material charge to earnings.
Impairment of Indefinite-Lived Assets
Sirona tests goodwill for impairment annually on September 30 by comparing the fair value of its reporting units to their carrying values. We regard our reporting units to be our operating segments (Dental CAD/CAM Systems, Imaging Systems, Treatment Centers, and Instruments). Goodwill has been allocated to reporting units for impairment testing. Goodwill may be tested for impairment between annual tests if an event occurs or circumstances change that would more likely than not reduce the fair value of a reporting unit below its carrying value. These events or circumstances could include a significant change in the business climate, legal factors, operating performance indicators, competition, sale or disposition of a significant portion of the business or other factors. If the carrying amount of a reporting unit exceeds its fair value, additional steps, including an allocation of the estimated fair value to the assets and liabilities of the reporting unit, would be necessary to determine the amount, if any, of goodwill impairment. In this second step, a fair value exercise similar to a business combination would be performed where the individual identifiable assets and liabilities of the reporting unit are valued at fair value with the difference between the fair value of the reporting unit being the implied fair value of goodwill. The Company uses a discounted future cash flow model to estimate reporting unit fair value. Significant assumptions in our discounted cash flow model include discount rate, revenue and profit margin growth and terminal growth rates. Although we believe our judgments, estimates and assumptions used in determining fair value are reasonable, making material changes to such judgments, estimates and/or assumptions could materially affect such impairment analyses and our financial results.
Sirona evaluates trademarks, which are considered indefinite-lived intangible assets, for impairment at least annually or whenever events or circumstances indicate their carrying value might be impaired. In performing this assessment, Sirona’s management considers operating results, trends and prospects, as well as the effects of obsolescence, demand, competition and other economic factors. The carrying value of trademarks is considered impaired when their carrying value exceeds their fair market value. In such an event, an impairment loss is recognized equal to the amount of that excess. Key assumptions in determining fair value include using the projected cash flows discounted at a rate commensurate with the risk involved.
Recent Accounting Pronouncements Not Yet Adopted
Please see Note 3 to our consolidated financial statements in “Item 8, Financial Statements and Supplementary Data.”
43
Table of Contents
| ITEM 7A. | QUANTITATIVE AND QUALITATIVE DISCLOSURES ABOUT MARKET RISK |
Sirona’s primary market risk exposure is interest rate risk associated with short and long-term bank loans bearing variable interest rates. To manage this interest rate risk exposure, Sirona entered into interest rate swap agreements, all of which expired on March 31, 2010 and were not renewed. Sirona is also exposed to foreign currency risk, which can adversely affect our sales and operating profits. To manage this risk, Sirona enters into forward exchange contracts.
The following discussion should be read in conjunction with Notes 2 and 13 to Sirona’s audited consolidated financial statements appearing elsewhere in this report, which provide further information on Sirona’s derivative instruments.
Interest Rate Sensitivity
To reduce the exposure associated with Sirona’s variable rate debt, Sirona entered into interest rate swap agreements in 2006 that limit the variable rate for a substantial portion of the debt terms (i.e. through March 2010). These interest rate swap agreements expired on March 31, 2010 and were not renewed. See “Management’s Discussion and Analysis of Financial Conditions and Results of Operations - Long-term debt” for further details.
A hypothetical, instantaneous increase of one percentage point in the interest rates applicable to the variable interest rate debt would have increased the interest expense for the fiscal year ended September 30, 2010, by approximately $2.5 million.
As of September 30, 2009, the interest rate swaps had notional amounts of $363.0 million and a negative fair value of $(6.5) million. The variable benchmark interest rates associated with these instruments ranged from 3.5% to 5.24%. A hypothetical, instantaneous increase of one percentage point in the interest rates applicable to the variable interest rate debt would have increased the interest expense for the fiscal year ended September 30, 2009, by approximately $1.5 million.
Exchange Rate Sensitivity
The Euro is the functional currency for the majority of Sirona’s subsidiaries, including its German operations, which are the primary sales and manufacturing operations of Sirona. Sales from other Sirona operations are denominated in various foreign currencies. Sales in Euro, U.S. Dollar and other currencies represented 44.7%, 37.2% and 18.1%, respectively, of total sales for fiscal year 2010. In order to hedge portions of the transactional exposure to fluctuations in exchange rates between the U.S. Dollar and the Euro, based on forecasted and firmly committed cash flows, Sirona enters into forward foreign currency (different from functional currency) contracts. These forward foreign currency contracts are intended to protect Sirona against the short-term effects of changes in the exchange rates. Sirona does not apply hedge accounting to these forward foreign currency contracts.
44
Table of Contents
The table below provides information, as of September 30, 2010, about receivables and derivative financial instruments by functional currency and presents such information in U.S. Dollars, which is Sirona’s reporting currency. The table summarizes information on instruments and transactions that are sensitive to foreign currency exchange rates. The estimated fair value of receivables is considered to approximate their carrying value because receivables have a short maturity. For foreign currency forward exchange agreements, the table presents the notional amounts and weighted average exchange rates by expected (contractual) maturity dates. These notional amounts generally are used to calculate the contractual payments to be exchanged under the contract.
| As of September 30, 2010 |
Expected Maturity Date | |||||||||||||||||||||||||||||||
| Fiscal Year | ||||||||||||||||||||||||||||||||
| Beyond | Fair | |||||||||||||||||||||||||||||||
| 2011 | 2012 | 2013 | 2014 | 2015 | 2016 | Total | Value | |||||||||||||||||||||||||
| $’000s | ||||||||||||||||||||||||||||||||
| Receivables: |
||||||||||||||||||||||||||||||||
| U.S. Dollar |
$ | 23,775 | $ | — | — | — | — | — | $ | 23,775 | $ | 23,775 | ||||||||||||||||||||
| Japanese Yen |
14,687 | — | — | — | — | — | 14,687 | 14,687 | ||||||||||||||||||||||||
| Australian Dollar |
3,198 | — | — | — | — | — | 3,198 | 3,198 | ||||||||||||||||||||||||
| Danish Krone |
1,232 | — | — | — | — | — | 1,232 | 1,232 | ||||||||||||||||||||||||
| Chinese Yuan Renminbi |
1,934 | — | — | — | — | — | 1,934 | 1,934 | ||||||||||||||||||||||||
| UK Sterling |
984 | — | — | — | — | — | 984 | 984 | ||||||||||||||||||||||||
| Swiss Francs |
3 | — | — | — | — | — | 3 | 3 | ||||||||||||||||||||||||
| Korean Won |
34 | — | — | — | — | — | 34 | 34 | ||||||||||||||||||||||||
| $ | 45,847 | $ | — | — | — | — | — | $ | 45,847 | $ | 45,847 | |||||||||||||||||||||
| Forward Exchange Contracts: |
||||||||||||||||||||||||||||||||
| U.S. Dollar notional amount |
$ | 49,332 | — | — | — | — | — | $ | 49,332 | $ | 1,452 | |||||||||||||||||||||
| Average contract exchange rate |
$ | 1.3245 | — | — | — | — | — | — | — | |||||||||||||||||||||||
45
Table of Contents
| ITEM 8. | FINANCIAL STATEMENTS AND SUPPLEMENTARY DATA |
The response to this item is included as a separate section of this Annual Report on Form 10-K, beginning on page F-1.
| ITEM 9. | CHANGES IN AND DISAGREEMENTS WITH ACCOUNTANTS ON ACCOUNTING AND FINANCIAL DISCLOSURE |
None.
| ITEM 9A. | CONTROLS AND PROCEDURES |
Evaluation of Disclosure Controls and Procedures
Our management, with the participation of our chief executive officer (principal executive officer) and chief financial officer (principal financial officer), evaluated the effectiveness of our disclosure controls and procedures (as defined in Rules 13a-15(e) and 15d-15(e) under the Securities Exchange Act of 1934), as of September 30, 2010. Based upon this evaluation, our chief executive officer and chief financial officer concluded that, as of September 30, 2010, the Company’s disclosure controls and procedures are effective. Our disclosure controls and procedures are designed to ensure that information relating to the Company, including our consolidated subsidiaries, that is required to be disclosed in the reports we file or submit under the Securities Exchange Act of 1934 is recorded, processed, summarized and reported within the time periods specified in Commission’s rules and forms, and is accumulated and communicated to our management, including our principal executive officer and our principal financial officer, as appropriate to allow timely decisions regarding required disclosure.
Management’s Annual Report on Internal Control over Financial Reporting
Our management is responsible for establishing and maintaining adequate internal control over the Company’s financial reporting (as defined in Rules 13a-15(f) and 15d-15(f) under the Exchange Act). Because of its inherent limitations, internal control over financial reporting may not prevent or detect misstatements. Projections of any evaluation of effectiveness to future periods are subject to the risk that controls may become inadequate because of changes in conditions, or that the degree of compliance with the policies or procedures may deteriorate.
Our management assessed the effectiveness of the Company’s internal control over financial reporting as of September 30, 2010. In making this assessment, our management used the criteria set forth by the Committee of Sponsoring Organizations of the Treadway Commission (COSO) in Internal Control Integrated Framework. Based on our assessment, management believes that, as of September 30, 2010, our internal control over financial reporting is effective based on those criteria.
The independent registered public accounting firm, which audited the Company’s financial statements included in this Form 10-K, has issued an attestation report on the Company’s internal control over financial reporting. Please see attestation report on page F-3.
Changes in Internal Control over Financial Reporting
No change in our internal control over financial reporting (as defined in rules 13a-15(f) and 15d-15(f) under the Exchange Act) occurred during the quarter ended September 30, 2010, that has materially affected, or is reasonably likely to materially affect, our internal control over financial reporting.
| ITEM 9B. | OTHER INFORMATION |
Supplement Agreement to Service Agreement with Jost Fischer
On November 15, 2010, the Company’s executive compensation committee of the board of directors approved a supplement agreement to the service agreement between the Company, Sirona Dental GmbH, and Jost Fischer, the Company’s Chairman and Chief Executive Officer. The supplement agreement amends the executive service agreement between Sirona Dental GmbH and Mr. Fischer, dated as of October 10, 2007, as amended by the amended and restated service agreement between the Company, Sirona Dental GmbH and Jost Fischer, dated as of December 2, 2008.
The supplement agreement provides that Mr. Fischer may provide services under the service agreement partially to the Company, and that Mr. Fischer’s yearly salary and bonus under the service agreement will be paid by the Company pro rata to the days he has worked for the Company compared to total days to be worked under the service agreement, with the remaining portion of the yearly salary and bonus to be paid by Sirona Dental GmbH. In order to facilitate the payment mechanism, the Company will pay Mr. Fischer a fixed amount on a monthly basis in the amount of 20% of the total salary, with the remaining 80% to be paid by Sirona Dental GmbH. Within 30 days following the end of the calendar year, the Company and Sirona Dental GmbH will each compensate the other for the difference between the portion of salary actually paid and the pro rata portion to be paid for such calendar year.
The supplement agreement further provides that Mr. Fischer will be subject to tax equalization, by which he will remain neutral, subject to certain conditions and limitation, from a tax perspective with respect to (i) compensation received by him from the Company and/or Sirona Dental GmbH, including any U.S. tax on salary, bonuses, share based compensation (including effects in case of exercises), and (ii) the indirect investment of Mr. Fischer in the Company. Mr. Fischer will pay the same amount of income taxes as he would have paid had he performed all of his duties in Austria and did not perform the duties in the United States of America and been subject to a salary split mentioned above.
Supplement Agreement to Service Agreement with Simone Blank
On November 15, 2010, the Company’s executive compensation committee of the board of directors approved a supplement agreement to the service agreement between the Company, Sirona Dental GmbH, and Simone Blank, the Company’s Executive Vice President and Chief Financial Officer. The supplement agreement amends the executive service agreement between Sirona Dental GmbH and Ms. Blank, dated as of October 10, 2007, as amended by the amended and restated service agreement between the Company, Sirona Dental GmbH and Simone Blank, dated as of December 2, 2008.
The supplement agreement provides that Ms. Blank may provide services under the service agreement partially to the Company, and that Ms. Blank’s yearly salary and bonus under the service agreement will be paid by the Company pro rata to the days she has worked for the Company compared to total days to be worked under the service agreement, with the remaining portion of the yearly salary and bonus to be paid by Sirona Dental GmbH. In order to facilitate the payment mechanism, the Company will pay Ms. Blank a fixed amount on a monthly basis in the amount of 20% of the total salary, with the remaining 80% to be paid by Sirona Dental GmbH. Within 30 days following the end of the calendar year, the Company and Sirona Dental GmbH will each compensate the other for the difference between the portion of salary actually paid and the pro rata portion to be paid for such calendar year.
The supplement agreement further provides that Ms. Blank will be subject to tax equalization, by which she will remain neutral, subject to certain conditions and limitation, from a tax perspective with respect to (i) compensation received by her from the Company and/or Sirona Dental GmbH, including any U.S. tax on salary, bonuses, share based compensation (including effects in case of exercises), and (ii) the indirect investment of Ms. Blank in the Company. Ms. Blank will pay the same amount of income taxes as she would have paid had she performed all of her duties in Austria and did not perform the duties in the United States of America and been subject to a salary split mentioned above.
46
Table of Contents
PART III
| ITEM 10. | DIRECTORS, EXECUTIVE OFFICERS AND CORPORATE GOVERNANCE |
The information required by this item not set forth herein is incorporated by reference to the proxy statement for our 2010 Annual Meeting of Stockholders to be filed with the Securities and Exchange Commission on or before January 28, 2011.
| ITEM 11. | EXECUTIVE COMPENSATION |
The information required by this item not set forth herein is incorporated by reference to the proxy statement for our 2010 Annual Meeting of Stockholders to be filed with the Securities and Exchange Commission on or before January 28, 2011.
| ITEM 12. | SECURITY OWNERSHIP OF CERTAIN BENEFICIAL OWNERS AND MANAGEMENT AND RELATED STOCKHOLDER MATTERS |
The information required by this item not set forth herein is incorporated by reference to the proxy statement for our 2010 Annual Meeting of Stockholders to be filed with the Securities and Exchange Commission on or before January 28, 2011.
| ITEM 13. | CERTAIN RELATIONSHIPS AND RELATED TRANSACTIONS, AND DIRECTOR INDEPENDENCE |
The information required by this item not set forth herein is incorporated by reference to the proxy statement for our 2010 Annual Meeting of Stockholders to be filed with the Securities and Exchange Commission on or before January 28, 2011.
| ITEM 14. | PRINCIPAL ACCOUNTANT FEES AND SERVICES |
The information required by this item not set forth herein is incorporated by reference to the proxy statement for our 2010 Annual Meeting of Stockholders to be filed with the Securities and Exchange Commission on or before January 28, 2011.
47
Table of Contents
PART IV
| ITEM 15. | EXHIBITS, FINANCIAL STATEMENT SCHEDULES |
(a) (1) Financial Statements, See Index to Financial Statements on Page F-1
(b) The following Exhibits are included in this report:
| Exhibit No. |
Item Title | |
| 2.1 |
Exchange Agreement, by and among Sirona Holdings Luxco S.C.A, Blitz 05-118 GmbH and Schick Technologies, Inc., dated September 25, 2005 (incorporated by reference to Exhibit 99.1 to Form 8-K, filed on September 26, 2005) | |
| 2.2 |
Amendment No. 1 to Exchange Agreement, dated May 11, 2006 (incorporated by reference to Exhibit 99.1 to Form 8-K, filed on May 16, 2006) | |
| 3.1 |
Amended and Restated Certificate of Incorporation of the Company (incorporated by reference to Exhibit 3.1 to the Company’s Registration Statement on Form S-1, File No. 333-33731, filed on June 30, 1997) | |
| 3.2 |
Certificate of Amendment to Amended and Restated Certificate of Incorporation of the Company (incorporated by reference to Exhibit 3.2 to Form 8-K filed on June 20, 2006) | |
| 3.3 |
Bylaws of the Company effective as of September 20, 2010 (incorporated by reference to Exhibit 3.2 to Form 8-K, filed on September 23, 2010) | |
| 4.1 |
Form of Common Stock certificate of the Company (incorporated by reference to Exhibit 4.4 to the Company’s Registration Statement on Form S-3, File No. 333-153092, filed on August 20, 2008) | |
| 10.1 |
1996 Employee Stock Option Plan, as amended (incorporated by reference to Exhibit 10.1 to the Company’s Annual Report on Form 10-K, filed on July 13, 2001)† | |
| 10.2 |
Amendment to 1996 Employee Stock Option Plan (incorporated by reference to the Company’s definitive proxy statement on Schedule 14A, filed on May 16, 2006)† | |
| 10.3 |
1997 Stock Option Plan for Non-Employee Directors, as amended (incorporated by reference to Exhibit 10.2 to the Company’s Annual Report on Form 10-K, filed on June 18, 2003)† | |
| 10.4 |
Sirona Dental Systems, Inc. Equity Incentive Plan (incorporated by reference to the Company’s definitive proxy statement on Schedule 14A, filed on January 26, 2007)† | |
| 10.5 |
Form of Stock Option Notice under Sirona Dental Systems, Inc. Equity Incentive Plan (incorporated by reference to Form 8-K filed on February 28, 2007)† | |
| 10.6 |
Distributorship Agreement, dated April 6, 2000, by and between Schick Technologies, Inc. and Patterson Dental Company (incorporated by reference to Exhibit 10.34 to the Company’s Annual Report on Form 10-K, filed on June 29, 2000)** | |
| 10.7 |
Amendment No. 1 to Distributorship Agreement, dated July 1, 2005 by and between Schick Technologies, Inc. and Patterson Dental Company (incorporated by reference to Exhibit 10.1 to Form 10-Q/A, filed on March 24, 2006)** | |
| 10.8 |
Consulting and Non-Competition Agreement between Schick Technologies, Inc. and David B. Schick, dated May 7, 2004 (incorporated by reference to Exhibit 10.33 to the Company’s Annual Report on Form 10-K, filed on June 25, 2004) | |
| 10.9 |
Transaction Services Agreement by and between Blitz F04-506 GmbH, Sirona Dental Services GmbH & Co KG, Sirona Dental Systems GmbH, MDP IV Offshore GP, LP and Harry M. Jansen Kraemer, Jr., dated July 6, 2005 (incorporated by reference to Exhibit 10.7 to the Company’s Annual Report on Form 10-K, filed on December 11, 2006) | |
| 10.10 |
Registration Agreement between the Company and Luxco, dated as of June 20, 2006 (incorporated by reference to Form 8-K filed on June 20, 2006) | |
48
Table of Contents
| 10.11 |
Employment Agreement between the Company and Jeffrey T. Slovin, dated as of June 20, 2006 (incorporated by reference to Form 8-K filed on June 14, 2006)† | |
| 10.12 |
Employment Agreement between the Company and Michael Stone, dated as of June 20, 2006 (incorporated by reference to Form 8-K filed on June 14, 2006)† | |
| 10.13 |
Transition and Severance Agreement between the Company and Zvi Raskin, dated as of June 14, 2006 (incorporated by reference to Form 8-K filed on June 20, 2006)† | |
| 10.14 |
Employment Agreement between Sirona Beteiligungs- und Verwaltungsgesellschaft mbH (represented by its shareholder Sirona Dental Systems SARL) and Jost Fischer, dated as of January 25, 2002 (incorporated by reference to Exhibit 10.5 to Form 10-Q, filed on August 9, 2006)† | |
| 10.15 |
Employment Agreement between Sirona Beteiligungs- und Verwaltungsgesellschaft mbH (represented by its shareholder Sirona Dental Systems SARL) and Simone Blank, dated as of June 27, 2001 (incorporated by reference to Exhibit 10.6 to Form 10-Q, filed on August 9, 2006)† | |
| 10.16 |
Consolidated and Restated Amendment to Distributorship Agreement between Sirona Dental Systems GmbH and Patterson Companies, Inc. (incorporated by reference to Exhibit 10.8 to Form 10-Q, filed on August 9, 2006)** | |
| 10.17 |
Senior Facilities Agreement (incorporating amendments made on December 5, 2006 and January 19, 2007) among Sirona Dental Systems, Inc., Schick Technologies, Inc., Sirona Dental Systems GmbH, Sirona Dental Services GmbH, Sirona Dental Systems LLC, Sirona Holding GmbH, Sirona Immobilien GmbH, J.P. Morgan PLC, UBS Limited, JPMorgan Chase Bank, N.A., and J.P. Morgan Europe Limited, dated November 22, 2006 (incorporated by reference to Exhibit 10.1 to Form 10-Q, filed May 10, 2007) | |
| 10.18 |
Description of the Sirona Dental Systems, Inc. EVA Plan† | |
| 10.19 |
Employment Agreement between Schick Technologies, Inc. and Jeffrey T. Slovin, dated June 9, 2004 (superseded by the employment agreement dated June 20, 2006 (the “2006 employment agreement”) incorporated by reference as Exhibit 10.10 to this Form 10-K, except for the bonus information contained in Section IV referenced in the 2006 employment agreement)† | |
| 10.20 |
Company’s 2008 Executive Bonus Plan (incorporated by reference to Exhibit 10.1 to Form 10-Q, filed on May 8, 2008)† | |
| 10.21 |
Company’s 2009 Executive Bonus Plan (incorporated by reference to Exhibit 10.21 to the Company’s Annual Report on Form 10-K, filed on December 4, 2008)† | |
| 10.22 |
Amended and Restated Service Agreement between Sirona Dental GmbH, the Company and Jost Fischer, dated as of December 2, 2008 (superseding an Executive Service Agreement between Sirona Dental GmbH and Jost Fischer, dated as of October 10, 2007, which superseded the Employment Agreement between Sirona Beteiligungs- und Verwaltungsgesellschaft mbH (represented by its shareholder Sirona Dental Systems SARL) and Jost Fischer, dated as of January 25, 2002) (incorporated by reference to Exhibit 10.22 to the Company’s Annual Report on Form 10-K, filed on December 4, 2008)† | |
| 10.23 |
Amended and Restated Service Agreement between Sirona Dental GmbH, the Company and Simone Blank, dated as of December 2, 2008 (superseding an Executive Service Agreement between Sirona Dental GmbH and Simone Blank, dated as of October 1, 2007, which superseded the Employment Agreement between Sirona Beteiligungs- und Verwaltungsgesellschaft mbH (represented by its shareholder Sirona Dental Systems SARL) and Simone Blank, dated as of June 27, 2001) (incorporated by reference to Exhibit 10.23 to the Company’s Annual Report on Form 10-K, filed on December 4, 2008)† | |
| 10.24 |
Amendment to Employment Agreement, dated as of December 2, 2008, between the Company and Jeffrey T. Slovin (amending the Employment Agreement between the Company and Jeffrey T. Slovin, dated as of June 14, 2006 and superseding the Employment Agreement between the Company and Jeffrey T. Slovin dated as of June 9, 2004) (incorporated by reference to Exhibit 10.24 to the Company’s Annual Report on Form 10-K, filed on December 4, 2008)† | |
| 10.25 |
Sirona Dental Systems, Inc. Equity Incentive Plan, as amended (incorporated by reference to Exhibit 10.1 to Form 8-K, filed March 3, 2009)† | |
| 10.26 |
Schick Technologies, Inc. 1996 Stock Option Plan, as amended (incorporated by reference to Exhibit 10.2 to Form 8-K, filed March 3, 2009)† | |
49
Table of Contents
| 10.27 |
Renewal Letter Agreement, dated as of May 4, 2009, between Sirona Dental Services GmbH, a corporation organized under the laws of Germany (“Sirona GmbH”) and Sirona Holdings Luxco S.C.A., a société en commandite par actions organized under the laws of the Grand Duchy of Luxembourg (“Luxco”), to the Advisory Services Agreement dated October 1, 2005 between Sirona GmbH and Luxco, together with the Assignment and Assumption Agreement dated May 4, 2009 among Sirona GmbH, Sirona Dental Systems, Inc. and Luxco (incorporated by reference to Exhibit 10.1 to Form 10-Q, filed May 5, 2009) | |
| 10.28 |
Form of Restricted Stock Unit Agreement for December 8, 2009 restricted stock unit grants (incorporated by reference to Exhibit 10.1 to Form 8-K, filed December 11, 2009)† | |
| 10.29 |
Amendment to Distributorship Agreement, dated May 5, 2010, by and between Schick Technologies, Inc. and Patterson Companies, Inc. (incorporated by reference to Exhibit 10.1 to Form 10-Q, filed May 5, 2010)** | |
| 10.30 |
Amendment No. 2 to Amended and Restated Employment Agreement, dated as of September 20, 2010, between the Company and Jeffrey T. Slovin (amending the Employment Agreement between the Company and Jeffrey T. Slovin, dated as of June 14, 2006) (incorporated by reference to Exhibit 10.1 to Form 8-K, filed September 23, 2010)† | |
| 10.31 |
Employment Agreement, dated as of September 13, 2007, as amended on October 15, 2008, by and between Sirona Dental GmbH and Walter Petersohn (incorporated by reference to Exhibit 10.1 to Form 8-K, filed September 23, 2010)† | |
| 10.32 |
Supplement Agreement to Service Agreement between Sirona Dental GmbH, the Company and Jost Fischer, dated as of November 15, 2010, as amended by the Amended and Restated Service Agreement between Sirona Dental GmbH, the Company and Jost Fischer, dated as of December 2, 2008.†* | |
| 10.33 |
Supplement Agreement to Service Agreement between Sirona Dental GmbH, the Company and Simone Blank, dated as of November 15, 2010, as amended by the Amended and Restated Service Agreement between Sirona Dental GmbH, the Company and Simone Blank, dated as of December 2, 2008.†* | |
| 14.1 |
Code of Ethics (incorporated by reference to Exhibit 14.1 to the Company’s Annual Report on Form 10-K, filed on June 25, 2004) | |
| 16.1 |
Letter from Grant Thornton LLP to the Securities and Exchange Commission confirming statements made about it by Company in connection with changes to the Company’s certifying accountant (incorporated by reference to Exhibit 16.1 to Form 8-K, filed June 26, 2006) | |
| 21.1 |
List of Subsidiaries of Company* | |
| 23.1 |
Consent of Independent Registered Public Accounting Firm* | |
| 31.1 |
Certification of Principal Executive Officer pursuant to Section 302 of the Sarbanes-Oxley Act of 2002* | |
| 31.2 |
Certification of Principal Financial Officer pursuant to Section 302 of the Sarbanes-Oxley Act of 2002* | |
| 32.1 |
Section 1350 Certification of Chief Executive Officer* | |
| 32.2 |
Section 1350 Certification of Chief Financial Officer* | |
| † | Compensatory plan or arrangement |
| * | Filed herewith |
| ** | Certain information in this exhibit has been omitted and filed separately with the Securities and Exchange Commission pursuant to a confidential treatment request under Rule 24b-2 promulgated under the Securities Exchange Act of 1934, as amended. |
Pursuant to the requirements of Section 13 or 15(d) of the Securities Exchange Act of 1934, the registrant has duly caused this report to be signed on its behalf by the undersigned, thereunto duly authorized.
November 18, 2010
| SIRONA DENTAL SYSTEMS, INC. | ||
| By: | /s/ JOST FISCHER | |
| Chairman and Chief Executive Officer | ||
| Jost Fischer | ||
50
Table of Contents
Pursuant to the requirements of the Securities Exchange Act of 1934, this report has been signed below by the following persons on behalf of the registrant and in the capacities and on the dates indicated.
| SIGNATURE |
TITLE |
DATE | ||
| /s/ JOST FISCHER Jost Fischer |
Chairman of the Board and Director and Chief Executive Officer (Principal Executive Officer) |
November 18, 2010 | ||
| /s/ SIMONE BLANK Simone Blank |
Executive Vice President, Chief Financial Officer and Director (Principal Financial and Accounting Officer) |
November 18, 2010 | ||
| /s/ NICHOLAS W. ALEXOS Nicholas W. Alexos |
Director | November 18, 2010 | ||
| /s/ DAVID BEECKEN David Beecken |
Director | November 18, 2010 | ||
| /s/ WILLIAM K. HOOD William K. Hood |
Director | November 18, 2010 | ||
| /s/ ARTHUR D. KOWALOFF Arthur D. Kowaloff |
Director | November 18, 2010 | ||
| /s/ THOMAS JETTER Thomas Jetter |
Director | November 18, 2010 | ||
|
/s/ HARRY M. JANSEN KRAEMER, JR. Harry M. Jansen Kraemer, Jr. |
Director | November 18, 2010 | ||
| /s/ TIMOTHY D. SHEEHAN Timothy D. Sheehan |
Director | November 18, 2010 | ||
| /s/ JEFFREY T. SLOVIN Jeffrey T. Slovin |
President and Director | November 18, 2010 | ||
| /s/ TIMOTHY P. SULLIVAN Timothy P. Sullivan |
Director | November 18, 2010 | ||
51
Table of Contents
INDEX TO CONSOLIDATED FINANCIAL STATEMENTS OF
SIRONA DENTAL SYSTEMS, INC. AND SUBSIDIARIES
F-1
Table of Contents
REPORT OF INDEPENDENT REGISTERED PUBLIC ACCOUNTING FIRM
The Board of Directors
Sirona Dental Systems, Inc.:
We have audited the accompanying consolidated balance sheets of Sirona Dental Systems, Inc. and subsidiaries as of September 30, 2010 and 2009, and the related consolidated statements of income, shareholders’ equity and comprehensive income, and cash flows for each of the years in the three-year period ended September 30, 2010. These consolidated financial statements are the responsibility of the Company’s management. Our responsibility is to express an opinion on these consolidated financial statements based on our audits.
We conducted our audits in accordance with the standards of the Public Company Accounting Oversight Board (United States). Those standards require that we plan and perform the audit to obtain reasonable assurance about whether the financial statements are free of material misstatement. An audit includes examining, on a test basis, evidence supporting the amounts and disclosures in the financial statements. An audit also includes assessing the accounting principles used and significant estimates made by management, as well as evaluating the overall financial statement presentation. We believe that our audits provide a reasonable basis for our opinion.
In our opinion, the consolidated financial statements referred to above present fairly, in all material respects, the financial position of Sirona Dental Systems, Inc. and subsidiaries as of September 30, 2010 and 2009, and the results of their operations and their cash flows for each of the years in the three-year period ended September 30, 2010 in conformity with generally accepted accounting principles.
We also have audited, in accordance with the standards of the Public Company Accounting Oversight Board (United States), Sirona Dental Systems, Inc.’s internal control over financial reporting as of September 30, 2010, based on criteria established in Internal Control—Integrated Framework issued by the Committee of Sponsoring Organizations of the Treadway Commission (COSO), and our report dated November 18, 2010 expressed an unqualified opinion on the effectiveness of Sirona Dental Systems, Inc.’s internal control over financial reporting.
KPMG AG Wirtschaftsprüfungsgesellschaft
Frankfurt, Germany
November 18, 2010
F-2
Table of Contents
REPORT OF INDEPENDENT REGISTERED PUBLIC ACCOUNTING FIRM
The Board of Directors
Sirona Dental Systems, Inc.:
We have audited Sirona Dental Systems, Inc.’s internal control over financial reporting as of September 30, 2010, based on criteria established in Internal Control—Integrated Framework issued by the Committee of Sponsoring Organizations of the Treadway Commission (COSO). Sirona Dental Systems, Inc.’s management is responsible for maintaining effective internal control over financial reporting and for its assessment of the effectiveness of internal control over financial reporting, included in the accompanying Management’s Report on Internal Control over Financial Reporting under Item 9A. Our responsibility is to express an opinion on the Company’s internal control over financial reporting based on our audit.
We conducted our audit in accordance with the standards of the Public Company Accounting Oversight Board (United States). Those standards require that we plan and perform the audit to obtain reasonable assurance about whether effective internal control over financial reporting was maintained in all material respects. Our audit included obtaining an understanding of internal control over financial reporting, assessing the risk that a material weakness exists, and testing and evaluating the design and operating effectiveness of internal control based on the assessed risk. Our audit also included performing such other procedures as we considered necessary in the circumstances. We believe that our audit provides a reasonable basis for our opinion.
A company’s internal control over financial reporting is a process designed to provide reasonable assurance regarding the reliability of financial reporting and the preparation of financial statements for external purposes in accordance with generally accepted accounting principles. A company’s internal control over financial reporting includes those policies and procedures that (1) pertain to the maintenance of records that, in reasonable detail, accurately and fairly reflect the transactions and dispositions of the assets of the company; (2) provide reasonable assurance that transactions are recorded as necessary to permit preparation of financial statements in accordance with generally accepted accounting principles, and that receipts and expenditures of the company are being made only in accordance with authorizations of management and directors of the company; and (3) provide reasonable assurance regarding prevention or timely detection of unauthorized acquisition, use, or disposition of the company’s assets that could have a material effect on the financial statements.
Because of its inherent limitations, internal control over financial reporting may not prevent or detect misstatements. Also, projections of any evaluation of effectiveness to future periods are subject to the risk that controls may become inadequate because of changes in conditions, or that the degree of compliance with the policies or procedures may deteriorate.
In our opinion, Sirona Dental Systems, Inc. maintained, in all material respects, effective internal control over financial reporting as of September 30, 2010, based on criteria established in Internal Control—Integrated Framework issued by COSO.
We also have audited, in accordance with the standards of the Public Company Accounting Oversight Board (United States), the consolidated balance sheets of Sirona Dental Systems, Inc. and subsidiaries as of September 30, 2010 and 2009, and the related consolidated statements of income, shareholders’ equity and comprehensive income, and cash flows for each of the years in the three-year period ended September 30, 2010, and our report dated November 18, 2010 expressed an unqualified opinion on those financial statements.
KPMG AG Wirtschaftsprüfungsgesellschaft
Frankfurt, Germany
November 18, 2010
F-3
Table of Contents
SIRONA DENTAL SYSTEMS, INC. AND SUBSIDIARIES
CONSOLIDATED BALANCE SHEETS
| Financial Statement Notes |
September 30, 2010 |
September 30, 2009 |
||||||||||
| $’000s (except per share amounts) | ||||||||||||
| ASSETS |
||||||||||||
| Current assets |
||||||||||||
| Cash and cash equivalents |
$ | 251,767 | $ | 181,098 | ||||||||
| Restricted cash |
703 | 902 | ||||||||||
| Accounts receivable, net of allowance for doubtful accounts of $1,681 and $2,088, respectively |
6 | 82,952 | 98,277 | |||||||||
| Inventories, net |
7 | 74,027 | 74,525 | |||||||||
| Deferred tax assets |
10 | 20,570 | 16,483 | |||||||||
| Prepaid expenses and other current assets |
24,139 | 20,239 | ||||||||||
| Income tax receivable |
10 | 3,533 | 3,956 | |||||||||
| Total current assets |
457,691 | 395,480 | ||||||||||
| Property, plant and equipment, net of accumulated depreciation and amortization of $90,713 and $70,061, respectively |
8 | 102,686 | 102,775 | |||||||||
| Goodwill |
9 | 656,465 | 696,355 | |||||||||
| Investments |
2,317 | 1,739 | ||||||||||
| Intangible assets, net of accumulated amortization of $371,303 and $327,183, respectively |
9 | 362,722 | 447,946 | |||||||||
| Other non-current assets |
2,229 | 2,837 | ||||||||||
| Deferred tax assets |
10 | 8,827 | 943 | |||||||||
| Total assets |
$ | 1,592,937 | $ | 1,648,075 | ||||||||
| LIABILITIES AND SHAREHOLDERS’ EQUITY |
||||||||||||
| Current liabilities |
||||||||||||
| Trade accounts payable |
$ | 42,737 | $ | 38,463 | ||||||||
| Short-term debt and current portion of long-term debt |
12 | 2,935 | 4,688 | |||||||||
| Income taxes payable |
10 | 7,748 | 5,191 | |||||||||
| Deferred tax liabilities |
10 | 1,456 | 466 | |||||||||
| Accrued liabilities and deferred income |
11 | 105,209 | 95,602 | |||||||||
| Total current liabilities |
160,085 | 144,410 | ||||||||||
| Long-term debt |
13 | 367,801 | 470,224 | |||||||||
| Deferred tax liabilities |
10 | 138,190 | 159,659 | |||||||||
| Other non-current liabilities |
6,556 | 8,699 | ||||||||||
| Pension related provisions |
19 | 52,672 | 50,328 | |||||||||
| Deferred income |
14 | 60,000 | 70,000 | |||||||||
| Total liabilities |
785,304 | 903,320 | ||||||||||
| Shareholders’ equity |
||||||||||||
| Preferred stock ($0.01 par value; 5,000,000 shares authorized; |
||||||||||||
| (none issued and outstanding) |
— | — | ||||||||||
| Common stock ($0.01 par value; 95,000,000 shares authorized; 55,333,304 shares issued and 55,305,581 shares outstanding at Sept. 30, 2010, and 54,972,754 shares issued and 54,945,031 shares outstanding at Sept. 30, 2009) |
553 | 550 | ||||||||||
| Additional paid-in capital |
652,698 | 637,264 | ||||||||||
| Treasury stock (27,723 shares at cost) |
(284 | ) | (284 | ) | ||||||||
| Excess of purchase price over predecessor basis |
(49,103 | ) | (49,103 | ) | ||||||||
| Retained earnings |
181,846 | 91,857 | ||||||||||
| Accumulated other comprehensive income |
5 | 19,701 | 63,154 | |||||||||
| Total Sirona Dental Systems, Inc. shareholders’ equity |
805,411 | 743,438 | ||||||||||
| Noncontrolling interests |
2,222 | 1,317 | ||||||||||
| Total shareholders’ equity |
807,633 | 744,755 | ||||||||||
| Total liabilities and shareholders’ equity |
$ | 1,592,937 | $ | 1,648,075 | ||||||||
The accompanying notes are an integral part of these financial statements.
F-4
Table of Contents
SIRONA DENTAL SYSTEMS, INC. AND SUBSIDIARIES
CONSOLIDATED STATEMENTS OF INCOME
| Financial Statement Notes |
Year ended September 30, 2010 |
Year ended September 30, 2009 |
Year ended September 30, 2008 |
|||||||||||||
| $’000 (except per share amounts) | ||||||||||||||||
| Revenue |
$ | 770,276 | $ | 713,294 | $ | 757,111 | ||||||||||
| Cost of sales |
371,266 | 367,152 | 411,489 | |||||||||||||
| Gross profit |
399,010 | 346,142 | 345,622 | |||||||||||||
| Selling, general and administrative expense |
235,932 | 225,351 | 242,293 | |||||||||||||
| Research and development |
46,365 | 40,631 | 48,744 | |||||||||||||
| Provision for doubtful accounts and notes receivable |
271 | 763 | 824 | |||||||||||||
| Net other operating (income) and restructuring costs |
20 | (11,661 | ) | (5,689 | ) | (10,000 | ) | |||||||||
| Operating income |
128,103 | 85,086 | 63,761 | |||||||||||||
| Foreign currency transactions loss/(gain), net |
7,160 | (1,248 | ) | (8,935 | ) | |||||||||||
| (Gain)/loss on derivative instruments |
(6,102 | ) | 151 | 6,660 | ||||||||||||
| Interest expense, net |
18 | 11,043 | 22,497 | 26,795 | ||||||||||||
| Other expense |
776 | 405 | 305 | |||||||||||||
| Income before taxes |
115,226 | 63,281 | 38,936 | |||||||||||||
| Income tax provision |
23,780 | 9,297 | 9,337 | |||||||||||||
| Net income |
91,446 | 53,984 | 29,599 | |||||||||||||
| Less: Net income attributable to noncontrolling interests |
1,457 | 629 | 160 | |||||||||||||
| Net income attributable to Sirona Dental Systems, Inc. |
$ | 89,989 | $ | 53,355 | $ | 29,439 | ||||||||||
| Income per share (attributable to Sirona Dental Systems, Inc. shareholders): |
||||||||||||||||
| - Basic |
15 | $ | 1.63 | $ | 0.97 | $ | 0.54 | |||||||||
| - Diluted |
15 | $ | 1.59 | $ | 0.96 | $ | 0.53 | |||||||||
| Weighted average shares - basic |
55,146,180 | 54,879,417 | 54,797,493 | |||||||||||||
| Weighted average shares - diluted |
56,616,086 | 55,397,614 | 55,287,095 | |||||||||||||
The accompanying notes are an integral part of these financial statements.
F-5
Table of Contents
SIRONA DENTAL SYSTEMS, INC. AND SUBSIDIARIES
CONSOLIDATED STATEMENTS OF SHAREHOLDERS’ EQUITY
AND COMPREHENSIVE INCOME
| Sirona Dental Systems, Inc. Shareholders | ||||||||||||||||||||||||||||||||||||||||
| Common share capital |
Number of common shares issued and outstanding |
Additional paid-in capital |
Treasury Stock |
Excess of purchase price over predecessor basis |
Retained earnings |
Accumulated other comprehensive income |
Total Sirona Dental Systems, Inc. Shareholders |
Noncontrolling Interests |
Total | |||||||||||||||||||||||||||||||
| $’000s (except for amount of common shares issued) | ||||||||||||||||||||||||||||||||||||||||
| Balances as of September 30, 2007 |
$ | 548 | 54,765,285 | $ | 603,570 | $ | — | $ | (49,103 | ) | $ | 9,063 | $ | 44,988 | $ | 609,066 | $ | 484 | $ | 609,550 | ||||||||||||||||||||
| Issuance of common stock upon exercise of options |
1 | 100,710 | 1,024 | — | — | — | 1,025 | 1,025 | ||||||||||||||||||||||||||||||||
| Stock compensation |
— | 15,556 | — | — | — | 15,556 | 15,556 | |||||||||||||||||||||||||||||||||
| Tax benefit of stock options exercised |
— | 582 | — | — | — | 582 | 582 | |||||||||||||||||||||||||||||||||
| Comprehensive income: |
||||||||||||||||||||||||||||||||||||||||
| Net income |
— | — | — | 29,439 | — | 29,439 | 160 | 29,599 | ||||||||||||||||||||||||||||||||
| Cumulative translation adjustment |
— | — | — | — | 1,889 | 1,889 | (18 | ) | 1,871 | |||||||||||||||||||||||||||||||
| Unrecognized elements of pension cost, net of tax |
— | — | — | — | 2,786 | 2,786 | 2,786 | |||||||||||||||||||||||||||||||||
| Total comprehensive income |
— | — | — | — | 29,439 | 4,675 | 34,114 | 142 | 34,256 | |||||||||||||||||||||||||||||||
| Balances as of September 30, 2008 |
$ | 549 | 54,865,995 | $ | 620,732 | $ | — | $ | (49,103 | ) | $ | 38,502 | $ | 49,663 | $ | 660,343 | $ | 626 | $ | 660,969 | ||||||||||||||||||||
| Issuance of common stock upon exercise of options |
1 | 106,759 | 531 | — | — | — | 532 | 532 | ||||||||||||||||||||||||||||||||
| Purchase of treasury stock (at cost) |
(27,723 | ) | (284 | ) | (284 | ) | ||||||||||||||||||||||||||||||||||
| Stock compensation |
— | 15,726 | — | — | — | 15,726 | 15,726 | |||||||||||||||||||||||||||||||||
| Tax benefit of stock options exercised |
— | 275 | — | — | — | 275 | 275 | |||||||||||||||||||||||||||||||||
| Comprehensive income: |
||||||||||||||||||||||||||||||||||||||||
| Net income |
— | — | — | 53,355 | — | 53,355 | 629 | 53,984 | ||||||||||||||||||||||||||||||||
| Cumulative translation adjustment |
— | — | — | — | 14,252 | 14,252 | 62 | 14,314 | ||||||||||||||||||||||||||||||||
| Unrecognized elements of pension cost, net of tax |
— | — | — | — | (761 | ) | (761 | ) | (761 | ) | ||||||||||||||||||||||||||||||
| Total comprehensive income |
— | — | — | — | 53,355 | 13,491 | 66,846 | 691 | 67,537 | |||||||||||||||||||||||||||||||
| Balances as of September 30, 2009 |
$ | 550 | 54,945,031 | $ | 637,264 | $ | (284 | ) | (49,103 | ) | $ | 91,857 | $ | 63,154 | $ | 743,438 | $ | 1,317 | $ | 744,755 | ||||||||||||||||||||
| Issuance of common stock upon exercise of options |
3 | 360,550 | 4,097 | — | — | — | 4,100 | 4,100 | ||||||||||||||||||||||||||||||||
| Stock compensation |
— | 13,616 | — | — | — | 13,616 | 13,616 | |||||||||||||||||||||||||||||||||
| Tax benefit of stock options exercised |
— | (1,382 | ) | — | — | — | (1,382 | ) | (1,382 | ) | ||||||||||||||||||||||||||||||
| Purchase of shares from noncontrolling interest |
(897 | ) | (622 | ) | (1,519 | ) | ||||||||||||||||||||||||||||||||||
| Comprehensive income: |
||||||||||||||||||||||||||||||||||||||||
| Net income |
— | — | — | 89,989 | — | 89,989 | 1,457 | 91,446 | ||||||||||||||||||||||||||||||||
| Cumulative translation adjustment |
— | — | — | (39,313 | ) | (39,313 | ) | 70 | (39,243 | ) | ||||||||||||||||||||||||||||||
| Unrecognized elements of pension cost, net of tax |
— | — | — | — | (4,140 | ) | (4,140 | ) | (4,140 | ) | ||||||||||||||||||||||||||||||
| Total comprehensive income |
— | — | — | — | 89,989 | (43,453 | ) | 46,536 | 1,527 | 48,063 | ||||||||||||||||||||||||||||||
| Balances as of September 30, 2010 |
$ | 553 | 55,305,581 | $ | 652,698 | $ | (284 | ) | (49,103 | ) | $ | 181,846 | $ | 19,701 | $ | 805,411 | $ | 2,222 | $ | 807,633 | ||||||||||||||||||||
F-6
Table of Contents
SIRONA DENTAL SYSTEMS, INC. AND SUBSIDIARIES
CONSOLIDATED STATEMENTS OF CASH FLOWS
| Year ended September 30, 2010 |
Year ended September 30, 2009 |
Year ended September 30, 2008 |
||||||||||
| $’000s | ||||||||||||
| Cash flows from operating activities |
||||||||||||
| Net income |
$ | 91,446 | $ | 53,984 | $ | 29,599 | ||||||
| Adjustments to reconcile net income to net cash provided by operating activities |
||||||||||||
| Depreciation and amortization |
82,724 | 91,596 | 109,393 | |||||||||
| Loss on disposal of property, plant and equipment |
1 | 193 | 57 | |||||||||
| (Gain)/loss on derivative instruments |
(6,102 | ) | 151 | 6,660 | ||||||||
| Loss/(gain) on foreign currency transactions |
7,160 | (1,248 | ) | (8,935 | ) | |||||||
| Deferred income taxes |
(21,463 | ) | (21,862 | ) | (23,561 | ) | ||||||
| Amortization of debt issuance cost |
1,016 | 1,188 | 1,270 | |||||||||
| Share-based compensation expense |
13,616 | 15,726 | 15,556 | |||||||||
| Changes in assets and liabilities |
||||||||||||
| Accounts receivable |
8,800 | (18,776 | ) | 7,906 | ||||||||
| Inventories |
(2,541 | ) | 4,247 | (2,091 | ) | |||||||
| Prepaid expenses and other current assets |
5,532 | 2,211 | (2,216 | ) | ||||||||
| Restricted cash |
134 | 51 | (16 | ) | ||||||||
| Other non-current assets |
(9,097 | ) | (79 | ) | (361 | ) | ||||||
| Trade accounts payable |
6,076 | (7,896 | ) | (7,290 | ) | |||||||
| Accrued interest on long-term debt |
(158 | ) | (4,441 | ) | (4,314 | ) | ||||||
| Accrued liabilities and deferred income |
2,816 | (2,576 | ) | (12,940 | ) | |||||||
| Other non-current liabilities |
(7,840 | ) | (1,247 | ) | (4,658 | ) | ||||||
| Income taxes receivable |
265 | 8,192 | (8,320 | ) | ||||||||
| Income taxes payable |
3,284 | 485 | (1,054 | ) | ||||||||
| Net cash provided by operating activities |
175,669 | 119,899 | 94,685 | |||||||||
| Cash flows from investing activities |
||||||||||||
| Investment in property, plant and equipment |
(23,963 | ) | (20,974 | ) | (36,074 | ) | ||||||
| Proceeds from sale of property, plant and equipment |
255 | 350 | 154 | |||||||||
| Purchase of intangible assets |
(851 | ) | (168 | ) | (544 | ) | ||||||
| Purchase of long-term investments |
(575 | ) | (155 | ) | (330 | ) | ||||||
| Sale of businesses, net of cash sold |
1,928 | 4,985 | — | |||||||||
| Net cash used in investing activities |
(23,206 | ) | (15,962 | ) | (36,794 | ) | ||||||
The accompanying notes are an integral part of these financial statements.
F-7
Table of Contents
SIRONA DENTAL SYSTEMS, INC. AND SUBSIDIARIES
CONSOLIDATED STATEMENTS OF CASH FLOWS
| Year ended September 30, 2010 |
Year ended September 30, 2009 |
Year ended September 30, 2008 |
||||||||||
| $’000s | ||||||||||||
| Cash flows from financing activities |
||||||||||||
| Repayments of short-term and long-term debt |
(78,072 | ) | (78,928 | ) | (10,121 | ) | ||||||
| Purchase of treasury stock |
— | (284 | ) | — | ||||||||
| Purchase of shares from noncontrolling interest |
(1,519 | ) | — | — | ||||||||
| Common shares issued under share based compensation plans |
4,097 | 531 | 1,024 | |||||||||
| Tax effect of common shares exercised under share based compensation plans |
1,562 | 263 | 559 | |||||||||
| Net cash used in financing activities |
(73,932 | ) | (78,418 | ) | (8,538 | ) | ||||||
| Change in cash and cash equivalents |
78,531 | 25,519 | 49,353 | |||||||||
| Effect of exchange rate change on cash and cash equivalents |
(7,862 | ) | 5,916 | 468 | ||||||||
| Cash and cash equivalents at beginning of period |
181,098 | 149,663 | 99,842 | |||||||||
| Cash and cash equivalents at end of period |
$ | 251,767 | $ | 181,098 | $ | 149,663 | ||||||
| Supplemental information |
||||||||||||
| Interest paid |
$ | 9,535 | $ | 24,618 | $ | 30,192 | ||||||
| Interest capitalized |
506 | 280 | 653 | |||||||||
| Income taxes paid |
43,052 | 20,585 | 43,051 | |||||||||
| Sale of businesses, net of cash sold |
||||||||||||
| Current assets |
$ | 2,406 | $ | 5,899 | $ | — | ||||||
| Non-current assets |
550 | 291 | — | |||||||||
| Current liabilities |
(867 | ) | (1,205 | ) | — | |||||||
| Non-current liabilities |
(161 | ) | — | — | ||||||||
| $ | 1,928 | $ | 4,985 | $ | — | |||||||
The accompanying notes are an integral part of these financial statements.
F-8
Table of Contents
SIRONA DENTAL SYSTEMS, INC. AND SUBSIDIARIES
NOTES TO THE CONSOLIDATED FINANCIAL STATEMENTS
1. The Company and its operations
Sirona Dental Systems, Inc. (“Sirona,” “Company,” “we,” “us,” or “our”) and its subsidiaries manufacture high quality, technologically advanced dental technology and systems solutions for the global dental market. We offer a broad range of products across all major segments of the dental technology market including CEREC, CAD/CAM systems, digital and film based intra oral and panoramic imaging systems, treatment centers and instruments. The Company acquired Schick Technologies, Inc. (“Schick”) in 2006, in a transaction accounted for as a reverse acquisition, further expanding our global presence and product offerings and strengthened our research and development capabilities. Sirona has served equipment dealers and dentists worldwide for more than 130 years. The Company’s headquarters are located in Long Island City, New York with the primary facility located in Bensheim, Germany, as well as other support, manufacturing, assembling, and sales and service facilities located elsewhere throughout the world.
2. Basis of presentation and summary of significant accounting policies
The accompanying financial statements have been prepared in accordance with accounting principles generally accepted in the United States (“U.S. GAAP”). All amounts are reported in thousands of U.S. Dollars ($), except per share amounts or as otherwise disclosed.
Fiscal year
The Company’s fiscal year is October 1 to September 30.
Principles of consolidation
The consolidated financial statements include, after eliminating inter-company transactions and balances, the accounts of Sirona Dental Systems, Inc. and its subsidiaries. The Company applies the equity method of accounting for investments in associated companies over which the Company has significant influence but does not have effective control.
In the year ended September 30, 2010, the Company adopted the new accounting guidance for reporting a noncontrolling interest (“NCI”) in a subsidiary according to FASB Codification ASC 810, Consolidation. This new guidance defines a noncontrolling interest, establishes a single method of accounting for changes in a parent’s ownership interest not resulting in deconsolidation, accounting for deconsolidation, and expands the disclosures of NCI’s in consolidated financial statements. As a result, the Company reported NCI as a separate component of Stockholders’ Equity in the Consolidated Balance Sheet. Additionally, the Company reported the portion of net income attributed to the Company and NCI separately in the Consolidated Income Statements. The portion of comprehensive income attributed to the Company and NCI are reported separately in the Statement of Changes in Shareholders’ Equity. All related disclosures have been adjusted accordingly. Prior year amounts associated with NCI in the financial statements and accompanying footnotes have been adjusted retrospectively to conform to the adoption.
Use of estimates
The preparation of the consolidated financial statements in conformity with U.S. GAAP requires management to make estimates and assumptions that affect the reported amounts of assets and liabilities, the disclosure of contingent assets and liabilities at the date of the consolidated financial statements and the reported amount of revenues and expenses during the reporting periods. Actual results could differ from estimates. Some of the more significant estimates include allowances for doubtful accounts, inventory valuation reserves, purchase accounting assumptions, depreciable lives of assets, amortization periods, impairment of long-lived assets, deferred tax asset valuation allowance, discounts to customers, pension reserves, provisions and warranty reserves.
F-9
Table of Contents
SIRONA DENTAL SYSTEMS, INC. AND SUBSIDIARIES
NOTES TO THE CONSOLIDATED FINANCIAL STATEMENTS—(Continued)
Foreign currency
The functional currency for foreign operations has been determined in all cases to be the local currency. Assets and liabilities of foreign subsidiaries are translated at exchange rates on the balance sheet date; revenue and expenses are translated at the weighted average exchange rates for the interim periods within the full period. Operating cash flows are translated based on the weighted average exchange rates for the full period based on the net income line. Investing and financing cash flows are translated based on the exchange rate applicable to the respective transaction. The effects of these translation adjustments are recognized in shareholders’ equity, as a component of accumulated other comprehensive income. Exchange gains and losses arising from transactions denominated in a currency other than the functional currency of the entity involved, as well as the fair value adjustment of forward foreign exchange contracts, are shown separately on the face of the consolidated statements of income.
Comprehensive income
In addition to net income, comprehensive income includes other charges or credits to equity other than those resulting from transactions with shareholders. Accumulated other comprehensive income relates to foreign currency translation adjustments related to the Company’s foreign subsidiaries as well as to the pension adjustment resulting from the application of ASC 715-30, Compensation-Retirement Benefits – Defined Benefit Plans-Pension. Components of comprehensive income are included within the Consolidated Statements of Shareholders’ Equity and Comprehensive Income.
Revenue recognition
Revenue, net of related discounts and allowances, is recognized when persuasive evidence of the arrangement exists, the price is fixed or determinable, collectability is reasonably assured and title and risk of loss has passed to customers based on the shipping terms. Returns of products, excluding warranty related returns, are infrequent and insignificant. Revenue related to products that contain software that is more than incidental to the product is recognized in accordance with the provisions of ASC 985-605, Software – Revenue Recognition. For orders which contain one or more elements to be delivered at a future date, but do not include software that is more than incidental to the other elements, the Company recognizes revenue in accordance with ASC 605-25, Revenue Recognition – Multiple-Element Arrangements. For revenue on certain CEREC units recognized in accordance with both ASC 985-605 and ASC 605-25, the Company allocates revenues between the various elements using the relative fair value method because vendor-specific objective evidence of fair value (“VSOE”) exists for all elements. Under the relative fair value method, as applied by the Company, the revenue is allocated between the elements of the arrangement in proportion to the VSOE of each element. The revenue allocated to the service contract is deferred until the service is provided. For revenue on certain GALILEOS units recognized in accordance with both ASC 985-605 and ASC 605-25, the Company allocates revenues between the various elements using the residual method because VSOE exists for the undelivered service contract but does not exist for the delivered product. Under the residual method, as applied by the Company, the revenue is allocated first to the undelivered elements based on VSOE and the residual contract amount is then allocated to the delivered element. The revenue allocated to the service contract is deferred until the service is provided.
The revenue allocated to the CEREC or GALILEOS product sold, which contains software and hardware the functionality of which is dependent on the software and for which the software is integral (i.e., software-related hardware), is recognized as revenue upon delivery which is when the risk and rewards of ownership are transferred. The VSOE of products and service contracts is based on the price charged when the same element is sold separately to customers or, in the case of GALILEOS service contracts that are sold together with the GALILEOS product, based on the service contract renewal rate.
The Company offers its customers an option to purchase extended warranties on certain products. The Company recognizes revenue on these extended warranty contracts ratably over the life of the contract. The costs associated with these extended warranty contracts are recognized when incurred.
The Company offers discounts to its distributors if certain conditions are met. Discounts and allowances are primarily based on the volume of products purchased or targeted to be purchased by the individual customer or distributor. Discounts are deducted from revenue at the time of sale or when the discount is offered, whichever is later. The Company estimates volume discounts based on the individual customer’s historical and estimated future product purchases.
Amounts received from customers in advance of product shipment or rendering of services are classified as deferred income until the revenue can be recognized in accordance with the Company’s revenue recognition policy.
F-10
Table of Contents
SIRONA DENTAL SYSTEMS, INC. AND SUBSIDIARIES
NOTES TO THE CONSOLIDATED FINANCIAL STATEMENTS—(Continued)
Research and development
Amounts spent by the Company for research and development (R&D) efforts are recorded as R&D expenses when incurred. R&D costs relate primarily to internal costs for salaries, direct overhead costs and outside vendors. The Company capitalizes costs of equipment used for general R&D if it has alternative future use. The depreciation related to this capitalized equipment is included in the Company’s R&D costs. Software development costs incurred prior to the attainment of technological feasibility are considered R&D and are expensed as incurred.
Warranty expense
The Company offers warranties on its products for periods between one and three years. Estimated future warranty obligations related to product sales are charged to operations in the period in which the related revenue is recognized. These estimates are based on historical warranty experience and other relevant information of which the Company is aware. Estimated warranty expenses are recorded as an accrued liability and selling, general and administrative expense. During the fiscal years ended September 30, 2010, 2009 and 2008, warranty expense was $18,903, $20,512 and $23,217, respectively.
Shipping and handling costs
Shipping and handling costs charged to customers are included in revenues and the associated expense is recorded in cost of sales for all periods presented.
Advertising costs
Advertising costs are expensed as incurred and recorded within selling, general and administrative expense. During the fiscal years ended September 30, 2010, 2009 and 2008, advertising expense was $22,769, $25,804 and $27,884 respectively.
Pension benefits
The Company has defined benefit and defined contribution pension plans and an early retirement plan. Sirona recognizes changes in the funded status of its benefit plans, not yet recognized in the income statement, in other comprehensive income until they are amortized as a component of net periodic benefit cost in accordance with the provisions of ASC 715-30, Compensation-Retirement Benefits – Defined Benefit Plans-Pension.
Pension expense is recognized on an accrual basis over the employee’s approximate service periods. Defined benefit pension costs are determined by using an actuarial method, which provides for the deferral of actuarial gains and losses (in excess of a specified corridor) that result from changes in assumptions or actual experience differing from that assumed. Costs relating to changes in the benefit plan as well as the transition obligation are amortized. Disclosure of the components of periodic pension cost is also required. When purchase accounting is applied, pension liabilities are recognized for the projected benefit obligation in excess of plan assets.
For the defined contribution pension plans, the net pension cost is equal to the contributions required by the plan.
The Company also has an early retirement plan, Altersteilzeit (“ATZ”), which allows certain German employees who have been accepted into the plan to retire at 60 rather than at the legal retirement age of 67. Eligible employees are those who have attained the age of 55 by calendar year 2009 and have been accepted to participate in the ATZ plan. The ATZ plan can cover a period between the ages of 58 to 63 of the participating employees and is split into an active service period, where the employees work full time for the Company, and an inactive service period, where the employees do not work for the Company. During the active service period, the employees receive 50% of their salary and the remaining 50% of their salary, plus a bonus payment equal to 35% of their salary is paid during the inactive service period. The Company recognizes the salary component of the ATZ plan over the period from the beginning of the ATZ period to the end of the active service period. The Company recognizes the bonus component over the period from the point at which the employee signs the ATZ contract until the end of the active service period.
F-11
Table of Contents
SIRONA DENTAL SYSTEMS, INC. AND SUBSIDIARIES
NOTES TO THE CONSOLIDATED FINANCIAL STATEMENTS—(Continued)
Income Taxes
Differences between the basis of assets and liabilities for financial statement purposes and for tax return purposes are recorded as deferred tax assets or deferred tax liabilities in the accompanying consolidated financial statements. Deferred taxes represent the tax consequences in future years of these differences at each balance sheet date, based on the enacted tax laws and statutory rates applicable to the periods in which the differences are expected to affect taxable income. The provision (benefit) for income taxes represents the tax payable for the period and the change during the period in deferred tax assets and liabilities. A valuation allowance is established when it is more likely than not that the deferred tax assets are not realizable. The effect on deferred tax assets and liabilities of a change in the tax rates is recognized in income as an adjustment to income tax expense in the period that includes the enactment date. See Note 10, “Income Taxes” for additional information.
Cash and cash equivalents
All highly liquid investments with an original maturity of three months or less are considered to be cash equivalents. Investments in money market funds are carried at fair value. All other cash equivalents are stated at cost, which approximates fair value.
Restricted cash
Restricted cash represents cash balances pledged as collateral to financial institutions that provide security for prepayments from customers and other bonds.
Accounts receivable
Accounts receivable are stated at the invoiced amount, less allowances for doubtful accounts, which approximates fair value given their short-term due dates. Collectability of accounts receivable is regularly reviewed and is based upon managements’ knowledge of customers and compliance with credit terms. The allowance for doubtful accounts is adjusted based on such evaluation, with a corresponding provision included in selling, general and administrative expense. Accounts receivable balances are written off when management deems the balances uncollectible.
Inventory
Inventory is carried at the lower of cost or market value. Cost is determined using standard costing, which approximates the weighted average cost method. In addition to direct material and direct labor costs, certain costs related to the overhead and production expenses are included in inventory. Inventory reserves are provided for risks relating to slow moving, unmarketable and obsolete items.
Investments in companies
Investments in associated companies over which the Company can exercise significant influence but not effective control are accounted for using the equity method. Investments in associated companies over which the Company cannot exercise significant influence or effective control are accounted for at cost.
F-12
Table of Contents
SIRONA DENTAL SYSTEMS, INC. AND SUBSIDIARIES
NOTES TO THE CONSOLIDATED FINANCIAL STATEMENTS—(Continued)
Property, plant and equipment
Property, plant and equipment are recorded at historical cost plus the fair value of asset retirement costs, if any and if reasonably estimable, less accumulated depreciation. Additions, improvements and major renewals, which extend the useful life of the asset, are capitalized; maintenance and repairs are expensed as incurred. When assets are retired or disposed of, the assets and related accumulated depreciation and amortization are removed from the balance sheet and the resulting gain or loss is reflected in current operating income. Development costs for external use software incurred after the establishment of technological feasibility are capitalized and amortized to cost of revenues on a straight-line basis over the expected useful life of the software. Costs of software developed for internal use incurred during the development of the application are capitalized and amortized to operating expense on a straight-line basis over the expected useful life of the software. Prepayments for property, plant & equipment are classified as property, plant and equipment and are not depreciated until the assets are received and placed into service.
The cost of plant and equipment is depreciated using the straight-line method over the following estimated useful lives of the respective assets.
| Buildings |
25 to 50 years | |||
| Building improvements and leasehold improvements |
5 to 10 years | |||
| Machinery and technical equipment |
3 to 10 years | |||
| Software and software licenses |
3 to 5 years |
Finite-lived intangible assets
Finite-lived intangible assets are amortized according to the pattern in which the economic benefit of the asset is used up over their estimated useful lives, as shown below.
| Patents and licenses |
10 to 13 years | |||
| Technologies and Dealer Relationships |
1 to 13 years |
For intangible assets acquired after October 1, 2009, the Company adopted the new accounting guidance for determination of the useful lives of intangible assets in FASB Codification ASC 350, Intangibles – Goodwill and Other. This new guidance amends the factors that should be considered in developing renewal or extension assumptions used to determine the useful life of an intangible asset as well as the period of expected cash flows used to measure the fair value of intangible assets in business combinations. The implementation of this new guidance did not have an impact on the Company’s consolidated financial statements.
Impairment of long-lived and finite-lived assets
Long lived assets held for use by the Company are reviewed for impairment whenever events or circumstances provide evidence that suggests the carrying amount of the asset may not be recoverable. The Company performs ongoing impairment analysis on technology-related intangible assets. Determination of whether an impairment exists is based upon a comparison of the identifiable undiscounted cash flows of the assets or groups of assets to the carrying amount of the assets or groups of assets. If impaired, the resulting charge reflects the excess of the asset’s carrying amount over its fair value.
Goodwill and indefinite-lived intangible assets
Goodwill and indefinite lived intangible assets, consisting of certain trademarks, are not amortized, but are tested for impairment on an annual basis as of September 30, or whenever events or circumstances indicate that the carrying amount may not be recoverable. These impairment tests are based upon a comparison of the fair value of the reporting units to their respective carrying amount. If the carrying amount of the reporting unit exceeds its fair value, the goodwill impairment loss is measured as the excess of the carrying amount of goodwill over its implied fair value. If impairment is identified on indefinite-lived intangibles, the resulting charge reflects the excess of the asset’s carrying amount over its fair value.
F-13
Table of Contents
SIRONA DENTAL SYSTEMS, INC. AND SUBSIDIARIES
NOTES TO THE CONSOLIDATED FINANCIAL STATEMENTS—(Continued)
On October 1, 2009, the Company adopted the new accounting guidance for business combinations according to FASB Codification ASC 805, Business Combinations. This guidance establishes principles and requirements for the reporting entity in a business combination, including recognition and measurement in the financial statements of the identifiable assets acquired, the liabilities assumed, goodwill, and any noncontrolling interest in the acquiree, as well as disclosure requirements to enable financial statement users to evaluate the nature and financial effects of the business combination. Additionally, it provides guidance for identifying a business combination, measuring the acquisition date, and defining the measurement period for adjusting provisional amounts recorded. The implementation of this standard did not have an impact on the Company’s consolidated financial statements.
Other non-current assets
Other non-current assets and prepaid expenses are mainly comprised of capitalized debt issuance costs. The costs are amortized using the effective interest method. The non-current unamortized balance of such debt issuance costs was $130 and $1,054 as of September 30, 2010 and 2009, respectively.
Derivative financial instruments
The Company enters into forward foreign currency contracts in order to manage currency risks arising from its forecasted and firmly committed foreign currency denominated cash flows. The Company enters into these contracts to limit the foreign exchange rate risk for periods generally not to exceed six months. The Company also enters into interest rate swaps to manage its interest rates on its long term debt.
The Company does not utilize financial instruments for speculative purposes. The Company accounts for derivative financial instruments in accordance with ASC 815, Derivatives and Hedging. This Topic prescribes requirements for designation and documentation of hedging relationships and ongoing assessments of effectiveness in order to qualify for hedge accounting. The Company has not designated any of its derivatives as qualifying for hedge accounting under ASC 815. All derivatives instruments are therefore recognized as either assets or liabilities in the consolidated balance sheet at fair value. The fair value of the forward foreign currency contracts and interest rate swaps are included within prepaid and other current assets or current accrued liabilities, depending on whether they are an asset or a liability, and the change in fair value is recognized within “Gains (losses) on derivative instruments” in the consolidated statement of income.
Fair value of financial instruments
Financial instruments consist of cash, cash equivalents, accounts receivable, accounts payable, foreign currency forward contracts and interest rate swaps. The fair values of cash, cash equivalents, accounts receivable and accounts payable approximate their respective fair values because of the short-term nature of these items. The fair value of the foreign currency forward contracts and interest rate swaps are estimated based on information such as quotes from financial institutions.
At September 30, 2010, the foreign exchange forward contracts outstanding had notional amounts of $49,332 ($58,326 as at September 30, 2009) and a fair value asset of $1,452 (fair value asset of $1,355 as at September 30, 2009), with the unrealized fair value loss for the fiscal year ended September 30, 2010 of $(262) (year ended September 30, 2009, gain of $3,699).
During the fiscal year ended September 30, 2010, the interest rate swaps expired on March 31, 2010 and were not renewed. At September 30, 2009, the interest rate swaps had notional amounts of $363,008 and a fair value liability of $(6,500), with the unrealized fair value loss for the fiscal year ended September 30, 2009, of $(3,850).
F-14
Table of Contents
SIRONA DENTAL SYSTEMS, INC. AND SUBSIDIARIES
NOTES TO THE CONSOLIDATED FINANCIAL STATEMENTS—(Continued)
Concentration of credit risk
Financial instruments that potentially subject the Company to concentrations of credit risk include cash, cash equivalents and accounts receivable. Sirona has two customers accounting for more than 45% of revenue for the fiscal years ended September 30, 2010 and 2009. The accounts receivables from these two customers totaled $23,841 and $32,703 as of September 30, 2010 and 2009, respectively.
3. Recent Accounting Pronouncements
Not Yet Adopted
In October 2009, the FASB issued ASU 2009-13, Multiple-Deliverable Revenue Arrangements - a consensus of the FASB Emerging Issues Task Force, which amends the criteria for separating consideration in multiple-deliverable arrangements, establishes a selling price hierarchy for determining the selling price of a deliverable, replaces the term “fair value” in the revenue allocation with “selling price” to clarify that the allocation of revenue is based on entity-specific assumptions rather than assumptions of a marketplace participant, replaces the “residual method” of allocation with the “relative selling-price method”, and requires that arrangement consideration be allocated at the inception of the arrangement to all deliverables applying this method, including proportional allocation of any discounts to each deliverable. In addition, this new guidance will require that a vendor determine its best estimate of selling price in a manner that is consistent with that used to determine the selling price of a deliverable on a standalone basis and expands the required disclosures to provide information about the significant judgments made and changes to those judgments and about how the application of the relative selling-price method affects the timing or amount of revenue recognition. ASU 2009-13 is effective prospectively for revenue arrangements entered into or materially modified in fiscal years beginning on or after June 15, 2010, which corresponds to the Company’s fiscal year beginning October 1, 2010. The Company is evaluating the potential impact of adoption.
In October 2009, the FASB issued ASU 2009-14, Certain Revenue Arrangements that Include Software Elements – a consensus of the FASB Emerging Issues Task Force, which changes the accounting model for revenue arrangements that include both tangible products and software elements. This new guidance removes from the scope of the software revenue recognition guidance in ASC 985-605, Software Revenue Recognition, those tangible products containing software components and nonsoftware components that function together to deliver the tangible product’s essential functionality. In addition, this guidance requires that hardware components of a tangible product containing software components always be excluded from the software revenue recognition guidance as well as provides further guidance on determining which software, if any, relating to the tangible product also would be excluded from the scope of software revenue recognition guidance. The guidance further identifies specific factors in determining whether the tangible product contains software that works together with the nonsoftware components of the tangible product to deliver the tangible product’s essential functions. Guidance is also provided on how a vendor should allocate arrangement consideration to deliverables in an arrangement containing both tangible products and software. The disclosures mandated in ASU 2009-13 are also required by this new guidance. ASU 2009-14 is effective prospectively for revenue arrangements entered into or materially modified in fiscal years beginning on or after June 15, 2010, which corresponds to the Company’s fiscal year beginning October 1, 2010. The Company is evaluating the potential impact of adoption.
4. Employee Share-Based Compensation
ASC 718, Compensation – Stock Compensation, requires that all share based compensation arrangements, including grants of stock option awards to employees, be recognized based on the estimated fair value of the share-based payment award.
Share-based awards outstanding under Schick’s legacy stock option plans continue to be outstanding. At the date of the acquisition of Schick, 862,220 vested and 458,179 unvested options were outstanding. Options granted under these plans have 10 year contractual lives and vesting periods of between 2 to 4 years from the grant date. The Company does not expect to repurchase these shares within the next 12 months.
F-15
Table of Contents
SIRONA DENTAL SYSTEMS, INC. AND SUBSIDIARIES
NOTES TO THE CONSOLIDATED FINANCIAL STATEMENTS—(Continued)
In contemplation of the acquisition by Sirona, Schick conditionally granted employees and consultants 1,530,000 options upon the acquisition by Sirona. The four year vesting period of that grant commenced with the closing of the business acquisition on June 20, 2006.
All Schick legacy plans have expired, and accordingly, no further options may be granted under such plans.
On December 8, 2009 and May 10, 2010, the Company granted 188,000 and 25,000 RSU’s under the Equity Incentive Plan (the “2006 Plan”), respectively. The RSU’s vest over a period of four years (one third each at December 8, 2011, 2012 and 2013 for the December grant) and ratably over three years for the May grant. All grants expire ten years after the date of the grant. The RSU’s do not have rights to dividends prior to vesting. The value of each RSU is determined by the closing price as of the date of grant of $34.45 for the December 2009 grant and $38.11 for the May 2010 grant. The 2006 Plan provides for granting in total up to 4,550,000 stock options, incentive stock, and RSU’s to employees, directors, and consultants and received stockholder approval at the Company’s Annual Meeting of Stockholders held on February 27, 2007, and was amended on February 25, 2009. As of September 30, 2010, 1,634,920 shares were available for future grant under the 2006 Plan.
In fiscal year 2009, the Company granted 1,247,700 stock options under the 2006 Plan. Grants generally vest over four years. All grants expire ten years after the date of the grant. The 2006 Plan, as amended in February 2009, provides for grants of up to 4,550,000 options and or restricted shares to employees, directors and consultants.
The fair value of options granted in 2009 under the 2006 Plan were estimated using the Black-Scholes option pricing model using assumptions in the following table. The exercise price is equal to fair market value at the grant date. Expected volatility is based on the Company’s history stock price volatility. The risk-free rate is based on the U.S. Treasury yield curve in effect at the day of grant and has a term equal to the expected life of the option. The expected life represents the period of time the options are expected to be outstanding based on anticipated grantee behavior. The expected dividend yield is based on the Company’s history of not paying regular dividends in the past and the Company’s current intention not to pay dividends in the foreseeable future.
| Year ended |
Year
ended | |||
| Expected Volatility |
48% - 51% | 44% | ||
| Risk-free rate |
1.72% - 2.87% | 3.27% - 3.30% | ||
| Expected term |
5 years | 5 years | ||
| Expected dividends |
— | — |
In January and March 2009, the Company completed two value-for-value stock option exchanges for holders of eligible options granted under the 1996 Plan and the 2006 Plan with exercise prices of $21.32 or higher. The Company’s independent directors did not participate in the exchange programs. Under value-for-value option exchange programs, the option holders surrendered their eligible options in exchange for a lower number of replacement options and agreed to an additional year of service for vesting and having an exercise price equal to the closing price of Sirona’s stock on January 21, 2009 or March 30, 2009, the date the respective offers expired. The fair value of the replacement options approximates the fair value of the surrendered options in the aggregate, as determined using the Black-Scholes option pricing model as of the respective exchange date. Aggregate future non-cash stock option compensation expense is unchanged by the exchange programs in terms of both amount and timing of recognition.
Under the January 21, 2009 option exchange program, holders of 1,000,500 eligible options issued under the 2006 Plan with a weighted average exercise price of $34.63 surrendered those options in exchange for 421,428 replacement options with an exercise price of $11.73. Accordingly, 579,072 options were added back to the plan and became available for future grant. Under the March 30, 2009 option exchange program, holders of 1,619,750 eligible options issued under the 1996 Plan at an exercise price of $25.10 surrendered those options in exchange for 988,325 replacement options under the 2006 Plan with an exercise price of $14.09. Because the 1996 Plan has expired, the cancelled options did not become available for future grant.
Compensation expense of $13.6 million, $15.7 million, and $15.6 million has been charged to income for stock-based compensation for the fiscal years ended September 30, 2010, 2009, and 2008, respectively. The total income tax benefit recognized in the income statement for share-based compensation was $2.8, $3.9, and $3.7 million for the fiscal years ended September 30, 2010, 2009, and 2008, respectively. The following table summarizes compensation expense recorded in these financial statements.
F-16
Table of Contents
SIRONA DENTAL SYSTEMS, INC. AND SUBSIDIARIES
NOTES TO THE CONSOLIDATED FINANCIAL STATEMENTS—(Continued)
| Year ended September 30, 2010 |
Year ended September 30, 2009 |
Year ended September 30, 2008 |
||||||||||
| $’000s | ||||||||||||
| Cost of sales |
$ | 128 | $ | 271 | $ | 710 | ||||||
| Selling, general and admistrative |
13,294 | 14,948 | 13,828 | |||||||||
| Research and development |
194 | 507 | 1,032 | |||||||||
| $ | 13,616 | $ | 15,726 | $ | 15,570 | |||||||
The following is a summary of Sirona’s stock option activity for the fiscal years ended September 30, 2010 and 2009:
| Year ended September 30, 2010 |
||||||||
| Number of options |
Weighted average exercise price |
|||||||
| Outstanding at beginning of period |
3,553,058 | $ | 14.12 | |||||
| Exercised |
(360,402 | ) | 11.37 | |||||
| Expired |
(250 | ) | 11.90 | |||||
| Forfeited |
(19,003 | ) | 14.26 | |||||
| Outstanding at end of period |
3,173,403 | 14.04 | ||||||
| Year ended September 30, 2009 |
||||||||
| Number of options |
Weighted average exercise price |
|||||||
| Outstanding at beginning of period |
3,737,299 | $ | 25.29 | |||||
| Granted |
1,247,700 | 12.82 | ||||||
| Issued with exchanges |
1,409,753 | 13.38 | ||||||
| Exercised |
(106,509 | ) | 4.99 | |||||
| Expired |
(18,492 | ) | 27.40 | |||||
| Exchanged |
(2,620,250 | ) | 28.74 | |||||
| Forfeited |
(96,443 | ) | 28.38 | |||||
| Outstanding at end of period |
3,553,058 | 14.12 | ||||||
The intrinsic value of options exercised was $8.5 million and $1.6 million during the fiscal years ended September 30, 2010 and 2009, respectively. The aggregate intrinsic value of exercisable stock options was $40.7 million and $14.5 million at September 30, 2010 and 2009, respectively. These options have a weighted average remaining contractual life of 5.2 and 5.3 years, at September 30, 2010 and 2009, respectively.
As of September 30, 2010, there was $12.2 million of total compensation cost to be recognized in future periods related to outstanding non-vested share-based compensation awards. The cost is expected to be recognized over a weighted-average period of 2.4 years. The tax deductions and the actual tax benefit realized from option exercises was $5.5 million and $2.4 million, respectively, for the fiscal year ended September 30, 2010. The total fair value of options vested for the fiscal year ended September 30, 2010 is $27.5 million.
F-17
Table of Contents
SIRONA DENTAL SYSTEMS, INC. AND SUBSIDIARIES
NOTES TO THE CONSOLIDATED FINANCIAL STATEMENTS—(Continued)
As of September 30, 2009, there was $18.6 million of total compensation cost to be recognized in future periods related to outstanding non-vested share-based compensation awards. The cost is expected to be recognized over a weighted-average period of 2.0 years. The tax deductions and the actual tax benefit realized from option exercises was $0.7 million and $0.3 million, respectively, for the fiscal year ended September 30, 2009. The total fair value of options vested for the fiscal year ended September 30, 2009 is $1.5 million.
5. Comprehensive Income
Comprehensive Income developed over the last three fiscal years as follows:
| Year Ended September 30 2010 |
Year Ended September 30 2009 |
Year Ended September 30 2008 |
||||||||||
| $’000s | ||||||||||||
| Net Income |
$ | 91,446 | $ | 53,984 | $ | 29,599 | ||||||
| Other Comprehensive Income |
||||||||||||
| Cumulative translation adjustments |
(39,243 | ) | 14,314 | 1,871 | ||||||||
| Unrecognized elements of pension cost, net of tax |
(4,140 | ) | (761 | ) | 2,786 | |||||||
| Total Other Comprehensive Income |
(43,383 | ) | 13,553 | 4,657 | ||||||||
| Total Comprehensive Income |
$ | 48,063 | $ | 67,537 | $ | 34,256 | ||||||
6. Accounts receivable
The allowance for doubtful accounts developed as follows:
| Balance at Beginning of Period |
Additions | Deductions | Balance at End of Period |
|||||||||||||||||
| Charged to Cost and Expenses |
Charged to Other Accounts |
|||||||||||||||||||
| $’000s | ||||||||||||||||||||
| For the year ended September 30, 2010 |
$ | 2,088 | $ | 271 | $ | — | $ | 678 | $ | 1,681 | ||||||||||
| For the year ended September 30, 2009 |
1,741 | 882 | — | 535 | 2,088 | |||||||||||||||
| For the year ended September 30, 2008 |
1,475 | 681 | — | 415 | 1,741 | |||||||||||||||
F-18
Table of Contents
SIRONA DENTAL SYSTEMS, INC. AND SUBSIDIARIES
NOTES TO THE CONSOLIDATED FINANCIAL STATEMENTS—(Continued)
7. Inventories, net
| September 30, 2010 |
September 30, 2009 |
|||||||
| $’000s | ||||||||
| Finished goods |
$ | 51,102 | $ | 41,594 | ||||
| Work in progress |
12,646 | 14,086 | ||||||
| Raw materials |
23,342 | 31,167 | ||||||
| 87,090 | 86,847 | |||||||
| Inventory reserve |
(13,063 | ) | (12,322 | ) | ||||
| $ | 74,027 | $ | 74,525 | |||||
8. Property, plant and equipment, net
| Gross | Accumulated Depreciation and Amortization |
Net | ||||||||||
| $’000s | ||||||||||||
| As of September 30, 2010 |
||||||||||||
| Land |
$ | 12,779 | $ | — | $ | 12,779 | ||||||
| Buildings, building improvements and leasehold improvements |
20,132 | 7,445 | 12,687 | |||||||||
| Machinery and technical equipment |
114,957 | 67,733 | 47,224 | |||||||||
| Software and software licences |
34,660 | 15,535 | 19,125 | |||||||||
| Prepayments for property, plant and equipment |
10,871 | — | 10,871 | |||||||||
| $ | 193,399 | $ | 90,713 | $ | 102,686 | |||||||
| Gross | Accumulated Depreciation and Amortization |
Net | ||||||||||
| $’000s | ||||||||||||
| As of September 30, 2009 |
||||||||||||
| Land |
$ | 13,724 | $ | — | $ | 13,724 | ||||||
| Buildings, building improvements and leasehold improvements |
20,406 | 6,185 | 14,221 | |||||||||
| Machinery and technical equipment |
100,402 | 49,193 | 51,209 | |||||||||
| Software and software licences |
30,286 | 14,683 | 15,603 | |||||||||
| Prepayments for property, plant and equipment |
8,018 | — | 8,018 | |||||||||
| $ | 172,836 | $ | 70,061 | $ | 102,775 | |||||||
Depreciation and amortization expense for the fiscal years ended September 30, 2010, 2009, and 2008 was $21,880, $20,110, and $17,744.
Amortization expense includes amortization of capitalized software development costs for the fiscal years ended September 30, 2010, 2009, and 2008 of $4,223, $3,966, and $2,424.
F-19
Table of Contents
SIRONA DENTAL SYSTEMS, INC. AND SUBSIDIARIES
NOTES TO THE CONSOLIDATED FINANCIAL STATEMENTS—(Continued)
Buildings and leasehold improvements includes office space that is leased under operating leases to third parties with a historical cost of $1,463 and $1,572 and carrying amount of $791 and $985 at September 30, 2010 and 2009, respectively.
9. Intangible assets and goodwill
On June 30, 2005, Sirona Holdings Luxco S.C.A. (“Luxco”), a Luxembourg-based holding entity owned by funds managed by Madison Dearborn Partners, Beecken Petty O’Keefe, management and employees of Sirona, obtained control over the Sirona business. The transaction was effected by using new legal entities, Sirona Holding GmbH (formerly Blitz 05-118 GmbH) and its wholly owned subsidiary Sirona Dental Services GmbH, to acquire 100% of the interest in Sirona Dental Systems Beteiligungs- und Verwaltungs GmbH, the former parent of the Sirona business through a leveraged buy-out transaction (the “MDP Transaction”). The MDP Transaction was accounted for as a leveraged buyout transaction, in a manner similar to a business combination. Certain members of Sirona management who were deemed to be in the control group held equity interests in Sirona Group prior to and subsequent to the MDP Transaction (“Continuing Shareholders”). The interests of the Continuing Shareholders have been reflected at the predecessor basis, resulting in 9.15% of each asset and liability acquired being valued at historical cost at June 30, 2005. The remaining 90.85% interest in each asset and liability was recognized at fair value at June 30, 2005 and the excess of purchase price over predecessor basis is presented as a separate component of shareholders’ equity. Intangible assets and goodwill were primarily recorded in the MDP Transaction and the reverse acquisition of Schick on June 30, 2006.
The Company performed the required annual impairment tests as of September 30 in each year and identified no impairment.
Amortization expense for finite-lived identifiable intangible assets for the fiscal years ended September 30, 2010, 2009, and 2008 was $60,844, $71,486, and $91,649. The annual estimated amortization expense related to these intangible assets for the fiscal years 2011, 2012, 2013, 2014, and 2015 is $53,802, $49,238, $39,130, $32,222 and $26,102, respectively.
The following table presents details of intangible assets, related accumulated amortization and goodwill:
| Gross | Accumulated amortization |
Net | ||||||||||
| $’000s | ||||||||||||
| As of September 30, 2010 |
||||||||||||
| Patents & Licenses |
$ | 150,706 | $ | 71,965 | $ | 78,741 | ||||||
| Trademarks |
131,908 | 428 | 131,480 | |||||||||
| Technologies and dealer relationships |
451,333 | 298,910 | 152,423 | |||||||||
| Prepayments for intangible assets |
78 | — | 78 | |||||||||
| 734,025 | 371,303 | 362,722 | ||||||||||
| Goodwill |
656,465 | — | 656,465 | |||||||||
| Total intangible assets |
$ | 1,390,490 | $ | 371,303 | $ | 1,019,187 | ||||||
| Gross | Accumulated amortization |
Net | ||||||||||
| $’000s | ||||||||||||
| As of September 30, 2009 |
||||||||||||
| Patents & Licenses |
$ | 153,814 | $ | 59,322 | $ | 94,492 | ||||||
| Trademarks |
139,743 | 328 | 139,415 | |||||||||
| Technologies and dealer relationships |
481,325 | 267,533 | 213,792 | |||||||||
| Prepayments for intangible assets |
247 | — | 247 | |||||||||
| 775,129 | 327,183 | 447,946 | ||||||||||
| Goodwill |
696,355 | — | 696,355 | |||||||||
| Total intangible assets |
$ | 1,471,484 | $ | 327,183 | $ | 1,144,301 | ||||||
F-20
Table of Contents
SIRONA DENTAL SYSTEMS, INC. AND SUBSIDIARIES
NOTES TO THE CONSOLIDATED FINANCIAL STATEMENTS—(Continued)
The change in the value of goodwill and of intangible assets from September 30, 2009 to September 30, 2010 is mainly attributable to foreign currency fluctuations, with an impact of $39,949 on goodwill and $43,326 on intangible assets. Goodwill has been increased by $1,221 as a result of a subsequent purchase price adjustment for a subsidiary in China and also reduced by (i) $400 as a result of the sale of a subsidiary and (ii) $762 as a result of tax benefits received subsequent to the acquisition of Schick for options that were vested and included in the determination of purchase price at the time of that acquisition.
10. Income taxes
The income tax provision is comprised of the following:
| Year ended September 30, 2010 |
Year ended September 30, 2009 |
Year ended September 30, 2008 |
||||||||||
| $’000s | ||||||||||||
| Current |
||||||||||||
| Domestic (U.S.) |
$ | (11,632 | ) | $ | (8,412 | ) | $ | (9,171 | ) | |||
| Foreign |
(33,908 | ) | (22,691 | ) | (25,368 | ) | ||||||
| Total Current |
(45,540 | ) | (31,103 | ) | (34,539 | ) | ||||||
| Deferred |
||||||||||||
| Domestic (U.S.) |
9,719 | 11,644 | 10,465 | |||||||||
| Foreign |
12,041 | 10,162 | 14,737 | |||||||||
| Total Deferred |
21,760 | 21,806 | 25,202 | |||||||||
| Total |
$ | (23,780 | ) | $ | (9,297 | ) | $ | (9,337 | ) | |||
The significant components of deferred tax assets and liabilities included in the consolidated balance sheets are:
| September 30, 2010 |
September 30, 2009 |
|||||||
| $’000s | ||||||||
| Deferred tax assets |
||||||||
| Employee benefit accruals |
$ | 3,020 | $ | 3,566 | ||||
| Inventory reserve |
1,729 | 1,902 | ||||||
| Receivables |
— | 283 | ||||||
| Deferred income |
677 | 684 | ||||||
| Tax loss carryforward |
2,512 | 3,283 | ||||||
| Other |
26,464 | 17,070 | ||||||
| Valuation allowances |
(2,208 | ) | (4,731 | ) | ||||
| Total deferred tax assets, gross |
32,194 | 22,057 | ||||||
| Deferred tax liabilities |
||||||||
| Employee benefit accruals |
(2,501 | ) | — | |||||
| Goodwill amortization for tax purposes |
(21,305 | ) | (16,208 | ) | ||||
| Debt issuance costs |
(2,001 | ) | (2,111 | ) | ||||
| Inventory reserve |
(370 | ) | (457 | ) | ||||
| Receivables |
(946 | ) | (729 | ) | ||||
| Property, plant and equipment |
(9,467 | ) | (8,481 | ) | ||||
| Intangible assets |
(102,509 | ) | (130,220 | ) | ||||
| Deferred income |
(2,361 | ) | (4,338 | ) | ||||
| Other |
(982 | ) | (2,212 | ) | ||||
| Total deferred tax liabilities, gross |
(142,442 | ) | (164,756 | ) | ||||
| Total deferred tax liabilities, net |
$ | (110,248 | ) | $ | (142,699 | ) | ||
F-21
Table of Contents
SIRONA DENTAL SYSTEMS, INC. AND SUBSIDIARIES
NOTES TO THE CONSOLIDATED FINANCIAL STATEMENTS—(Continued)
In assessing the recoverability of deferred tax assets, management considers whether it is more likely than not that some portion or all of the deferred tax assets will not be realized. The ultimate realization of deferred tax assets is dependent upon sufficient taxable income within the carry-back years and the generation of future taxable income during the periods in which those temporary differences and tax loss carry-forwards become deductible. Management considers taxable income in the carry-back years, if carry back is permitted in the tax law, the projected future taxable income (including the realization of future taxable temporary differences), and tax planning strategies in making this assessment.
As of September 30, 2010, the Company had $8,523 of gross tax loss carry-forwards subject to expiration as follows:
| Year of expiration |
Losses | |||
| $’000s | ||||
| 2011 |
$ | 1,724 | ||
| 2012 |
668 | |||
| 2013 |
583 | |||
| 2014 |
1,669 | |||
| 2015 |
1,313 | |||
| 2016 - 2027 |
1,169 | |||
| Subtotal |
7,126 | |||
| Indefinite |
1,397 | |||
| Total |
$ | 8,523 | ||
The Company recognized a valuation allowance of $2,208 at September 30, 2010, ($4,731 at September 30, 2009) on deferred tax assets of $2,512 ($5,223 at September 30, 2009) predominantly relating to tax loss carry-forwards, as management believes that it is more likely than not that the benefits of those existing tax loss carry-forwards will not be realized within the period those tax losses are deductible.
F-22
Table of Contents
SIRONA DENTAL SYSTEMS, INC. AND SUBSIDIARIES
NOTES TO THE CONSOLIDATED FINANCIAL STATEMENTS—(Continued)
The difference between the U.S. federal income tax rate and the Company’s income tax (provision) benefit included in the consolidated statements of income consisted of the following:
| Year ended September 30, 2010 |
Year ended September 30, 2009 |
Year ended September 30, 2008 |
||||||||||
| $’000s | ||||||||||||
| Income before taxes |
$ | 115,226 | $ | 63,281 | $ | 38,936 | ||||||
| Computed tax provision |
(40,238 | ) | (22,290 | ) | (13,632 | ) | ||||||
| Foreign tax differential |
15,559 | 15,468 | 11,586 | |||||||||
| Non deductible expenses |
(4,661 | ) | (2,773 | ) | (3,615 | ) | ||||||
| Permanent differences relating to German trade taxes |
(1,211 | ) | (1,391 | ) | (1,317 | ) | ||||||
| Subpart F income net of tax credit |
(445 | ) | (379 | ) | (1,371 | ) | ||||||
| Tax income (expense) from prior periods |
740 | 1,623 | (895 | ) | ||||||||
| Tax free income and tax credits |
3,333 | 613 | 3,216 | |||||||||
| Additional state taxes |
(521 | ) | (92 | ) | 553 | |||||||
| Change in valuation allowance |
4,293 | 178 | (3,429 | ) | ||||||||
| Other |
(629 | ) | (254 | ) | (433 | ) | ||||||
| Provision for income taxes |
$ | (23,780 | ) | $ | (9,297 | ) | $ | (9,337 | ) | |||
Non-deductible expenses primarily include stock option expense in the U.S. The income tax provision at September 30, 2009 includes credits of $1,623 to adjust for prior year items.
In August 2007 a new tax law was enacted in Germany which has been applicable since Sirona’s fiscal year 2008. The new German tax law introduced earnings stripping rules (“Zinsschranke”) that may limit the deductibility of interest. For the fiscal years ended September 30, 2010 and 2009, the Company’s deductibility of interest was not limited as a result of this German tax law.
The components of income before taxes are:
| Year ended September 30, 2010 |
Year ended September 30, 2009 |
Year ended September 30, 2008 |
||||||||||
| $’000s | ||||||||||||
| Germany |
$ | 73,674 | $ | 37,873 | $ | 13,711 | ||||||
| United States |
(2,897 | ) | (11,999 | ) | (7,075 | ) | ||||||
| Other Foreign |
44,449 | 37,407 | 32,300 | |||||||||
| $ | 115,226 | $ | 63,281 | $ | 38,936 | |||||||
None of the goodwill recognized in the Exchange or in the business combinations completed in any of the periods presented is tax deductible.
The development of the valuation allowance on deferred tax assets over the last three fiscal years is presented below:
| Balance at Beginning of Period |
Charged/ (credited) to Cost and Expenses |
Addition Charged to Other Accounts |
Deductions | Balance at End of Period |
||||||||||||||||
| $’000s | ||||||||||||||||||||
| Valuation allowance deferred tax asset |
||||||||||||||||||||
| For the year ended September 30, 2010 |
$ | 4,731 | $ | 344 | $ | — | $ | 2,867 | $ | 2,208 | ||||||||||
| For the year ended September 30, 2009 |
6,932 | 1,906 | — | 4,107 | 4,731 | |||||||||||||||
| For the year ended September 30, 2008 |
5,350 | 2,688 | — | 1,106 | 6,932 | |||||||||||||||
F-23
Table of Contents
SIRONA DENTAL SYSTEMS, INC. AND SUBSIDIARIES
NOTES TO THE CONSOLIDATED FINANCIAL STATEMENTS—(Continued)
Income taxes on cumulative earnings of foreign subsidiaries have not been provided for because such earnings are intended to be indefinitely reinvested in those operations.
As of September 30, 2009, the Company’s liability for unrecognized tax benefits was approximately $36. As of September 30, 2010, the Company no longer had any unrecognized tax benefits.
With limited exception, the Company and its subsidiaries are no longer subject to U.S. federal, state and local or non-U.S. income tax audits by taxing authorities for tax returns filed with respect to periods prior to fiscal year 2005.
The Company classifies interest and penalties associated with income taxes as interest and other operating expense, respectively. Amounts of interest or penalties have not been material in any period.
11. Accrued liabilities and deferred income
| September 30, 2010 |
September 30, 2009 |
|||||||
| $’000s | ||||||||
| Employee benefits (e.g. bonuses, vacation, overtime, holiday payment) |
$ | 23,505 | $ | 31,638 | ||||
| Product warranty |
8,972 | 11,506 | ||||||
| Other provisions and liabilities |
55,965 | 30,216 | ||||||
| Deferred Income |
16,767 | 15,743 | ||||||
| Forward Exchange Contracts |
— | 6,499 | ||||||
| $ | 105,209 | $ | 95,602 | |||||
12. Short-term debt and current portion of long-term debt
The components of short-term debt are as follows:
| September 30, 2010 |
September 30, 2009 |
|||||||
| $’000s | ||||||||
| Accrued interest on long-term debt |
$ | 319 | $ | 2,781 | ||||
| Other short-term debt |
2,616 | 1,907 | ||||||
| $ | 2,935 | $ | 4,688 | |||||
F-24
Table of Contents
SIRONA DENTAL SYSTEMS, INC. AND SUBSIDIARIES
NOTES TO THE CONSOLIDATED FINANCIAL STATEMENTS—(Continued)
13. Long-term debt
| September 30, 2010 |
September 30, 2009 |
|||||||
| $’000s | ||||||||
| Bank loans |
||||||||
| Senior term loan, Tranche A1, variable rate repayable in November 2011 |
$ | 105,063 | $ | 127,986 | ||||
| Senior term loan, Tranche A2, variable rate repayable in November 2011 |
263,057 | 343,872 | ||||||
| Other debt |
— | 1,147 | ||||||
| 368,120 | 473,005 | |||||||
| Less current portion |
319 | 2,781 | ||||||
| $ | 367,801 | $ | 470,224 | |||||
The table below reflects the contractual maturity dates of the various borrowings at September 30, 2010:
| Year ending September 30, |
||||
| $’000s | ||||
| 2011 |
$ | 2,935 | ||
| 2012 |
367,801 | |||
| 2013 |
— | |||
| 2014 |
— | |||
| 2015 |
— | |||
| $ | 370,736 | |||
Senior Term Loans
On November 22, 2006, Sirona Dental Systems, Inc. entered into a Senior Facilities Agreement (the “Senior Facilities Agreement”) as original guarantor, with all significant subsidiaries of Sirona as original borrowers and original guarantors. Initial borrowings under the Senior Facilities Agreement plus excess cash were used to retire the outstanding borrowings under the Company’s previous credit facilities.
The Senior Facilities Agreement includes: (1) a term loan A1 in an aggregate principal amount of $150 million (the “tranche A1 term loan”) available to Sirona’s subsidiary, Schick NY, as borrower; (2) a term loan A2 in an aggregate principal amount of Euro 275 million (the “tranche A2 term loan”) available to Sirona’s subsidiary, Sirona Dental Services GmbH, as borrower; and (3) a $150 million revolving credit facility available to Sirona Dental Systems GmbH, Schick NY and Sirona Dental Services GmbH, as initial borrowers. The revolving credit facility is available for borrowing in Euro, U.S. Dollars, Yen or any other freely available currency agreed to by the facility agent. The facilities are made available on an unsecured basis. Subject to certain limitations, each European guarantor guarantees the performance of each European borrower, except itself, and each U.S. guarantor guarantees the performance of each U.S. borrower, except itself. There are no cross-border guarantees since all guarantees are by entities that have the same functional currency as the currency in which the respective guaranteed borrowing is denominated.
Each of the senior term loans are to be repaid in three annual installments beginning on November 24, 2009 and ending on November 24, 2011. Of the amounts borrowed under the term loan facilities, 15% was due on November 24, 2009, 15% was due on November 24, 2010 and 70% is due on November 24, 2011. The senior debt repayment tranche originally scheduled for November 24, 2009 was prepaid on May 11, 2009 in the amount of $78.6 million, and the senior debt repayment tranche originally scheduled for November 24, 2010 was prepaid on March 31, 2010 in the amount of $78.1 million. At the Company’s current Debt Cover Ratio, the facilities bear interest of Euribor, for Euro-denominated loans, and Libor for the other loans, plus a margin of 45 basis points for both.
The Senior Facilities Agreement contains a margin ratchet. Pursuant to this provision, which applies from November 24, 2007 onwards, the applicable margin will vary between 90 basis points and 45 basis points per annum according to the Company’s leverage multiple (i.e. the ratio of consolidated total net debt to consolidated adjusted EBITDA as defined in the Senior Facilities Agreement). Interest rate swaps were established for 66.6% of the interest until March 2010. These swaps expired on March 31, 2010 and were not renewed. The interest rate swaps fixed the LIBOR or EURIBOR element of interest payable on 66.7% of the principal amount of the loans for defined twelve and thirteen month interest periods over the lifetime of the swaps, respectively. The defined interest rates fixed for each twelve or thirteen month interest period ranged from 3.50% to 5.24%. Settlement of the swaps was required on a quarterly basis.
F-25
Table of Contents
SIRONA DENTAL SYSTEMS, INC. AND SUBSIDIARIES
NOTES TO THE CONSOLIDATED FINANCIAL STATEMENTS—(Continued)
The Senior Facilities Agreement contains restrictive covenants that limit Sirona’s ability to make loans, make investments (including in joint ventures), incur additional indebtedness, make acquisitions or pay dividends, subject to agreed-upon exceptions. The Company has agreed to certain financial debt covenants in relation to the financing. The covenants stipulate that the Company must maintain certain ratios in respect of interest payments and defined earnings measures. If the Company breaches any of the covenants, the loans will be become repayable on demand.
Debt issuance costs of $5.6 million were incurred in relation to the financing in November 2006 and were capitalized as deferred charges and are amortized using the effective interest method over the term of the loan.
14. Deferred income
On June 30, 2005, Sirona and its largest distributor, Patterson, amended the terms of an existing distribution agreement to extend Patterson’s rights as exclusive distributor of certain Sirona products within the U.S. and Canada from October 1, 2007 through September 30, 2017. As consideration for the extension of its exclusivity rights, Patterson made a one-time payment of $100 million to Sirona in July 2005. Sirona recorded the full amount of the payment as deferred income and started amortizing the amount on a straight-line basis over ten years on October 1, 2007. In the event of termination by Patterson for certain breaches of contract by Sirona, Sirona has to refund to Patterson the unearned portion of the $100 million payment as liquidated damages. Depending on the reason for termination, the amount of liquidated damages declines (i) on a straight line basis beginning in fiscal year 2008 or (ii) by $15 million per year in each of fiscal year 2008 through fiscal year 2012 and by $5 million per year thereafter. Sirona accounts for the deferred income related to the Patterson payment as a monetary liability. The deferred income is amortized and recognized as other operating income on a straight line over the term of the contract ($10 million per year). The current portion of deferred income is reported within Accrued liabilities and deferred income in the consolidated balance sheets. Effects of remeasurement of the amount from U.S. Dollar to Euro are reflected currently in the statement of income. Sirona recognized $5.7 million in foreign currency transaction losses in the fiscal year ended September 30, 2010, and $1.5 million and $1.4 million in foreign currency transaction gains in the fiscal years ended September 30, 2009 and 2008, respectively, and recognized $10.0 million of the Patterson deferred income in the consolidated statements of income for the fiscal years ended September 30, 2010, 2009, and 2008.
15. Income per share
The computation of basic and diluted income per share is as follows:
| Year ended September 30, 2010 |
Year ended September 30, 2009 |
Year ended September 30, 2008 |
||||||||||
| $’000s (except for share amounts) | ||||||||||||
| Net income attributable to Sirona Dental Systems, Inc. shareholders |
$ | 89,989 | $ | 53,355 | $ | 29,439 | ||||||
| Weighted average shares outstanding - basic |
55,146,180 | 54,879,417 | 54,797,493 | |||||||||
| Dilutive effect of stock-based compensation |
1,469,906 | 518,197 | 489,602 | |||||||||
| Weighted average shares outstanding - diluted |
56,616,086 | 55,397,614 | 55,287,095 | |||||||||
| Net income per share |
||||||||||||
| Basic |
$ | 1.63 | $ | 0.97 | $ | 0.54 | ||||||
| Diluted |
$ | 1.59 | $ | 0.96 | $ | 0.53 | ||||||
Stock options to acquire 85,000, 359,500, and 2,861,625 shares of Sirona’s common stock that were granted in connection with the 2007 Plan were not included in the computation of diluted earnings per share for the fiscal years ended September 30, 2010, 2009, and 2008, respectively, because the options’ underlying exercise prices were greater than the average market price of Sirona’s common stock for the period.
F-26
Table of Contents
SIRONA DENTAL SYSTEMS, INC. AND SUBSIDIARIES
NOTES TO THE CONSOLIDATED FINANCIAL STATEMENTS—(Continued)
16. Commitments and contingencies
Operating lease commitments
The Company leases certain buildings, vehicles and IT equipment from unrelated third parties. The leases are non-cancellable and have terms of more than one year. During the fiscal year ended September 30, 2010, leasing expense was $10,135 (year ended September, 30, 2009: $9,118; year ended September, 30, 2008: $8,436).
In July 2005, Sirona entered into a sale and leaseback agreement regarding unused land on the site of the major facility in Bensheim. The land was sold to an unrelated property development company, who constructed an office building on the site based on Sirona’s specifications. Sirona leased the property from the property development company through an 18-year lease. Under the terms of the lease, rent is fixed at Euro 1,202 ($1,641 at the U.S. Dollar/Euro exchange rate of September 30, 2010) per annum until 2013. After 2013, rent is subject to adjustment according to an inflation index. Rental payments started in April 2007 when the building was ready for occupancy. The land remains an asset on Sirona’s balance sheet and the building is accounted for as an operating lease.
Furthermore, the Company rents space in New York, Charlotte (USA), Salzburg (Austria) and other locations.
Future minimum lease payments under non-cancelable operating lease agreements as of September 30, 2010 are as follows:
| Year ending September 30, |
||||
| $’000s | ||||
| 2011 |
$ | 9,522 | ||
| 2012 |
8,776 | |||
| 2013 |
4,506 | |||
| 2014 |
2,583 | |||
| 2015 |
2,478 | |||
| Thereafter |
19,527 | |||
| $ | 47,392 | |||
Unconditional purchase commitments
As of September 30, 2010, the Company had unconditional purchase commitments of $57,066, mainly for purchases of raw material and components, which are due over a period of from one to three years.
Contingencies
The Company may be involved in lawsuits, claims, investigations and proceedings, including patent and commercial matters that arise in the ordinary course of business. At September 30, 2010, there are no such matters pending that the Company expects to be material in relation to its business, consolidated financial position, results of operations or cash flows.
F-27
Table of Contents
SIRONA DENTAL SYSTEMS, INC. AND SUBSIDIARIES
NOTES TO THE CONSOLIDATED FINANCIAL STATEMENTS—(Continued)
17. Product warranty
The following table provides the changes in the product warranty accrual for the fiscal year ended September 30, 2010:
| Year ended September 30, 2010 |
Year ended September 30, 2009 |
|||||||
| $’000s | ||||||||
| Balance at beginning of the period |
$ | 11,506 | $ | 12,176 | ||||
| Accruals for warranties issued during the period |
17,556 | 19,614 | ||||||
| Warranty settlements made during the period |
(18,903 | ) | (20,512 | ) | ||||
| Translation adjustment |
(1,187 | ) | 228 | |||||
| Balance at end of the period |
$ | 8,972 | $ | 11,506 | ||||
18. Interest
| Year ended September 30, 2010 |
Year ended September 30, 2009 |
Year ended September 30, 2008 |
||||||||||
| $’000s | ||||||||||||
| Interest expense |
$ | (11,770 | ) | $ | (24,054 | ) | $ | (31,708 | ) | |||
| Interest income |
727 | 1,557 | 4,913 | |||||||||
| $ | (11,043 | ) | $ | (22,497 | ) | $ | (26,795 | ) | ||||
19. Pension plans
Defined benefit plans
In Germany, the Company traditionally had an unfunded defined benefit pension plan whose benefits are based primarily on years of service and wage and salary group. As of January 1, 2001, the Company replaced its unfunded defined benefit pension plan with a new defined contribution plan. All new hires after that date only receive defined contributions to a pension plan based on a percentage of the employee’s eligible compensation. However, due to grandfathering provisions for certain existing employees hired before that date, the Company continues to be obligated to provide pension benefits which are at a minimum equal to benefits that would have been available under the terms of the traditional defined benefit plans (Grandfathered Benefit). The Grandfathered Benefit and contributions to the Company’s pension plan made for those employees after January 1, 2001 are included in the disclosures for defined benefit plans. The Company accounts for the Grandfathered Benefit by recognizing the higher of the defined contribution obligation or the defined benefit obligation for the minimum benefit. As of September 30, 2010 and 2009, contributions made through the defined contribution plan for those employees are adequate to cover the Grandfathered Benefit obligation. Therefore, the Company accounts for that portion of its pension obligation as a fully funded plan with a funded status of zero.
In addition, the Company offers defined contribution benefits under the terms of a Section 401(k) plan to employees in the U.S.
The Company uses an actuarial measurement date of September 30.
F-28
Table of Contents
SIRONA DENTAL SYSTEMS, INC. AND SUBSIDIARIES
NOTES TO THE CONSOLIDATED FINANCIAL STATEMENTS—(Continued)
Change in the projected benefit obligation and plan assets for all of the Company’s defined benefit plans is as follows:
| Year ended September 30, 2010 |
Year ended September 30, 2009 |
|||||||
| $’000s | ||||||||
| Projected benefit obligation at beginning of period |
$ | 61,443 | $ | 56,907 | ||||
| Service cost |
1,165 | 1,209 | ||||||
| Interest cost |
2,508 | 2,643 | ||||||
| Actuarial gain |
4,632 | 37 | ||||||
| Investment earnings |
510 | 465 | ||||||
| Benefits paid |
(1,836 | ) | (1,495 | ) | ||||
| Currency translation |
(4,193 | ) | 1,677 | |||||
| Projected benefit obligation at end of period |
64,229 | 61,443 | ||||||
| Fair value of plan assets at beginning of period |
11,115 | 9,529 | ||||||
| Actual return on plan assets |
510 | 465 | ||||||
| Employer’s contribution |
909 | 920 | ||||||
| Benefits paid |
(218 | ) | (118 | ) | ||||
| Currency Translation |
(759 | ) | 319 | |||||
| Fair value of plan assets at end of period |
11,557 | 11,115 | ||||||
| Funded status |
$ | (52,672 | ) | $ | (50,328 | ) | ||
Components of net periodic benefit costs are as follows:
| Year ended September 30, 2010 |
Year ended September 30, 2009 |
Year ended September 30, 2008 |
||||||||||
| $’000s | ||||||||||||
| Service cost, net |
$ | 256 | $ | 289 | $ | 311 | ||||||
| Interest cost |
2,508 | 2,643 | 2,716 | |||||||||
| Amortization of actuarial gains |
(442 | ) | (485 | ) | (159 | ) | ||||||
| Net periodic benefit cost |
$ | 2,322 | $ | 2,447 | $ | 2,868 | ||||||
The accumulated benefit obligation as of September 30, 2010 and 2009 was $51,824 and $49,401, respectively.
To the extent the defined benefit obligation is recognized for the Grandfathered Benefit, the long-term estimated rate of return on plan assets is 5% per annum. This rate was based on an appropriate long-term rate for the plan assets held.
The benefits expected to be paid in cash of the following five years, and in aggregate for the fiscal years thereafter, are as follows:
| Year ending September 30, |
||||
| $’000s | ||||
| 2011 |
$ | 2,650 | ||
| 2012 |
2,586 | |||
| 2013 |
2,243 | |||
| 2014 |
2,361 | |||
| 2015 |
2,520 | |||
| 5 Years thereafter |
13,949 | |||
| $ | 26,309 | |||
F-29
Table of Contents
SIRONA DENTAL SYSTEMS, INC. AND SUBSIDIARIES
NOTES TO THE CONSOLIDATED FINANCIAL STATEMENTS—(Continued)
The contributions expected to be made in each of the following five years and in aggregate thereafter are as follows:
| Year ending September 30, |
||||
| $’000s | ||||
| 2011 |
$ | 1,320 | ||
| 2012 |
1,350 | |||
| 2013 |
1,361 | |||
| 2014 |
1,359 | |||
| 2015 |
1,335 | |||
| 5 Years thereafter |
16,274 | |||
| $ | 22,999 | |||
Weighted-average assumptions used to determine benefit obligations (current-year rate) and net periodic benefit costs (prior-year rate) are as follows:
| Year ended September 30, 2010 |
Year ended September 30, 2009 |
Year ended September 30, 2008 |
||||||||||
| Discount rate |
4.75 | % | 5.50 | % | 6.00 | % | ||||||
Plan assets consist of insurance policies with a guaranteed minimum return by the insurance company and an excess profit participation feature for a portion of the benefits. Sirona pays the premiums on the insurance policies but does not manage the investment of the funds; the insurance company makes all decisions on investment of funds, including the allocation to asset groups. The fair value of the plan assets such as equity securities, fixed-income investments, and others is based on the cash surrender values reported by the insurance company.
Defined contribution plans
The Company made contributions of $557 to the German plan for the fiscal year ended September 30, 2010, and $553 to the German plan for the fiscal year ended September 30, 2009.
Contributions to the U.S. plans were $469 for the fiscal year ended September 30, 2010, and $548 for the fiscal year ended September 30, 2009. The Company is obligated to match employee contributions as defined in the plans.
F-30
Table of Contents
SIRONA DENTAL SYSTEMS, INC. AND SUBSIDIARIES
NOTES TO THE CONSOLIDATED FINANCIAL STATEMENTS—(Continued)
20. Net Other Operating Income and Restructuring Costs
Net other operating income for the fiscal years ended September 30, 2010 and September 30, 2009 was $11.6 million and $5.7 million, respectively. In both periods, net other operating income included $10.0 million of income resulting from the amortization of the deferred income relating to the Patterson exclusivity payment. In the fiscal year ended September 30, 2010, net other operating income included a gain of $ 0.8 million from the release of the remaining accrued restructuring costs as well as a gain from the sale of a subsidiary in Italy of $0.9 million. In the fiscal year ended September 30, 2009, net other operating income included restructuring costs of $8.2 million, and a gain from the sale of a sales and service subsidiary in Spain of $3.9 million.
Restructuring Costs
In fiscal year 2009, we incurred restructuring costs of $8.2 million included in net other operating income for certain actions to reduce operating costs and thereby to improve the efficiency of our organization.
As of September 30, 2009, we had accrued restructuring costs in the amount of $4.2 million. In the fiscal year ended September 30, 2010, we completed our restructuring efforts and released the remaining accrual of $ 0.8 million, as actual expenses were lower than the estimated restructuring costs. The development of restructuring costs in the current fiscal year is presented in the following table:
| Provision at October 1, 2009 |
Restructuring Costs/(Release) |
Payments | Currency translation adjustment |
Provision at September 30, 2010 |
||||||||||||||||
| $’000s | ||||||||||||||||||||
| Severance costs |
$ | 3,660 | $ | (755 | ) | $ | 2,567 | $ | (338 | ) | $ | — | ||||||||
| Consulting costs |
581 | — | 585 | 4 | — | |||||||||||||||
| Total |
$ | 4,241 | $ | (755 | ) | $ | 3,152 | $ | (334 | ) | $ | — | ||||||||
21. Derivative Instruments and Hedging Strategies
Our operations are exposed to market risks from changes in foreign currency exchange rates and interest rates. In the normal course of business, these risks are managed through a variety of strategies, including the use of derivatives.
Interest Rate Risk
The Company is exposed to interest rate risk associated with fluctuations in the interest rates on its variable interest rate debt. In order to manage this risk, the Company entered into interest rate swap agreements that convert the debt’s variable interest rate to a fixed interest rate. While these swap agreements were considered to be economic hedges, they are not designated as hedging instruments under ASC 815.
Interest rate swaps were established for 66.6% of the interest until March 2010. These swaps expired on March 31, 2010 and were not renewed. The interest rate swaps fixed the LIBOR or EURIBOR element of interest payable on 66.7% of the principal amount of the loans for defined twelve and thirteen month interest periods over the lifetime of the swaps, respectively. The defined interest rates fixed for each twelve or thirteen month interest period ranged from 3.50% to 5.24%. Settlement of the swaps was required on a quarterly basis.
F-31
Table of Contents
SIRONA DENTAL SYSTEMS, INC. AND SUBSIDIARIES
NOTES TO THE CONSOLIDATED FINANCIAL STATEMENTS—(Continued)
Foreign Currency Exposure
Although the U.S. Dollar is Sirona’s reporting currency, its functional currency varies depending on the country of operation. During the periods under review, the U.S. Dollar/Euro exchange rate fluctuated significantly, thereby impacting Sirona’s financial results. In order to manage foreign currency exposures, the Company enters into foreign exchange forward contracts (USD, AUD, and JPY). As with its interest rate swap instruments, the Company enters into forward contracts that are considered to be economic hedges which are not considered hedging instruments under ASC 815.
As of September 30, 2010, these contracts had notional amounts totaling $49.3 million. These agreements are relatively short-term (generally six months).
The fair value carrying amount of the Company’s derivative instruments at September 30, 2010 is described in Note 22 Fair Value Measurements.
The location and amount of gains and losses from the fair value changes of derivative instruments reported in our condensed consolidated statement of income were as follows:
| Year ended September 30, 2010 |
Year ended September 30, 2009 |
Year ended September 30, 2008 |
||||||||||||
| Derivatives Not Designated as Hedging Instruments |
Location of (Gain)/Loss Recognized in Income on Derivative |
Amount of (Gain)/Loss Recognized in Income on Derivative |
Amount of (Gain)/Loss Recognized in Income on Derivative |
Amount of (Gain)/Loss Recognized in Income on Derivative |
||||||||||
| $’000s | ||||||||||||||
| Interest rate swap contracts |
(Gain)/loss on derivative instruments, net | $ | (6,364 | ) | $ | 3,850 | $ | 2,119 | ||||||
| Foreign exchange contracts |
Loss/(gain) on derivative instruments, net | 262 | (3,699 | ) | 4,541 | |||||||||
| Total |
$ | (6,102 | ) | $ | 151 | $ | 6,660 | |||||||
22. Fair Value Measurements
On October 1, 2008, the Company adopted the provisions of ASC 820, Fair Value Measurements and Disclosures, for assets and liabilities that are recognized or disclosed at fair value in the financial statements on a recurring basis. ASC 820 defines fair value as the price that would be received from selling an asset or paid to transfer a liability in an orderly transaction between market participants at the measurement date. When determining the fair value measurements for assets and liabilities that are required to be recorded or disclosed at fair value, the Company considers the principal or most advantageous market in which it would transact and the market-based risk measurements or assumptions that market participants would use in pricing the asset or liability, such as inherent risk, transfer restrictions, and the credit risk of the Company and counterparties to the arrangement.
ASC 820 establishes a fair value hierarchy that prioritizes the inputs to valuation techniques used to measure fair value into three levels. A financial instrument’s categorization within the fair value hierarchy is based upon the lowest level of input that is available and significant to the fair value measurement. ASC 820 establishes and prioritizes the following three levels of inputs that may be used to measure fair value:
Level 1 - Quoted prices in active markets for identical assets or liabilities.
Level 2 - Observable inputs other than quoted prices in active markets for identical assets and liabilities, quoted prices for identical or similar assets or liabilities in inactive markets, or other inputs that are observable or can be corroborated by observable market data for substantially the full term of the assets or liabilities.
Level 3 - Inputs that are generally unobservable and typically reflect management’s estimates of assumptions that market participants would use in pricing the asset or liability.
F-32
Table of Contents
SIRONA DENTAL SYSTEMS, INC. AND SUBSIDIARIES
NOTES TO THE CONSOLIDATED FINANCIAL STATEMENTS—(Continued)
Assets/Liabilities Measured at Fair Value on a Recurring Basis
The following table presents the Company’s assets and liabilities measured at fair value on a recurring basis as of September 30, 2010:
| Quoted Prices in Active Markets for Identical Instruments (Level 1) |
Significant Other Observable Inputs (Level 2) |
Significant Unobservable Inputs (Level 3) |
Total | |||||||||||||
| Foreign Exchange | ||||||||||||||||
| $’000s | ||||||||||||||||
| Assets |
||||||||||||||||
| Cash Equivalents (money market funds) |
$ | 141,981 | $ | — | $ | — | $ | 141,981 | ||||||||
| Derivative Assets |
— | 2,015 | — | 2,015 | ||||||||||||
| Liabilities |
||||||||||||||||
| Derivative Liabilities |
$ | — | $ | (563 | ) | $ | — | $ | (563 | ) | ||||||
| Total |
$ | 141,981 | $ | 1,452 | $ | — | ||||||||||
In the Company’s September 30, 2010, Consolidated Balance Sheet derivative assets and derivative liabilities are classified as prepaid expenses and other current assets and accrued liabilities and deferred income, respectively.
The Company did not elect the fair value option for any eligible financial instruments.
Fair value of financial instruments
Financial instruments consist of cash, cash equivalents, accounts receivable, accounts payable and foreign currency forward contracts. The fair values of cash, cash equivalents, accounts receivable and accounts payable approximate their respective fair values because of the short maturity and nature of these items. The fair value of the foreign currency forward contracts is estimated by obtaining quotes from financial institutions.
23. Segment reporting
Sirona manages its business on both a product and geographic basis and has four reporting segments; Dental CAD/CAM Systems, Imaging Systems, Treatment Centers, and Instruments. There are two regional sales organizations, USA and Other World Markets, which distribute Sirona’s products globally through a network of independent distributors to dental practices, clinics and laboratories. The Electronic Center is a shared facility that manufactures electronic components and provides services for all Sirona segments, and to a very limited extent, external parties. Further shared functions including customer service, logistics, site management, IT and administration are operated centrally.
Description of the Company’s segments
Dental CAD/CAM Systems
Dental CAD/CAM Systems products comprise CAD/CAM chairside systems for the dentist (CEREC) as well as CAD/CAM systems for the laboratories, such as inLab, inEOS and a central manufacturing service for copings and bridge-frameworks. The CEREC system allows dentists to prepare restorations in an “out-of-mouth pre-shaped’ process and insert them into the patient’s mouths during a single appointment.
Imaging Systems
Imaging systems products comprise a broad range of equipment for diagnostic imaging in the dental practice, using both film-based and digital technologies. Sirona has developed a broad range of imaging systems for 3D, panoramic and intra-oral applications.
F-33
Table of Contents
SIRONA DENTAL SYSTEMS, INC. AND SUBSIDIARIES
NOTES TO THE CONSOLIDATED FINANCIAL STATEMENTS—(Continued)
Treatment Centers
Sirona’s treatment centers comprise a broad range, from standard dentist chairs to sophisticated centers with integrated diagnostic, hygiene and ergonomic functionalities, such as Teneo, C2+ and M1+, as well as specialist centers used for training purposes.
Instruments
Sirona offers a wide range of handpiece products, encompassing handheld and power-operated handpieces for cavity preparation, endodontics, periodontology and prophylaxis. The handpieces are supplemented by multi-function tips, supply and suction hoses, as well as care and hygiene systems for handpiece preparation. Sirona’s handpieces are often sold as complete packages in combination with treatment centers. The division also supplies parts for other divisions, especially Treatment Units (OEM turbines and tubes) and CAD/CAM Systems.
Segment results
The following tables reflect the results of the Company’s reportable segments under the Company’s management reporting system. The segment performance measure used to monitor segment performance is gross profit (“Segment Performance Measure”) excluding the impact of the MDP Transaction. This measure is considered by management to better reflect the performance of each segment as it eliminates the need to allocate centrally incurred costs and significant purchase accounting impacts that the Company does not believe are representative of the performance of the segments. Furthermore, the Company monitors performance geographically by region. As the Company manages its business on both a product and a geographical basis, U.S. GAAP requires segmental disclosure based on product information.
F-34
Table of Contents
SIRONA DENTAL SYSTEMS, INC. AND SUBSIDIARIES
NOTES TO THE CONSOLIDATED FINANCIAL STATEMENTS—(Continued)
| Year ended September 30, 2010 |
Year ended September 30, 2009 |
Year ended September 30, 2008 |
||||||||||
| $’000s | ||||||||||||
| Revenue External |
||||||||||||
| Dental CAD/CAM Systems |
$ | 260,375 | $ | 245,351 | $ | 237,312 | ||||||
| Imaging Systems |
252,635 | 226,726 | 254,005 | |||||||||
| Treatment Centers |
162,300 | 152,675 | 169,061 | |||||||||
| Instruments |
94,278 | 87,855 | 96,665 | |||||||||
| Total |
769,588 | 712,607 | 757,043 | |||||||||
| Electronic center and corporate |
688 | 687 | 68 | |||||||||
| Total |
$ | 770,276 | $ | 713,294 | $ | 757,111 | ||||||
| Revenue Internal |
||||||||||||
| Dental CAD/CAM Systems |
$ | (0 | ) | $ | — | $ | — | |||||
| Imaging Systems |
13 | 44 | 100 | |||||||||
| Treatment Centers |
31 | 31 | 20 | |||||||||
| Instruments |
9,444 | 9,214 | 7,460 | |||||||||
| Intercompany elimination |
(9,488 | ) | (9,289 | ) | (7,580 | ) | ||||||
| Total |
— | — | — | |||||||||
| Electronic center and corporate |
19,578 | 19,998 | 24,605 | |||||||||
| Intercompany elimination |
(19,578 | ) | (19,998 | ) | (24,605 | ) | ||||||
| Total |
$ | — | $ | — | $ | — | ||||||
| Revenue Total |
||||||||||||
| Dental CAD/CAM Systems |
$ | 260,375 | $ | 245,351 | $ | 237,312 | ||||||
| Imaging Systems |
252,648 | 226,770 | 254,105 | |||||||||
| Treatment Centers |
162,331 | 152,706 | 169,081 | |||||||||
| Instruments |
103,722 | 97,069 | 104,125 | |||||||||
| Total |
779,076 | 721,896 | 764,623 | |||||||||
| Electronic center and corporate |
20,266 | 20,685 | 24,673 | |||||||||
| Total |
$ | 799,342 | $ | 742,581 | $ | 789,296 | ||||||
| Segment performance measure |
||||||||||||
| Dental CAD/CAM Systems |
$ | 184,159 | $ | 168,324 | $ | 159,326 | ||||||
| Imaging Systems |
151,917 | 135,086 | 149,980 | |||||||||
| Treatment Centers |
66,598 | 59,365 | 67,182 | |||||||||
| Instruments |
43,285 | 39,609 | 44,845 | |||||||||
| Total |
445,959 | 402,384 | 421,333 | |||||||||
| Electronic center and corporate |
9,665 | 9,858 | 9,304 | |||||||||
| Total |
$ | 445,624 | $ | 412,242 | $ | 430,637 | ||||||
| Depreciation and amortization expense |
||||||||||||
| Dental CAD/CAM Systems |
$ | 5,781 | $ | 4,634 | $ | 4,001 | ||||||
| Imaging Systems |
5,732 | 4,931 | 5,294 | |||||||||
| Treatment Centers |
6,205 | 5,981 | 3,933 | |||||||||
| Instruments |
3,037 | 2,863 | 3,750 | |||||||||
| Total |
20,755 | 18,409 | 16,978 | |||||||||
| Electronic center and corporate |
1,125 | 1,701 | 766 | |||||||||
| Total |
$ | 21,880 | $ | 20,110 | $ | 17,744 | ||||||
F-35
Table of Contents
SIRONA DENTAL SYSTEMS, INC. AND SUBSIDIARIES
NOTES TO THE CONSOLIDATED FINANCIAL STATEMENTS—(Continued)
Reconciliation of the results of the segment performance measure to the consolidated statements of operations
The following table and discussion provide a reconciliation of the total results of operations of the Company’s business segments under management reporting to the consolidated financial statements. The differences shown between management reporting and U.S. GAAP for the fiscal year ended September 30, 2010, 2009 and 2008 are mainly due to the impact of purchase accounting. Purchase accounting effects are not included in gross profit as the Company does not believe these to be representative of the performance of each segment.
Inter-segment transactions are based on amounts which management believes are approximate to the amounts of transactions with unrelated third parties.
| Year ended September 30, 2010 |
Year ended September 30, 2009 |
Year ended September 30, 2008 |
||||||||||
| $’000s | ||||||||||||
| Revenue |
||||||||||||
| Total segments (external) |
$ | 769,588 | $ | 712,607 | $ | 757,043 | ||||||
| Electronic center and corporate |
688 | 687 | 68 | |||||||||
| Consolidated revenue |
770,276 | 713,294 | 757,111 | |||||||||
| Depreciation and amortization |
||||||||||||
| Total segments |
20,755 | 20,110 | 16,978 | |||||||||
| Differences management reporting vs. US GAAP, electronic center and corporate |
61,969 | 71,486 | 92,415 | |||||||||
| Consolidated depreciation and amortization |
82,724 | 91,596 | 109,393 | |||||||||
| Segment performance measure |
||||||||||||
| Total segments |
445,959 | 402,385 | 421,333 | |||||||||
| Differences management reporting vs. US GAAP, electronic center and corporate |
(46,949 | ) | (56,243 | ) | (75,711 | ) | ||||||
| Consolidated gross profit |
399,010 | 346,142 | 345,622 | |||||||||
| Selling, general and administrative expense |
235,932 | 225,351 | 242,293 | |||||||||
| Research and development |
46,365 | 40,631 | 48,744 | |||||||||
| Provision for doubtful accounts and notes receivable |
271 | 763 | 824 | |||||||||
| Net other operating (income) and restructuring costs |
(11,661 | ) | (5,689 | ) | (10,000 | ) | ||||||
| Foreign currency transaction loss/(gain), net |
7,160 | (1,248 | ) | (8,935 | ) | |||||||
| (Gain)/loss on derivative instruments |
(6,102 | ) | 151 | 6,660 | ||||||||
| Interest expense, net |
11,043 | 22,497 | 26,795 | |||||||||
| Other expense |
776 | 405 | 305 | |||||||||
| Income before taxes |
$ | 115,226 | $ | 63,281 | $ | 38,936 | ||||||
The adjustments that the Company records to reconcile management reporting to the consolidated financial statements prepared in accordance with U.S. GAAP primarily relate to the exclusion of amortization and depreciation related to the step-up to fair value of the intangible and tangible assets as a result of the MDP Transaction (see Note 9).
F-36
Table of Contents
SIRONA DENTAL SYSTEMS, INC. AND SUBSIDIARIES
NOTES TO THE CONSOLIDATED FINANCIAL STATEMENTS—(Continued)
The following information is presented in accordance with U.S. GAAP:
| September 30, 2010 |
September 30, 2009 |
|||||||
| $’000s | ||||||||
| Total assets |
||||||||
| Dental CAD/CAM Systems |
$ | 684,963 | $ | 725,153 | ||||
| Imaging Systems |
493,810 | 510,903 | ||||||
| Treatment Centers |
270,799 | 263,692 | ||||||
| Instruments |
143,365 | 148,327 | ||||||
| Total |
$ | 1,592,937 | $ | 1,648,075 | ||||
| Goodwill |
||||||||
| Dental CAD/CAM Systems |
$ | 301,023 | $ | 319,300 | ||||
| Imaging Systems |
198,015 | 210,098 | ||||||
| Treatment Centers |
96,565 | 102,396 | ||||||
| Instruments |
60,862 | 64,561 | ||||||
| Total |
$ | 656,465 | $ | 696,355 | ||||
| United | Rest of | |||||||||||||||
| Germany | States | World | Total | |||||||||||||
| $’000s | ||||||||||||||||
| Net Sales* |
||||||||||||||||
| October 1, 2009 to September 30, 2010 |
$ | 148,305 | $ | 239,541 | $ | 382,431 | $ | 770,276 | ||||||||
| October 1, 2008 to September 30, 2009 |
147,268 | 221,206 | 344,820 | 713,294 | ||||||||||||
| October 1, 2007 to September 30, 2008 |
153,765 | 220,946 | 382,400 | 757,111 | ||||||||||||
| Long-lived assets** |
||||||||||||||||
| September 30, 2010 |
$ | 91,877 | $ | 5,902 | $ | 9,453 | $ | 107,232 | ||||||||
| September 30, 2009 |
92,731 | 6,252 | 8,368 | 107,351 | ||||||||||||
| * | Sales are allocated to the country in which the customer is located. |
| ** | Long-lived assets exclude all intangible assets and deferred tax assets. |
During the years ended September 30, 2010, September 30, 2009, and September 30, 2008, revenues from two customers represented 45%, 45% and 42% of net sales, respectively. No other customer accounted for more than 10% of revenues.
24. Related parties
Sirona Holdings S.C.A. Luxembourg (“Luxco”)
On July 30, 2010, the Company and Luxco, a significant shareholder of the Company, elected not to renew the advisory services agreement between them that terminated on October 1, 2010. Under the agreement, which became effective October 1, 2005, the Company paid an annual fee to Luxco of €325,000 (approximately $444,000), and Luxco provided to the Company certain advisory services regarding the structure, terms and condition of debt offerings by the Company, financing sources and options, business development and other services.
In December 2009, Luxco sold 7,100,000 shares pursuant to an underwritten follow-on public offering. The Company incurred $0.4 million of costs pursuant to the terms of a registration rights agreement.
In February 2010, Luxco sold 7,000,000 shares pursuant to an underwritten follow-on public offering. The Company incurred $0.4 million of costs pursuant to the terms of a registration rights agreement.
F-37
Table of Contents
SIRONA DENTAL SYSTEMS, INC. AND SUBSIDIARIES
NOTES TO THE CONSOLIDATED FINANCIAL STATEMENTS—(Continued)
25. Unaudited quarterly information
The following is a summary of the Company’s unaudited quarterly operating results for the fiscal years ended September 30, 2010 and 2009:
| September 30, | June 30, | March 31, | December 31, | |||||||||||||
| 2010 | 2010 | 2010 | 2009 | |||||||||||||
| $’000s (except per share amounts) | ||||||||||||||||
| Revenue |
$ | 182,899 | $ | 182,418 | $ | 190,136 | $ | 214,823 | ||||||||
| Cost of Sales |
89,767 | 88,243 | 90,803 | 102,453 | ||||||||||||
| Gross profit |
93,132 | 94,175 | 99,333 | 112,370 | ||||||||||||
| Operating expenses/(income): |
||||||||||||||||
| Selling, general and administrative expense |
60,732 | 54,994 | 60,354 | 59,852 | ||||||||||||
| Research and development |
11,562 | 11,648 | 11,690 | 11,465 | ||||||||||||
| Provision for doubtful accounts and notes receivable |
88 | 47 | 72 | 64 | ||||||||||||
| Net other operating (income) and restructuring costs |
(2,499 | ) | (3,254 | ) | (3,408 | ) | (2,500 | ) | ||||||||
| Operating income |
23,249 | 30,740 | 30,625 | 43,489 | ||||||||||||
| (Gain)/loss on Foreign currency transactions |
(3,259 | ) | 6,003 | 5,049 | (633 | ) | ||||||||||
| (Gain)/loss on derivative instruments |
(5,965 | ) | 2,598 | (1,712 | ) | (1,023 | ) | |||||||||
| Interest expense, net |
843 | 857 | 4,141 | 5,202 | ||||||||||||
| Other expense/(income) |
1 | (9 | ) | 404 | 380 | |||||||||||
| Income before taxes |
31,629 | 21,291 | 22,743 | 39,563 | ||||||||||||
| Income tax provision |
7,061 | 4,258 | 4,548 | 7,913 | ||||||||||||
| Net income |
24,568 | 17,033 | 18,195 | 31,650 | ||||||||||||
| Less: Net (loss)/income attributable to noncontrolling interests |
(130 | ) | 456 | 656 | 475 | |||||||||||
| Net income attributable to Sirona Dental Systems, Inc. |
$ | 24,698 | $ | 16,577 | $ | 17,539 | $ | 31,175 | ||||||||
| Income per share (attributable to Sirona Dental Systems, Inc. shareholders): |
||||||||||||||||
| Net income per share - basic |
$ | 0.45 | $ | 0.30 | $ | 0.32 | $ | 0.57 | ||||||||
| Net income per share - diluted |
$ | 0.44 | $ | 0.29 | $ | 0.31 | $ | 0.55 | ||||||||
| Weighted average shares - basic |
55,266,337 | 55,227,417 | 55,122,944 | 54,968,399 | ||||||||||||
| Weighted average shares - diluted |
56,677,680 | 56,739,364 | 56,610,111 | 56,356,288 | ||||||||||||
F-38
Table of Contents
SIRONA DENTAL SYSTEMS, INC. AND SUBSIDIARIES
NOTES TO THE CONSOLIDATED FINANCIAL STATEMENTS—(Continued)
| September 30, | June 30, | March 31, | December 31, | |||||||||||||
| 2009 | 2009 | 2009 | 2008 | |||||||||||||
| $’000s (except per share amounts) | ||||||||||||||||
| Revenue |
$ | 188,171 | $ | 180,580 | $ | 164,822 | $ | 179,721 | ||||||||
| Cost of Sales |
96,143 | 93,782 | 84,507 | 92,720 | ||||||||||||
| Gross profit |
92,028 | 86,798 | 80,315 | 87,001 | ||||||||||||
| Operating expenses/(income): |
||||||||||||||||
| Selling, general and administrative expense |
58,444 | 53,437 | 56,048 | 57,422 | ||||||||||||
| Research and development |
9,633 | 9,897 | 10,043 | 11,058 | ||||||||||||
| Provision for doubtful accounts and notes receivable |
(104 | ) | 421 | 221 | 225 | |||||||||||
| Net other operating (income) and restructuring costs |
(617 | ) | (1,881 | ) | 270 | (3,461 | ) | |||||||||
| Operating income |
24,672 | 24,924 | 13,733 | 21,757 | ||||||||||||
| (Gain)/loss on Foreign currency transactions |
(6,806 | ) | (5,111 | ) | 7,077 | 3,592 | ||||||||||
| (Gain)/loss on derivative instruments |
(1,437 | ) | (3,139 | ) | (240 | ) | 4,967 | |||||||||
| Interest expense, net |
5,509 | 5,331 | 5,593 | 6,064 | ||||||||||||
| Other expense |
405 | — | — | — | ||||||||||||
| Income before taxes |
27,001 | 27,843 | 1,303 | 7,134 | ||||||||||||
| Income tax provision |
252 | 6,683 | 364 | 1,998 | ||||||||||||
| Net income |
26,749 | 21,160 | 939 | 5,136 | ||||||||||||
| Less: Net income/(loss) attributable to noncontrolling interests |
16 | 692 | 344 | (423 | ) | |||||||||||
| Net income attributable to Sirona Dental Systems, Inc. |
$ | 26,733 | $ | 20,468 | $ | 595 | $ | 5,559 | ||||||||
| Income per share (attributable to Sirona Dental Systems, Inc. shareholders): |
||||||||||||||||
| Net income per share - basic |
$ | 0.49 | $ | 0.37 | $ | 0.01 | $ | 0.10 | ||||||||
| Net income per share - diluted |
$ | 0.48 | $ | 0.37 | $ | 0.01 | $ | 0.10 | ||||||||
| Weighted average shares - basic |
54,931,032 | 54,878,923 | 54,818,604 | 54,862,708 | ||||||||||||
| Weighted average shares - diluted |
56,104,887 | 55,556,867 | 55,044,094 | 55,130,373 | ||||||||||||
F-39