Attached files
| file | filename |
|---|---|
| 8-K - FORM 8-K - NuStar GP Holdings, LLC | d8k.htm |
 RBC Capital Markets –
2010 MLP Conference
November 18, 2010
Exhibit 99.1 |
 Statements
contained
in
this
presentation
that
state
management’s
expectations
or
predictions
of
the
future
are
forward-looking
statements
intended
to
be
covered
by
the
safe
harbor
provisions
of
the
Securities
Act
of
1933
and
the
Securities
Exchange
Act
of
1934.
The
words
“believe,”
“expect,”
“should,”
“targeting,”
“estimates,”
and
other
similar
expressions
identify
forward-looking
statements.
It
is
important
to
note
that
actual
results
could
differ
materially
from
those
projected
in
such
forward-looking
statements.
We
undertake
no
duty
to
update
any
forward-looking
statement
to
conform
the
statement
to
actual
results
or
changes
in
the
company’s
expectations.
For
more
information
concerning
factors
that
could
cause
actual
results
to
differ
from
those
expressed
or
forecasted,
see
NuStar
Energy
L.P.’s
annual
report
on
Form
10-K
and
quarterly
reports
on
Form
10-
Q,
filed
with
the
Securities
and
Exchange
Commission
and
available
on
NuStar’s
website
at
www.nustarenergy.com.
Forward
Looking
Statements
2 |
 NuStar Overview
3 |
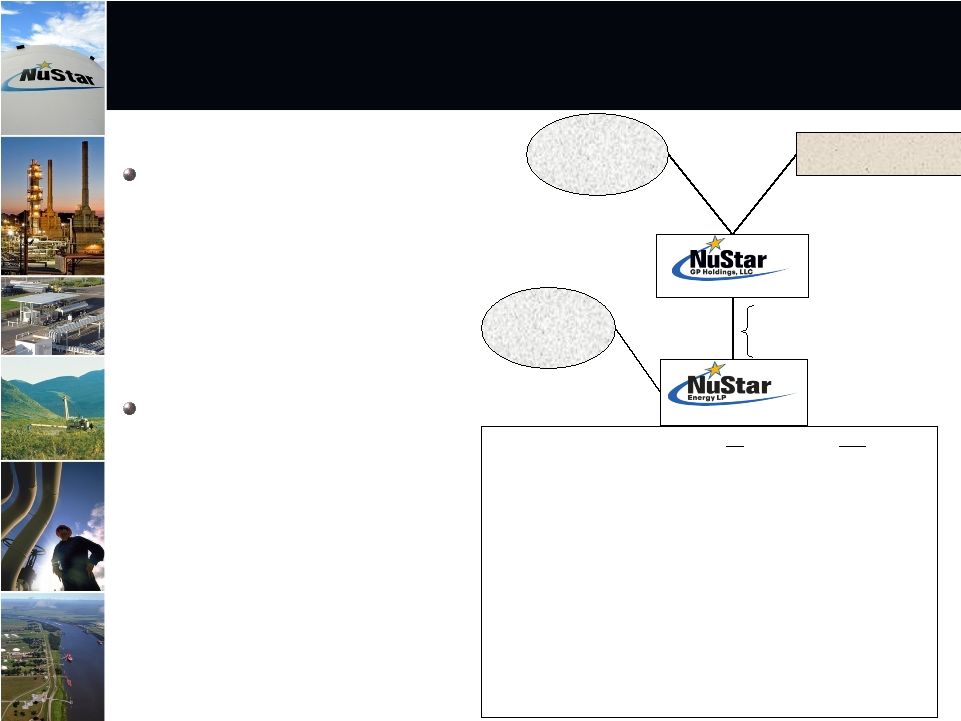 NuStar
Energy L.P. (NYSE: NS) is
a leading publicly traded
partnership with a market
capitalization of around $4.4 billion
and an enterprise value of
approximately $6.3 billion
NuStar
GP Holdings, LLC (NYSE:
NSH) holds the 2% general
partner interest, incentive
distribution rights and 15.6% of the
common units in NuStar
Energy
L.P. with a market capitalization of
around $1.5 billion
Two Publicly Traded Companies
NS
NSH
IPO Date:
4/16/2001
7/19/2006
Unit Price (11/11/10):
$67.71
$35.63
Annual Distribution/Unit:
$4.30
$1.92
Yield (11/11/10):
6.35%
5.39%
Debt Balance (9/30/10)
$1,991 million
$19.5 million
Market Capitalization: (9/30/10)
$4,375 million
$1,516 million
Enterprise Value (9/30/10)
$6,279 million
$1,528 million
Total Assets (9/30/10)
$5,191 million
$618 million
Debt/Cap. (9/30/10)
42.5%
n/a
Credit Ratings –
Moody’s
Baa3/Stable
n/a
S&P and Fitch
BBB-/Stable
n/a
83.1%
Membership Interest
82.4%
L.P. Interest
Public Unitholders
35.4 Million NSH Units
Public Unitholders
54.3 Million NS Units
16.9%
Membership
Interest
2.0% G.P. Interest
15.6% L.P. Interest
Incentive Distribution Rights
William E. Greehey
7.2 Million NSH Units
NYSE: NSH
NYSE: NS
4 |
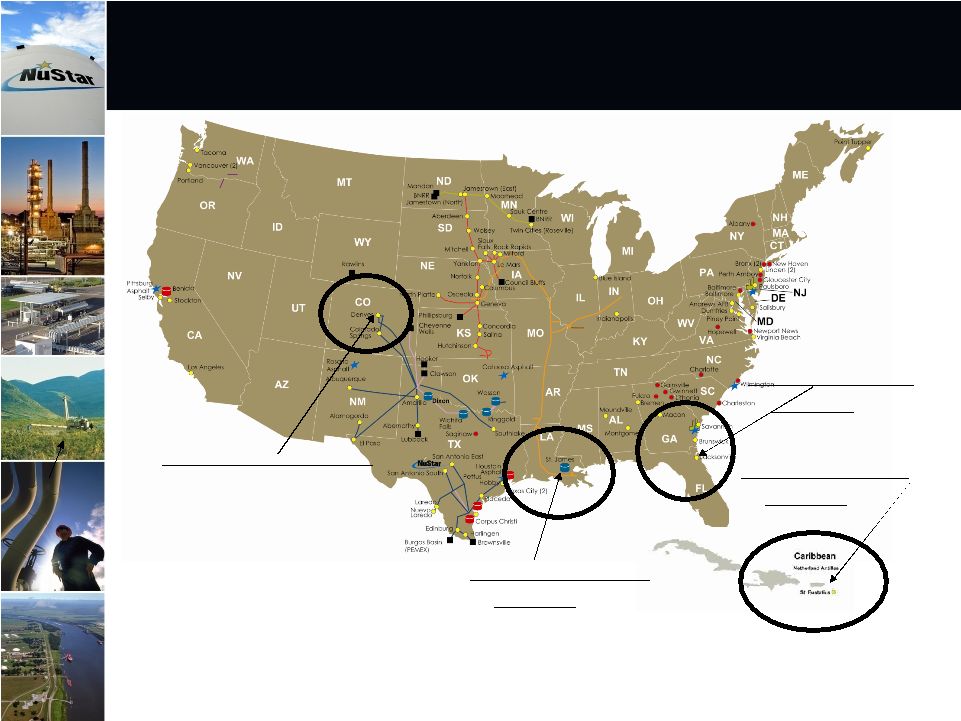
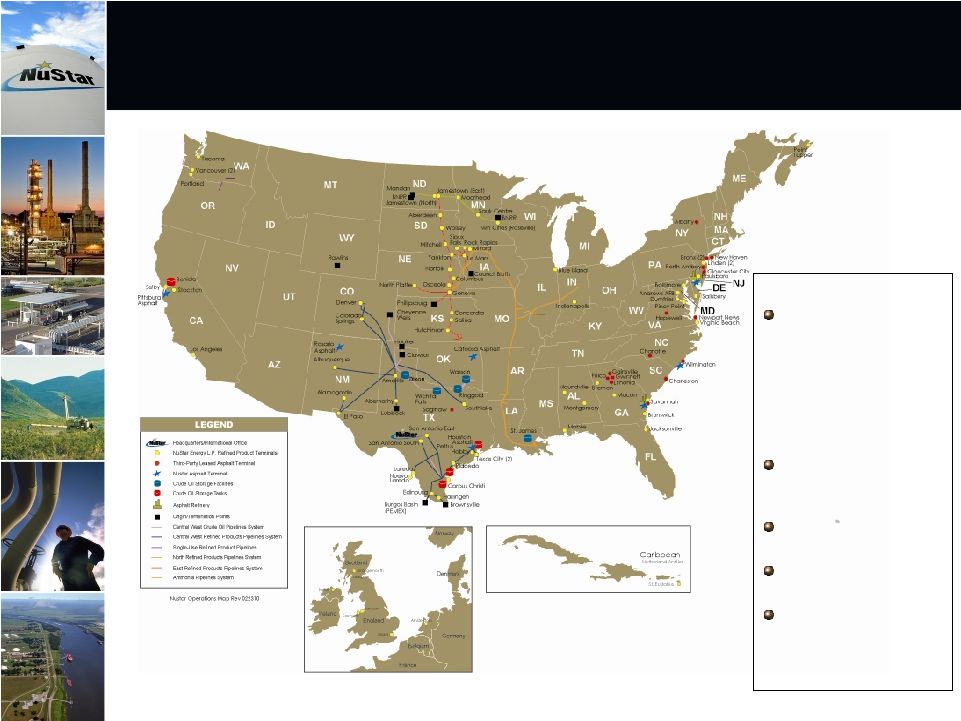 Large
and Diverse Geographic Footprint
with Assets in Key Locations
Asset Stats:
Operations in eight
different countries
including the U.S.,
Mexico, Netherlands,
Netherlands Antilles (i.e.
Caribbean), England,
Ireland, Scotland and
Canada
8,417 miles of crude oil
and refined product
pipelines
Own 88 terminal and
storage facilities
Over 93 million barrels of
storage capacity
2 asphalt refineries on
the U.S. East Coast
capable of processing
104,000 bpd of crude oil
5 |
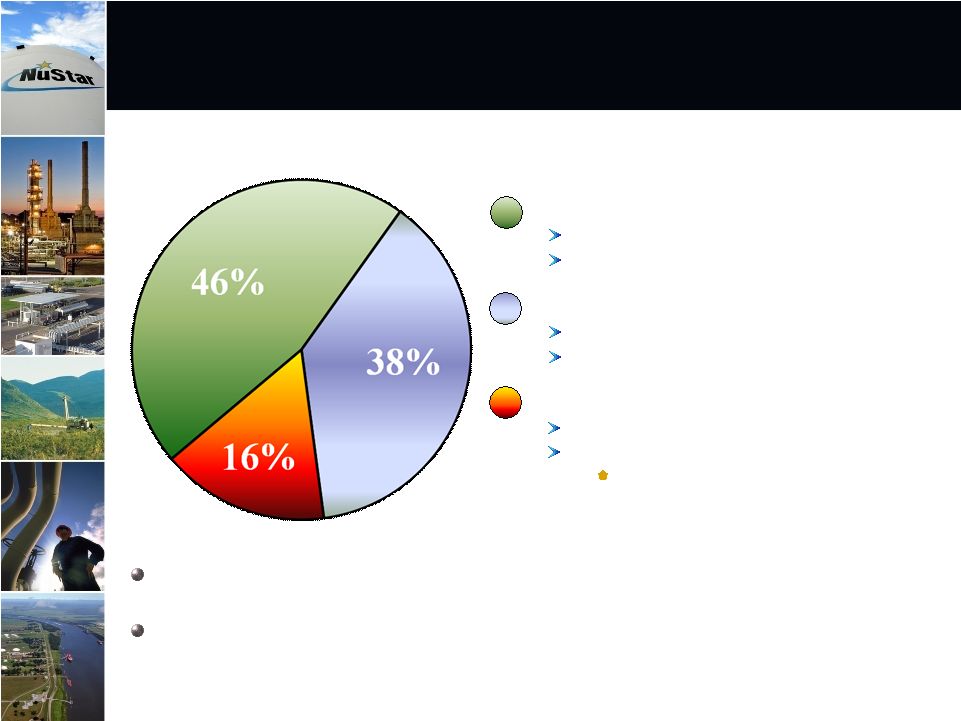 Percentage of 2009
Segment Operating Income
Approximately 84% of NuStar Energy’s segment operating income in 2009 came
from fee-based transportation and storage segments
Remainder of 2009 segment operating income related to margin-based asphalt
and fuels marketing segment
Storage: 46%
Transportation: 38%
Refined Product Terminals
Crude Oil Storage
Refined Product Pipelines*
Crude Oil Pipelines
Asphalt & Fuels Marketing: 16%
Asphalt
Fuels Marketing
Product Supply, Wholesale, Fuel Oil
Marketing and Bunkering
Diversified Operations from Three
Business Segments
* Includes primarily distillates, gasoline, propane, jet fuel, ammonia and
other light products. Does not include natural gas. 6
|
 Organic Growth in
Refined Product Infrastructure
7 |
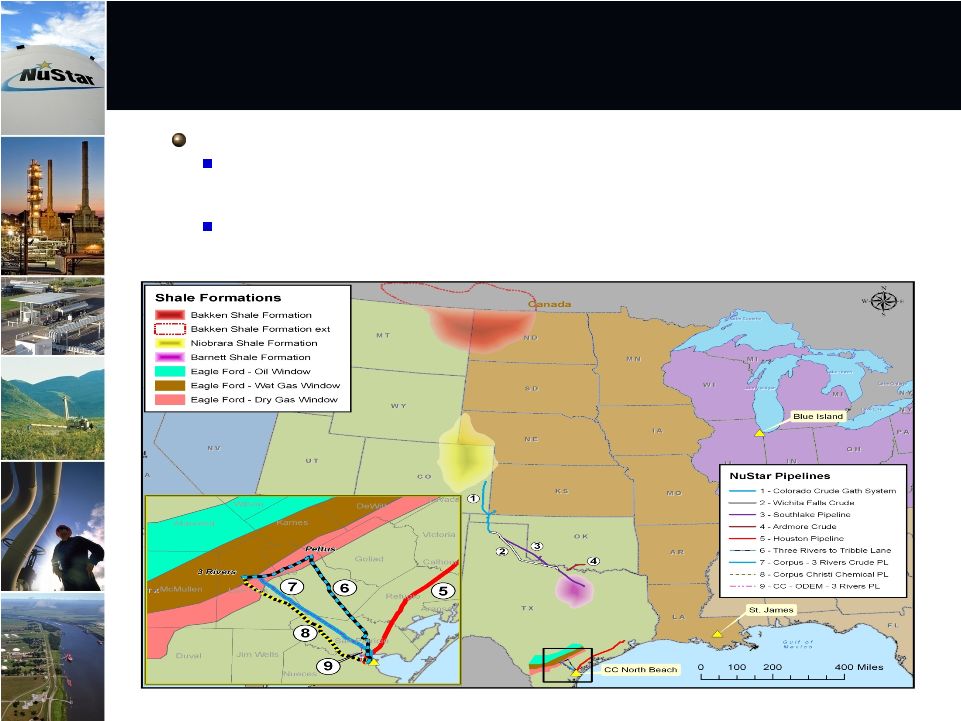 Transportation Segment Assets in close
proximity to key Shale Formations
Transportation Segment Assets in close
proximity to key Shale Formations
Shale Development Strategy
There are four key shale developments located in NuStar’s Mid-Continent and
Gulf Coast regions, including the Bakken, Niobrara, Barnett, and Eagle Ford
developments
Our strategy is to optimize and grow the existing asset base, and maximize the
value of the assets located in or near shale developments
8 |
 Recently announced agreement with
Koch Pipeline first NuStar project in
Eagle Ford Shale
Companies agreed to a pipeline connection and capacity lease agreement
Allows NuStar to reactivate a 60 mile pipeline that has been idle since
November 2005
Project connects our existing Pettus, Texas to Corpus Christi pipeline
segment to Koch’s existing pipeline
Initial capacity agreement for 30 thousand BPD, could grow to 50
thousand BPD
Project cost $5 to $10 million
Expected in-service date mid-2011
9 |
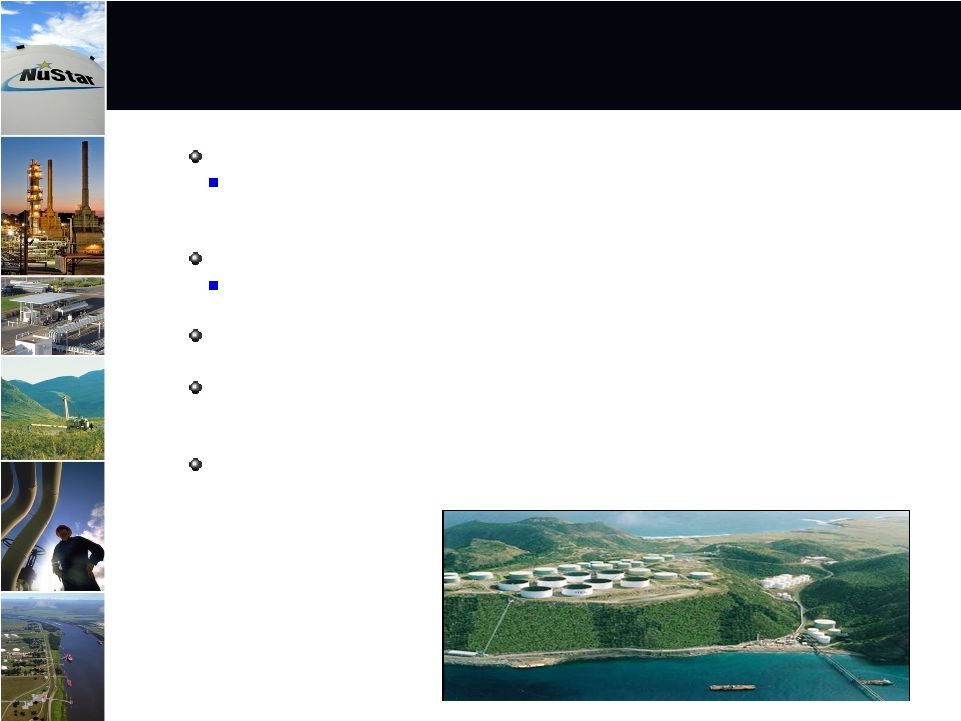
 Plan
to continue to optimize and grow our existing storage asset base
St. James, LA. Terminal
Expansion
St. Eustatius Terminal
Expansion
Denver Terminal Expansion
Jacksonville Terminal
Expansion
10 |
 St.
James, Louisiana terminal expansion expected to occur in two phases
Phase 1 –
Third-Party Crude Oil Storage
Construct
3.1
million
barrels
of
crude
oil
storage
Projected
CAPEX
of
$110
to
$130
million,
with
projected
average
annual
EBITDA
of
$15
to
$25
million
Expected
in-service
August
2011
through
January
2012
Phase 2 –
Third-Party Crude Oil Storage
Project in early planning stages
Should be similar in size to Phase 1 project
Could grow in size based on customer demand
Expected in-service in 2013
11 |
 St.
Eustatius project planned to convert existing tanks and construct new tanks
for distillate service
Conversion Project
Convert 600,000 barrels of storage from fuel oil to distillate service
to capture higher storage fees
Expansion Project
Construct 900,000 barrels of new storage for distillate service
Interested customers include several national oil companies
Combined conversion and expansion projected CAPEX of $40 to $50
million, with projected average annual EBITDA of $5 to $10 million
Expected in-service by February 2012 (Conversion Project) and
September 2012 (Expansion Project)
12 |
 Jacksonville expansion constructs new tankage
…Denver expansion constructs new loading rack
Jacksonville Storage Expansion
Construct 500,000 barrels of clean products storage
to support a major refiner’s expansion
Projected CAPEX of $20 to $30 million, with projected
average annual EBITDA of $5 to 10 million
Expected in-service by March 2012
Denver Terminal Expansion
Construct a new truck loading rack to serve a Denver
refiner’s refined product output and attract
incremental volumes from other new customers
Projected CAPEX of $10 to $15 million, with projected
average annual EBITDA of $1 to $5 million
Expected in-service by January 2012
13 |
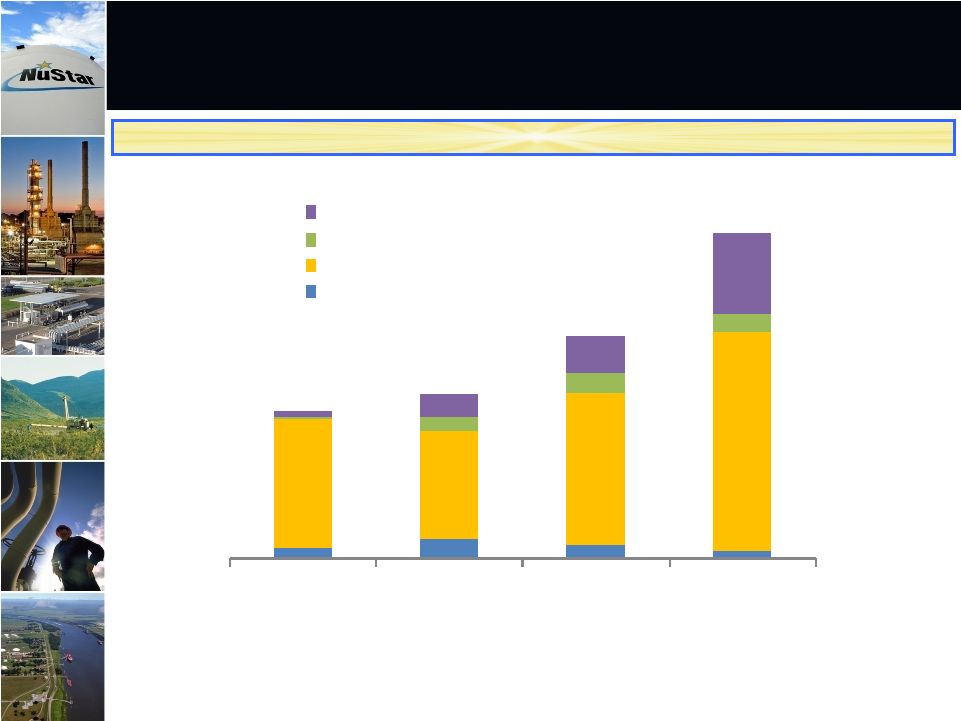 Majority
of
2011
Internal
Growth
Capital
Will
to
be
spent
in
the
Storage
Segment
14
(
Dollars in Millions)
Annual Internal Growth Spending By Business Segment
$11
$20
$13
$8
$128
$107
$153
$218
$3
$14
$20
$19
$36
$80
2008 Actual
2009 Actual
2010 Forecast
2011 Forecast
Corporate
Asphalt & Fuels Marketing
Storage
Transportation
$146
$164
$325
$222
$4
$23 |
 Acquisition Growth in
Refined Product Infrastructure
15 |
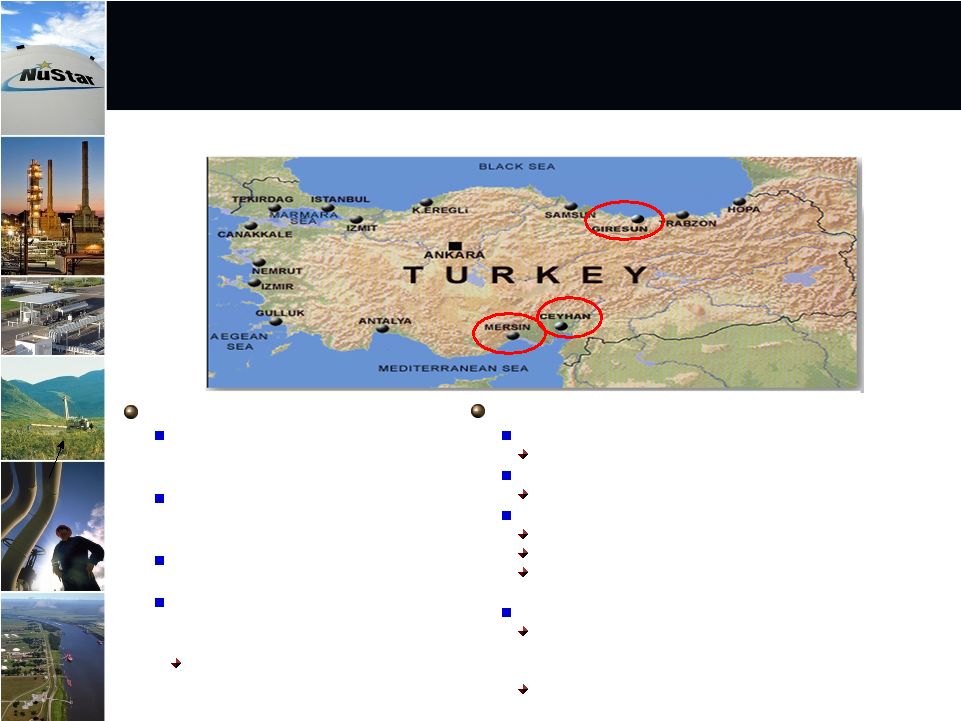 Joint Venture (JV) Overview
NuStar entered into a $50-$60 million
JV agreement with S-Oil and Aves
Oil, two Turkish companies
The JV should own 100% of two
terminals in Mersin and land in
Giresun and Ceyhan
NuStar should own 75% of the JV
and operate the terminals
Both terminals connect via pipeline
to an offshore platform (SAVKA) 5
km off the Turkish coastline
The JV should own 67% of SAVKA
Upon Projected December Closing, Acquired Assets
in Turkey Provide Platform for Internal Growth
Growth Opportunities
Expansion project under development at Mersin
Expands existing storage by about 70 percent
Potential to tie into NATO Pipeline
Provides access to markets for military fuels
New terminal at Giresun
37-acre site with access to Black Sea ports
200,000 barrel fuel oil terminal under development
Second phase build-out to 1.9 million barrels under
evaluation
New terminal at Ceyhan
Ceyhan is the destination for pipelines delivering
crude from northern Iraq and the Caspian area to
the Mediterranean
173 acre property is well-suited for building up to
6.3 million barrels of storage and marine jetty
16 |
 |
 Reconciliation of Non-GAAP Financial Information
Internal Growth Program
18
(Unaudited, Dollars in Thousands)
St. James, LA
Terminal
Expansion Phase 1
St. Eustatius
Distillate Project
Jacksonville
Storage Expansion
Denver Terminal
Expansion
Projected annual operating income range
$ 11,000 - 20,000
$ 4,000 - 8,000
$ 4,500 - 9,000
$ 500 - 4,000
Plus projected annual depreciation and
amortization expense range
4,000 - 5,000
1,000 - 2,000
500 - 1,000
500 - 1,000
Projected annual adjusted EBITDA range
$ 15,000 - 25,000
$ 5,000 - 10,000
$ 5,000 - 10,000
$ 1,000 - 5,000
EBITDA
in
the
following
reconciliations
relate
to
our
reportable
segments
or
a
portion
of
a
reportable
segment.
We
do
not
allocate
general
and
administrative
expenses
to
our
reportable
segments
because
those
expenses
relate
primarily
to
the
overall
management
at
the
entity
level.
Therefore,
EBITDA
reflected
in
the
following
reconciliations
excludes
any
allocation
of
general
and
administrative
expenses
consistent
with
our
policy
for
determining
segmental
operating
income,
the
most
directly
comparable
GAAP
measure.
EBITDA
should
not
be
considered
in
isolation
or
as
a
substitute
for
a
measure
of
performance
prepared
in accordance with GAAP.
The
following
is
a
reconciliation
of
projected
annual
operating
income
to
projected
annual
adjusted
EBITDA
for
certain
projects
in
our
storage
segment
related to our internal growth program: |