Attached files
| file | filename |
|---|---|
| 8-K - FORM 8-K - SPARTON CORP | d8k.htm |
| EX-99.1 - SCRIPT FOR CONFERENCE CALL - SPARTON CORP | dex991.htm |
 Fiscal
2011
1
st
Quarter
Financial
Results Conference Call
NYSE: SPA
November 2010
Exhibit 99.2 |
 2
Certain
statements
herein
constitute
forward-looking
statements
within
the
meaning
of
the
Securities
Act
of
1933,
as
amended
and
the
Securities
Exchange
Act
of
1934,
as
amended.
When
used
herein,
words
such
as
“believe,”
“expect,”
“anticipate,”
“project,”
“plan,”
“estimate,”
“will”
or
“intend”
and
similar
words
or
expressions
as
they
relate
to
the
Company
or
its
management
constitute
forward-
looking
statements.
These
forward-looking
statements
reflect
our
current
views
with
respect
to
future
events
and
are
based
on
currently
available
financial,
economic
and
competitive
data
and
our
current
business
plans.
The
Company
is
under
no
obligation
to,
and
expressly
disclaims
any
obligation
to,
update
or
alter
its
forward-
looking
statements
whether
as
a
result
of
such
changes,
new
information,
subsequent
events
or
otherwise.
Actual
results
could
vary
materially
depending
on
risks
and
uncertainties
that
may
affect
our
operations,
markets,
prices
and
other
factors.
Important
factors
that
could
cause
actual
results
to
differ
materially
from
those
forward-looking
statements
include
those
contained
under
the
heading
of
risk
factors
and
in
the
management’s
discussion
and
analysis
contained
from
time-to-
time
in
the
Company’s
filings
with
the
Securities
and
Exchange
Commission.
Safe Harbor Statement
Safe Harbor Statement |
 3
•
Fiscal 2011 1
st
Quarter Consolidated Results
•
1
st
Quarter Segmented Operating Results
•
SMS Colorado 1
st
Quarter Financial Results
•
Liquidity & Capital Resources
•
Corporate Governance
•
Outlook
•
Q & A
Today’s Agenda
Today’s Agenda |
 4
1
st
Quarter Consolidated Financial Results
($ in 000’s, except per share)
2010
2009
Net Sales
$ 45,767
$ 48,104
Gross Profit
7,026
7,372
Gross Margin
15.4%
15.3%
Restructuring / Impairment Charges
77
876
Gain On Acquisition
2,400
-
Operating Income
4,104
1,609
Operating Margin
9.0%
3.3%
Income Tax Expense (Benefit)
(14)
34
Net Income
$ 4,080
$ 1,405
Net Profit Margin
8.9%
2.9%
Earnings per share, basic and diluted
0.40
$
0.14
$
Quarter ending Sept 30 |
 5
1
st
Quarter Consolidated Financial Results
($ in 000’s, except per share)
2010
2009
Net Sales
$ 45,767
$ 48,104
Gross Profit
7,026
7,372
Gross Margin
15.4%
15.3%
Restructuring / Impairment Charges
77
876
Gain On Acquisition
2,400
-
Operating Income
4,104
1,609
Operating Margin
9.0%
3.3%
Income Tax Expense (Benefit)
(14)
34
Net Income
$ 4,080
$ 1,405
Net Profit Margin
8.9%
2.9%
Earnings per share, basic and diluted
0.40
$
0.14
$
Quarter ending Sept 30 |
 6
1
st
Quarter Consolidated Financial Results
($ in 000’s, except per share)
2010
2009
Net Sales
$ 45,767
$ 48,104
Gross Profit
7,026
7,372
Gross Margin
15.4%
15.3%
Restructuring / Impairment Charges
77
876
Gain On Acquisition
2,400
-
Operating Income
4,104
1,609
Operating Margin
9.0%
3.3%
Income Tax Expense (Benefit)
(14)
34
Net Income
$ 4,080
$ 1,405
Net Profit Margin
8.9%
2.9%
Earnings per share, basic and diluted
0.40
$
0.14
$
Quarter ending Sept 30 |
 7
SMS Colorado 1
st
Quarter Financial Results
($ in 000’s, except per share)
2009
Pre
Acquisition
Post
Acquisition
Colorado
Pro Forma
Colorado
Pro Forma
Net Sales
$ 3,451
$
5,940 $ 9,391
$ 9,558
Gross Profit
85
557
642
99
Gross Margin
2.5%
9.4%
6.8%
1.0%
Gain on Acquisition
-
2,400
2,400
-
Operating Income (Loss)
(85)
2,381
2,296
(499)
Operating Margin
-2.5%
40.1%
24.4%
-5.2%
Net Income (Loss)
$
(77)
$ 2,419
$ 2,342
$ (474)
Net Profit Margin
-2.2%
40.7%
24.9%
-5.0%
2010
For the 3 Months Ended Sept 30, |
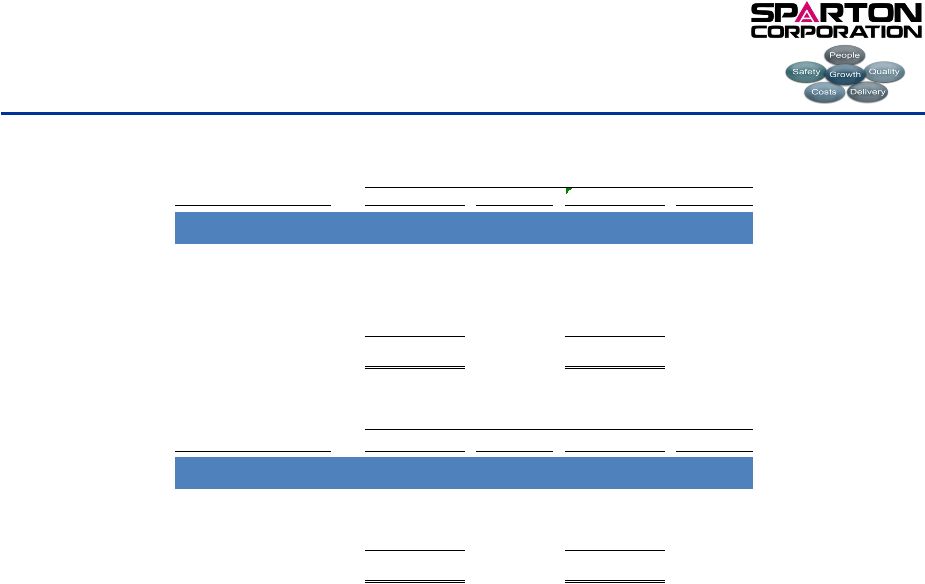 8
Medical Operating Results
Medical Operating Results
SEGMENT
2010
% of Total
2009
% Change
Medical
$ 19,045
42%
$ 19,556
-3%
EMS
12,328
27%
17,603
-30%
DSS
17,597
38%
13,345
32%
Eliminations
(3,203)
-7%
(2,400)
33%
Totals
$ 45,767
100%
$ 48,104
-5%
SEGMENT
2010
GP %
2009
GP %
Medical
$ 1,867
9.8%
$ 2,934
15.0%
EMS
907
7.4%
1,018
5.8%
DSS
4,252
24.2%
3,420
25.6%
Totals
$ 7,026
15.4%
$ 7,372
15.3%
($ in 000’s, except per share)
1st Quarter Sales
1st Quarter Gross Profit |
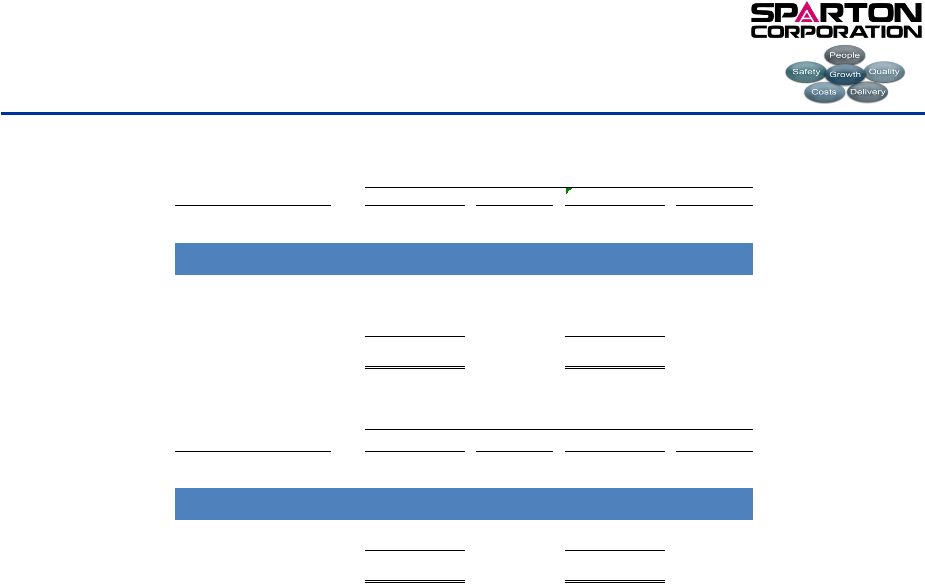 9
EMS Operating Results
EMS Operating Results
SEGMENT
2010
% of Total
2009
% Change
Medical
$ 19,045
42%
$ 19,556
-3%
EMS
12,328
27%
17,603
-30%
DSS
17,597
38%
13,345
32%
Eliminations
(3,203)
-7%
(2,400)
33%
Totals
$ 45,767
100%
$ 48,104
-5%
SEGMENT
2010
GP %
2009
GP %
Medical
$ 1,867
9.8%
$ 2,934
15.0%
EMS
907
7.4%
1,018
5.8%
DSS
4,252
24.2%
3,420
25.6%
Totals
$ 7,026
15.4%
$ 7,372
15.3%
($ in 000’s, except per share)
1st Quarter Sales
1st Quarter Gross Profit |
 10
DSS Operating Results
DSS Operating Results
SEGMENT
2010
% of Total
2009
% Change
Medical
$ 19,045
42%
$ 19,556
-3%
EMS
12,328
27%
17,603
-30%
DSS
17,597
38%
13,345
32%
Eliminations
(3,203)
-7%
(2,400)
33%
Totals
$ 45,767
100%
$ 48,104
-5%
SEGMENT
2010
GP %
2009
GP %
Medical
$ 1,867
9.8%
$ 2,934
15.0%
EMS
907
7.4%
1,018
5.8%
DSS
4,252
24.2%
3,420
25.6%
Totals
$ 7,026
15.4%
$ 7,372
15.3%
($ in 000’s, except per share)
1st Quarter Sales
1st Quarter Gross Profit |
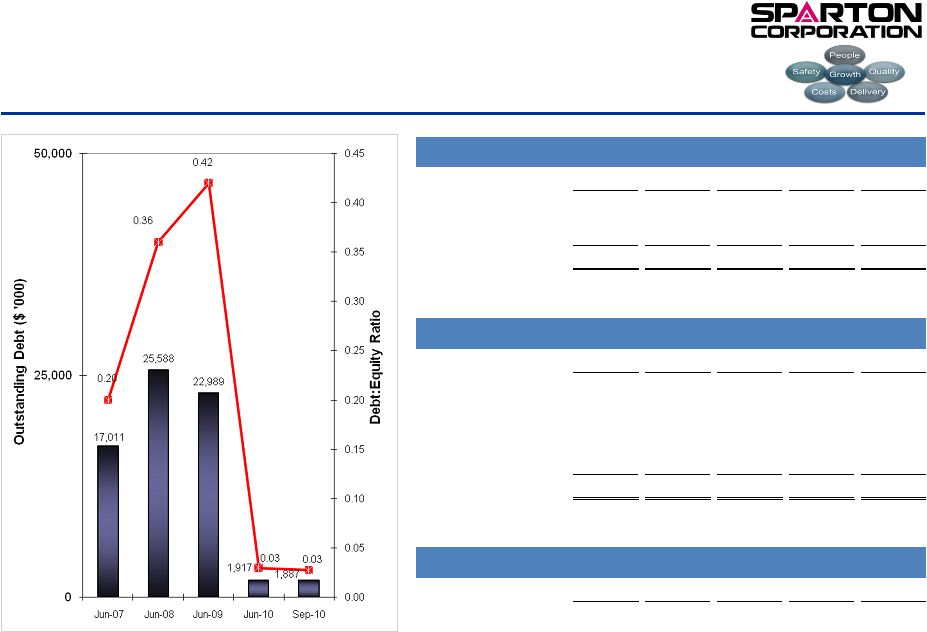 11
Liquidity & Capital Resources
Liquidity & Capital Resources
($ in '000)
Sep-09
Dec-09
Mar-10
Jun-10
Sep-10
Cash and equivalents
20,718
12,012
16,144
30,589
27,281
LOC Availability
3,990
15,461
15,868
16,897
17,769
Total
24,708
27,473
32,012
47,486
45,050
($ in '000)
Sep-09
Dec-09
Mar-10
Jun-10
Sep-10
Credit Revolver
-
-
-
-
-
Long Bank Term Debt
-
-
-
-
-
Former Astro Owners
2,031
1,029
1,029
-
-
IRB (Ohio)
2,000
1,973
1,945
1,917
1,887
Total
4,031
3,002
2,974
1,917
1,887
($ in '000)
Sep-09
Dec-09
Mar-10
Jun-10
Sep-10
Net Inventory
35,454
31,888
28,808
26,514
36,629
Cash Availability
Debt
Inventory |
 12
•
Board size reduced from 11 to 9 (8 independent, 1 non-independent) at the
2009 Annual Meeting of Shareholders
•
Updated the Articles of Incorporation and Code of Regulations
•
Revised and updated new charters for the Executive, Governance,
Compensation, and Audit Committees
•
Introduced and received approval to declassifying the board with
all directors
requiring a majority vote threshold in order to be elected at each uncontested
annual meeting
•
Introduced a proposal providing shareholders with an advisory
“say-on-pay” vote on named executive officer
compensation •
Implemented a Short Term Incentive Plan based on annual performance
objectives and a Long Tem Incentive Plan based on long term financial
metrics in alignment with the interests of the shareholders
•
Continued oversight related to the Company’s financial reporting process,
internal controls, risk management, and legal and regulatory requirements
Corporate Governance
Corporate Governance |
 13
•
Focus on sustained profitability
–
Continue margin improvements in EMS
–
Further improvements in operating performance through lean and quality
efforts •
Implement the strategic growth plan
–
Anticipate modest organic revenue growth
–
Enhance the Business Development organization
–
Develop and launch a new marketing strategy
–
Invest in new product development
•
Delphi Medical Systems to be accretive no later than Q3
•
Continue to look at complementary and compatible acquisitions
Outlook
Outlook |
 14
Q & A
Q & A |