Attached files
| file | filename |
|---|---|
| 8-K - 8-K - CF Industries Holdings, Inc. | a10-21407_18k.htm |
Exhibit 99.1
|
|
Corporate Development Supply Chain Sales Finance Legal Operations Human Resources Dv Sc Sa Fi Le Op Hr CF Industries NYSE: CF Dahlman Rose Global Metals, Mining & Materials Conference November 17, 2010 |
|
|
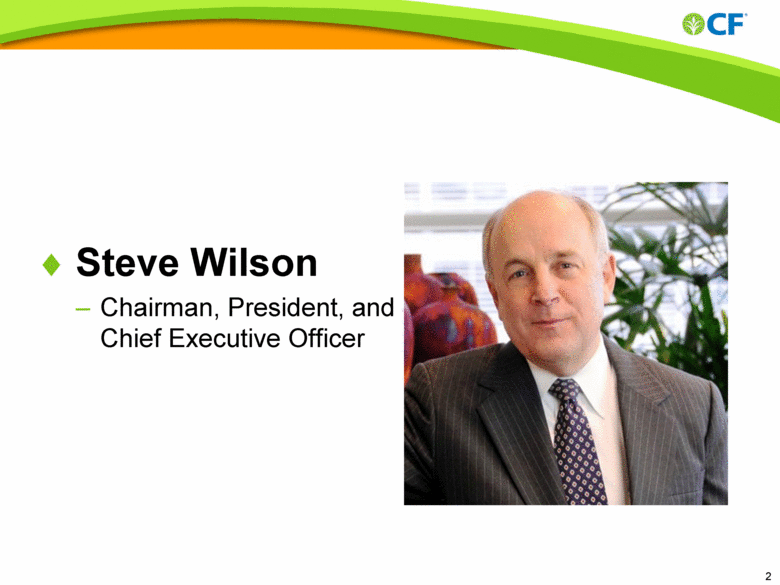
Steve Wilson Chairman, President, and Chief Executive Officer 2 |
|
|
Certain statements contained in this communication may constitute "forward-looking statements." All statements in this communication, other than those relating to historical information or current condition, are forward-looking statements. These forward-looking statements are subject to a number of risks and uncertainties, many of which are beyond our control, which could cause actual results to differ materially from such statements. Important factors that could cause actual results to differ materially from our expectations include, among others: our ability to integrate the businesses of CF Industries and Terra promptly and effectively and to achieve the cost savings and synergies we anticipate from the Terra acquisition within the expected time frame or at all; the potential for disruption from the Terra acquisition to make it more difficult for us to maintain relationships with customers, employees or suppliers; the volatile cost of natural gas in the areas where our production facilities are principally located; the cyclical nature of our business and the agricultural sector; the global commodity nature of our fertilizer products, the impact of global supply and demand on our selling prices, and the intense global competition in the consolidating markets in which we operate; conditions in the U.S. agricultural industry; weather conditions; our inability to accurately predict seasonal demand for our products; the concentration of our sales with certain large customers; the impact of changing market conditions on our FPP; risks involving derivatives and the effectiveness of our risk measurement and hedging activities; the reliance of our operations on a limited number of key facilities and the significant risks and hazards against which we may not be fully insured; reliance on third party transportation providers; risks associated with joint ventures; risks associated with expansion of our business, including unanticipated adverse consequences and the significant resources that could be required; potential liabilities and expenditures related to environmental and health and safety laws and regulations; our potential inability to obtain or maintain required permits and governmental approvals or to meet financial assurance requirements; future regulatory restrictions and requirements related to GHG emissions, climate change or other environmental requirements; acts of terrorism and regulations to combat terrorism; difficulties in securing the supply and delivery of raw materials we use and increases in their costs; risks associated with international operations; losses on our investments in securities; deterioration of global market and economic conditions; our substantial indebtedness and the limitations on our operations imposed by the terms of our indebtedness; our ability to comply with the covenants under our indebtedness and to make payments under such indebtedness when due; potential inability to refinance our indebtedness in connection with any change of control affecting us; and loss of key members of management and professional staff. Forward-looking statements are given only as of the date of this release and we disclaim any obligation to update or revise the forward-looking statements, whether as a result of new information, future events or otherwise, except as required by law. Safe Harbor Statement 3 |
|
|
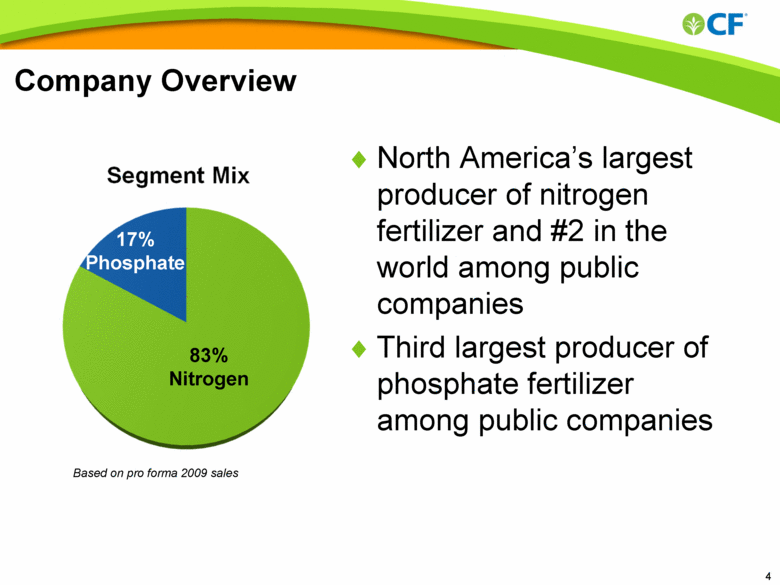
Company Overview North America’s largest producer of nitrogen fertilizer and #2 in the world among public companies Third largest producer of phosphate fertilizer among public companies 83% Nitrogen 17% Phosphate Based on pro forma 2009 sales 4 |
|
|
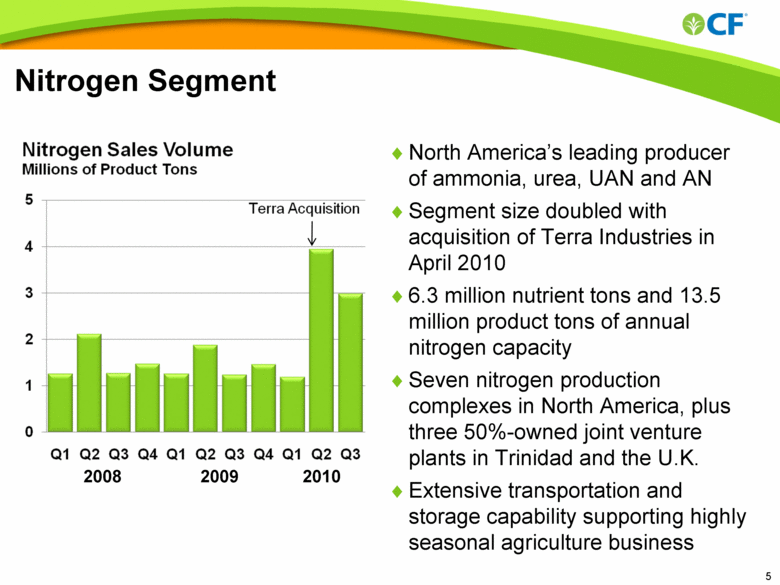
Nitrogen Segment North America’s leading producer of ammonia, urea, UAN and AN Segment size doubled with acquisition of Terra Industries in April 2010 6.3 million nutrient tons and 13.5 million product tons of annual nitrogen capacity Seven nitrogen production complexes in North America, plus three 50%-owned joint venture plants in Trinidad and the U.K. Extensive transportation and storage capability supporting highly seasonal agriculture business 2008 2009 2010 5 |
|
|
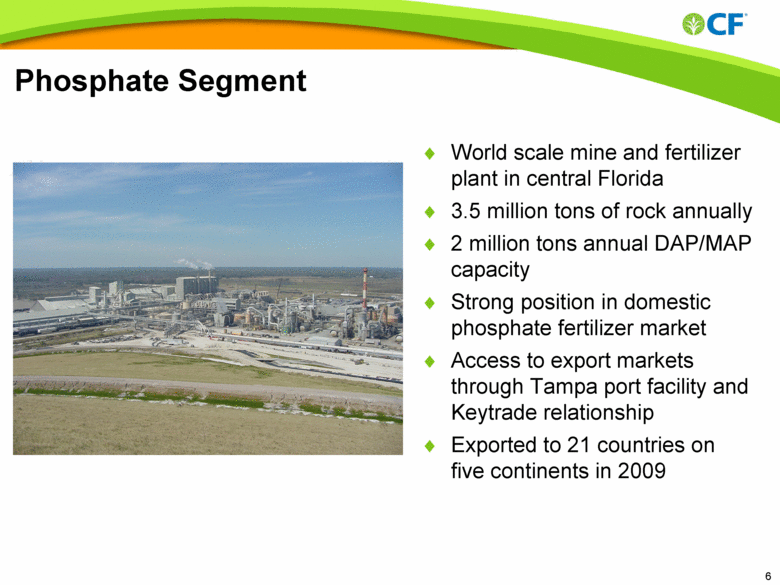
Phosphate Segment World scale mine and fertilizer plant in central Florida 3.5 million tons of rock annually 2 million tons annual DAP/MAP capacity Strong position in domestic phosphate fertilizer market Access to export markets through Tampa port facility and Keytrade relationship Exported to 21 countries on five continents in 2009 6 |
|
|
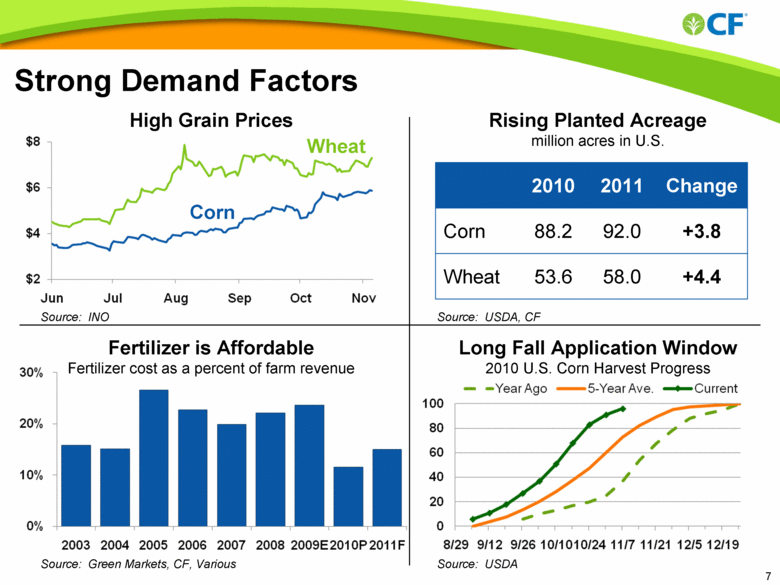
Strong Demand Factors 2010 2011 Change Corn 88.2 92.0 +3.8 Wheat 53.6 58.0 +4.4 Rising Planted Acreage million acres in U.S. Corn Wheat High Grain Prices Fertilizer is Affordable Fertilizer cost as a percent of farm revenue Long Fall Application Window 2010 U.S. Corn Harvest Progress Source: INO Source: USDA, CF Source: Green Markets, CF, Various Source: USDA 7 |
|
|
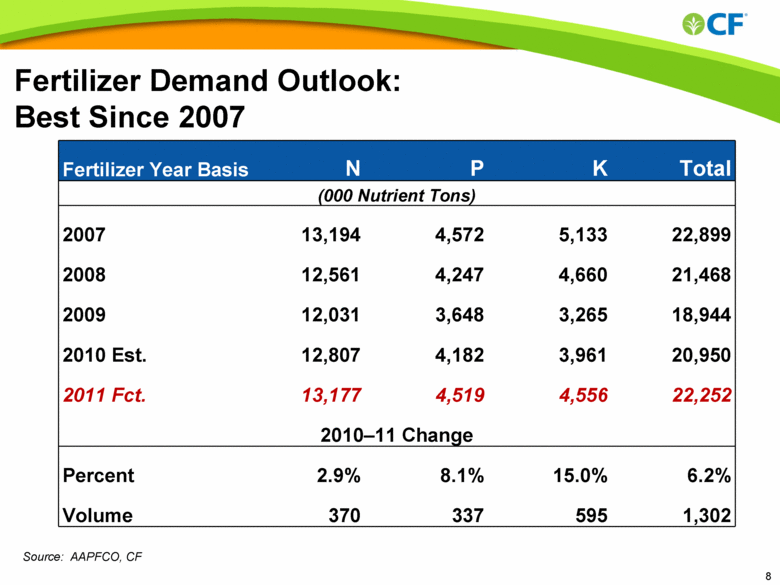
Source: AAPFCO, CF Fertilizer Demand Outlook: Best Since 2007 Fertilizer Year Basis N P K Total (000 Nutrient Tons) 2007 13,194 4,572 5,133 22,899 2008 12,561 4,247 4,660 21,468 2009 12,031 3,648 3,265 18,944 2010 Est. 12,807 4,182 3,961 20,950 2011 Fct. 13,177 4,519 4,556 22,252 2010–11 Change Percent 2.9% 8.1% 15.0% 6.2% Volume 370 337 595 1,302 8 |
|
|
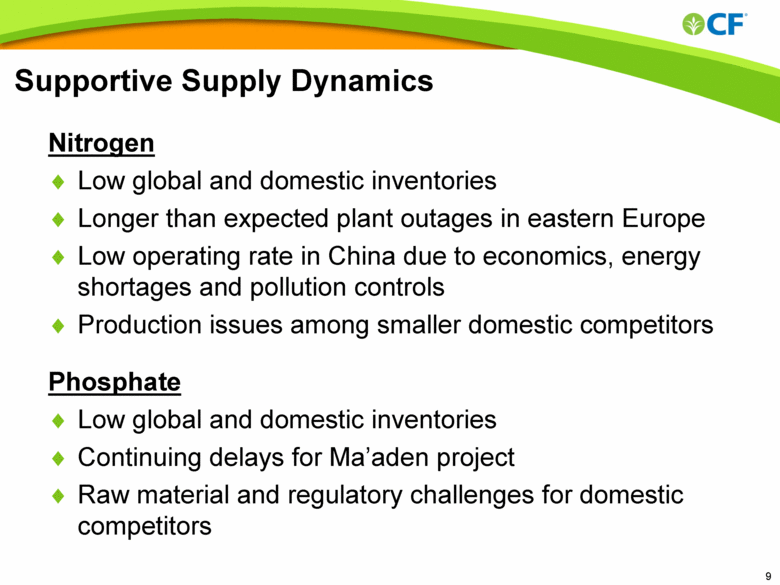
Supportive Supply Dynamics Nitrogen Low global and domestic inventories Longer than expected plant outages in eastern Europe Low operating rate in China due to economics, energy shortages and pollution controls Production issues among smaller domestic competitors Phosphate Low global and domestic inventories Continuing delays for Ma’aden project Raw material and regulatory challenges for domestic competitors 9 |
|
|
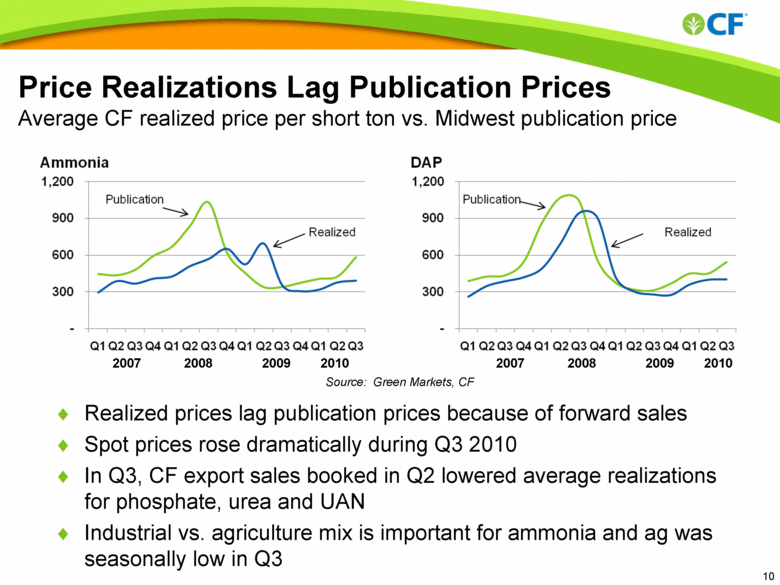
Price Realizations Lag Publication Prices Average CF realized price per short ton vs. Midwest publication price 2007 2010 2009 2008 2007 2010 2009 2008 Realized prices lag publication prices because of forward sales Spot prices rose dramatically during Q3 2010 In Q3, CF export sales booked in Q2 lowered average realizations for phosphate, urea and UAN Industrial vs. agriculture mix is important for ammonia and ag was seasonally low in Q3 Source: Green Markets, CF 10 |
|
|
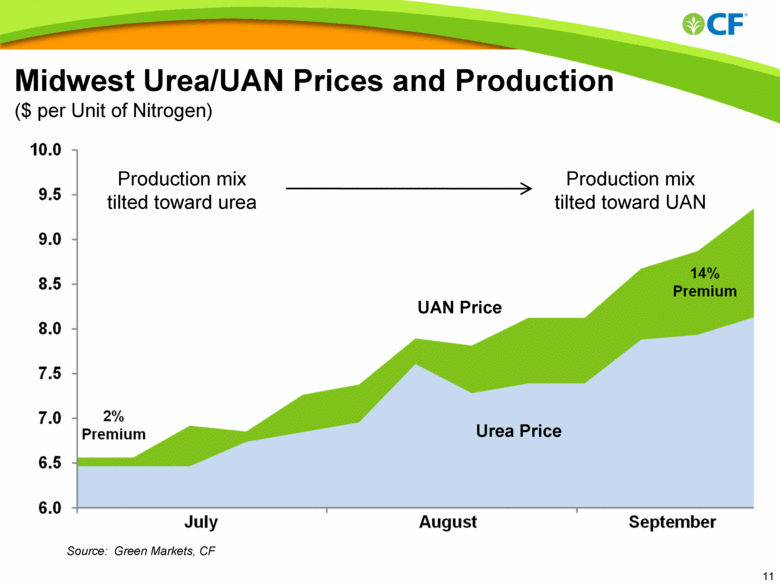
Midwest Urea/UAN Prices and Production ($ per Unit of Nitrogen) Production mix tilted toward urea Production mix tilted toward UAN Urea Price UAN Price Source: Green Markets, CF 11 |
|
|
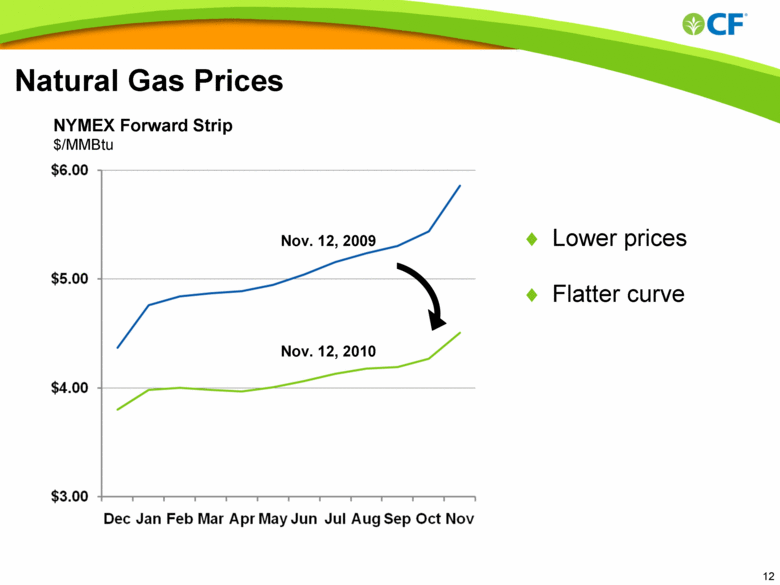
Natural Gas Prices NYMEX Forward Strip $/MMBtu Nov. 12, 2009 Nov. 12, 2010 Lower prices Flatter curve |
|
|
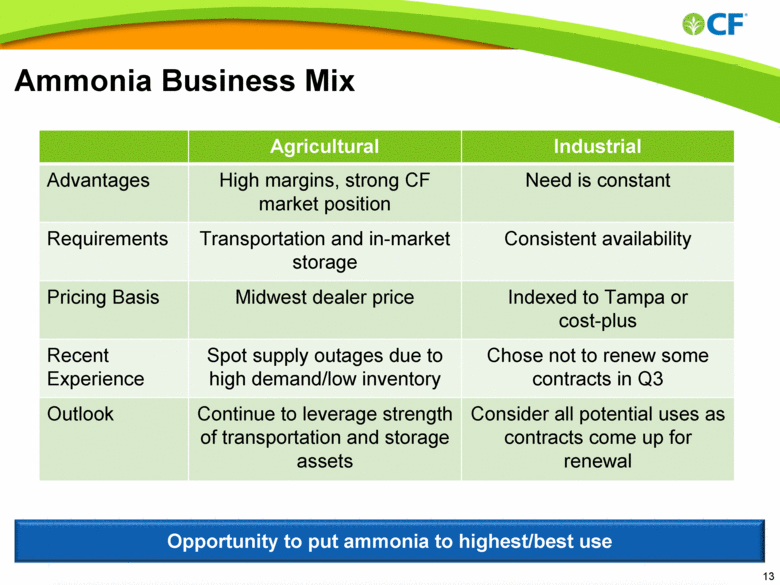
Ammonia Business Mix Agricultural Industrial Advantages High margins, strong CF market position Need is constant Requirements Transportation and in-market storage Consistent availability Pricing Basis Midwest dealer price Indexed to Tampa or cost-plus Recent Experience Spot supply outages due to high demand/low inventory Chose not to renew some contracts in Q3 Outlook Continue to leverage strength of transportation and storage assets Consider all potential uses as contracts come up for renewal Opportunity to put ammonia to highest/best use 13 |
|
|
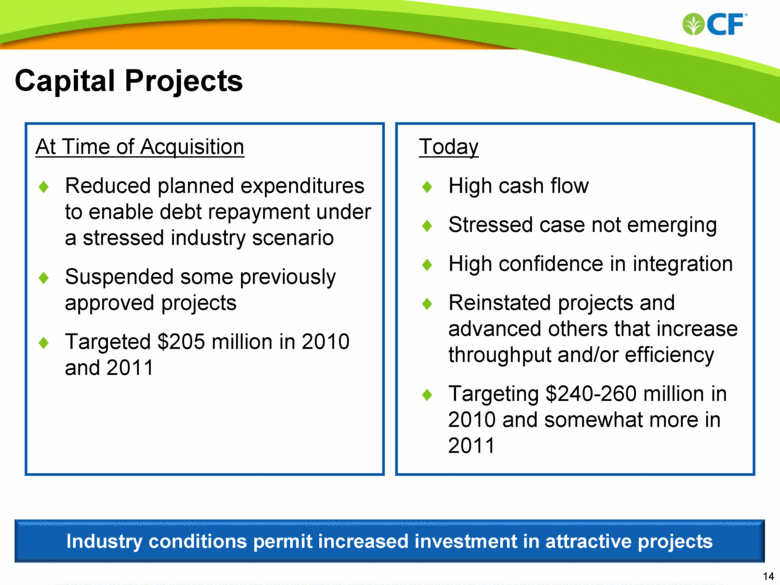
Capital Projects At Time of Acquisition Reduced planned expenditures to enable debt repayment under a stressed industry scenario Suspended some previously approved projects Targeted $205 million in 2010 and 2011 Industry conditions permit increased investment in attractive projects Today High cash flow Stressed case not emerging High confidence in integration Reinstated projects and advanced others that increase throughput and/or efficiency Targeting $240-260 million in 2010 and somewhat more in 2011 14 |
|
|
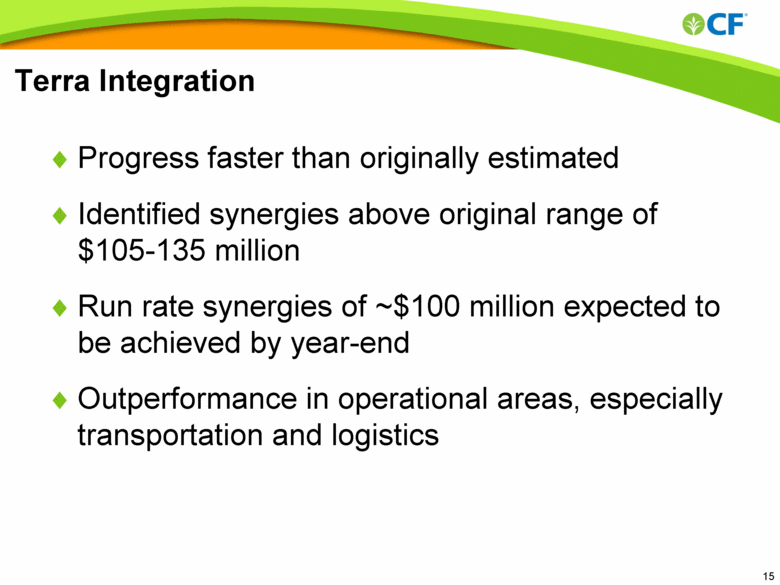
Terra Integration Progress faster than originally estimated Identified synergies above original range of $105-135 million Run rate synergies of ~$100 million expected to be achieved by year-end Outperformance in operational areas, especially transportation and logistics 15 |
|
|
Diesel Exhaust Fluid (DEF) Urea-based fluid to reduce NOx emissions from commercial vehicles High growth High margin CF Industries well positioned to lead Leading U.S. provider Domestic production preferred due to quality requirements and shipping costs Recently completed detailed study Validated approach taken by Terra team Cleared hurdle for further cap ex Woodward expansion increases urea liquor capacity to support additional 30 million gallons of DEF 16 |
|
|
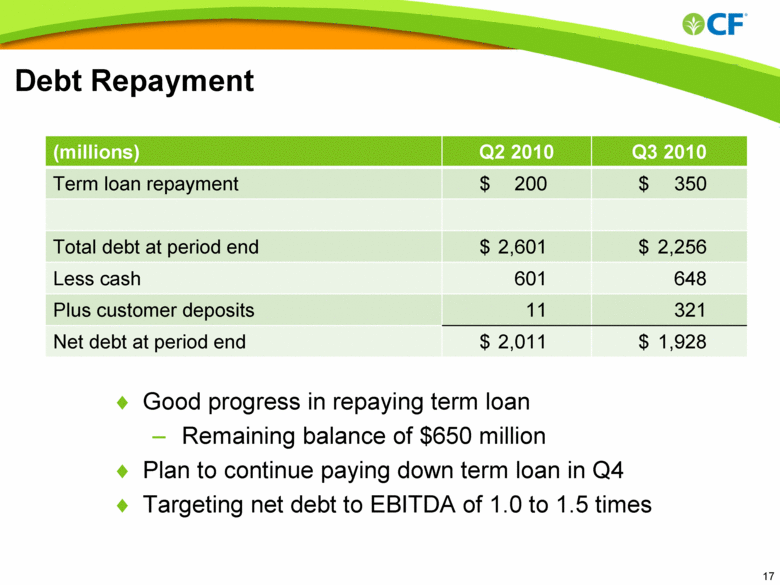
Debt Repayment (millions) Q2 2010 Q3 2010 Term loan repayment $ 200 $ 350 Total debt at period end $ 2,601 $ 2,256 Less cash 601 648 Plus customer deposits 11 321 Net debt at period end $ 2,011 $ 1,928 Good progress in repaying term loan Remaining balance of $650 million Plan to continue paying down term loan in Q4 Targeting net debt to EBITDA of 1.0 to 1.5 times 17 |
|
|
Frequently Asked Questions Have you changed your forward selling philosophy? What is your approach to natural gas hedging? What are your export commitments or plans for upcoming quarters? What tax rate should we assume for the fourth quarter and 2011? What are your priorities for excess cash flow? 18 |

