Attached files
| file | filename |
|---|---|
| 8-K - FORM 8-K - US BANCORP \DE\ | c08614e8vk.htm |
Exhibit 99.1

| Richard K. Davis Chairman, President and CEO November 16, 2010 Bank of America Merrill Lynch 2010 Banking & Financial Services Conference |

| 2 Forward-looking Statements and Additional Information The following information appears in accordance with the Private Securities Litigation Reform Act of 1995: This presentation contains forward-looking statements about U.S. Bancorp. Statements that are not historical or current facts, including statements about beliefs and expectations, are forward-looking statements and are based on the information available to, and assumptions and estimates made by, management as of the date made. These forward-looking statements cover, among other things, anticipated future revenue and expenses and the future plans and prospects of U.S. Bancorp. Forward-looking statements involve inherent risks and uncertainties, and important factors could cause actual results to differ materially from those anticipated. Global and domestic economies could fail to recover from the recent economic downturn or could experience another severe contraction, which could adversely affect U.S. Bancorp's revenues and the values of its assets and liabilities. Global financial markets could experience a recurrence of significant turbulence, which could reduce the availability of funding to certain financial institutions and lead to a tightening of credit, a reduction of business activity, and increased market volatility. Stress in the commercial real estate markets, as well as a delay or failure of recovery in the residential real estate markets, could cause additional credit losses and deterioration in asset values. In addition, U.S. Bancorp's business and financial performance is likely to be impacted by effects of recently enacted and future legislation and regulation. U.S. Bancorp's results could also be adversely affected by continued deterioration in general business and economic conditions; changes in interest rates; deterioration in the credit quality of its loan portfolios or in the value of the collateral securing those loans; deterioration in the value of securities held in its investment securities portfolio; legal and regulatory developments; increased competition from both banks and non-banks; changes in customer behavior and preferences; effects of mergers and acquisitions and related integration; effects of critical accounting policies and judgments; and management's ability to effectively manage credit risk, residual value risk, market risk, operational risk, interest rate risk and liquidity risk. For discussion of these and other risks that may cause actual results to differ from expectations, refer to U.S. Bancorp's Annual Report on Form 10-K for the year ended December 31, 2009, on file with the Securities and Exchange Commission, including the sections entitled "Risk Factors" and "Corporate Risk Profile" contained in Exhibit 13, and all subsequent filings with the Securities and Exchange Commission under Sections 13(a), 13(c), 14 or 15(d) of the Securities Exchange Act of 1934. Forward-looking statements speak only as of the date they are made, and U.S. Bancorp undertakes no obligation to update them in light of new information or future events. This presentation includes non-GAAP financial measures to describe U.S. Bancorp's performance. The reconciliations of those measures to GAAP measures are provided within or in the appendix of the presentation. These disclosures should not be viewed as a substitute for operating results determined in accordance with GAAP, nor are they necessarily comparable to non-GAAP performance measures that may be presented by other companies. |

| U.S. Bancorp Overview and Financial Performance Growth Initiatives Corporate Trust Financial Institutions Current Environment |

| U.S. Bancorp Businesses International Payments Regional Consumer & Business Banking & Wealth Management National Wholesale Banking & Trust Services 3Q10 Dimensions Asset Size $291 billion Deposits $187 billion Loans $195 billion Customers 17.2 million NYSE Traded USB Market Capitalization* $47 billion Founded 1863 Bank Branches 3,013 ATMs 5,323 * As of November 12, 2010 |

| Performance Metrics Source: company reports Peer Banks: BAC, BBT, FITB, JPM, KEY, PNC, RF, STI, USB and WFC Peer USB USB Median Rank Return on Common Equity 12.3% 4.0% 1 Return on Assets 1.11% 0.50% 2 Efficiency Ratio 51.1% 62.3% 1 Net Interest Margin 3.90% 3.49% 4 3Q10 YTD |

| Performance vs Peers Source: SNL, 1Q08 through 3Q10 annualized Peer banks: BAC, BBT, FITB, JPM, KEY, PNC, RF, STI, USB and WFC Since 1/1/08 USB Peer 1 Peer 2 Peer 3 Peer 4 Peer 5 Peer 6 Peer 7 Peer 8 Peer 9 ROA 0.0103 0.0096 0.0086 0.0075 0.0056 0.0015 USB Peer 1 Peer 2 Peer 3 Peer 4 Peer 5 Peer 6 Peer 7 Peer 8 Peer 9 ROCE 0.114 0.094 0.087 0.071 0.063 USB Peer 1 Peer 2 Peer 3 Peer 4 Peer 5 Peer 6 Peer 7 Peer 8 Peer 9 ER 0.487 0.537 0.557 0.574 0.576 0.581 0.592 0.689 0.702 0.736 Return on Average Assets Return on Average Common Equity Efficiency Ratio |

| Diversification 3Q10 YTD, taxable-equivalent basis Excluding securities gains (losses) net Consumer Wholesale PCTAM Payments Treas & Corp Support Revenue 44 20 9 27 0 Revenue Mix By Business Line Revenue Mix By Category Net Interest Income Payments Fiduciary Service Charges Mortgage Trading, Brokerage, Inv Banking, Private Equity Other Revenue 54 17 5 7 6 2 9 Consumer 44% Payments 27% WM&SS 9% Wholesale 20% Net Interest Income 54% Fiduciary Activities 5% Payments Fee Revenue 17% Service Charges 7% Mortgage 6% Trading, Brokerage, Investment Banking, Equity Investments 2% All Other Fee Income 9% |

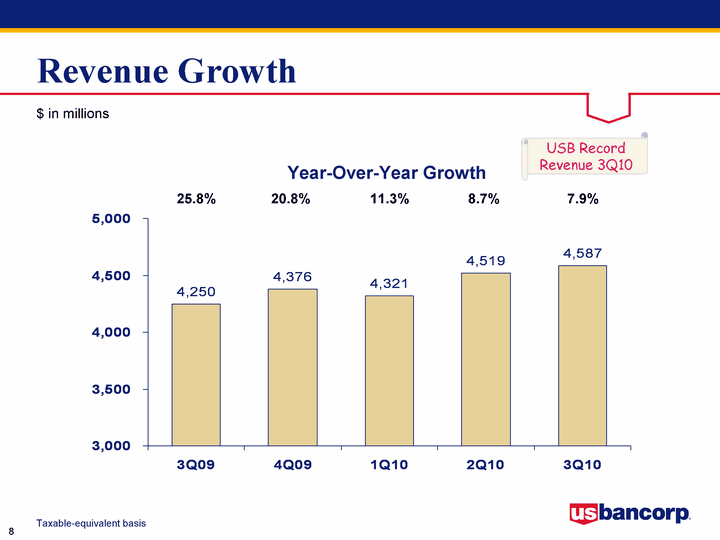
| Taxable-equivalent basis Revenue Growth Year-Over-Year Growth 25.8% 20.8% 11.3% 8.7% 7.9% $ in millions 3Q09 4Q09 1Q10 2Q10 3Q10 Reported 4250 4376 4321 4519 4587 USB Record Revenue 3Q10 |

| 3Q09 4Q09 1Q10 2Q10 3Q10 Loans 182 191.6 192.9 191.2 192.5 Deposits 166.4 180.9 182.5 183.3 182.7 Loan and Deposit Growth Average Balances Year-Over-Year Growth 3Q10 Acquisition Adjusted Loan Growth = (0.4%) Deposit Growth = 2.7% 8.2% $191.6 3.9% $192.9 4.0% $191.2 5.8% $192.5 9.3% $182.0 25.2% $180.9 13.7% $182.5 12.3% $183.3 9.8% $182.7 24.6% $166.4 $ in billions |

| Loan Growth Average loans; loan growth 3Q10 vs. 3Q09 adjusted for acquisitions Acquisition adjustments: USB - FBOP acquisition, BBT - Colonial acquisition, BAC & JPM - credit card securitizations USB Peer 1 Peer 2 Peer 3 Peer 4 Peer 5 Peer 6 Peer 7 Peer 8 Peer 9 Loan Growth 0.007 0.003 0.001 -0.005 -0.013 -0.017 -0.019 -0.021 -0.033 -0.043 USB Peer 1 Peer 2 Peer 3 Peer 4 Peer 5 Peer 6 Peer 7 Peer 8 Peer 9 Loan Growth -0.004 -0.017 -0.043 -0.054 -0.063 -0.063 -0.073 -0.09 -0.093 -0.189 Loan Growth 3Q10 vs. 2Q10 Loan Growth 3Q10 vs. 3Q09 |

| Capital Position 4Q07 1Q08 2Q08 3Q08 4Q08 1Q09 2Q09 3Q09 4Q09 1Q10 2Q10 3Q10 TARP 0 0 0 0 24.4 25.3 0 0 0 0 0 0 Tier 1 Capital Ratio 0.083 0.086 0.085 0.085 0.106 0.109 0.094 0.095 0.096 0.099 0.101 0.103 Tier 1 Common Ratio 0.056 0.057 0.056 0.057 0.051 0.054 0.067 0.068 0.068 0.071 0.074 0.076 Tier 1 Capital 17.5 18.5 18.6 18.9 18 18.9 21.7 22 22.6 23.3 24 24.9 TARP Equity Tier 1 Capital Tier 1 Capital Ratio Tier 1 Common Ratio $ in billions |

| 3Q07 4Q07 1Q08 2Q08 3Q08 4Q08 1Q09 2Q09 3Q09 4Q09 1Q10 2Q10 3Q10 NPA $ Change 76 49 155 290 357 489 727 626 386 184 91 -261 -171 NPA % Change 0.13 0.08 0.22 0.34 0.31 0.33 0.37 0.23 0.12 0.05 0.02 -0.07 -0.05 3Q07 4Q07 1Q08 2Q08 3Q08 4Q08 1Q09 2Q09 3Q09 4Q09 1Q10 2Q10 3Q10 NCO $ Change 8 26 68 103 102 134 156 141 112 69 25 -21 -119 NCO % Change 0.041884817 0.130653266 0.302222222 0.351535836 0.257575758 0.269076305 0.246835443 0.17893401 0.12056 0.07 0.02 -0.02 -0.11 Credit Quality $ in millions, linked quarter change * Excluding Covered Assets (assets subject to loss sharing agreements with FDIC) Change in Net Charge-offs Change in Nonperforming Assets* NCO $ Change (Left Scale) NCO % Change (Right Scale) NPA $ Change (Left Scale) NPA % Change (Right Scale) 103 68 (21) 25 69 112 141 156 134 102 155 290 91 184 386 626 727 489 357 (261) (119) (171) |

| Credit Quality Peer Banks: BAC, BBT, FITB, JPM, KEY, PNC, RF, STI, USB and WFC NPA Ratio equals nonperforming assets as a % of the sum of gross loans and foreclosed assets USB NPA ratio excludes Covered Assets (subject to loss sharing agreements with FDIC) 3Q09 4Q09 1Q10 2Q10 3Q10 Charge-off Ratio 0.0227 0.023 0.0239 0.0234 0.0205 NPA Ratio 0.0214 0.0225 0.0234 0.0217 0.0202 USB Peer Banks USB 0.0205 0 Low 0 0.0161 Median 0 0.0116 High 0 0.0218 USB Peer Banks USB 0.0202 0 Low 0 0.0256 Median 0 0.0136 High 0 0.0106 NCO Ratio 3Q10 NPA Ratio 3Q10 2.05% 1.61% 2.77% 4.95% High Median Low 4.98% 3.92% 2.56% 2.02% High Median Low Net Charge-off Ratio NPA Ratio |

| Credit Quality - Outlook Reached inflection point on credit losses and NPAs; driven by declines in delinquencies and criticized assets The Company expects the level of Net Charge-offs and Nonperforming Assets, excluding covered assets, to trend lower during 4Q10 1Q08 2Q08 3Q08 4Q08 1Q09 2Q09 3Q09 4Q09 1Q10 2Q10 3Q10 30 to 89 % 0.010601156 0.0103876 0.011833483 0.016222915 0.017008547 0.014526577 0.014428656 0.014800805 0.013381895 0.011072197 0.01 90+ % 0.004270373 0.004141298 0.004633146 0.005564539 0.006834344 0.007245829 0.00775995 0.008820331 0.007760089 0.007220238 0.0066 1Q08 2Q08 3Q08 4Q08 1Q09 2Q09 3Q09 4Q09 1Q10 2Q10 3Q10 Chg Criticized Assets 0.181945238 0.228090362 0.156114108 0.359501198 0.275796154 0.002013557 0.057701718 0.001878723 -0.012658584 -0.159651986 -0.08 Delinquencies* Changes in Criticized Assets* * Excluding Covered Assets (assets subject to loss sharing agreements with FDIC) |

| U.S. Bancorp Overview and Financial Performance Growth Initiatives Corporate Trust Financial Institutions Current Environment |

| Building on our Strengths... Expense Driven Conservative Credit Culture Efficient Operating Model Strong Capital Generation Fortress Balance Sheet Diversification of Risk Low Revenue Volatility Strong Defense (2001 - 2006) |

| Continuing to Invest... Flight-to-Quality Expense Driven Conservative Credit Culture Efficient Operating Model Strong Capital Generation Fortress Balance Sheet Diversification of Risk Low Revenue Volatility Conservative Credit Culture Efficient Operating Model Strong Capital Generation Fortress Balance Sheet Diversification of Risk Low Revenue Volatility Enterprise Revenue Office National Corporate Banking National Mortgage Banking Deposit Pricing Parity Brand Development Selective M&A / JVs Investing for Growth (2007 - 2010) Strong Defense (2001 - 2006) |

| Positioned to Win Flight-to-Quality Expense Driven Organic Market Share Gain Conservative Credit Culture Efficient Operating Model Strong Capital Generation Fortress Balance Sheet Diversification of Risk Low Revenue Volatility Conservative Credit Culture Efficient Operating Model Strong Capital Generation Fortress Balance Sheet Diversification of Risk Low Revenue Volatility Conservative Credit Culture Efficient Operating Model Strong Capital Generation Fortress Balance Sheet Diversification of Risk Low Revenue Volatility Enterprise Revenue Office National Corporate Banking National Mortgage Banking Deposit Pricing Parity Brand Development Selective M&A / JVs Enterprise Revenue Office National Corporate Banking National Mortgage Banking Deposit Pricing Parity Brand Development Selective M&A / JVs Relevant Scale Customer Experience Leveraging Technology Employee Engagement Investing for Growth (2007 - 2010) Strong Defense (2001 - 2006) Positioned to Win (2011 ?) |

| U.S. Bancorp Overview and Financial Performance Growth Initiatives Corporate Trust Financial Institutions Current Environment |

| Corporate Trust 1 2 4 5 Revenue 54.06 37.14 5 4 Trustee Paying Agent Escrow Agent Document Custody 2011 revenue forecast Revenue by Business Segment Successful Growth Through Acquisition Municipal, Corporate & Escrow 54% Structured 37% Document Custody Services 5% Default 4% Bank of America (Global CDO, CMBS and Projected RMBS Securitization Trust Administration Business) 4Q 2010 First Citizens Bank (Municipal Trust) 3Q 2009 AmeriServ (Corporate Trust) 2Q 2009 LaSalle (Municipal Trust) 4Q 2006 SunTrust (Corporate & Municipal Trust) 3Q 2006 Wachovia (Corporate Trust & Custody) 4Q 2005 National City Bank (Corporate Trust) 2Q 2004 State Street (Corporate Trust) 4Q 2002 First Security Investor Reporting (Tax & Bond Admin) 2Q 2002 Firstar Corporation 1Q 2001 Fleet Bank (Document Custody Services) 1Q 1999 Reliance Trust Company (Corporate Trust) 1Q 1999 Comerica (Corporate Trust) 1Q 1997 FirsTier Bank 1Q 1996 Bank of America (Corporate Trust) 2Q 1995 Morgan Guaranty Trust (Corporate Trust) 3Q 1994 U.S. Bank (Corporate Trust) (Prior to FBS/USB merger) 1Q 1993 Bankers Trust Company of California, N.A. 3Q 1992 |

| Corporate Trust - Transaction Summary Acquisition of Bank of America's U.S and European CDO, CMBS, RMBS and ABS Securitization Trust Administration Business Solidifies U.S. Bank as a top tier provider of corporate trust services Adds revenues of more than $100 million and deposits of more than $10 billion Purchase agreement includes standard indemnifications and representations In this transaction, U.S. Bank is only acquiring relationships that include agreement terms that provide standard protections to the trustee Cash purchase price of up to $35 million One-time merger expenses are anticipated to be $40 to $45 million Acquisition is expected to significantly exceed U.S. Bancorp's internal financial hurdles Minimal impact on Tier 1 Common ratio Anticipated to be accretive to GAAP EPS and cash EPS post conversion in 2012 Subject to certain regulatory approvals |

| Corporate Trust - Strategic Rationale Opportunity to increase U.S. structured finance trust business pro-forma market share ranking to #1 Strong complement to existing U.S. Bank Corporate Trust business Cost take-outs result from leveraging existing platforms and scale As capital markets strengthen, U.S. Bank Corporate Trust will be well positioned with new/expanded client relationships and the addition of experienced personnel Provides an entry point in Europe with offices in Ireland and London, England to expand the distribution and product offerings of U.S. Bank Corporate Trust |

| Servicer role and responsibilities Collect payments on the loans and maintain loan level detail for the investors Enforce the terms of each mortgage loan, including declaring default and foreclosing on the property, and can modify terms within limitations specified by the transaction documents Trustee role and responsibilities Performs administrative functions for the transaction such as maintaining bank accounts and holder records, receiving payments from servicers, and distributing funds and reports to investors as directed The Trustee does not: Initiate, and has no authority over, the foreclosure process Under standard trust agreements, have any duty to investigate on its own for the purpose of detecting defaults, fraud, or other breaches by the servicer; but will do so on behalf of the investors if given authority per terms established by the documents Corporate Trust - Role of the Trustee in MBS |

| U.S. Bancorp Overview and Financial Performance Growth Initiatives Corporate Trust Financial Institutions Current Environment |

| Financial Institutions Key partner to 3,300+ U.S. financial institutions Including banks, thrifts and credit unions Assets from $1 million to $1+ trillion Value proposition is resonating with partners and clients: Maximize profits Mitigate risk Achieve full business potential Deeper product penetration: financial institutions with more than one solution 2010 = 43% 2007 = 27% Merchant Services 1,566 ATM/Debit 1,429 Consumer Credit Card 1,553 Corporate Payments 308 Leasing 62 Mortgage 422 IT&C 51 SBA 17 Correspondent & Lending Services 1,359 2010 Product Penetration |

| Financial Institutions Payment Solutions ATM Processing and ATM Servicing MoneyPass Network Debit and Prepaid Card Solutions Credit Card Services and Acquisitions Merchant Servicing and Acquisitions Wealth Management and Securities Services Solutions Institutional Trust & Custody Corporate Trust Services Wealth Management Services Banking Solutions Credit Facilities Syndicated Finance Solutions Debt Capital Markets Fixed Income Investments Derivatives & Asset/Liability Mgmt Global Trade Finance Services Foreign Exchange Image Cash Letter / Check Processing Other Treasury Mgmt Services Global Wire / ACH Services Leasing Services SBA Loan Services Insurance / BOLI Services Mortgage Solutions Outsourced Consumer Loan Servicing Comprehensive Solutions |

| U.S. Bancorp Overview and Financial Performance Growth Initiatives Corporate Trust Financial Institutions Current Environment |

| 3Q09 4Q09 1Q10 2Q10 3Q10 Foreclosure Starts - Insured/Serviced 6615 7160 7632 7738 7778 Foreclosure Starts - Portfolio 2673 2413 2231 1659 1717 Average per Day 143 154 162 147 148 Foreclosures Number of Foreclosure Starts Investor Owner Mix 15185 10823 Judicial 62% Non Judicial 38% Primary goal is to keep borrowers in their homes Actively participate in programs designed to assist homeowners and prevent foreclosures Manageable size and quality of portfolio allow effective internal management and control Internal assessment and review of policies and procedures confirmed quality of processes and controls U.S. Bank does not plan to halt foreclosures Foreclosure Starts - Portfolio Foreclosure Starts - Serviced/Insured Average per Day Active Foreclosures 31,400 Average Days in Foreclosure 254 days Judicial 283 days Non-Judicial 207 days 9,288 9,573 9,863 9,397 9,495 |

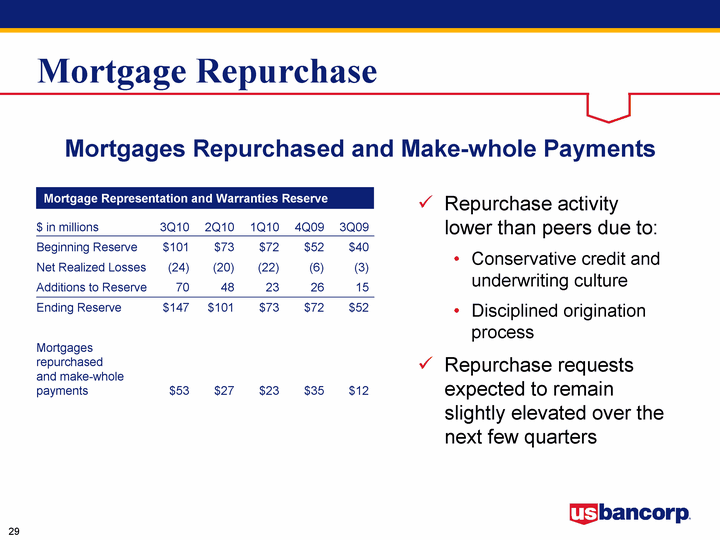
| Mortgage Repurchase Mortgages Repurchased and Make-whole Payments Mortgage Representation and Warranties Reserve $ in millions 3Q10 2Q10 1Q10 4Q09 3Q09 Beginning Reserve $101 $73 $72 $52 $40 Net Realized Losses (24) (20) (22) (6) (3) Additions to Reserve 70 48 23 26 15 Ending Reserve $147 $101 $73 $72 $52 Mortgages repurchased and make-whole payments $53 $27 $23 $35 $12 Repurchase activity lower than peers due to: Conservative credit and underwriting culture Disciplined origination process Repurchase requests expected to remain slightly elevated over the next few quarters |

| Regulatory Environment Existing regulatory oversight actions YTD 4Q10 Annual Actual Estimate Run Rate Overdraft Legislation ^ $140 ^ $110 - $120 ^ $440 - $480 Pricing and Policy Changes Card Act ^ $100 ^ $60 - $80 ^ $250 Net Interest Margin and Fee Income $ in millions, estimated reduction to revenue |

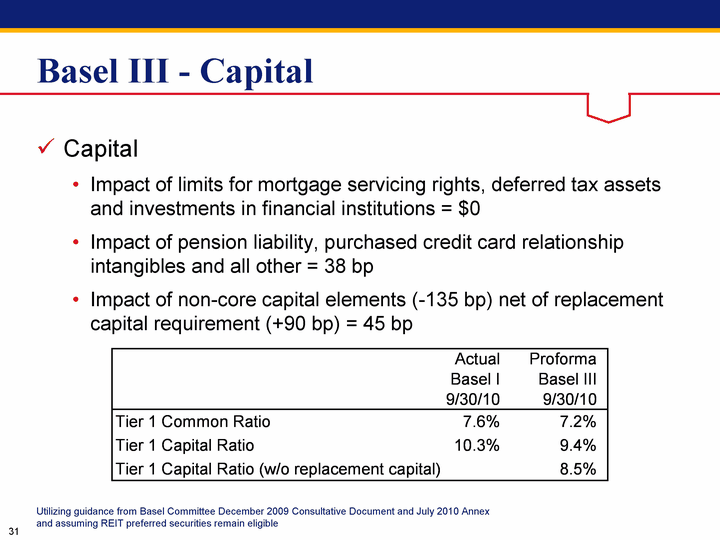
| Basel III - Capital Capital Impact of limits for mortgage servicing rights, deferred tax assets and investments in financial institutions = $0 Impact of pension liability, purchased credit card relationship intangibles and all other = 38 bp Impact of non-core capital elements (-135 bp) net of replacement capital requirement (+90 bp) = 45 bp Utilizing guidance from Basel Committee December 2009 Consultative Document and July 2010 Annex and assuming REIT preferred securities remain eligible |

| Basel III - Liquidity Liquidity Liquidity Coverage Ratio (LCR) may require replacing off-balance sheet liquidity with on-balance sheet liquidity Expect transition to on-balance sheet liquidity to result in moderate increase in average investment portfolio in 2011 vs. 2010 No impact to risk-weighted assets Moderate decline in net interest margin Minimal impact to net income Utilizing guidance from Basel Committee December 2009 Consultative Document and July 2010 Annex |

| U.S. Bancorp Capital Management USB Peer 1 Peer 2 Peer 3 Peer 4 Peer 5 Peer 6 Peer 7 Peer 8 Peer 9 ROA 0.22 0.18 0.16 0.13 0.1 0.03 0 0 0 0 Strong capital generation and less shareholder dilution over the current cycle Historically enjoyed high payout ratio Goal to resume normal capital management - return majority of earnings to shareholders in the form of dividends and share buybacks Target dividend payout ratio of 35-40% Source: SNL, 1Q08 through 3Q10 annualized Peer banks: BAC, BBT, FITB, JPM, KEY, PNC, RF, STI, USB and WFC Return on Tangible Common Equity Since 1/1/08 2003 2004 2005 2006 2007 2008 2009 3Q10 YTD Dividends 0.44 0.46 0.5 0.53 0.66 1.06 0.21 0.12 Share Repurchase 0.11 0.63 0.4 0.59 0.45 0.02 0 0 Earnings Distributed to Shareholders 90% 55% 109% 112% 111% 108% 21% 12% Dividends Share Repurchase |

| Positioned to Win USB is well-positioned to produce industry-leading performance with... a strong foundation, including excellent credit and risk management, a diversified business mix and prudent capital management a proven track record initiatives to build relevant, profitable scale in each of our business lines investments in new technology to increase revenue, improve efficiency and enhance service strategies to provide the highest quality customer experience and maintain a highly engaged employee base ...creating superior shareholder value |

| Richard K. Davis Chairman, President and CEO November 16, 2010 Bank of America Merrill Lynch 2010 Banking & Financial Services Conference |

| Appendix |

| Non-Regulatory Capital Ratios $ in millions |

| Richard K. Davis Chairman, President and CEO November 16, 2010 Bank of America Merrill Lynch 2010 Banking & Financial Services Conference |
