Attached files
| file | filename |
|---|---|
| 8-K - RAMCO-GERSHENSON PROPERTIES TRUST 8-K - RPT Realty | a6510086.htm |
Exhibit 99.1
November 2010 Investor Presentation
Deliver superior total shareholder returnsGenerate consistent, predictable earnings growthMaintain a strong balance sheet and financial flexibilityPosition the Company to grow annual dividend 1 Ramco’s Strategic Goals
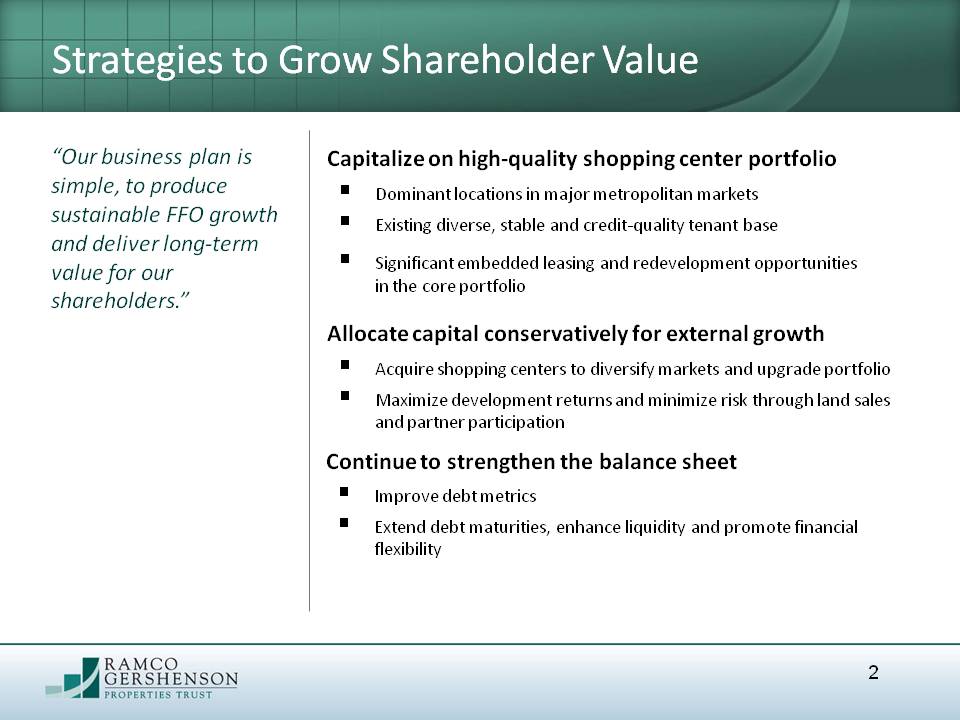
“Our business plan is simple, to produce sustainable FFO growth and deliver long-term value for our shareholders.” Capitalize on high-quality shopping center portfolio Allocate capital conservatively for external growth Dominant locations in major metropolitan marketsExisting diverse, stable and credit-quality tenant base Significant embedded leasing and redevelopment opportunities in the core portfolio Continue to strengthen the balance sheet Acquire shopping centers to diversify markets and upgrade portfolio Maximize development returns and minimize risk through land sales and partner participation Improve debt metrics Extend debt maturities, enhance liquidity and promote financial flexibility 2 Strategies to Grow Shareholder Value
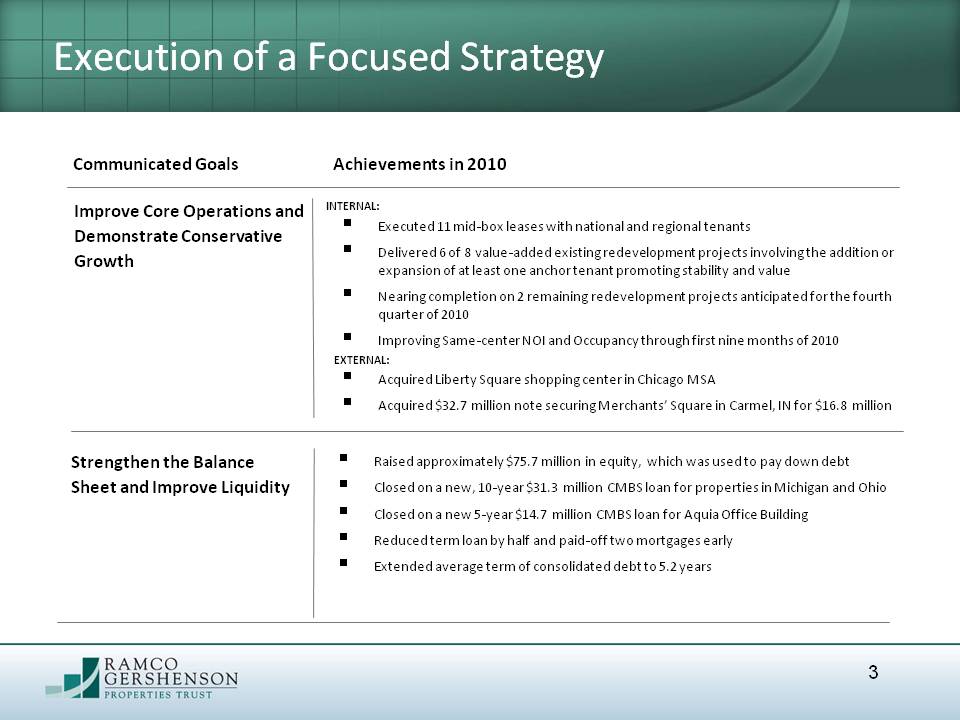
Strengthen the Balance Sheet and Improve Liquidity 3 Executed 11 mid-box leases with national and regional tenantsDelivered 6 of 8 value-added existing redevelopment projects involving the addition or expansion of at least one anchor tenant promoting stability and valueNearing completion on 2 remaining redevelopment projects anticipated for the fourth quarter of 2010Improving Same-center NOI and Occupancy through first nine months of 2010 Raised approximately $75.7 million in equity, which was used to pay down debtClosed on a new, 10-year $31.3 million CMBS loan for properties in Michigan and OhioClosed on a new 5-year $14.7 million CMBS loan for Aquia Office BuildingReduced term loan by half and paid-off two mortgages earlyExtended average term of consolidated debt to 5.2 years Execution of a Focused Strategy Improve Core Operations and Demonstrate Conservative Growth Communicated Goals Achievements in 2010 INTERNAL: EXTERNAL: Acquired Liberty Square shopping center in Chicago MSAAcquired $32.7 million note securing Merchants’ Square in Carmel, IN for $16.8 million
Strong Markets and High-Quality Centers
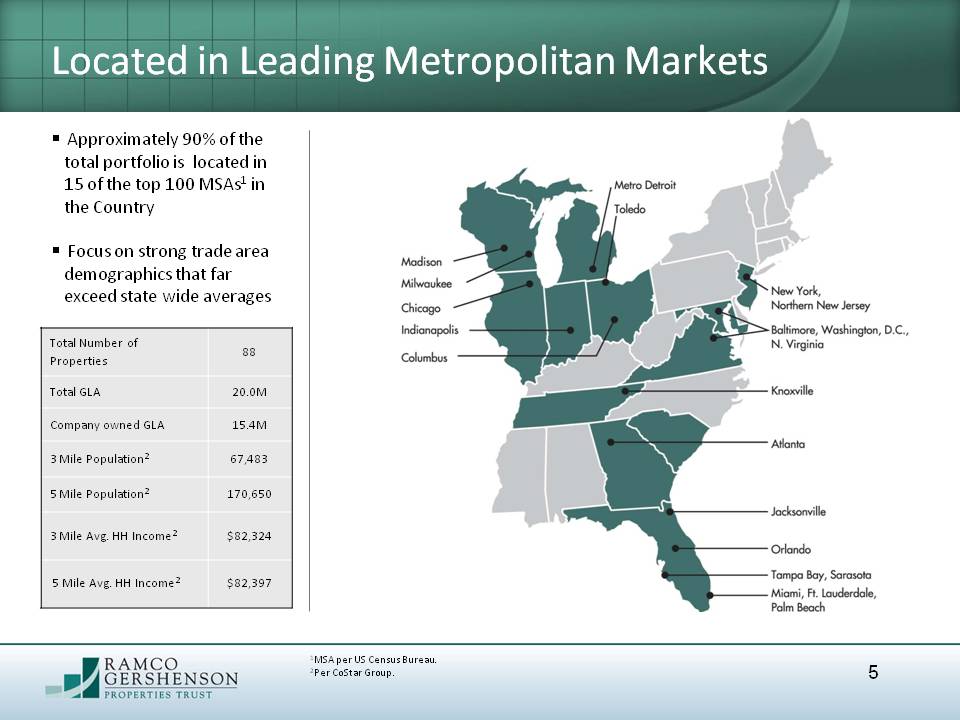
5 1MSA per US Census Bureau. 2Per CoStar Group. Approximately 90% of the total portfolio is located in 15 of the top 100 MSAs1 in the Country Focus on strong trade area demographics that far exceed state wide averagesTitle: Located in Leading Metropolitan Markets
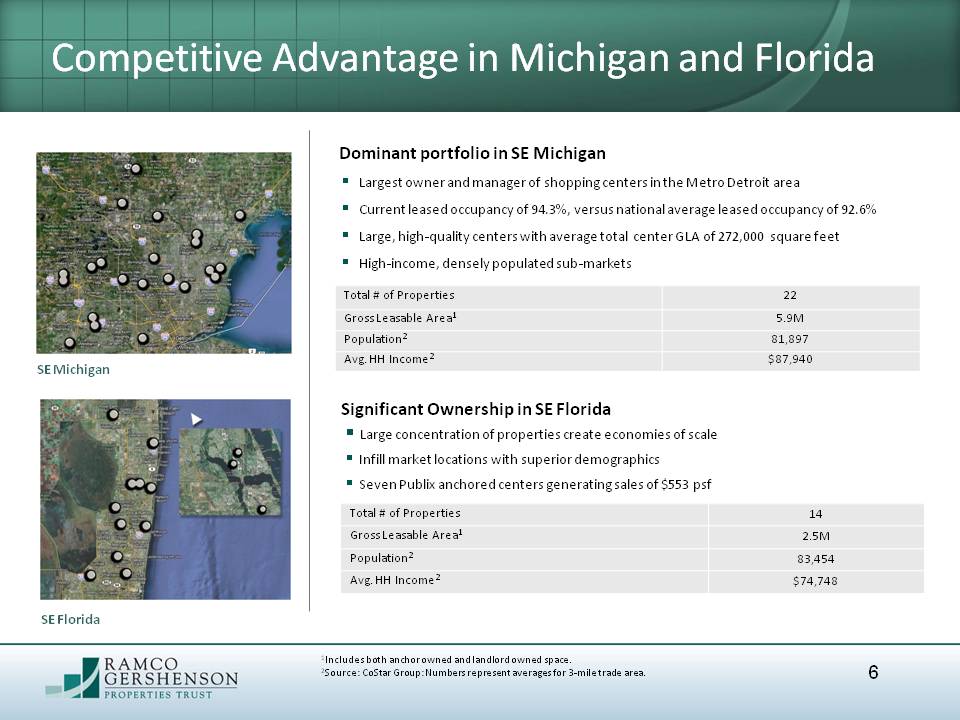
6 Largest owner and manager of shopping centers in the Metro Detroit area Current leased occupancy of 94.3%, versus national average leased occupancy of 92.6% Large, high-quality centers with average total center GLA of 272,000 square feet High-income, densely populated sub-markets 1Includes both anchor owned and landlord owned space. 2Source: CoStar Group: Numbers represent averages for 3-mile trade area. Dominant portfolio in SE Michigan SE Michigan SE Florida Large concentration of properties create economies of scale Infill market locations with superior demographics Seven Publix anchored centers generating sales of $553 psf Significant Ownership in SE Florida Competitive Advantage in Michigan and Florida
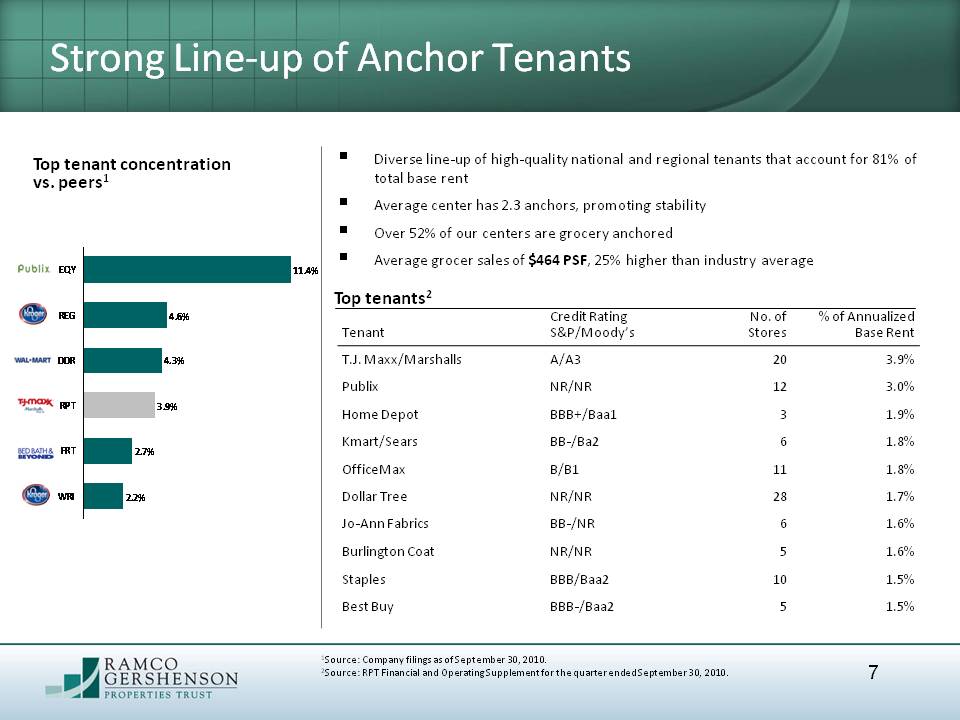
7 Diverse line-up of high-quality national and regional tenants that account for 81% of total base rent Average center has 2.3 anchors, promoting stability Over 52% of our centers are grocery anchored Average grocer sales of $464 PSF, 25% higher than industry average Top tenant concentration vs. peers1 Top tenants2 Strong Line-up of Anchor Tenants 1Source: Company filings as of September 30, 2010. 2Source: RPT Financial and Operating Supplement for the quarter ended September 30, 2010.
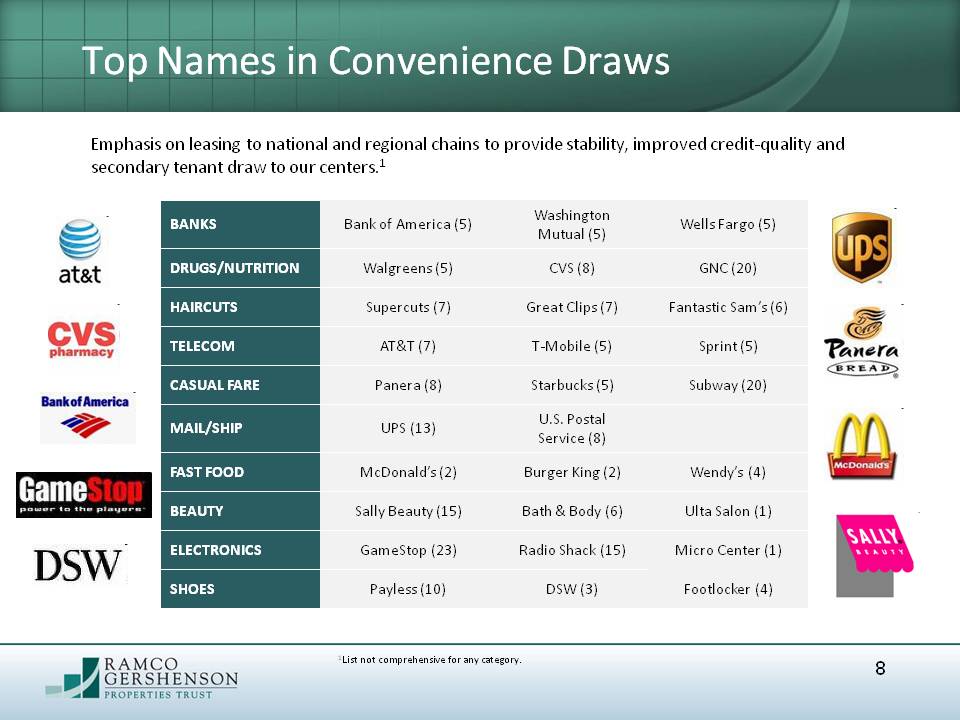
Top Names in Convenience Draws Emphasis on leasing to national and regional chains to provide stability, improved credit-quality and secondary tenant draw to our centers.1 1List not comprehensive for any category. 8
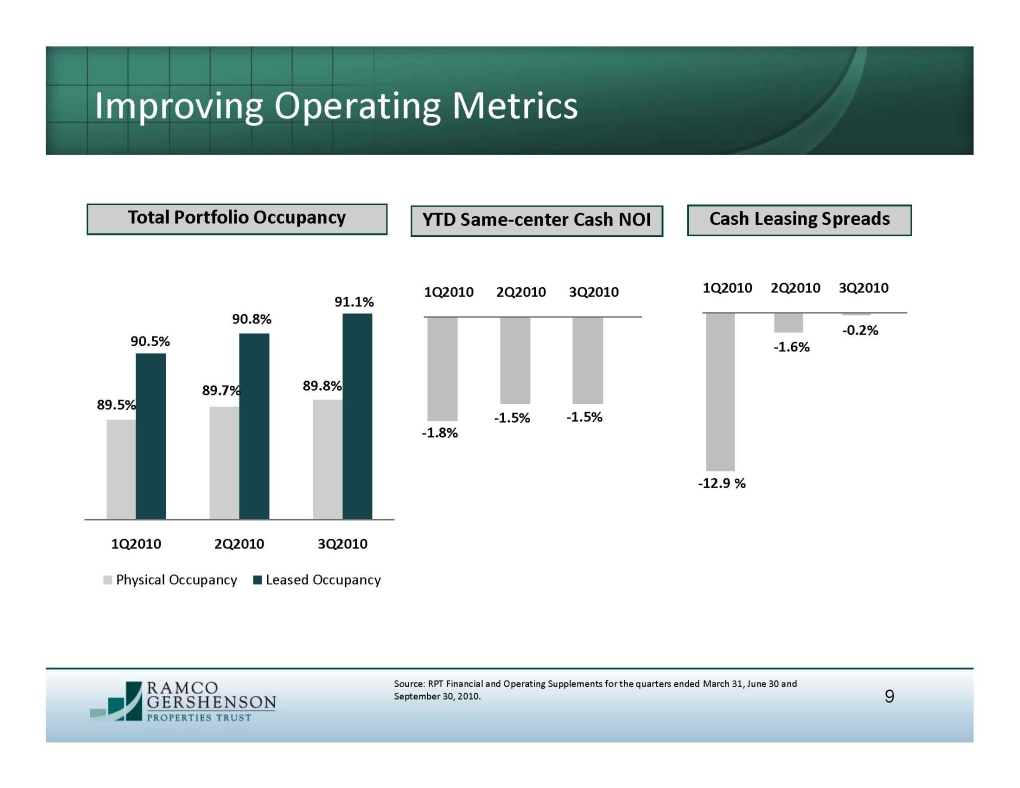
9 Improving Operating Metrics Total Portfolio Occupancy YTD Same-center Cash NOI Cash Leasing Spreads 89.7% 89.5% 90.8% 90.5% -1.8% -1.5% -12.9 % -1.6% 89.8% 91.1% -1.5% -0.2% Source: RPT Financial and Operating Supplements for the quarters ended March 31, June 30 and September 30, 2010.
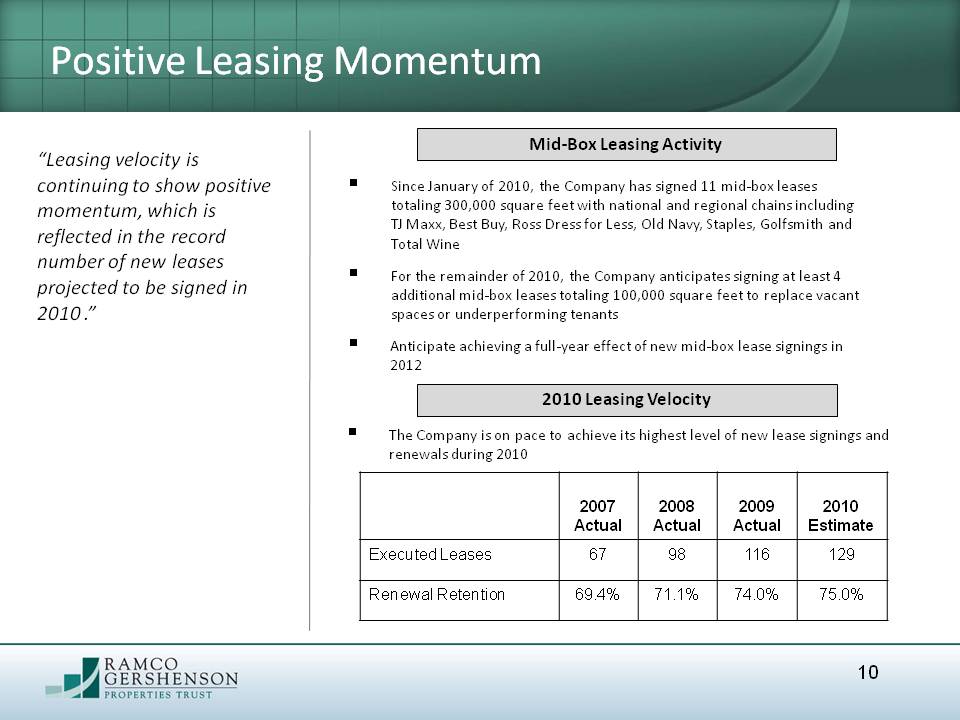
10 Positive Leasing Momentum Since January of 2010, the Company has signed 11 mid-box leases totaling 300,000 square feet with national and regional chains including TJ Maxx, Best Buy, Ross Dress for Less, Old Navy, Staples, Golfsmith and Total WineFor the remainder of 2010, the Company anticipates signing at least 4 additional mid-box leases totaling 100,000 square feet to replace vacant spaces or underperforming tenantsAnticipate achieving a full-year effect of new mid-box lease signings in 2012 2010 Leasing Velocity Mid-Box Leasing Activity “Leasing velocity is continuing to show positive momentum, which is reflected in the record number of new leases projected to be signed in 2010 .” The Company is on pace to achieve its highest level of new lease signings and renewals during 2010
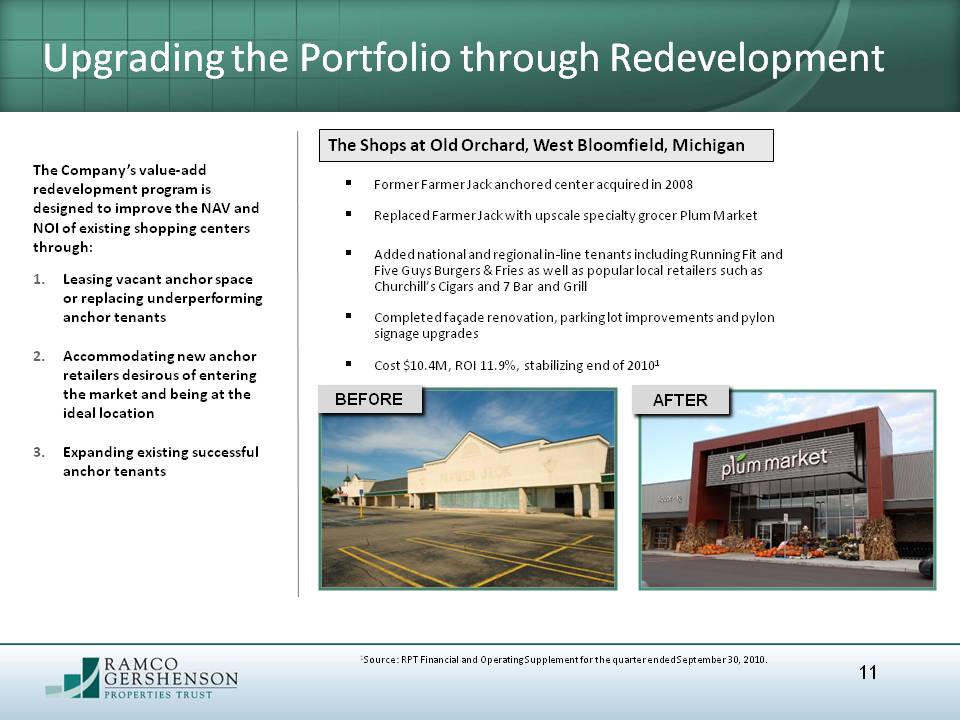
11 The Company’s value-add redevelopment program is designed to improve the NAV and NOI of existing shopping centers through:Leasing vacant anchor space or replacing underperforming anchor tenantsAccommodating new anchor retailers desirous of entering the market and being at the ideal locationExpanding existing successful anchor tenants BEFORE AFTER Upgrading the Portfolio through Redevelopment Former Farmer Jack anchored center acquired in 2008Replaced Farmer Jack with upscale specialty grocer Plum MarketAdded national and regional in-line tenants including Running Fit and Five Guys Burgers & Fries as well as popular local retailers such as Churchill’s Cigars and 7 Bar and GrillCompleted façade renovation, parking lot improvements and pylon signage upgradesCost $10.4M, ROI 11.9%, stabilizing end of 20101 The Shops at Old Orchard, West Bloomfield, Michigan 1Source: RPT Financial and Operating Supplement for the quarter ended September 30, 2010.
Opportunities for External Growth
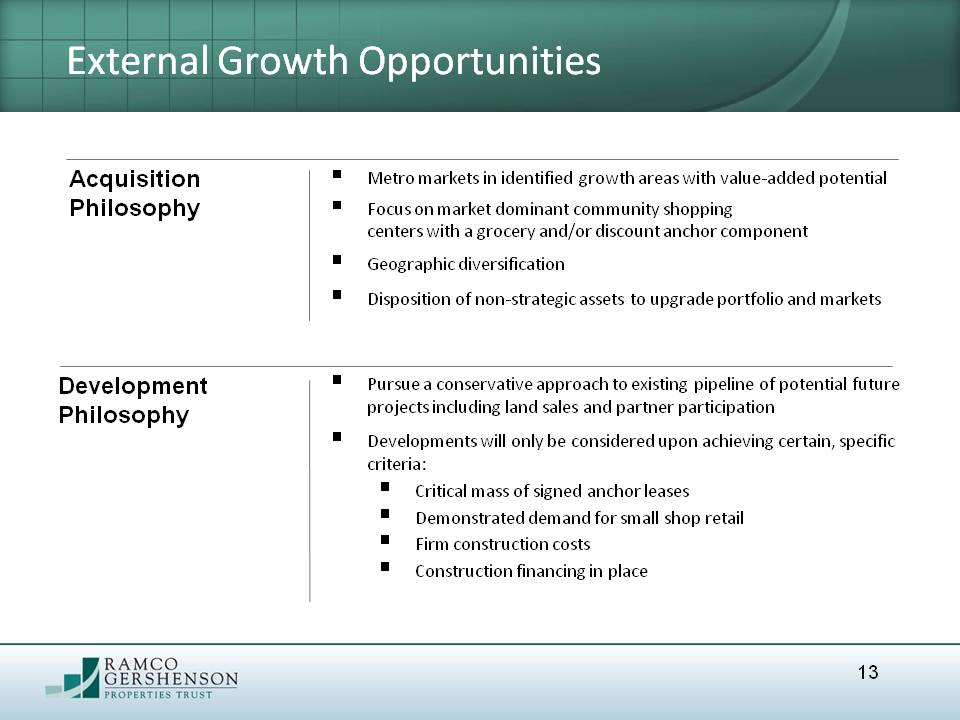
13 Metro markets in identified growth areas with value-added potentialFocus on market dominant community shopping centers with a grocery and/or discount anchor componentGeographic diversificationDisposition of non-strategic assets to upgrade portfolio and markets External Growth Opportunities Acquisition Philosophy Development Philosophy Pursue a conservative approach to existing pipeline of potential future projects including land sales and partner participationDevelopments will only be considered upon achieving certain, specific criteria:Critical mass of signed anchor leasesDemonstrated demand for small shop retailFirm construction costsConstruction financing in place
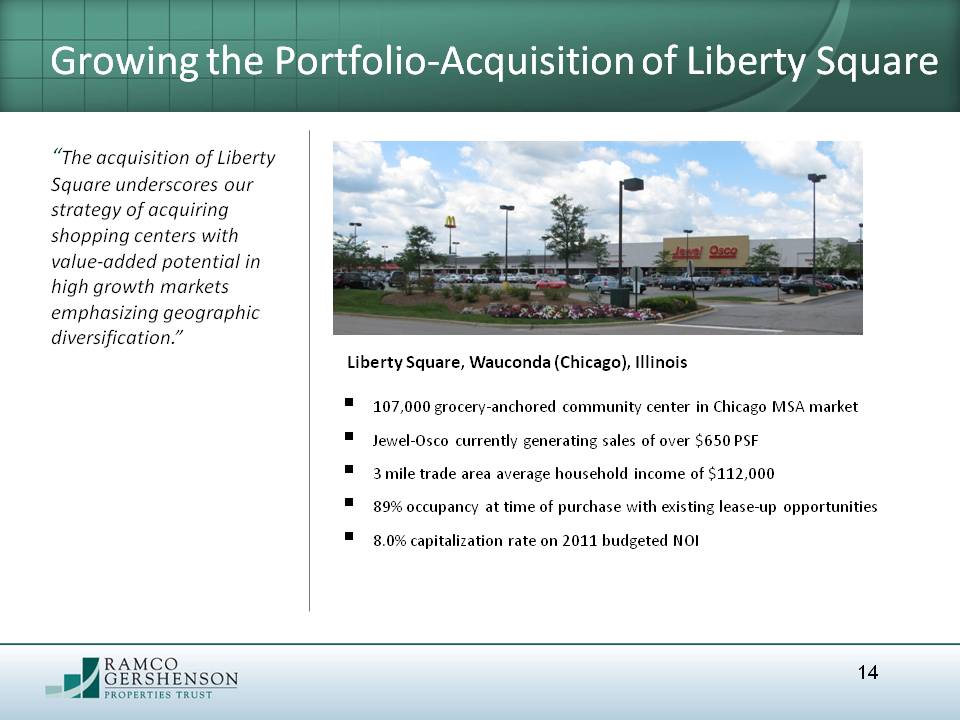
14 Growing the Portfolio-Acquisition of Liberty Square 107,000 grocery-anchored community center in Chicago MSA market Jewel-Osco currently generating sales of over $650 PSF 3 mile trade area average household income of $112,000 89% occupancy at time of purchase with existing lease-up opportunities 8.0% capitalization rate on 2011 budgeted NOI Liberty Square, Wauconda (Chicago), Illinois “The acquisition of Liberty Square underscores our strategy of acquiring shopping centers with value-added potential in high growth markets emphasizing geographic diversification.”
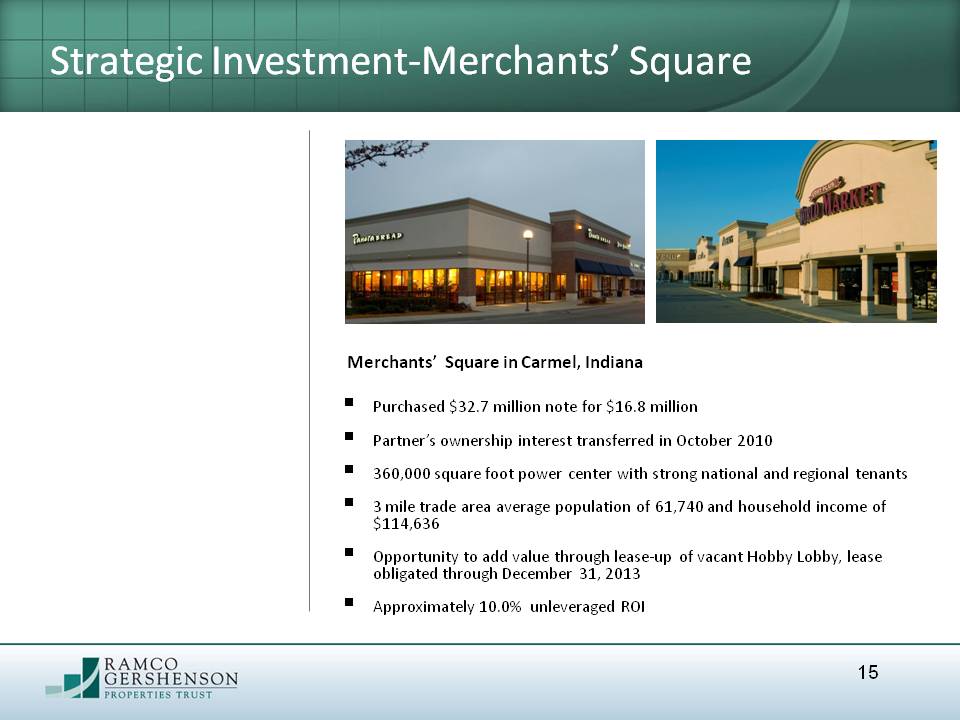
15 Strategic Investment-Merchants’ Square Purchased $32.7 million note for $16.8 million Partner’s ownership interest transferred in October 2010 360,000 square foot power center with strong national and regional tenants 3 mile trade area average population of 61,740 and household income of $114,636 Opportunity to add value through lease-up of vacant Hobby Lobby, lease obligated through December 31, 2013 Approximately 10.0% unleveraged ROI Merchants’ Square in Carmel, Indiana
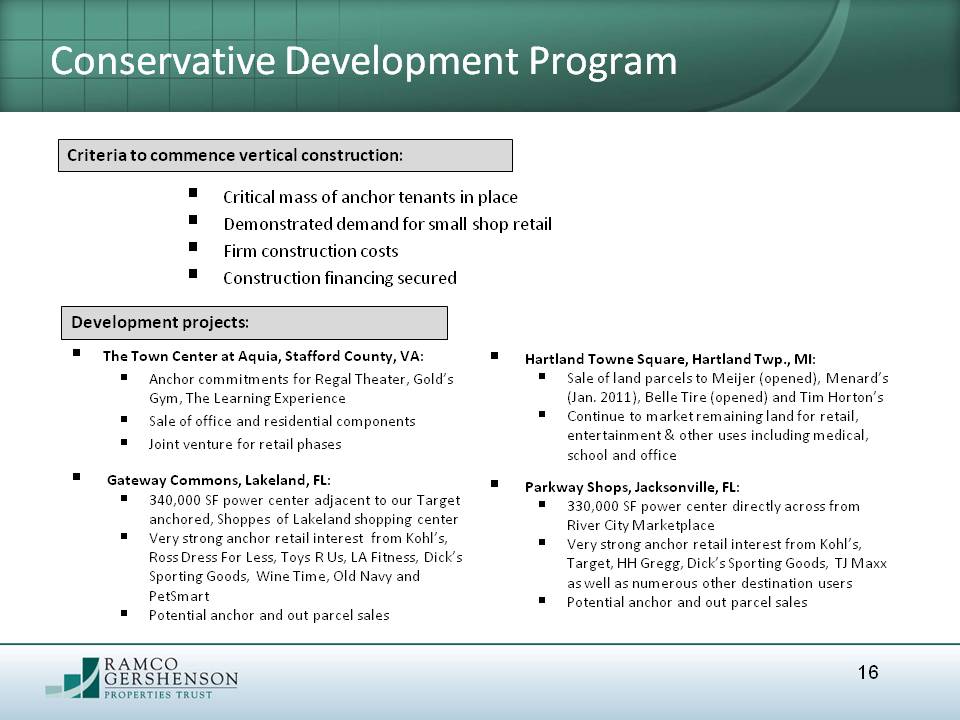
16 Conservative Development Program The Town Center at Aquia, Stafford County, VA: Anchor commitments for Regal Theater, Gold’s Gym, The Learning Experience Sale of office and residential components Joint venture for retail phases Gateway Commons, Lakeland, FL:340,000 SF power center adjacent to our Target anchored, Shoppes of Lakeland shopping center Very strong anchor retail interest from Kohl’s, Ross Dress For Less, Toys R Us, LA Fitness, Dick’s Sporting Goods, Wine Time, Old Navy and PetSmart Potential anchor and out parcel sales Hartland Towne Square, Hartland Twp., MI: Sale of land parcels to Meijer (opened), Menard’s (Jan. 2011), Belle Tire (opened) and Tim Horton’s Continue to market remaining land for retail, entertainment & other uses including medical, school and office Parkway Shops, Jacksonville, FL: 330,000 SF power center directly across from River City Marketplace Very strong anchor retail interest from Kohl’s, Target, HH Gregg, Dick’s Sporting Goods, TJ Maxx as well as numerous other destination users Potential anchor and out parcel sales Critical mass of anchor tenants in place Demonstrated demand for small shop retail Firm construction costs Construction financing secured Development projects: Criteria to commence vertical construction:
Strengthened Balance Sheet
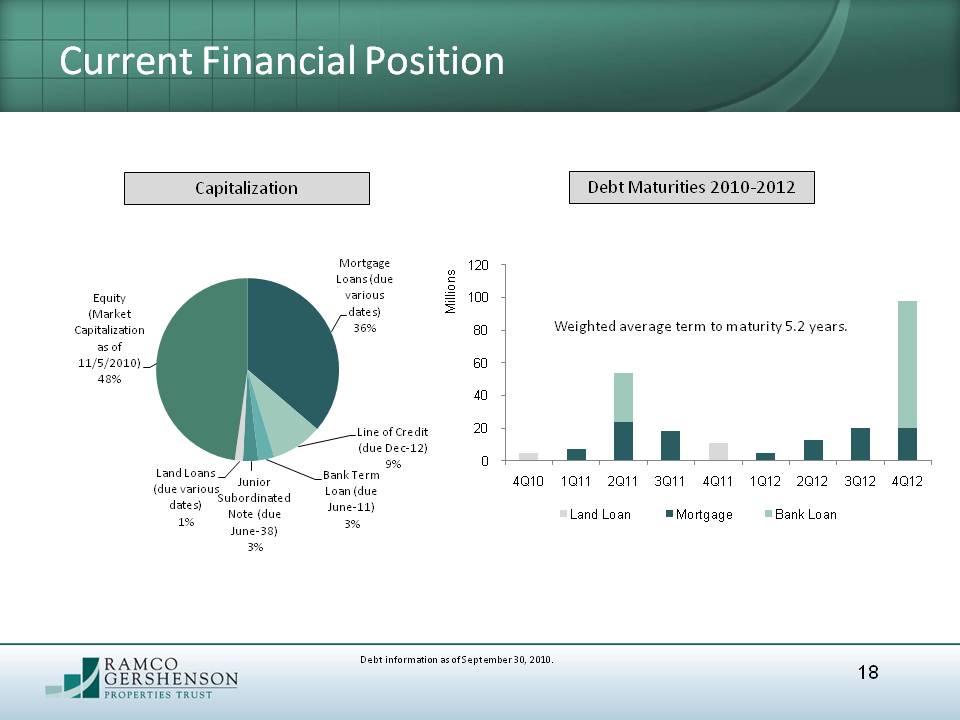
18 Current Financial Position Debt Maturities 2010-2012 Capitalization Weighted average term to maturity 5.2 years. Debt information as of September 30, 2010.
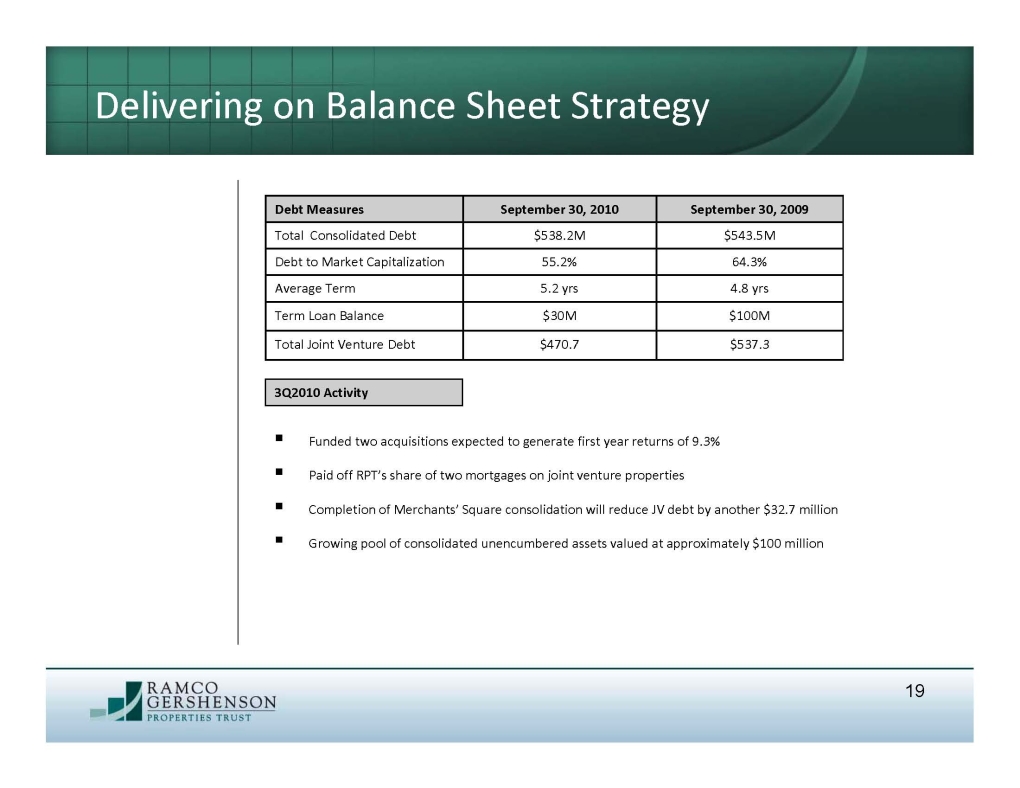
19 Delivering on Balance Sheet Strategy Funded two acquisitions expected to generate first year returns of 9.3%Paid off RPT’s share of two mortgages on joint venture propertiesCompletion of Merchants’ Square consolidation will reduce JV debt by another $32.7 millionGrowing pool of consolidated unencumbered assets valued at approximately $100 million 3Q2010 Activity
20 Selling Assets to Meet Strategic Objectives “We continuously review and evaluate the portfolio to identify potential sales with an eye towards (1) upgrading the portfolio, (2) generating capital to pay down debt, and (3) redeploying capital into new markets and assets. Potential asset sales: Core properties that are fully-valued Non-core Market has moved Possible future risk Out parcels Three assets currently being marketed for sale, which are expected to generate between $40-$45 million in proceeds to Ramco: Fully-valued/potential future riskDiversify out of the market Use proceeds to pay down debt
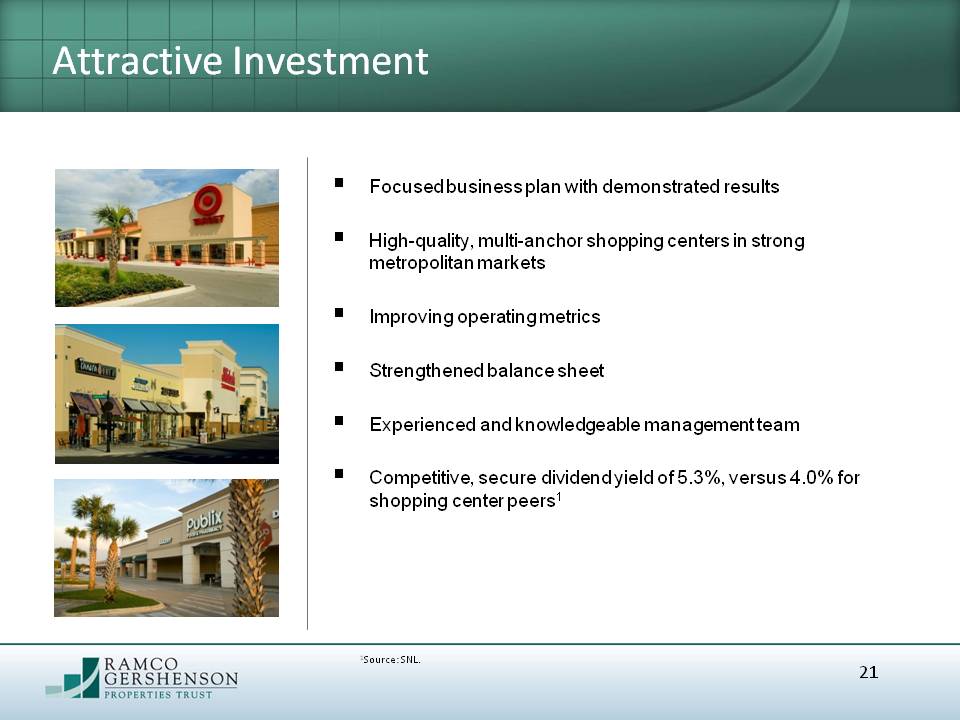
Focused business plan with demonstrated resultsHigh-quality, multi-anchor shopping centers in strong metropolitan marketsImproving operating metricsStrengthened balance sheetExperienced and knowledgeable management teamCompetitive, secure dividend yield of 5.3%, versus 4.0% for shopping center peers1 21 Attractive Investment 1Source: SNL.
22 Ramco-Gershenson Properties Trust considers portions of this information to be forward-looking statements within the meaning of Section 27A of the Securities Act of 1933 and Section 21E of the Securities Exchange Act of 1934, both as amended, with respect to the Company’s expectation for future periods. Although the Company believes that the expectations reflected in such forward-looking statements are based upon reasonable assumptions, it can give no assurance that its expectations will be achieved. For this purpose, any statements contained herein that are not historical fact may be deemed to be forward-looking statements. Certain factors could occur that might cause actual results to vary. These include our success or failure in implementing our business strategy, economic conditions generally and in the commercial real estate and finance markets specifically, our cost of capital, which depends in part on our asset quality, our relationships with lenders and other capital providers, our business prospects and outlook, changes in governmental regulations, tax rates and similar matters, and our continuing to qualify as a REIT, and other factors discussed in the Company’s reports filed with the Securities and Exchange Commission. Safe Harbor Statement
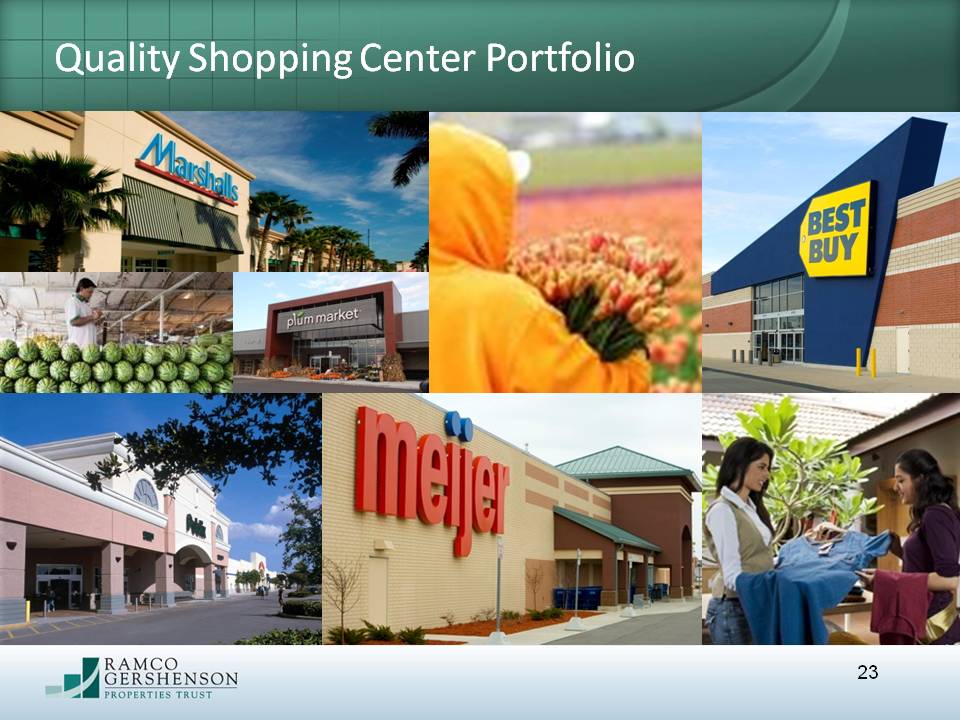
your is wherever you need to interact. 23 Quality Shopping Center Portfolio