Attached files
| file | filename |
|---|---|
| EX-99 - PDF OF PRESENTATION - FIRST MIDWEST BANCORP INC | exhibit99.pdf |
| 8-K - SANDLER CONFERENCE - FIRST MIDWEST BANCORP INC | november118k.htm |

1
November 11, 2010
First Midwest Bancorp, Inc.
Sandler O’Neill
2010 East Coast Financial Services
Investment Conference

2
2
Forward Looking Statements &
Additional Information
Additional Information
This presentation may contain, and during this presentation our management may make statements that may
constitute “forward-looking statements” within the meaning of the safe harbor provisions of the Private
Securities Litigation Reform Act of 1995. Forward-looking statements are not historical facts but instead
represent only our beliefs regarding future events, many of which, by their nature, are inherently uncertain and
outside our control. Forward-looking statements include, among other things, statements regarding our
financial performance, business prospects, future growth and operating strategies, objectives and results.
Actual results, performance or developments could differ materially from those expressed or implied by these
forward-looking statements. Important factors that could cause actual results to differ from those in the forward-
looking statements include, among others, those discussed in our Annual Report on Form 10-K, the preliminary
prospectus supplement and other reports filed with the Securities and Exchange Commission, copies of which
will be made available upon request. With the exception of fiscal year end information previously included in the
audited financial statements in our Annual Report on Form 10-K, the information contained herein is unaudited.
Except as required by law, we undertake no duty to update the contents of this presentation after the date of
this presentation.
The Company’s accounting and reporting policies conform to U.S. generally accepted accounting principles
(“U. S. GAAP”) and general practice within the banking industry. As a supplement to GAAP, the Company has
provided non-GAAP performance results. The Company believes that these non-GAAP financial measures are
useful because they allow investors to assess the Company’s operating performance. Although the non-GAAP
financial measures are intended to enhance investors’ understanding of the Company’s business and
performance, these non-GAAP financial measures should not be considered an alternative to GAAP.

3
3
First Midwest Presentation Index
Who We Are
Operating Performance
Credit And Capital
Market Opportunities
Why First Midwest

4
4
Who We Are
5
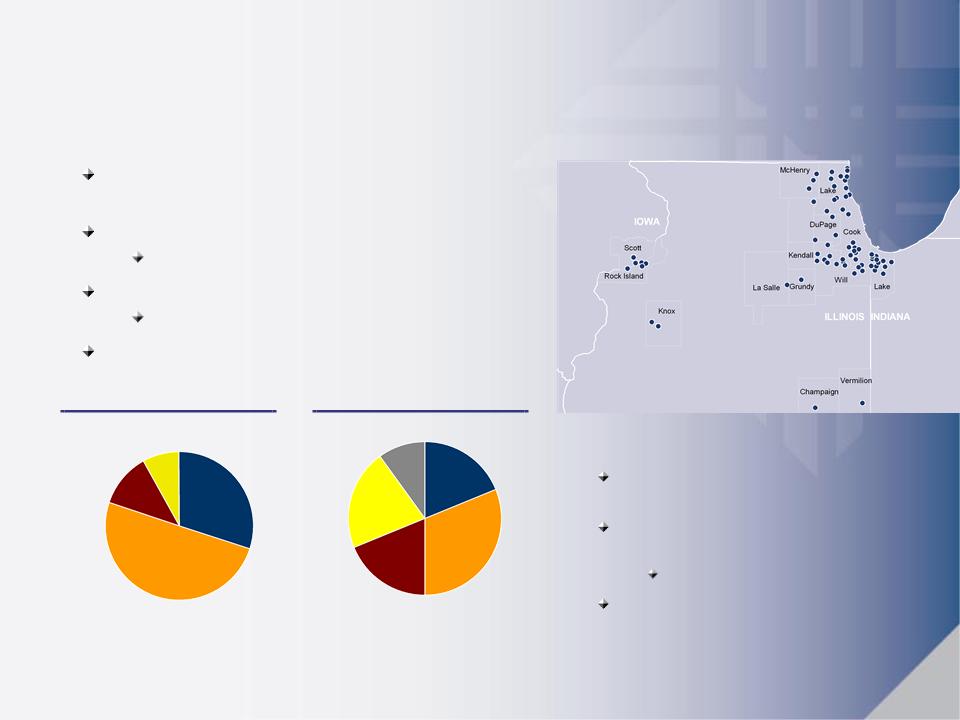
Loan Mix
Deposit Mix4
Highly Efficient Platform - $67mm
Of Deposits Per Branch Office
Of Deposits Per Branch Office
Leading Market Share In Non-
Downtown Chicago MSA ³
Downtown Chicago MSA ³
#9 In Market Share
3 FDIC Acquisitions Since 4Q09
$5.7bn
$6.7bn
Note: Information as of 30-Sept-10.
¹ Defined as time deposits less than $100,000.
² Defined as time deposits greater than $100,000.
³ Source: SNL Financial. Non-downtown ranking and market share based on total deposits in Chicago MSA less deposits in the city of Chicago. Data as of 31-Dec-09.
4 Based on average deposit mix as of 30-Sept-10.
5 Includes $488mm in covered loans stemming from three FDIC transactions since 30-Sept-09.
Consumer
12%
Commercial
& Industrial
& Industrial
30%
Commercial
Real Estate
Real Estate
50%
Savings &
NOW
NOW
31%
Demand
19%
Money
Market
Market
19%
Retail
Time¹
Time¹
21%
Jumbo Time²
10%
Covered Loans
8%
Overview Of First Midwest
Headquartered In Suburban
Chicago
Chicago
$8.4bn Assets
$5.7bn Loans (5)
$6.7bn Deposits
68% Transactional
$4.3bn Trust Assets

6
6
Operating Performance

7
7
Third Quarter Results
|
Key Metrics
|
3Q10
|
2Q10
|
3Q09
|
|
$34.9
|
$34.7
|
$30.2
|
|
|
Net Income (millions)
|
$2.6
|
$7.8
|
$3.4
|
|
Net Interest Margin
|
4.05%
|
4.21%
|
3.66%
|
|
Efficiency Ratio
|
59.9%
|
57.9%
|
59.1%
|
|
Loans (2) (billions)
|
$5.7
|
$5.4
|
$5.3
|
|
Avg. Transactional Deposits (billions)
|
$4.5
|
$4.3
|
$3.9
|
|
Tier 1 Common
|
10.45%
|
10.89%
|
8.43%
|
1 PTPP Represents Pre-Tax, Pre-Provision earnings, which is a non-GAAP financial measure. For reconciliation to GAAP measure, please refer to the appendix.
2 Includes $488mm in covered loans stemming from three FDIC transactions since 30-Sept-09.

8
Third Quarter Highlights
Strong Core Earnings
Top Line Revenues, Solid Margin
Fee-Based Business Improvement
Acquisition Integration
Continued Lending; Elevated Credit Costs
Loan Growth Offset By Remediation
Peer Leading Capital And Liquidity

9
Source: FMBI based on internal data; peer data from SNL Financial.
¹ Equal to non-interest expense divided by fully taxable equivalent (FTE) net interest income and non-interest income. Excludes nonrecurring items, sourced from SNL.
² This is a non-GAAP financial measure. For reconciliation to GAAP measure, please refer to the appendix.
³ Chicago Peers based on median of MBFI, OSBC, PVTB, TAYC and WTFC.
4 Metro Peers based on median of CATY, CBSH, CFR, FCF, FMER, FULT, MBFI, ONB, PVTB, SUSQ, UMPQ, VLY, WTFC, and WTNY.
Efficiency Ratio % ¹
Net Interest Margin %
2.18%
4.05%
58.03%
Core Business Is Solid

10
Continued Business Investment
Strengthening Sales
Sales Staff Isolated From Remediation
Household Growth Up 10%
JD Power Retail Client Satisfaction: Second In Midwest
Internet Enhancement
Streamlined Account Opening And Navigation
34% Increase In Web Usage, 115% In Applications
Product Enhancement
Mortgage Program
Overdraft Program
E-Statements

11
11
Credit And Capital
12
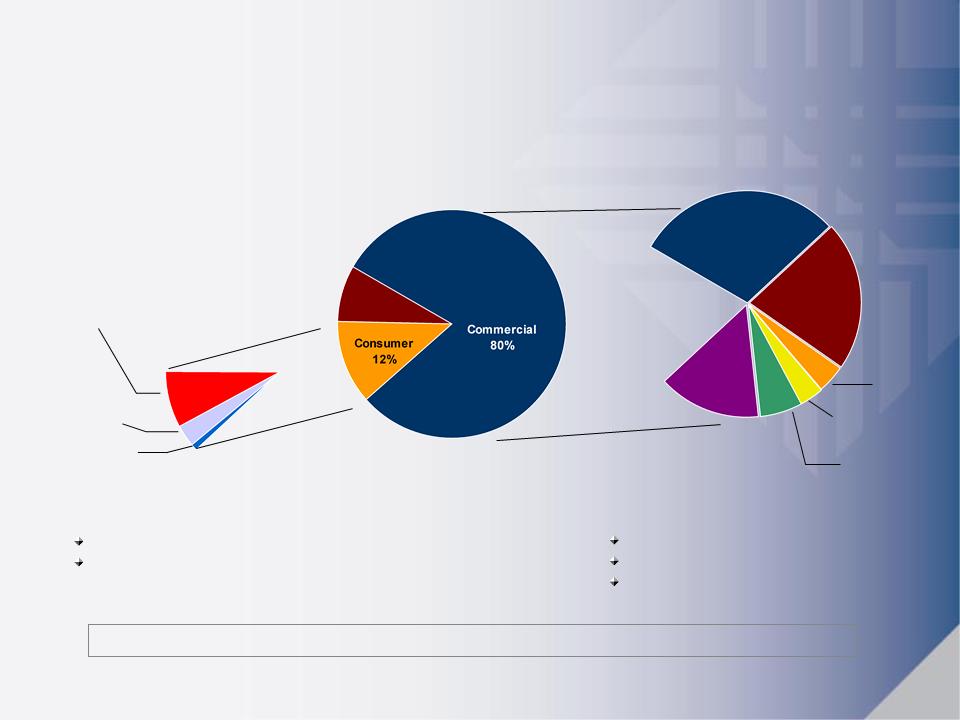
~95% in footprint
Diversified + granular
Most have personal guarantees
Consumer Loans = $656mm
Home Equity
8%
8%
Other
Consumer
1%
Consumer
1%
C&I
30%
30%
Office,
Retail &
Industrial
22%
Retail &
Industrial
22%
Residential
Construction
4%
Construction
4%
Commercial
Construction &
Land 3%
Construction &
Land 3%
Multi-family
6%
6%
Other CRE
15%
15%
Commercial Loans = $4.5bn
Real Estate - 1- 4
Family
3%
Family
3%
Total Loans = $5.7bn
People we know, businesses we know, markets we understand
Note: Loan data as of 30-Sept-10.
Covered 8%
Addressing Realities Of Credit Cycle
- Loan Portfolio Overview
- Loan Portfolio Overview
Branch originated
Home equity dominated
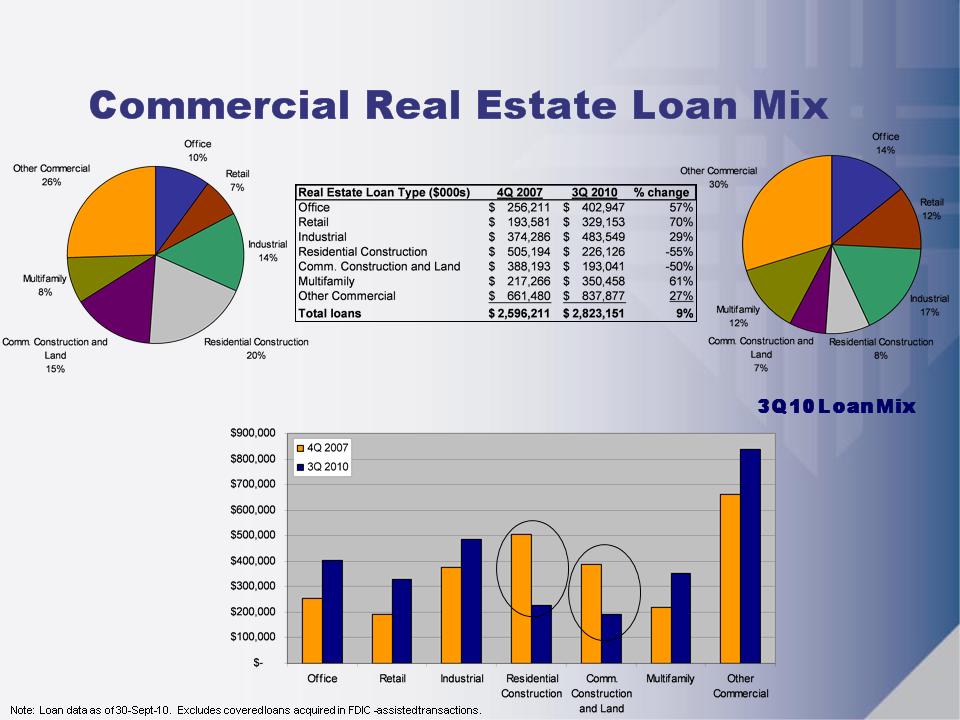
13
$2.8bn
2007 Loan Mix
$2.6bn
14
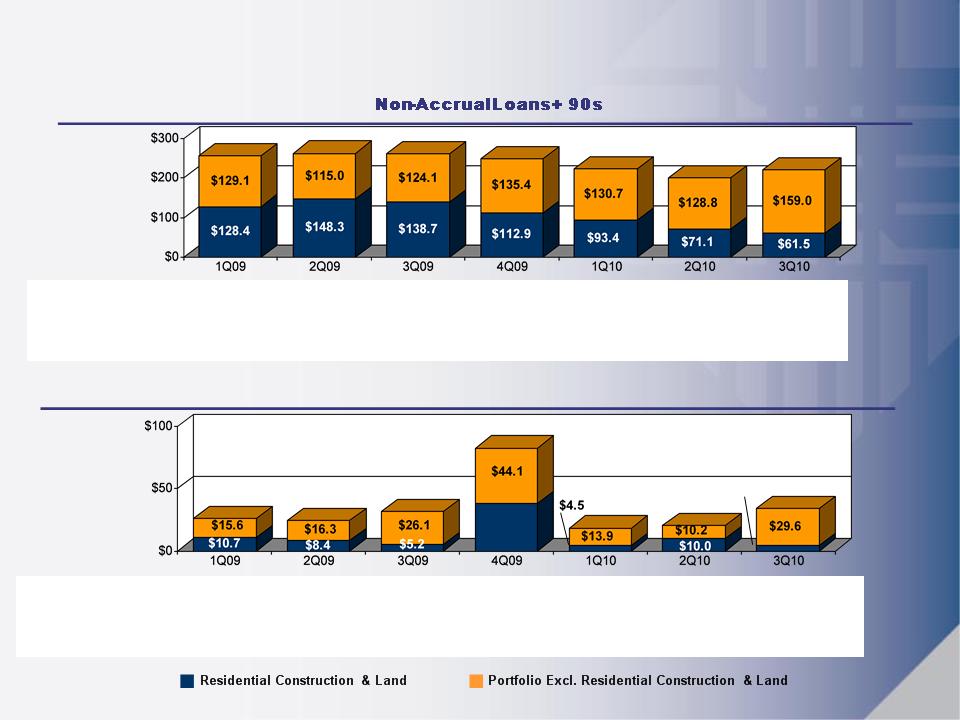
Net Charge-Offs
Note: Excludes covered loans acquired in FDIC-assisted transactions.
|
NALs + 90s / Loans
|
|
|
|
|
|
|
Residential Construction & Land
|
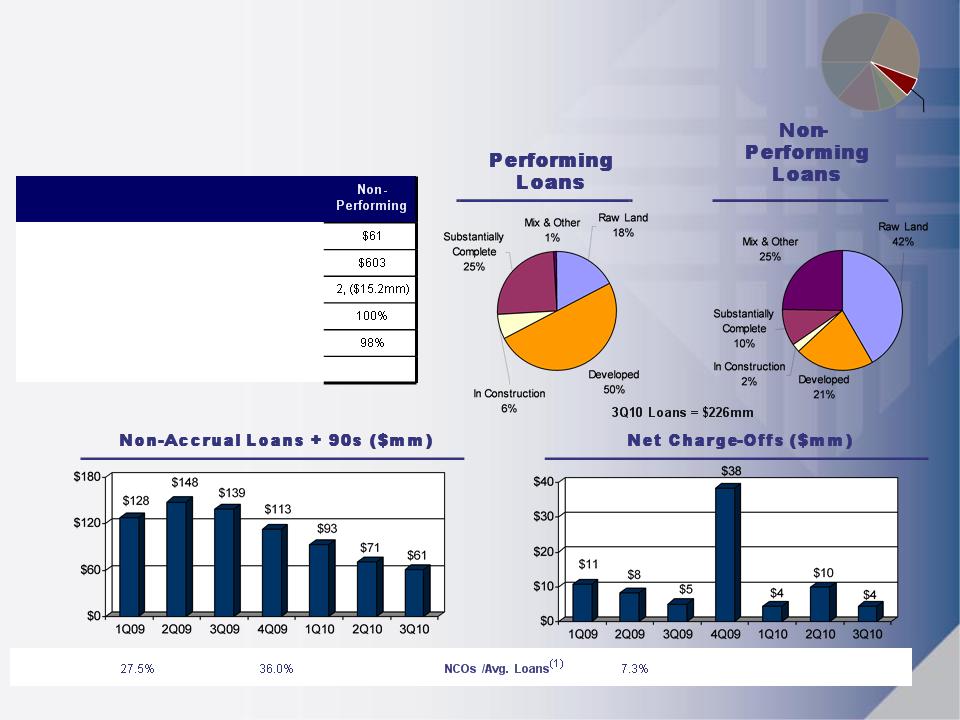
27.5
% |
32.3%
|
34.6%
|
36.0%
|
33.8% 29.7% 27.2%
|
|
Portfolio Excl. Resi. Const. & Land
|
2.6%
|
2.4%
|
2.5%
|
2.8%
|
2.7% 2.6% 3.2%
|
|
Total
|
4.8%
|
4.9%
|
5.0%
|
4.8%
|
4.3% 3.8% 4.3%
|
|
NCOs / Avg. Loans - Annualized
|
|
|
|
|
|
|
Residential Construction & Land
|
8.91%
|
7.31%
|
4.78%
|
42.55%
|
6.00% 14.97% 7.44%
|
|
Portfolio Excl. Resi. Const. & Land
|
1.29%
|
1.33%
|
2.10%
|
3.54%
|
1.15% 0.83% 2.36%
|
|
Total
|
1.98%
|
1.85%
|
2.32%
|
6.17%
|
1.43% 1.56% 2.59%
|
$257.5
$263.3
$262.8
$248.3
$82.4
$38.3
$24.7
$26.3
$224.1
$18.4
$200.0
$20.2
$220.5
$31.3
$34.0
$4.4
Historical Credit Performance
15
4%
|
|
Performing
|
|
|
Size of Portfolio ($mm)
|
$165
|
|
|
Median Loan Size ($000s)
|
$189
|
|
|
Loans > $5mm, (Total Value)
|
2, ($16.0mm)
|
|
|
% of Loans In-Market
|
96%
|
|
|
% with Current (<1 yr.) Appraisal
|
66%
|
|
|
% Maturing in 1 Year
|
75%
|
NM
|
|
NALs + 90s /
Loans |
32.3%
|
34.6%
|
33.8% 29.7% 27.2%
|
8.9%
|
4.8%
|
42.6%
|
6.0% 15.0% 7.4%
|
Note: Loan data as of 30-Sept-10.
¹ Annualized
Residential Construction
16
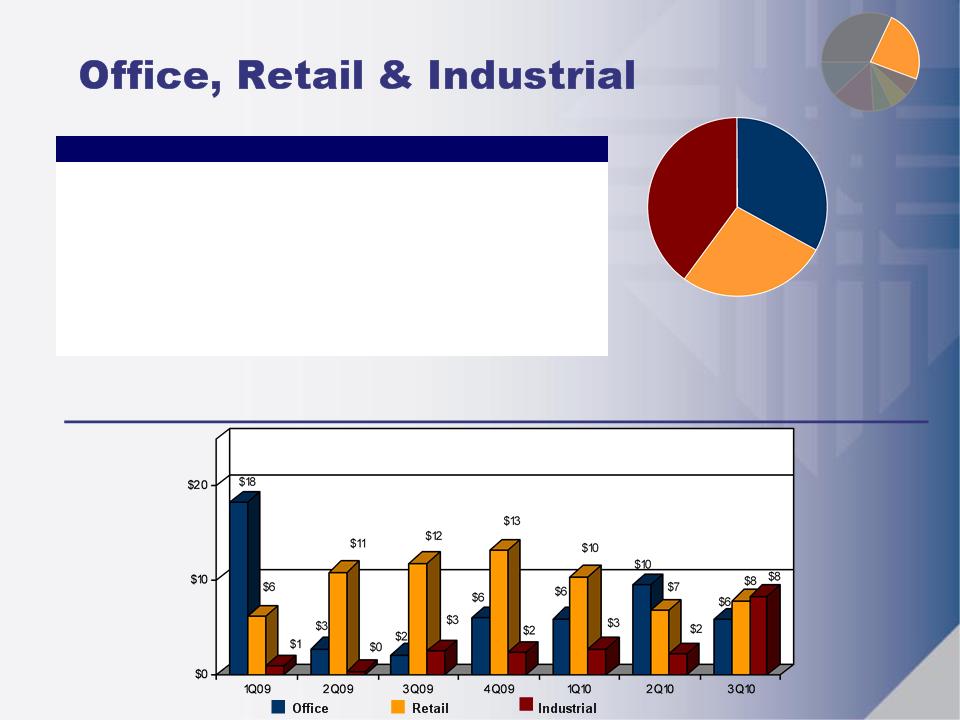
|
|
Office
|
Retail
|
Industrial
|
|
Size of Portfolio ($mm)
|
$403
|
$329
|
$484
|
|
% Performing Loans Maturing Pre- 2012
|
33%
|
29%
|
25%
|
|
Median Loan Size ($000s)
|
$287
|
$314
|
$428
|
|
Loans > $5mm, (Total Value)
|
18, ($142mm)
|
10, ($91mm)
|
12, ($87mm)
|
|
Owner Occupied
|
30%
|
20%
|
40%
|
|
% of Loans In-Market
|
93%
|
96%
|
96%
|
|
NCOs YTD ($000s)
|
$1,586
|
$4,366
|
$870
|
|
NCO / Avg. Loans (Annualized)
|
53bps
|
179bps
|
25bps
|
Non-Accrual Loans + 90s ($mm)
3Q10 Loans: $1.2bn
Office
33%
33%
Retail
27%
27%
Industrial
40%
40%
24%
Note: Loan data as of 30-Sept-10.
17
$128.2
$64.2
$50.3
$42.0
$36.0
$38.3
$50.7
Note: Excludes covered loans acquired in FDIC-assisted transactions.
18
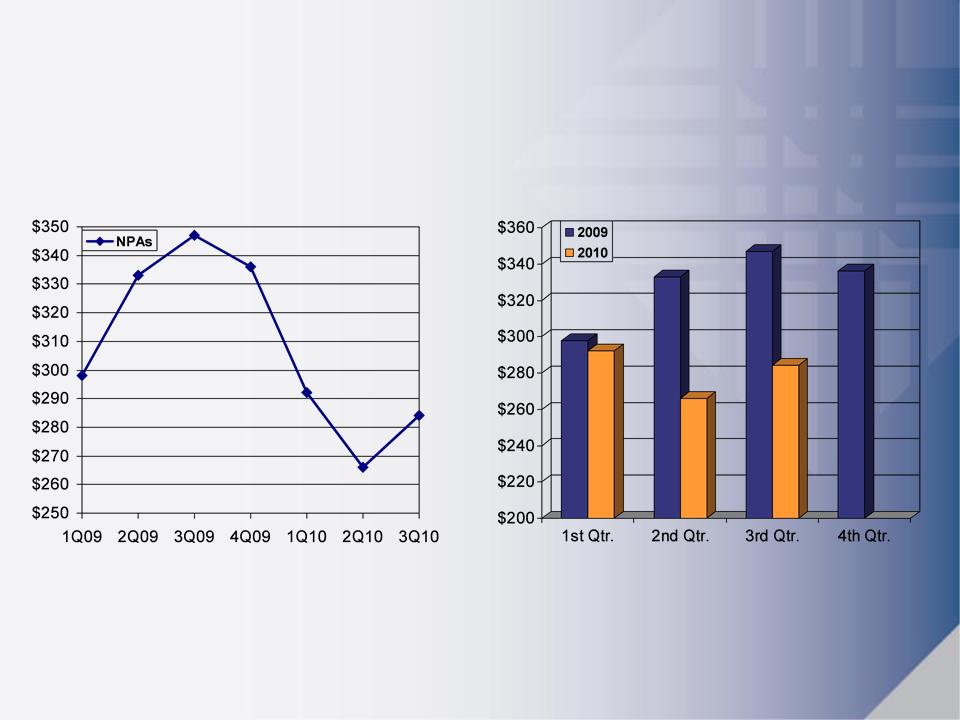
Levels Reflect Improvement; Influenced By Seasonality And Disposition Strategy
Quarterly
Year Over Year
Nonperforming Asset Trends
$s In Millions
$s In Millions

19
Addressing Reality of Credit Cycle
Problems Concentrated In Residential Construction
Reflects Illiquidity Of Suburban Market
Performance Influenced By Sales And Property Values
Portfolio Exposure Reduced
Credit Pressure Shifting
Cash Flowing Properties
Influenced By Consumer Demand
Continued Investment In Remediation
Focus On Reducing NPA Levels
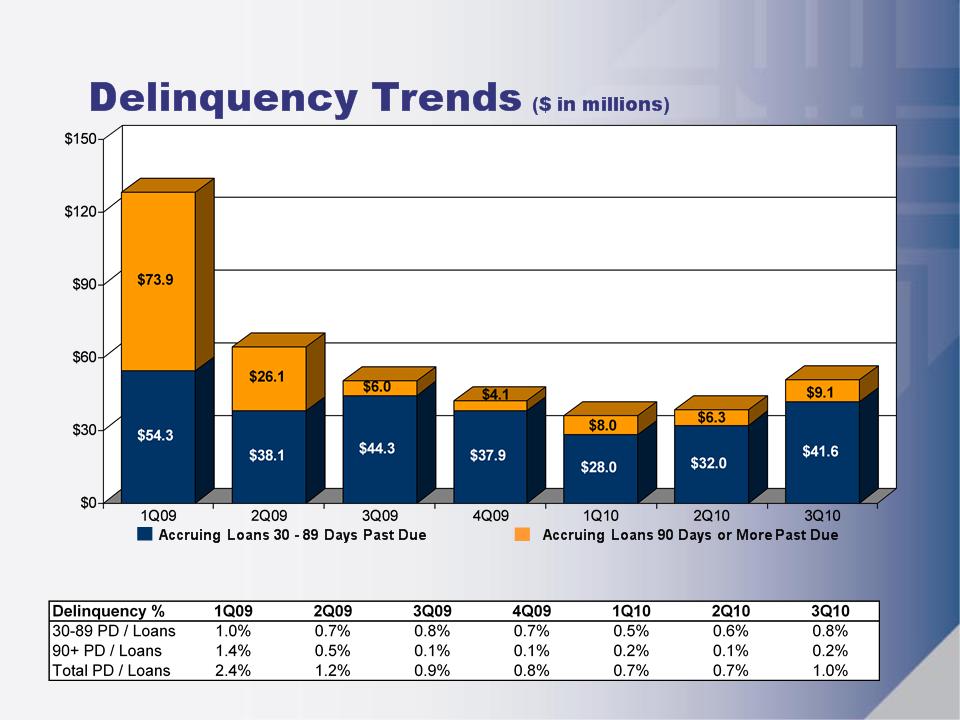
30 - 89 Day Delinquencies Down 6% From 3Q09
Adjusting Carrying Values To Market And Disposition Strategy
Continued Progress Influenced By Market Liquidity
20
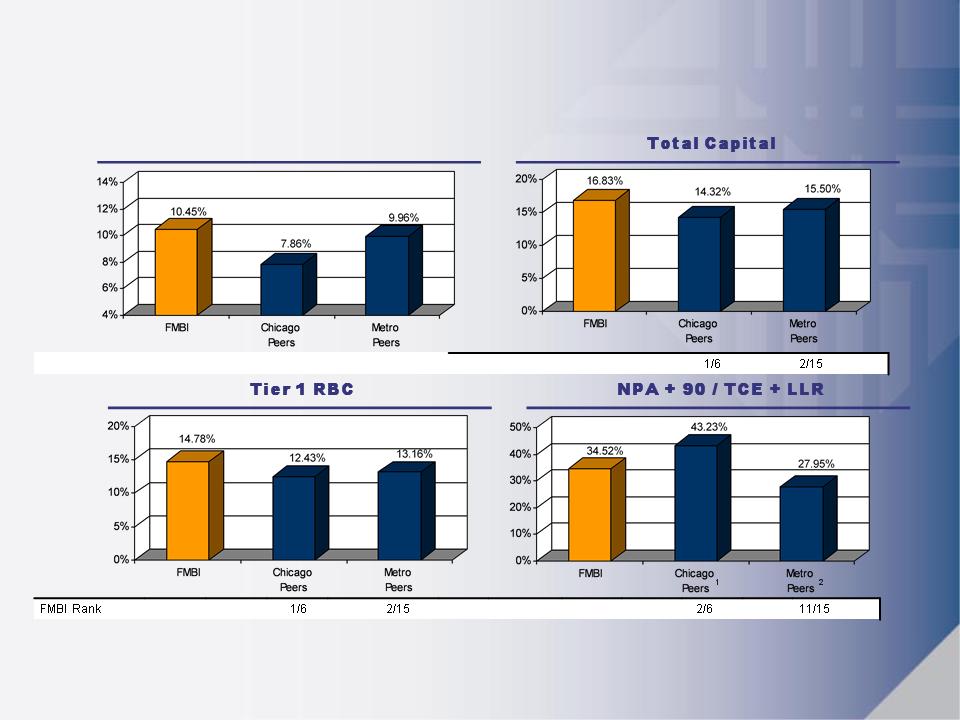
Leading Capital Foundation
First Midwest vs. Peers
First Midwest vs. Peers
Source: company data and SNL Financial. FMBI as of a 30-Sept-10 and other companies as of 30-Jun-10. FMBI Tier 1 Common excludes equity credit allocated to TARP warrants.
1 Chicago Peers based on median of MBFI, OSBC, PVTB, TAYC and WTFC.
2 Metro Peers based on median of CATY, CBSH, CFR, FCF, FMER, FULT, MBFI, ONB, PVTB, SUSQ, UMPQ, VLY, WTFC, and WTNY.
Tier 1 Common
|
FMBI Rank
|
|
|
1/6
|
6/15
|
|
|
1
1
1
2
2
2

21
21
Market Opportunities

22
11 10 10 14 14
Market Disruption
Environment Creates Opportunities
Within Chicago Market
~ 40 Failures Since Start Of 2009
~ 45 Institutions ($14 Billion) With Texas Ratio > 100%
Well Positioned To Benefit
Strong Capital Position
Solid Reputation: In Marketplace 70+ Years
Tenured Sales Force
Experienced Management

23
11 10 10 14 14
Acquisition Opportunities
Selective Criteria
Strategically And Financially Accretive
Ability To Strengthen The Company
Leverages Our Skills
Local Market Knowledge
Experienced And Successful Acquirer
7 Deals, $2.7bn Since 2003
FDIC Becoming More Competitive
Deals Likely Smaller
Eventual Shift From Assisted To Unassisted
23

24
24
|
Acquisition
|
Date
|
Deposit
s |
Core
(1) |
Loans
|
Branche
s |
~
House -holds
|
Pre-
Tax Gain
|
|
First DuPage
|
4Q09
|
$232
|
26%
|
$212
|
1
|
3,000
|
$13
|
|
Peotone Bank
And Trust |
2Q10
|
$84
|
73%
|
$53
|
2
|
4,000
|
$4
|
|
Palos Bank
And Trust |
3Q10
|
$462
|
47%
|
$297
|
5
|
18,000
|
$0
|
|
Total
|
|
$778
|
|
$562
|
8
|
25,000
|
$17
|
Acquisitions Made
(1) Defined as total deposits less time deposits.
Expanded Footprint, Financially Accretive,
Solid Deposit Retention (90+%)
All dollar amounts in millions.

25
25
Why First Midwest

26
Manage Through Credit Cycle
Continued Remediation Focus
Manage Capital And Changing Regulatory Environment
Position For Long-term Success
Investment In Sales
Expand Market Presence
Pursue Growth Opportunities
Priorities for 2010

27
Positioned For Long-term Success
Why First Midwest
Strong Core
Working Through Cycle
Solid Capital; Liquidity
Experienced Team
Market Opportunities Available

28
Questions?
28

29
29

30
30
Appendix
31
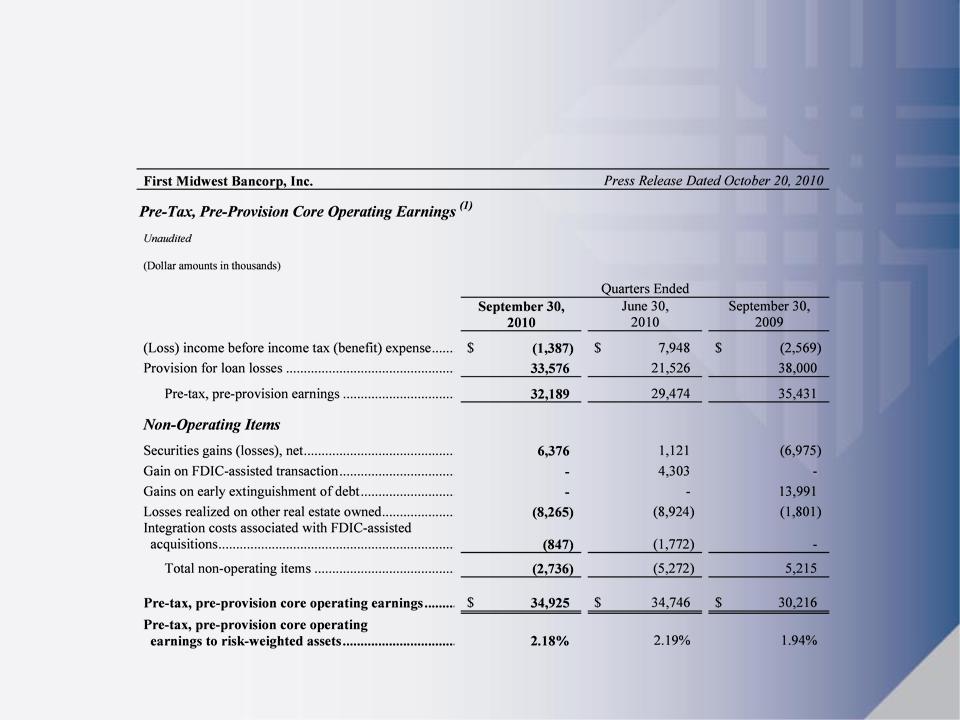
Reconciliation of Non-GAAP Measures
($ in 000s)
($ in 000s)