Attached files
| file | filename |
|---|---|
| 8-K - FORM 8-K - CTS CORP | c61249e8vk.htm |
Exhibit 99.1

| Investor Presentation ? November 2010 |
| Safe Harbor Statement This presentation contains statements that are, or may be deemed to be, forward-looking statements within the meaning of the Private Securities Litigation Reform Act of 1995. These forward-looking statements include, but are not limited to, any financial or other guidance, statements that reflect our current expectations concerning future results and events and any other statements that are not based solely on historical fact. Readers are cautioned not to place undue reliance on these forward- looking statements, which speak only as of the date hereof and are based on various assumptions as to future events, the occurrence of which necessarily are subject to uncertainties. These forward-looking statements are made subject to risks, uncertainties and other factors, which could cause our actual results, performance or achievements to differ materially from those presented in the forward-looking statements, including, without limitation: changes in the economy generally and in respect to the businesses in which CTS operates; pricing pressures and reduction in demand for CTS' products, especially if economic conditions do not recover or continue to worsen in CTS' served markets, including but not limited to: the automotive, computer equipment or communications markets; disruption, uncertainty or volatility in the credit markets that could adversely impact the availability of credit already arranged by CTS and the availability and cost of credit in the future; the financial condition of our customers, including the ability of customers (especially those that may be highly leveraged and those with inadequate liquidity) to maintain their credit availability or ongoing viability; risks associated with CTS' international operations, including trade and tariff barriers; currency fluctuations and their effects on our results of operations and financial position; changes in performance of equity and debt markets that could affect the valuation of the assets in CTS' pension plans and the accounting for pension assets, liabilities and expenses; political and geopolitical risks; rapid technological change in the automotive, communications and computer industries; reliance on key customers; CTS' ability to protect its intellectual property; and potential costs and liabilities related to the recent Toyota recall. For more detailed information on the risks and uncertainties associated with CTS' business, see the reports CTS files with the Securities and Exchange Commission available at http://www.ctscorp.com/investor_relations/investor.htm. CTS undertakes no obligation to publicly update its forward-looking statements to reflect new information or events or circumstances that arise after the date hereof, including market or industry changes. |
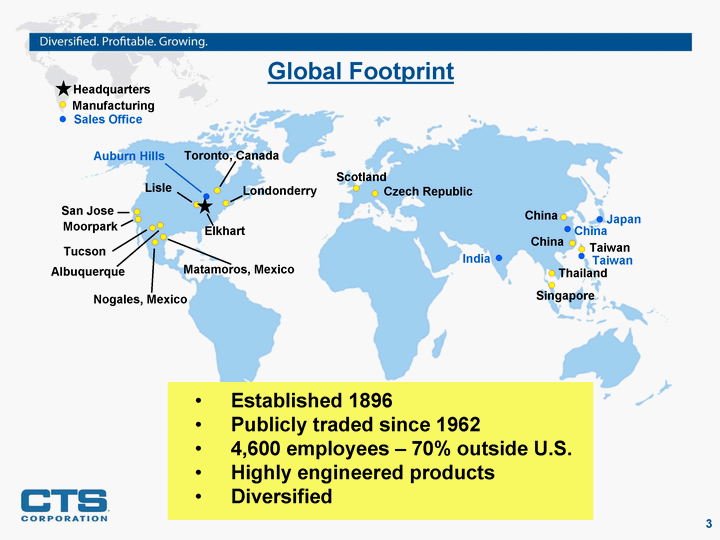
| Global Footprint San Jose Moorpark Matamoros, Mexico Nogales, Mexico Elkhart Lisle Londonderry Toronto, Canada Albuquerque Tucson Scotland Czech Republic Thailand Singapore Taiwan China China India Auburn Hills Japan China Taiwan Sales Office Manufacturing Headquarters Established 1896 Publicly traded since 1962 4,600 employees - 70% outside U.S. Highly engineered products Diversified |
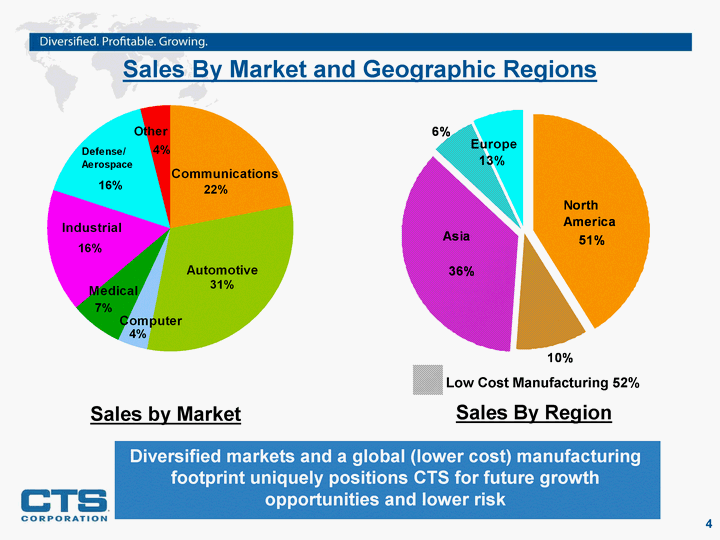
| Sales By Market and Geographic Regions Comunications Automotive Computer Medical Industrial Defense & Aerospace Other East 0.22 0.31 0.04 0.07 0.16 0.16 0.04 Sales by Market North America Asia E Low Cost Europe East 0.41 0.1 0.36 0.06 0.07 Sales By Region Low Cost Manufacturing 52% Diversified markets and a global (lower cost) manufacturing footprint uniquely positions CTS for future growth opportunities and lower risk |
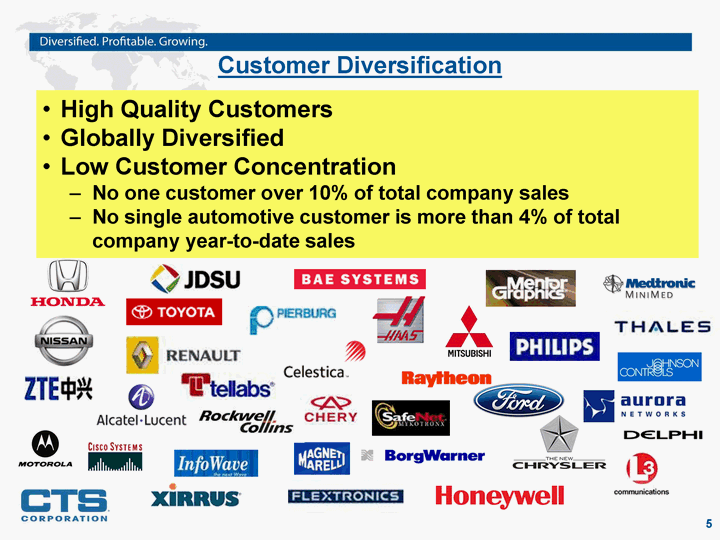
| Customer Diversification High Quality Customers Globally Diversified Low Customer Concentration No one customer over 10% of total company sales No single automotive customer is more than 4% of total company year-to-date sales |
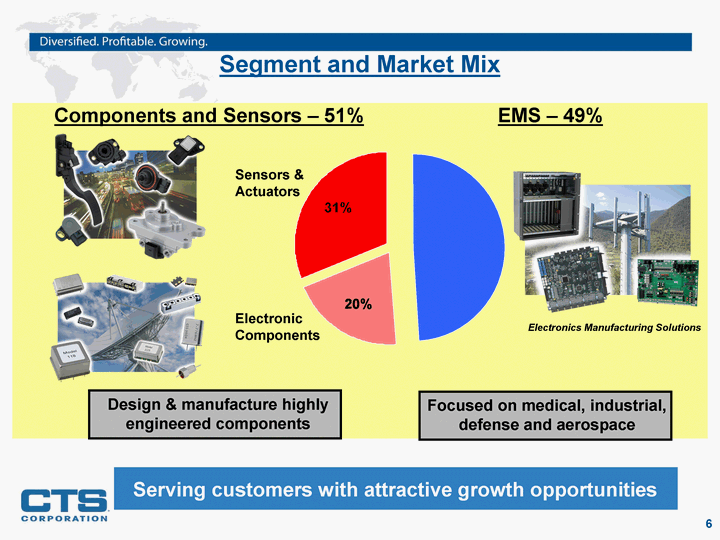
| Segment and Market Mix 1st Qtr 2nd Qtr 3rd Qtr 4th Qtr East 0.49 0.51 West North Components and Sensors - 51% 1st Qtr EC Auto East 0.49 0.2 0.31 West North EMS - 49% Sensors & Actuators Electronic Components Serving customers with attractive growth opportunities Focused on medical, industrial, defense and aerospace Design & manufacture highly engineered components Electronics Manufacturing Solutions |
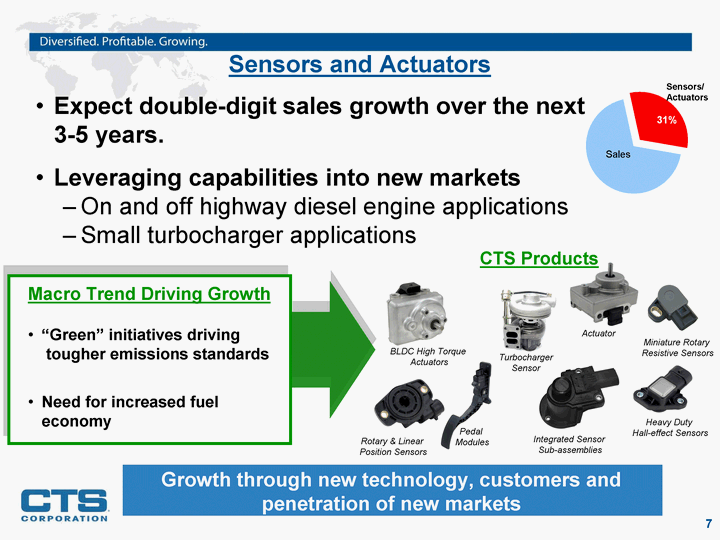
| Sensors and Actuators Expect double-digit sales growth over the next 3-5 years. Leveraging capabilities into new markets On and off highway diesel engine applications Small turbocharger applications Growth through new technology, customers and penetration of new markets Sales Sensors & Actuators Auto 0.69 0.31 Sensors/ Actuators Macro Trend Driving Growth "Green" initiatives driving tougher emissions standards Need for increased fuel economy CTS Products Actuator Sales Rotary & Linear Position Sensors BLDC High Torque Actuators Heavy Duty Hall-effect Sensors Pedal Modules Miniature Rotary Resistive Sensors Integrated Sensor Sub-assemblies Turbocharger Sensor |
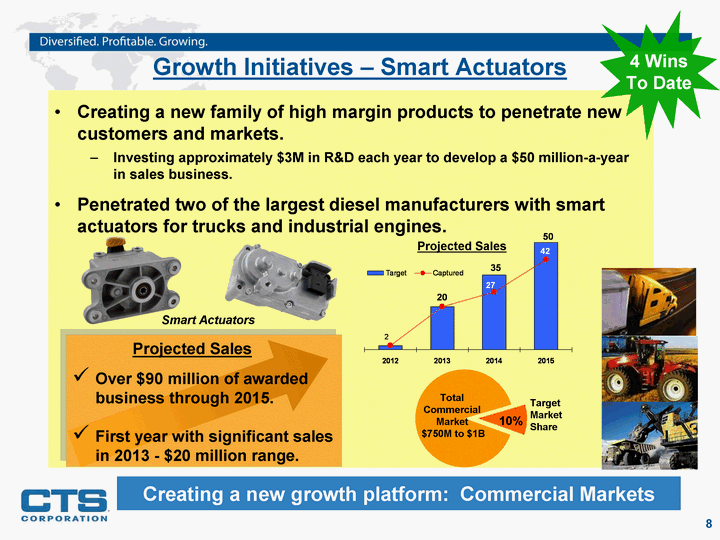
| Growth Initiatives - Smart Actuators Creating a new growth platform: Commercial Markets Target Market Share Creating a new family of high margin products to penetrate new customers and markets. Investing approximately $3M in R&D each year to develop a $50 million-a-year in sales business. Penetrated two of the largest diesel manufacturers with smart actuators for trucks and industrial engines. 1st Qtr 2nd Qtr East 0.9 0.1 Total Commercial Market $750M to $1B 10% 4 Wins To Date Smart Actuators Projected Sales Over $90 million of awarded business through 2015. First year with significant sales in 2013 - $20 million range. 2012 2013 2014 2015 Target 2 20 35 50 Captured 2 20 27 42 Projected Sales |
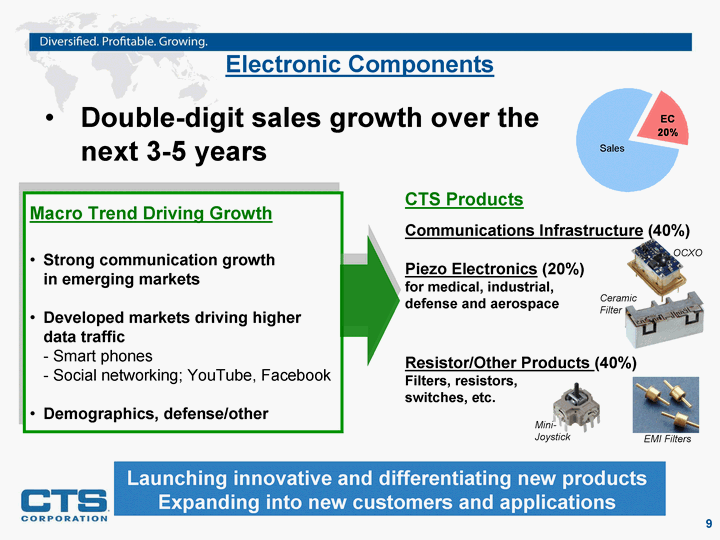
| Electronic Components Double-digit sales growth over the next 3-5 years Macro Trend Driving Growth Strong communication growth in emerging markets Developed markets driving higher data traffic - Smart phones - Social networking; YouTube, Facebook Demographics, defense/other CTS Products Communications Infrastructure (40%) Piezo Electronics (20%) for medical, industrial, defense and aerospace Sales EC EC 0.8 0.2 EMI Filters OCXO Ceramic Filter Launching innovative and differentiating new products Expanding into new customers and applications Sales Resistor/Other Products (40%) Filters, resistors, switches, etc. Mini- Joystick |
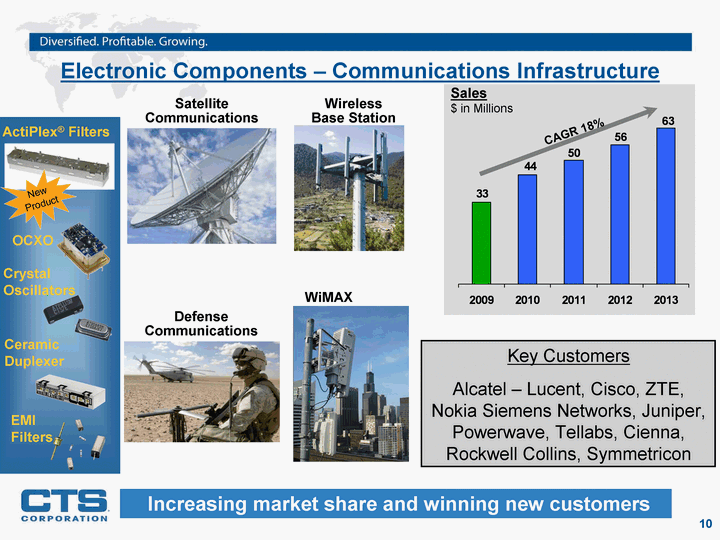
| Electronic Components - Communications Infrastructure OCXO Ceramic Duplexer Defense Communications Wireless Base Station 2004 2005 2006 2007 2008 2009 2010 2011 2012 2013 Design Wins 31 37 41 45 48 33 44 50 56 63 Sales $ in Millions Key Customers Alcatel - Lucent, Cisco, ZTE, Nokia Siemens Networks, Juniper, Powerwave, Tellabs, Cienna, Rockwell Collins, Symmetricon CAGR 18% Increasing market share and winning new customers Satellite Communications WiMAX EMI Filters Crystal Oscillators ActiPlex(r) Filters New Product |
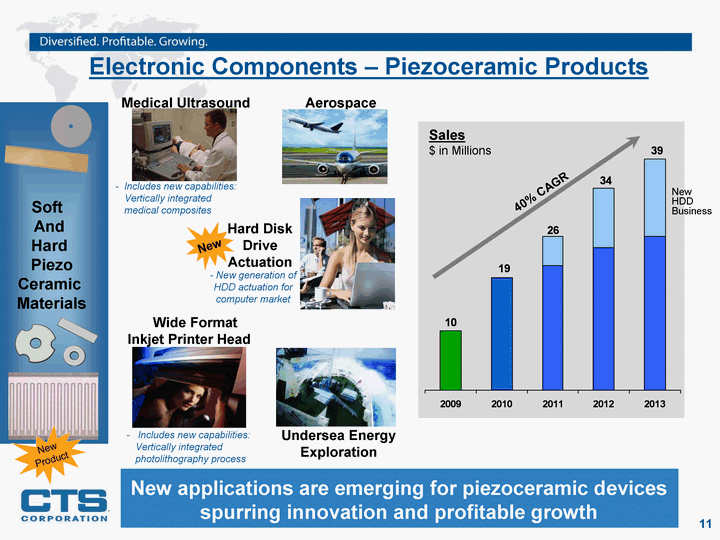
| Electronic Components - Piezoceramic Products 2005 2006 2007 2008 2009 2010 2011 2012 2013 Sales 10 13 13 18 10 19 21 24 26 New HDD Business 0 5 10 13 Sales $ in Millions Medical Ultrasound Wide Format Inkjet Printer Head Undersea Energy Exploration Aerospace Soft And Hard Piezo Ceramic Materials New HDD Business 40% CAGR New applications are emerging for piezoceramic devices spurring innovation and profitable growth Hard Disk Drive Actuation New - New generation of HDD actuation for computer market - Includes new capabilities: Vertically integrated medical composites - Includes new capabilities: Vertically integrated photolithography process New Product |
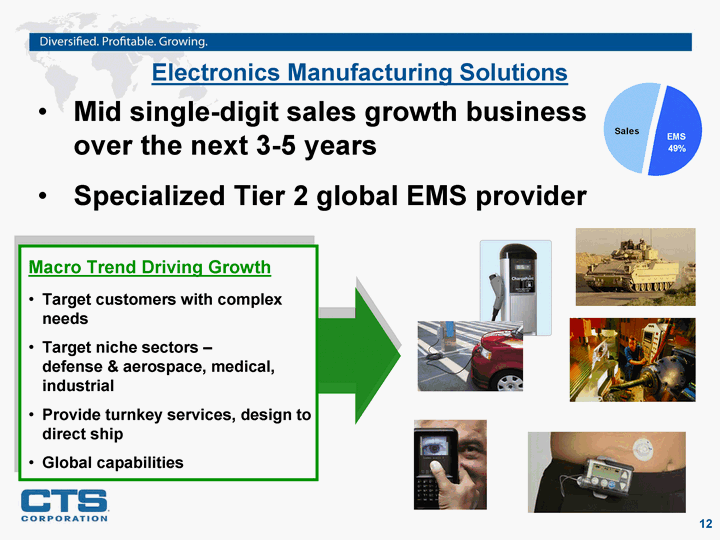
| Electronics Manufacturing Solutions Mid single-digit sales growth business over the next 3-5 years Specialized Tier 2 global EMS provider Sales EMS EC 0.51 0.49 Macro Trend Driving Growth Target customers with complex needs Target niche sectors - defense & aerospace, medical, industrial Provide turnkey services, design to direct ship Global capabilities |
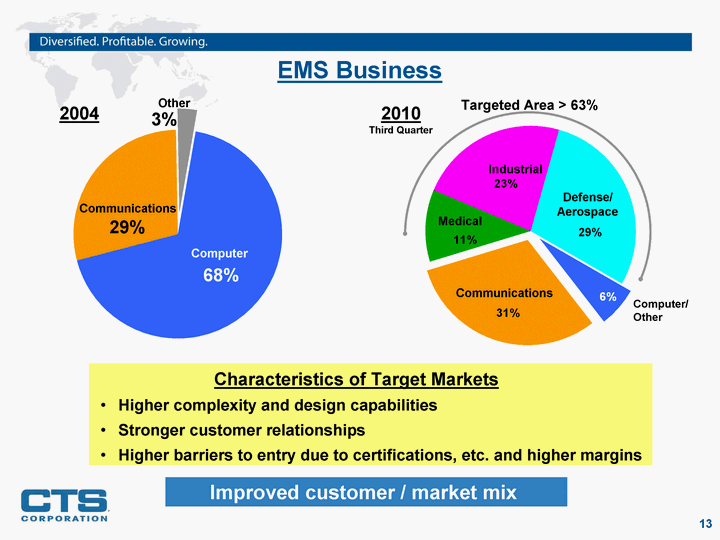
| EMS Business Computer Comm Medical Industrial Aero/Def East 0.06 0.31 0.11 0.23 0.29 Communications Industrial Medical Computer/ Other 2010 Third Quarter Defense/ Aerospace Higher complexity and design capabilities Stronger customer relationships Higher barriers to entry due to certifications, etc. and higher margins Improved customer / market mix Computer Communication Other East 0.68 0.29 0.03 Computer Communications Other 68% 29% 3% 2004 Characteristics of Target Markets Targeted Area > 63% |
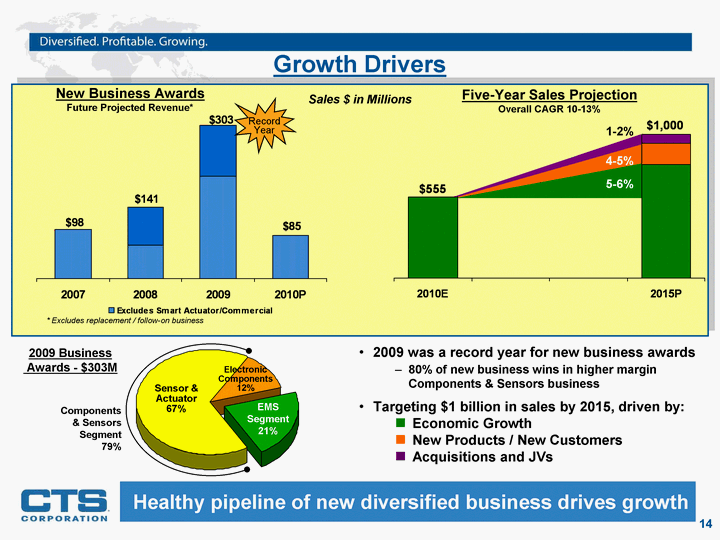
| Growth Drivers Sensor & Actuator Electronic Components EMS East 0.67 0.12 0.21 Sensor & Actuator 67% Electronic Components 12% EMS Segment 21% Healthy pipeline of new diversified business drives growth Components & Sensors Segment 79% 2007 2008 2009 2010P Excludes Smart Actuator/Commercial 98 66 203 85 Business Awards 75 100 New Business Awards Future Projected Revenue* Sales $ in Millions * Excludes replacement / follow-on business Five-Year Sales Projection Overall CAGR 10-13% 2009 Business Awards - $303M Record Year 2009 was a record year for new business awards 80% of new business wins in higher margin Components & Sensors business Targeting $1 billion in sales by 2015, driven by: Economic Growth New Products / New Customers Acquisitions and JVs 2010E 2015P Business Awards 555 777 150 60 5-6% 4-5% 1-2% |
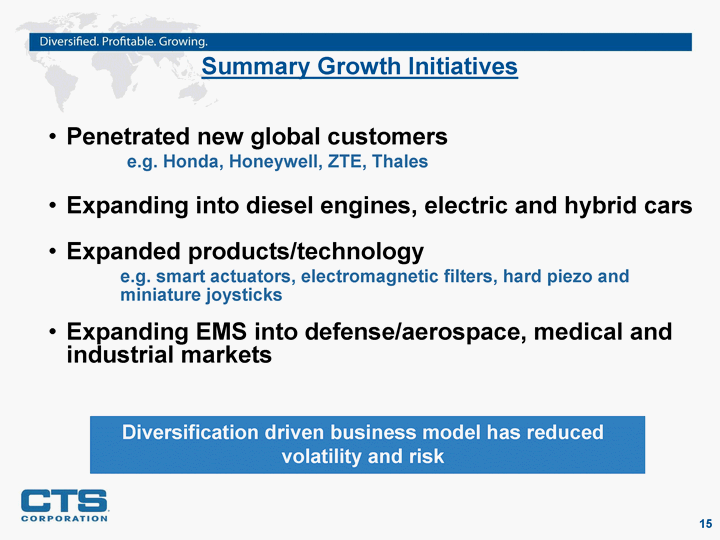
| Summary Growth Initiatives Diversification driven business model has reduced volatility and risk Penetrated new global customers e.g. Honda, Honeywell, ZTE, Thales Expanding into diesel engines, electric and hybrid cars Expanded products/technology e.g. smart actuators, electromagnetic filters, hard piezo and miniature joysticks Expanding EMS into defense/aerospace, medical and industrial markets |
| Financial Summary Definitions and reconciliation of non-GAAP financial terms are included on CTS' Web site at www.ctscorp.com |
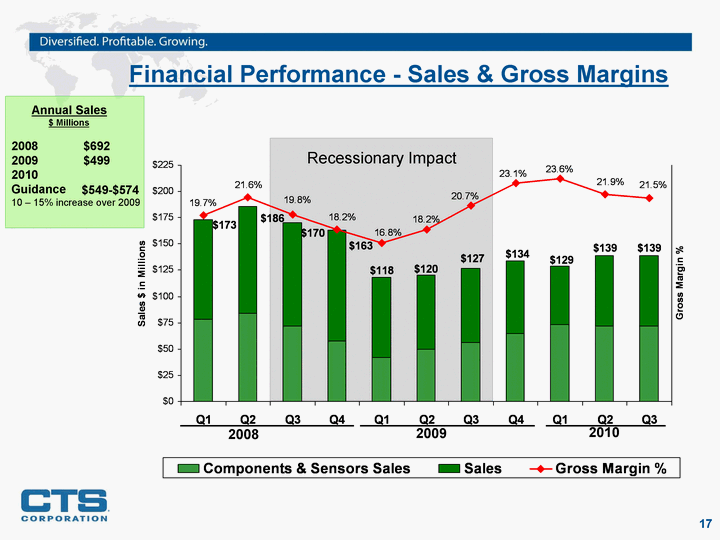
| Financial Performance - Sales & Gross Margins Q1 Q2 Q3 Q4 Q1 Q2 Q3 Q4 Q1 Q2 Q3 Components & Sensors Sales 78 84 72 58 42 50 56 65 73 72 72 Sales 95 102 98 105 76 70 71 69 56 67 67 Gross Margin % 0.197 0.216 0.198 0.182 0.168 0.182 0.207 0.231 0.236 0.219 0.215 2008 2009 2010 Recessionary Impact 2008 $692 2009 $499 2010 Guidance 10 - 15% increase over 2009 $549-$574 Annual Sales $ Millions |
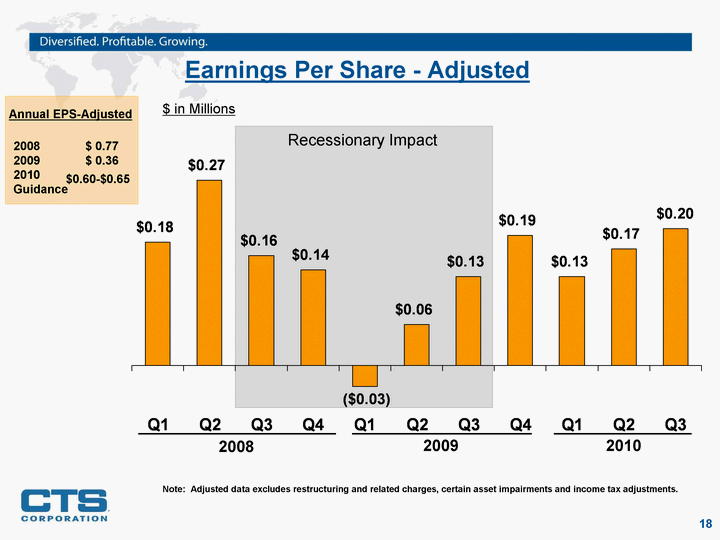
| Earnings Per Share - Adjusted Q1 Q2 Q3 Q4 Q1 Q2 Q3 Q4 Q1 Q2 Q3 East 0.18 0.27 0.16 0.14 -0.03 0.06 0.13 0.19 0.13 0.17 0.2 Recessionary Impact 2008 2009 2010 Note: Adjusted data excludes restructuring and related charges, certain asset impairments and income tax adjustments. $ in Millions 2008 $ 0.77 2009 $ 0.36 2010 Guidance $0.60-$0.65 Annual EPS-Adjusted |
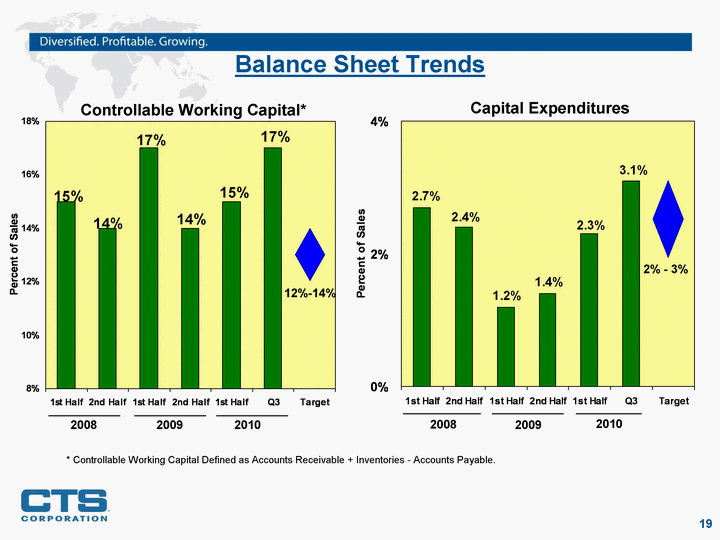
| Balance Sheet Trends 1999 2000 2001 2002 1st Half 2nd Half 1st Half 2nd Half 1st Half Q3 Target Capital Expenditures 0.049 0.138 0.134 0.028 0.027 0.024 0.012 0.014 0.023 0.031 Capital Expenditures 1st Half 2nd Half 1st Half 2nd Half 1st Half Q3 Target Controllable Working Capital* 0.15 0.14 0.17 0.14 0.15 0.17 Controllable Working Capital* * Controllable Working Capital Defined as Accounts Receivable + Inventories - Accounts Payable. 2% - 3% 12%-14% 2008 2009 2010 2008 2009 2010 |
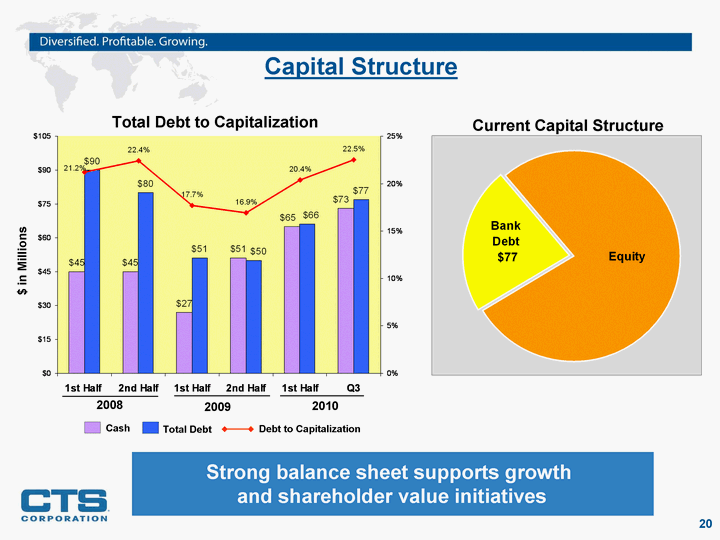
| Capital Structure Strong balance sheet supports growth and shareholder value initiatives Current Capital Structure Total Debt to Capitalization 1st Half 2nd Half 1st Half 2nd Half 1st Half Q3 Cash 45 45 27 51 65 73 Debt 90 80 51 50 66 77 % 0.212 0.224 0.177 0.169 0.204 0.225 $ in Millions Total Debt Cash Debt to Capitalization Equity Bank Debt Adjusted Working Capital 265 77 2008 2009 2010 |
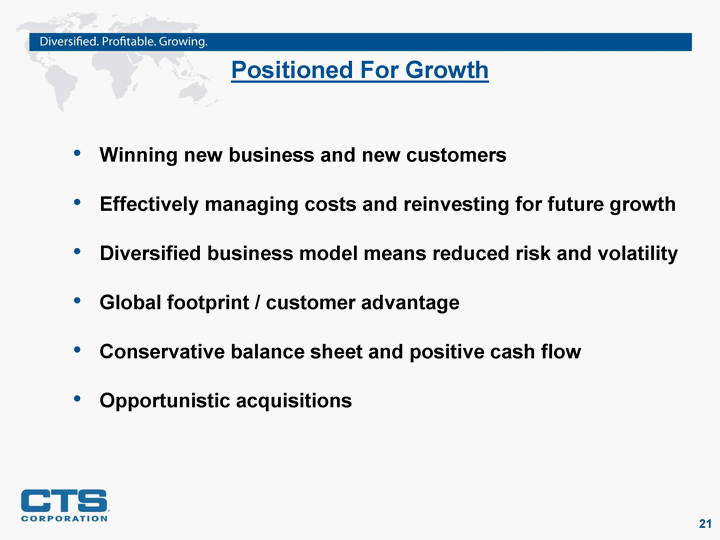
| Positioned For Growth Winning new business and new customers Effectively managing costs and reinvesting for future growth Diversified business model means reduced risk and volatility Global footprint / customer advantage Conservative balance sheet and positive cash flow Opportunistic acquisitions |
| Appendix |
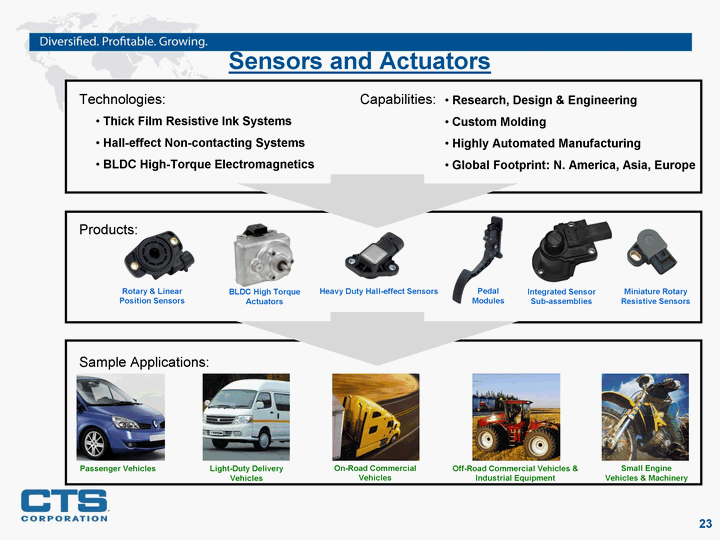
| Sample Applications: Products: Sensors and Actuators Technologies: Thick Film Resistive Ink Systems Hall-effect Non-contacting Systems BLDC High-Torque Electromagnetics Capabilities: Research, Design & Engineering Custom Molding Highly Automated Manufacturing Global Footprint: N. America, Asia, Europe Pedal Modules Miniature Rotary Resistive Sensors BLDC High Torque Actuators Rotary & Linear Position Sensors Integrated Sensor Sub-assemblies Heavy Duty Hall-effect Sensors Passenger Vehicles Light-Duty Delivery Vehicles On-Road Commercial Vehicles Off-Road Commercial Vehicles & Industrial Equipment Small Engine Vehicles & Machinery |
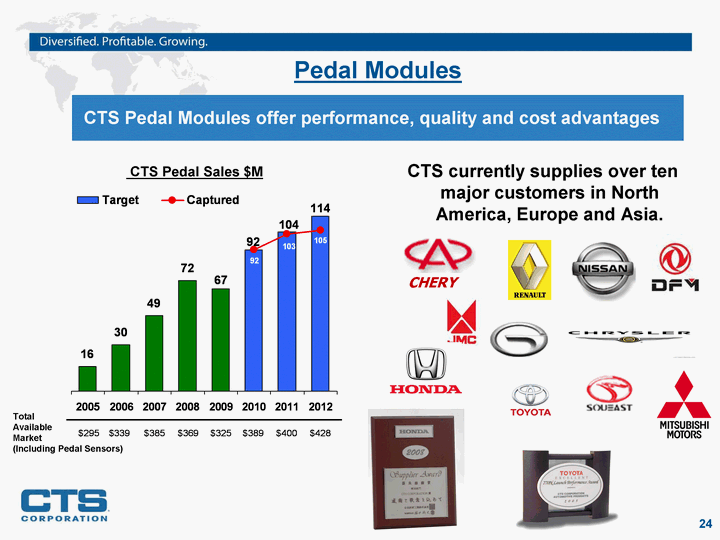
| Total Available Market (Including Pedal Sensors) Pedal Modules 2003 2004 2005 2006 2007 2008 2009 2010 2011 2012 Target 9 13 16 30 49 72 66.8 91.9 103.5 114 Captured 9 13 91.9 102.5 104.7 CTS Pedal Modules offer performance, quality and cost advantages CTS Pedal Sales $M CTS currently supplies over ten major customers in North America, Europe and Asia. CHERY |
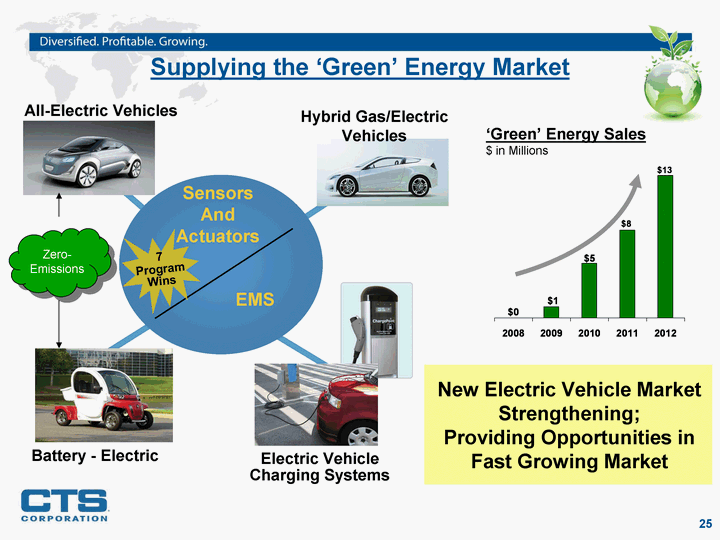
| Supplying the 'Green' Energy Market Sensors And Actuators EMS Battery - Electric All-Electric Vehicles Electric Vehicle Charging Systems 2008 2009 2010 2011 2012 Design Wins 0 1 5 8 13 'Green' Energy Sales $ in Millions New Electric Vehicle Market Strengthening; Providing Opportunities in Fast Growing Market Zero- Emissions Hybrid Gas/Electric Vehicles 7 Program Wins |
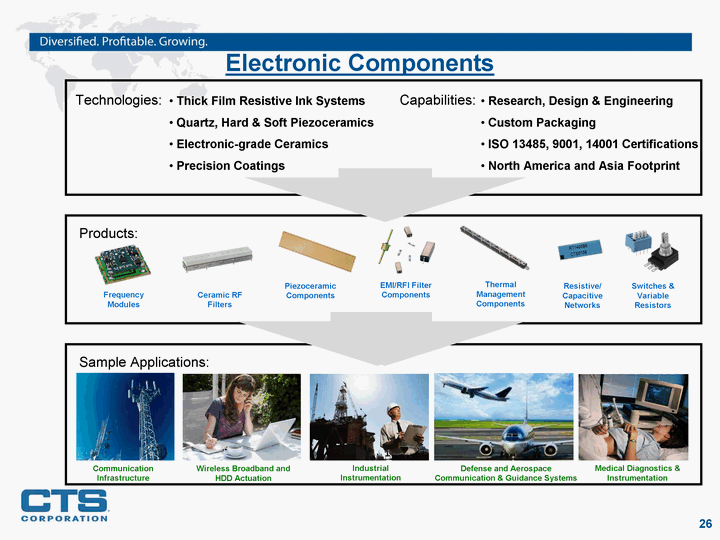
| Sample Applications: Products: Technologies: Thick Film Resistive Ink Systems Quartz, Hard & Soft Piezoceramics Electronic-grade Ceramics Precision Coatings Capabilities: Research, Design & Engineering Custom Packaging ISO 13485, 9001, 14001 Certifications North America and Asia Footprint Communication Infrastructure Wireless Broadband and HDD Actuation Industrial Instrumentation Defense and Aerospace Communication & Guidance Systems Medical Diagnostics & Instrumentation Electronic Components Thermal Management Components Ceramic RF Filters Piezoceramic Components EMI/RFI Filter Components Resistive/ Capacitive Networks Frequency Modules Switches & Variable Resistors |
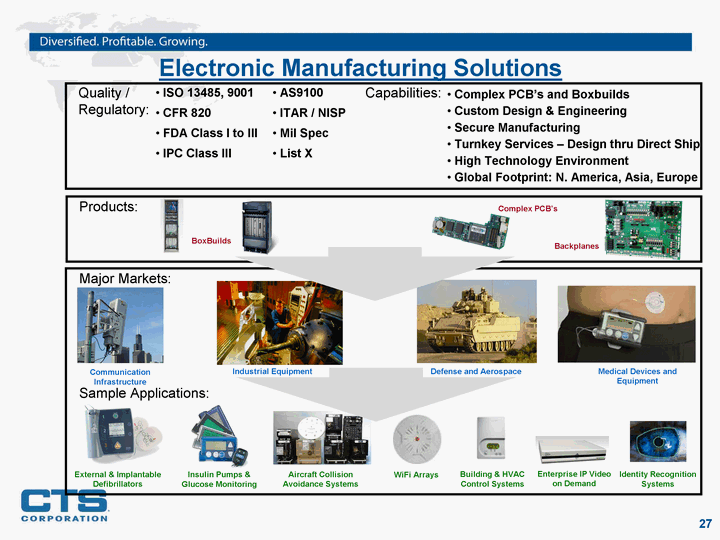
| Sample Applications: Major Markets: Quality / Regulatory: ISO 13485, 9001 CFR 820 FDA Class I to III IPC Class III Capabilities: Complex PCB's and Boxbuilds Custom Design & Engineering Secure Manufacturing Turnkey Services - Design thru Direct Ship High Technology Environment Global Footprint: N. America, Asia, Europe Communication Infrastructure Industrial Equipment Defense and Aerospace Medical Devices and Equipment Electronic Manufacturing Solutions AS9100 ITAR / NISP Mil Spec List X WiFi Arrays Building & HVAC Control Systems Identity Recognition Systems External & Implantable Defibrillators Insulin Pumps & Glucose Monitoring Enterprise IP Video on Demand Aircraft Collision Avoidance Systems Products: BoxBuilds Complex PCB's Backplanes |
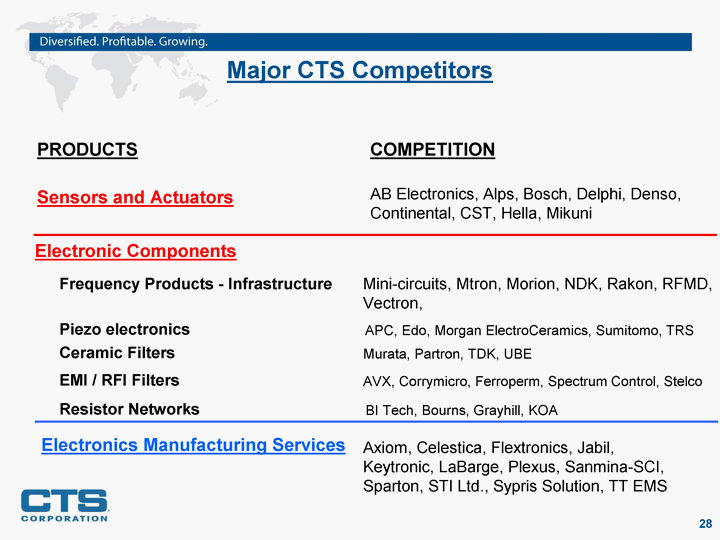
| Major CTS Competitors PRODUCTS Sensors and Actuators COMPETITION AB Electronics, Alps, Bosch, Delphi, Denso, Continental, CST, Hella, Mikuni Electronic Components Electronics Manufacturing Services Axiom, Celestica, Flextronics, Jabil, Keytronic, LaBarge, Plexus, Sanmina-SCI, Sparton, STI Ltd., Sypris Solution, TT EMS Frequency Products - Infrastructure Mini-circuits, Mtron, Morion, NDK, Rakon, RFMD, Vectron, Piezo electronics APC, Edo, Morgan ElectroCeramics, Sumitomo, TRS Ceramic Filters Murata, Partron, TDK, UBE EMI / RFI Filters AVX, Corrymicro, Ferroperm, Spectrum Control, Stelco BI Tech, Bourns, Grayhill, KOA Resistor Networks |
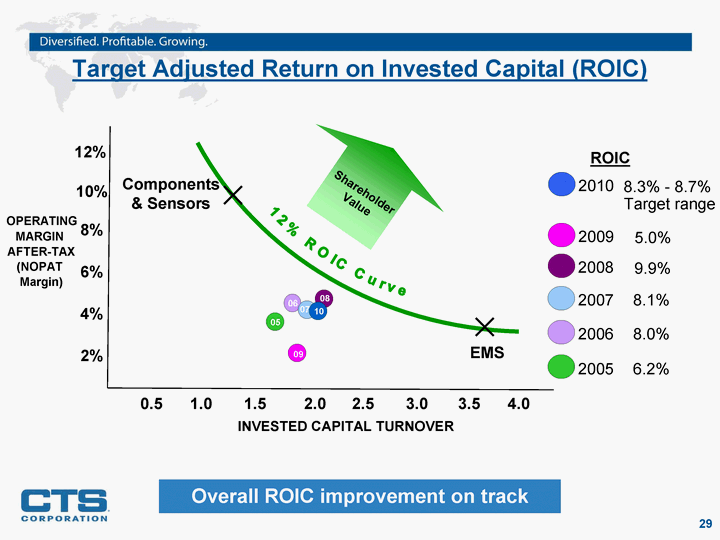
| Target Adjusted Return on Invested Capital (ROIC) OPERATING MARGIN AFTER-TAX (NOPAT Margin) INVESTED CAPITAL TURNOVER Overall ROIC improvement on track 2005 4% 2% 6% 8% 0.5 1.0 1.5 2.0 2.5 3.0 3.5 6.2% Shareholder Value ROIC 12% ROIC Curve 10% 12% 4.0 EMS Components & Sensors 8.0% 2006 8.1% 2007 2008 9.9% 2009 5.0% 2010 8.3% - 8.7% Target range 05 09 06 08 10 07 |
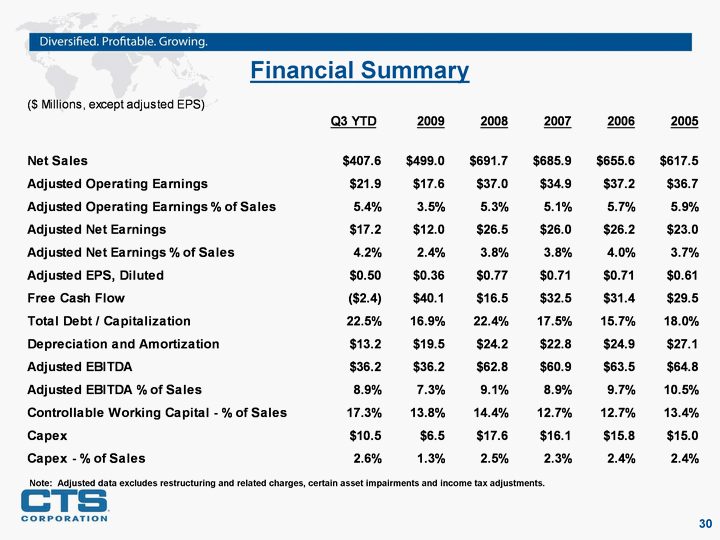
| Financial Summary Note: Adjusted data excludes restructuring and related charges, certain asset impairments and income tax adjustments. |
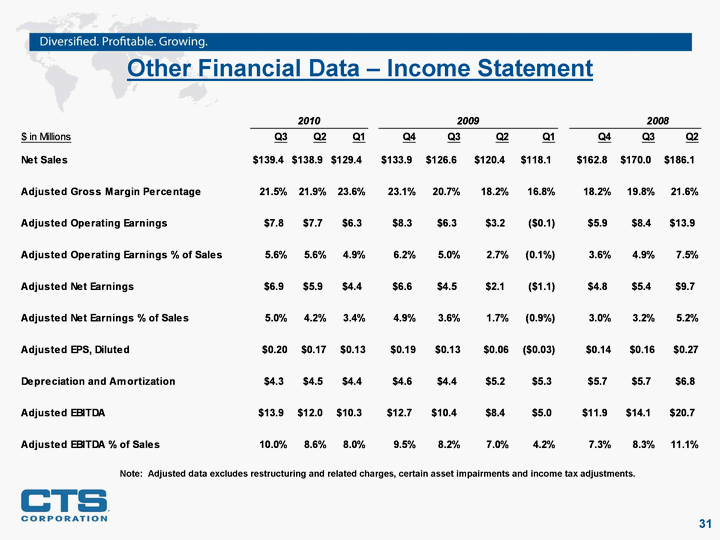
| Other Financial Data - Income Statement Note: Adjusted data excludes restructuring and related charges, certain asset impairments and income tax adjustments. |
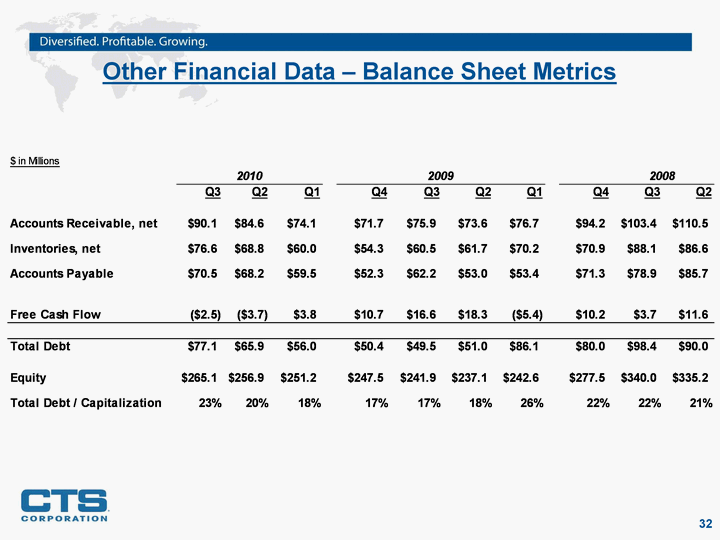
| Other Financial Data - Balance Sheet Metrics |
CTS Corporation
Reconciliation of Projected Full Year Earnings Per Share to Adjusted Projected Full Year Earnings Per Share
Reconciliation of Projected Full Year Earnings Per Share to Adjusted Projected Full Year Earnings Per Share
| Year Ended | Year Ended | Year Ended | Year Ended | Year Ended | ||||||||||||||||
| December 31, | December 31, | December 31, | December 31, | December 31, | ||||||||||||||||
| 2010(5) | 2009(4) | 2008(3) | 2007(2) | 2006 (1) | ||||||||||||||||
Projected full year GAAP earnings/(loss) per share |
$ | 0.60- $0.65 | ($1.02) - ($0.98 | ) | $ | 0.74- $0.79 | $ | 0.59 - $0.62 | $ | 0.66 - $0.69 | ||||||||||
Restructuring and related charges |
0.05 | 0.08 | 0.06 | 0.08 | ||||||||||||||||
Impact of tax expense associated with our cash repatriation |
0.27 | |||||||||||||||||||
Impact of reversal of tax reserves |
(0.11 | ) | ||||||||||||||||||
Impact of Goodwill Impairment |
0.97 | |||||||||||||||||||
Projected full year adjusted earnings per share |
$ | 0.60 - $0.65 | $ | 0.27 - $0.31 | $ | 0.71 - $0.76 | $ | 0.65 - $0.68 | $ | 0.74 - $0.77 | ||||||||||
| 1. | Estimate as of 10/24/2006 | |
| 2. | Estimate as of 10/23/2007 | |
| 3. | Estimate as of 10/27/2008 | |
| 4. | Estimate as of 10/26/2009 | |
| 5. | Estimate as of 10/27/2010 |
CTS Corporation
Reconciliation of Gross Margin to Adjusted Gross Margin
($ in millions)
Reconciliation of Gross Margin to Adjusted Gross Margin
($ in millions)
| 2010 | 2009 | 2008 | 2007 | |||||||||||||||||||||||||||||||||||||||||||||||||||||||||
| Q3 | Q2 | Q1 | Q4 | Q3 | Q2 | Q1 | Q4 | Q3 | Q2 | Q1 | Q4 | Q3 | Q2 | Q1 | ||||||||||||||||||||||||||||||||||||||||||||||
Gross Margin |
$ | 30.0 | $ | 30.3 | $ | 30.5 | $ | 30.9 | $ | 26.2 | $ | 21.9 | $ | 19.8 | $ | 29.7 | $ | 33.4 | $ | 40.2 | $ | 33.8 | $ | 35.6 | $ | 33.8 | $ | 32.9 | $ | 30.3 | ||||||||||||||||||||||||||||||
Charges (credits) to reported Gross Margin : |
||||||||||||||||||||||||||||||||||||||||||||||||||||||||||||
Restructuring-related costs included in cost of goods sold |
— | — | — | — | — | — | — | — | 0.3 | — | 0.3 | 0.2 | — | — | — | |||||||||||||||||||||||||||||||||||||||||||||
Total adjustments to reported Gross Margin |
— | — | — | — | — | — | — | — | 0.3 | — | 0.3 | 0.2 | — | — | — | |||||||||||||||||||||||||||||||||||||||||||||
Adjusted Gross Margin |
$ | 30.0 | $ | 30.3 | $ | 30.5 | $ | 30.9 | $ | 26.2 | $ | 21.9 | $ | 19.8 | $ | 29.7 | $ | 33.7 | $ | 40.2 | $ | 34.1 | $ | 35.8 | $ | 33.8 | $ | 32.9 | $ | 30.3 | ||||||||||||||||||||||||||||||
Total Sales |
$ | 139.4 | $ | 138.9 | $ | 129.4 | $ | 133.9 | $ | 126.6 | $ | 120.4 | $ | 118.1 | $ | 162.8 | $ | 170.0 | $ | 186.1 | $ | 172.8 | $ | 178.3 | $ | 174.8 | $ | 169.6 | $ | 163.3 | ||||||||||||||||||||||||||||||
Adjusted Gross Margin as a percentage of total sales |
21.5 | % | 21.9 | % | 23.6 | % | 23.1 | % | 20.7 | % | 18.2 | % | 16.8 | % | 18.2 | % | 19.8 | % | 21.6 | % | 19.7 | % | 20.1 | % | 19.3 | % | 19.4 | % | 18.6 | % | ||||||||||||||||||||||||||||||
CTS Corporation
Reconciliation of Operating Earnings (Loss) to Adjusted Operating Earnings (Loss)
($ in millions)
Reconciliation of Operating Earnings (Loss) to Adjusted Operating Earnings (Loss)
($ in millions)
| 2010 | 2010 | 2010 | 2009 | 2008 | 2007 | |||||||||||||||||||||||||||||||||||||||||||||||||||||||||||||||
| YTD | 1st Half | Q3 | Q2 | Q1 | Q4 | Q3 | Q2 | Q1 | Q4 | Q3 | Q2 | Q1 | Q4 | Q3 | Q2 | Q1 | ||||||||||||||||||||||||||||||||||||||||||||||||||||
Operating earnings / (loss) |
$ | 21.9 | $ | 14.1 | $ | 7.8 | $ | 7.7 | $ | 6.3 | $ | 8.3 | $ | 6.3 | $ | 3.2 | $ | (35.5 | ) | $ | 3.8 | $ | 4.9 | $ | 13.8 | $ | 8.4 | $ | 9.5 | $ | 9.9 | $ | 7.9 | $ | 4.9 | |||||||||||||||||||||||||||||||||
Charges (credits) to reported operating earnings (loss): |
||||||||||||||||||||||||||||||||||||||||||||||||||||||||||||||||||||
Restructuring, restructuring-related, and asset impairment charges |
— | — | — | — | — | — | — | — | 2.2 | 2.1 | 3.5 | 0.1 | 0.4 | 2.6 | — | — | — | |||||||||||||||||||||||||||||||||||||||||||||||||||
Goodwill impairment |
— | — | — | — | — | — | — | — | 33.2 | |||||||||||||||||||||||||||||||||||||||||||||||||||||||||||
Gain on sale of excess equipment less LTCC severance |
||||||||||||||||||||||||||||||||||||||||||||||||||||||||||||||||||||
Gain on sale of excess Canadian land |
||||||||||||||||||||||||||||||||||||||||||||||||||||||||||||||||||||
Total adjustments to reported operating (loss) / earnings |
— | — | — | — | — | — | — | — | 35.4 | 2.1 | 3.5 | 0.1 | 0.4 | 2.6 | — | — | — | |||||||||||||||||||||||||||||||||||||||||||||||||||
Adjusted operating earnings / (loss), excluding above referenced items |
$ | 21.9 | $ | 14.1 | $ | 7.8 | $ | 7.7 | $ | 6.3 | $ | 8.3 | $ | 6.3 | $ | 3.2 | $ | (0.1 | ) | $ | 5.9 | $ | 8.4 | $ | 13.9 | $ | 8.8 | $ | 12.1 | $ | 9.9 | $ | 7.9 | $ | 4.9 | |||||||||||||||||||||||||||||||||
Total Sales |
$ | 407.6 | $ | 268.3 | $ | 139.4 | $ | 138.9 | $ | 129.4 | $ | 133.9 | $ | 126.6 | $ | 120.4 | $ | 118.1 | $ | 162.8 | $ | 170.0 | $ | 186.1 | $ | 172.8 | $ | 178.3 | $ | 174.8 | $ | 169.6 | $ | 163.3 | ||||||||||||||||||||||||||||||||||
Adjusted operating earnings / (loss), excluding above referenced items, as a percentage of total sales |
5.4 | % | 5.3 | % | 5.6 | % | 5.6 | % | 4.9 | % | 6.2 | % | 5.0 | % | 2.7 | % | -0.1 | % | 3.6 | % | 4.9 | % | 7.5 | % | 5.1 | % | 6.8 | % | 5.7 | % | 4.7 | % | 3.0 | % | ||||||||||||||||||||||||||||||||||
| Full Year | ||||||||||||||||||||
| 2009 | 2008 | 2007 | 2006 | 2005 | ||||||||||||||||
Operating earnings / (loss) |
$ | (17.8 | ) | $ | 30.9 | $ | 32.3 | $ | 32.9 | $ | 37.9 | |||||||||
Charges (credits) to reported operating earnings (loss): |
||||||||||||||||||||
Restructuring, restructuring-related, and asset impairment charges |
2.2 | 6.1 | 2.6 | 4.3 | ||||||||||||||||
Goodwill impairment |
33.2 | |||||||||||||||||||
Gain on sale of excess equipment less LTCC severance |
(1.2 | ) | ||||||||||||||||||
Gain on sale of excess Canadian land |
— | — | — | — | — | |||||||||||||||
Total adjustments to reported operating (loss) / earnings |
35.4 | 6.1 | 2.6 | 4.3 | (1.2 | ) | ||||||||||||||
Adjusted operating earnings / (loss), excluding above referenced items |
$ | 17.6 | $ | 37.0 | $ | 34.9 | $ | 37.2 | $ | 36.7 | ||||||||||
Total Sales |
$ | 499.0 | $ | 691.7 | $ | 685.9 | $ | 655.6 | $ | 617.5 | ||||||||||
Adjusted operating earnings / (loss), excluding above referenced items, as a percentage of total sales |
3.5 | % | 5.3 | % | 5.1 | % | 5.7 | % | 5.9 | % | ||||||||||
CTS Corporation
Reconciliation of Net (Loss) Earnings to Adjusted Net Earnings (Loss)
($ in millions)
Reconciliation of Net (Loss) Earnings to Adjusted Net Earnings (Loss)
($ in millions)
| 2010 | 2009 | 2008 | 2007 | Full Year | ||||||||||||||||||||||||||||||||||||||||||||||||||||||||||||||||||||||||||||
| Q3 | Q2 | Q1 | Q4 | Q3 | Q2 | Q1 | Q4 | Q3 | Q2 | Q1 | Q4 | Q3 | Q2 | Q1 | 2009 | 2008 | 2007 | 2006 | 2005 | |||||||||||||||||||||||||||||||||||||||||||||||||||||||||||||
Net earnings / (loss) (A) |
6.9 | 5.9 | 4.4 | 4.1 | 4.5 | (7.0 | ) | (35.6 | ) | 5.0 | 7.2 | 9.6 | 6.3 | 7.3 | 7.4 | 5.5 | 3.7 | (34.1 | ) | 28.1 | $ | 24.0 | $ | 22.8 | $ | 19.5 | ||||||||||||||||||||||||||||||||||||||||||||||||||||||
Charges (credits) to reported net earnings (loss): |
||||||||||||||||||||||||||||||||||||||||||||||||||||||||||||||||||||||||||||||||
Restructuring, restructuring-related, and asset impairment
charges |
— | — | — | — | — | 2.2 | 2.1 | 3.5 | 0.1 | 0.4 | 2.6 | — | — | — | 2.2 | 6.1 | 2.6 | 4.3 | ||||||||||||||||||||||||||||||||||||||||||||||||||||||||||||||
Goodwill impairment |
— | — | — | — | — | 33.2 | 33.2 | |||||||||||||||||||||||||||||||||||||||||||||||||||||||||||||||||||||||||
Gain on sale of excess equipment less LTCC severance |
(1.2 | ) | ||||||||||||||||||||||||||||||||||||||||||||||||||||||||||||||||||||||||||||||
Gain on sale of excess Canadian land |
||||||||||||||||||||||||||||||||||||||||||||||||||||||||||||||||||||||||||||||||
Total adjustments to reported net (loss) / earnings |
— | — | — | — | — | — | 35.4 | 2.1 | 3.5 | 0.1 | 0.4 | 2.6 | 0.0 | 0.0 | 0.0 | 35.4 | 6.1 | 2.6 | 4.3 | (1.2 | ) | |||||||||||||||||||||||||||||||||||||||||||||||||||||||||||
Total adjustments, tax affected (B) |
34.5 | 1.3 | 2.2 | 0.1 | 0.3 | 2.0 | 34.5 | 3.9 | 2.0 | 3.4 | (0.9 | ) | ||||||||||||||||||||||||||||||||||||||||||||||||||||||||||||||||||||
Impact of tax repatriation (C) |
— | — | 9.1 | 9.1 | 6.0 | |||||||||||||||||||||||||||||||||||||||||||||||||||||||||||||||||||||||||||
Impact of tax treaty (D) |
(1.4 | ) | (1.4 | ) | ||||||||||||||||||||||||||||||||||||||||||||||||||||||||||||||||||||||||||||
Impact of reversal of tax reserves (E) |
2.5 | (0.1 | ) | (4.0 | ) | 2.5 | (4.1 | ) | (1.7 | ) | ||||||||||||||||||||||||||||||||||||||||||||||||||||||||||||||||||||||
Adjusted net earnings / (loss) (A+B+C+D+E) |
$ | 6.9 | $ | 5.9 | $ | 4.4 | $ | 6.6 | $ | 4.5 | $ | 2.1 | $ | (1.1 | ) | $ | 4.8 | $ | 5.4 | $ | 9.7 | $ | 6.6 | $ | 9.3 | $ | 7.4 | $ | 5.5 | $ | 3.7 | $ | 12.0 | $ | 26.5 | $ | 26.0 | $ | 26.2 | $ | 22.9 | |||||||||||||||||||||||||||||||||||||||
Total Sales |
$ | 139.4 | $ | 138.9 | $ | 129.4 | $ | 133.9 | $ | 126.6 | $ | 120.4 | $ | 118.1 | $ | 162.8 | $ | 170.0 | $ | 186.1 | $ | 172.8 | $ | 178.3 | $ | 174.8 | $ | 169.6 | $ | 163.3 | $ | 499.0 | $ | 691.7 | $ | 685.9 | $ | 655.6 | $ | 617.5 | ||||||||||||||||||||||||||||||||||||||||
Adjusted net earnings / (loss) as a percentage of total sales |
4.9 | % | 4.2 | % | 3.4 | % | 4.9 | % | 3.6 | % | 1.7 | % | -0.9 | % | 3.0 | % | 3.2 | % | 5.2 | % | 3.8 | % | 5.2 | % | 4.2 | % | 3.2 | % | 2.3 | % | 2.4 | % | 3.8 | % | 3.8 | % | 4.0 | % | 3.7 | % | ||||||||||||||||||||||||||||||||||||||||
| 2010 | 2010 | 2009 | 2009 | 2008 | 2008 | |||||||||||||||||||
| YTD | 1st Half | 2nd Half | 1st Half | 2nd Half | 1st Half | |||||||||||||||||||
Net earnings / (loss) (A) |
17.2 | 10.3 | 8.6 | (42.6 | ) | 12.2 | 15.9 | |||||||||||||||||
Charges (credits) to reported net earnings (loss): |
||||||||||||||||||||||||
Restructuring, restructuring-related, and asset impairment
charges |
— | — | 2.2 | 5.6 | 0.5 | |||||||||||||||||||
Goodwill impairment |
— | — | 33.2 | — | — | |||||||||||||||||||
Gain on sale of excess equipment less LTCC severance |
||||||||||||||||||||||||
Gain on sale of excess Canadian land |
||||||||||||||||||||||||
Total adjustments to reported net (loss) / earnings |
— | — | — | 35.4 | 5.6 | 0.5 | ||||||||||||||||||
Total adjustments, tax affected (B) |
34.5 | 3.5 | 0.4 | |||||||||||||||||||||
Impact of tax repatriation (C) |
||||||||||||||||||||||||
Impact of tax treaty (D) |
9.1 | (1.4 | ) | |||||||||||||||||||||
Impact of reversal of tax reserves (E) |
2.5 | (4.1 | ) | |||||||||||||||||||||
Adjusted net earnings / (loss) (A+B+C+D+E) |
$ | 17.2 | $ | 10.3 | $ | 11.1 | $ | 1.0 | $ | 10.2 | $ | 16.3 | ||||||||||||
Total Sales |
$ | 407.6 | $ | 268.3 | $ | 260.5 | $ | 238.5 | $ | 332.8 | $ | 358.9 | ||||||||||||
Adjusted net earnings / (loss) as a percentage of total sales |
4.2 | % | 3.8 | % | 4.3 | % | 0.4 | % | 3.1 | % | 4.5 | % | ||||||||||||
CTS Corporation
Reconciliation of Diluted (Loss) Earnings Per Share to Adjusted Diluted Earnings (Loss) Per Share
Reconciliation of Diluted (Loss) Earnings Per Share to Adjusted Diluted Earnings (Loss) Per Share
| 2010 | 2010 | 2010 | 2009 | 2008 | 2007 | Full Year | ||||||||||||||||||||||||||||||||||||||||||||||||||||||||||||||||||||||
| YTD | 1st Half | Q3 | Q2 | Q1 | Q4 | Q3 | Q2 | Q1 | Q4 | Q3 | Q2 | Q1 | Q4 | 2009 | 2008 | 2007 | 2006 | 2005 | ||||||||||||||||||||||||||||||||||||||||||||||||||||||||||
Diluted earnings/(loss) per share |
$ | 0.50 | $ | 0.30 | $ | 0.20 | $ | 0.17 | $ | 0.13 | $ | 0.12 | $ | 0.13 | $ | (0.21 | ) | $ | (1.06 | ) | $ | 0.15 | $ | 0.21 | $ | 0.27 | $ | 0.18 | $ | 0.20 | $ | (1.01 | ) | $ | 0.81 | $ | 0.66 | $ | 0.63 | $ | 0.53 | |||||||||||||||||||||||||||||||||||
Tax affected charges (credits) to reported (loss) / earnings per share: |
||||||||||||||||||||||||||||||||||||||||||||||||||||||||||||||||||||||||||||
Restructuring, restructuring-related, and asset impairment charges |
— | — | — | — | — | — | — | 0.05 | 0.04 | 0.06 | — | — | 0.05 | 0.05 | 0.10 | 0.05 | 0.08 | |||||||||||||||||||||||||||||||||||||||||||||||||||||||||||
Goodwill impairment |
— | — | — | — | — | — | — | 0.98 | 0.98 | |||||||||||||||||||||||||||||||||||||||||||||||||||||||||||||||||||
Gain on sale of excess equipment less LTCC severance |
(0.02 | ) | ||||||||||||||||||||||||||||||||||||||||||||||||||||||||||||||||||||||||||
Gain on sale of excess Canadian land |
||||||||||||||||||||||||||||||||||||||||||||||||||||||||||||||||||||||||||||
Total tax affected adjustments to reported (loss) / earnings per share |
— | — | — | — | — | — | — | — | 1.03 | 0.04 | 0.06 | — | — | 0.05 | 1.03 | 0.10 | 0.05 | 0.08 | (0.02 | ) | ||||||||||||||||||||||||||||||||||||||||||||||||||||||||
Tax impact of cash repatriation |
— | — | 0.27 | 0.27 | 0.14 | |||||||||||||||||||||||||||||||||||||||||||||||||||||||||||||||||||||||
Impact of reversal of tax reserves and change in tax treaty |
0.07 | (0.05 | ) | (0.11 | ) | — | — | 0.07 | (0.14 | ) | (0.04 | ) | ||||||||||||||||||||||||||||||||||||||||||||||||||||||||||||||||
Adjusted diluted earnings / (loss) per share |
$ | 0.50 | $ | 0.30 | $ | 0.20 | $ | 0.17 | $ | 0.13 | $ | 0.19 | $ | 0.13 | $ | 0.06 | $ | (0.03 | ) | $ | 0.14 | $ | 0.16 | $ | 0.27 | $ | 0.18 | $ | 0.25 | $ | 0.36 | $ | 0.77 | $ | 0.71 | $ | 0.71 | $ | 0.61 | |||||||||||||||||||||||||||||||||||||
CTS Corporation
ADJUSTED EBITDA YEAR-TO-DATE
($ in millions)
ADJUSTED EBITDA YEAR-TO-DATE
($ in millions)
| YTD | 1st Half | Full Year | ||||||||||||||||||||||||||
| 2010 | 2010 | 2009 | 2008 | 2007 | 2006 | 2005 | ||||||||||||||||||||||
Net (loss) / earnings |
$ | 17.2 | $ | 10.3 | $ | (34.1 | ) | $ | 28.1 | $ | 23.9 | $ | 22.8 | $ | 19.5 | |||||||||||||
Depreciation and amortization expense |
13.2 | 8.9 | 19.5 | 24.2 | 22.8 | 24.9 | 27.1 | |||||||||||||||||||||
Interest expense |
0.7 | 0.4 | 1.7 | 6.2 | 5.5 | 5.9 | 8.0 | |||||||||||||||||||||
Tax expense / (benefit) |
5.1 | 2.6 | 13.6 | (1.8 | ) | 6.1 | 5.6 | 11.4 | ||||||||||||||||||||
EBITDA |
$ | 36.2 | $ | 22.2 | $ | 0.8 | $ | 56.7 | $ | 58.3 | $ | 59.2 | $ | 66.0 | ||||||||||||||
Charges (credits) to reported EBITDA: |
||||||||||||||||||||||||||||
Restructuring and asset impairment charges |
— | — | 2.2 | 6.1 | 2.6 | 4.3 | — | |||||||||||||||||||||
Goodwill impairment |
— | — | 33.2 | |||||||||||||||||||||||||
Gain on sale of excess equipment less LTCC severance |
(1.2 | ) | ||||||||||||||||||||||||||
Total adjustments to reported EBITDA |
— | — | 35.4 | 6.1 | 2.6 | 4.3 | (1.2 | ) | ||||||||||||||||||||
Adjusted EBITDA |
$ | 36.2 | $ | 22.2 | $ | 36.2 | $ | 62.8 | $ | 60.9 | $ | 63.5 | $ | 64.8 | ||||||||||||||
Total Sales |
$ | 407.6 | $ | 268.3 | $ | 499.0 | $ | 691.7 | $ | 685.9 | $ | 655.6 | $ | 617.5 | ||||||||||||||
Adjusted EBITDA as a percentage of total sales |
8.9 | % | 8.3 | % | 7.3 | % | 9.1 | % | 8.9 | % | 9.7 | % | 10.5 | % | ||||||||||||||
CTS Corporation
ADJUSTED EBITDA QUARTER-TO-DATE
($ in millions)
ADJUSTED EBITDA QUARTER-TO-DATE
($ in millions)
| 2010 | 2009 | 2008 | 2007 | |||||||||||||||||||||||||||||||||||||||||||||||||||||||||
| Q3 | Q2 | Q1 | Q4 | Q3 | Q2 | Q1 | Q4 | Q3 | Q2 | Q1 | Q4 | Q3 | Q2 | Q1 | ||||||||||||||||||||||||||||||||||||||||||||||
Net (loss) / earnings |
$ | 6.9 | $ | 5.9 | $ | 4.4 | $ | 4.1 | $ | 4.5 | $ | (7.0 | ) | $ | (35.6 | ) | $ | 5.0 | $ | 7.2 | $ | 9.6 | $ | 6.3 | $ | 7.3 | $ | 7.4 | $ | 5.5 | $ | 3.7 | ||||||||||||||||||||||||||||
Depreciation and amortization expense |
4.3 | 4.5 | 4.4 | 4.6 | 4.4 | 5.2 | 5.3 | 5.7 | 5.7 | 6.8 | 6.0 | 5.8 | 5.4 | 5.8 | 5.8 | |||||||||||||||||||||||||||||||||||||||||||||
Interest expense |
0.3 | 0.2 | 0.2 | 0.2 | 0.3 | 0.5 | 0.9 | 1.2 | 1.6 | 1.7 | 1.7 | 1.5 | 1.5 | 1.3 | 1.3 | |||||||||||||||||||||||||||||||||||||||||||||
Tax expense / (benefit) |
2.4 | 1.4 | 1.3 | 3.8 | 1.2 | 9.7 | (1.0 | ) | (2.1 | ) | (3.9 | ) | 2.5 | 1.6 | 2.1 | 1.8 | 1.3 | 0.8 | ||||||||||||||||||||||||||||||||||||||||||
EBITDA |
$ | 13.9 | $ | 12.0 | $ | 10.3 | $ | 12.7 | $ | 10.4 | $ | 8.4 | $ | (30.4 | ) | $ | 9.8 | $ | 10.6 | $ | 20.6 | $ | 15.6 | $ | 16.7 | $ | 16.1 | $ | 13.9 | $ | 11.6 | |||||||||||||||||||||||||||||
Charges (credits) to reported EBITDA: |
||||||||||||||||||||||||||||||||||||||||||||||||||||||||||||
Restructuring, restructuring-related, and asset impairment charges |
— | — | — | — | — | 2.2 | 2.1 | 3.5 | 0.1 | 0.4 | 2.6 | — | — | — | ||||||||||||||||||||||||||||||||||||||||||||||
Goodwill impairment |
— | — | — | — | — | 33.2 | ||||||||||||||||||||||||||||||||||||||||||||||||||||||
Total adjustments to reported EBITDA |
— | — | — | — | — | — | 35.4 | 2.1 | 3.5 | 0.1 | 0.4 | 2.6 | — | — | — | |||||||||||||||||||||||||||||||||||||||||||||
Adjusted EBITDA |
$ | 13.9 | $ | 12.0 | $ | 10.3 | $ | 12.7 | $ | 10.4 | $ | 8.4 | $ | 5.0 | $ | 11.9 | $ | 14.1 | $ | 20.7 | $ | 16.0 | $ | 19.3 | $ | 16.1 | $ | 13.9 | $ | 11.6 | ||||||||||||||||||||||||||||||
Total Sales |
$ | 139.4 | $ | 138.9 | $ | 129.4 | $ | 133.9 | $ | 126.6 | $ | 120.4 | $ | 118.1 | $ | 162.8 | $ | 170.0 | $ | 186.1 | $ | 172.8 | $ | 178.3 | $ | 174.8 | $ | 169.6 | $ | 163.3 | ||||||||||||||||||||||||||||||
Adjusted EBITDA as a percentage of total sales |
10.0 | % | 8.6 | % | 8.0 | % | 9.5 | % | 8.2 | % | 7.0 | % | 4.2 | % | 7.3 | % | 8.3 | % | 11.1 | % | 9.3 | % | 10.8 | % | 9.2 | % | 8.2 | % | 7.1 | % | ||||||||||||||||||||||||||||||
CTS Corporation
Free Cash Flow
($ in millions)
Free Cash Flow
($ in millions)
| 2010 | 2010 | 2009 | 2008 | 2007 | Full Year | |||||||||||||||||||||||||||||||||||||||||||||||||||||||||||||||||||||||||||||||
| YTD | Q3 | Q2 | Q1 | Q4 | Q3 | Q2 | Q1 | Q4 | Q3 | Q2 | Q1 | Q4 | Q3 | Q2 | Q1 | 2009 | 2008 | 2007 | 2006 | 2005 | ||||||||||||||||||||||||||||||||||||||||||||||||||||||||||||||||
Cash flows provided from (used by) operations |
$ | 8.1 | $ | 1.8 | $ | 1.0 | $ | 5.3 | $ | 12.5 | $ | 18.4 | $ | 19.7 | $ | (4.0 | ) | $ | 14.0 | $ | 7.8 | $ | 17.8 | $ | (5.5 | ) | $ | 17.4 | $ | 15.7 | $ | 11.4 | $ | 4.1 | $ | 46.6 | $ | 34.1 | $ | 48.6 | $ | 47.2 | $ | 44.5 | ||||||||||||||||||||||||||||||||||||||||
Capital expenditures |
(10.5 | ) | (4.3 | ) | (4.7 | ) | (1.5 | ) | (1.9 | ) | (1.8 | ) | (1.4 | ) | (1.4 | ) | (3.8 | ) | (4.1 | ) | (6.2 | ) | (3.5 | ) | (6.8 | ) | (3.0 | ) | (3.6 | ) | (2.7 | ) | (6.5 | ) | (17.6 | ) | (16.1 | ) | (15.8 | ) | (15.0 | ) | ||||||||||||||||||||||||||||||||||||||||||
Free cash flow |
$ | (2.4 | ) | $ | (2.5 | ) | $ | (3.7 | ) | $ | 3.8 | $ | 10.7 | $ | 16.6 | $ | 18.3 | $ | (5.4 | ) | $ | 10.2 | $ | 3.7 | $ | 11.6 | $ | (9.0 | ) | $ | 10.6 | $ | 12.7 | $ | 7.8 | $ | 1.4 | $ | 40.1 | $ | 16.5 | $ | 32.5 | $ | 31.4 | $ | 29.5 | |||||||||||||||||||||||||||||||||||||
| 2010 | 2009 | 2008 | ||||||||||||||||||
| 1st Half | 2nd Half | 1st Half | 2nd Half | 1st Half | ||||||||||||||||
Cash flows provided from (used by) operations |
$ | 6.3 | $ | 30.9 | $ | 15.7 | $ | 21.8 | $ | 12.3 | ||||||||||
Capital expenditures |
(6.2 | ) | (3.7 | ) | (2.8 | ) | (7.9 | ) | (9.7 | ) | ||||||||||
Free cash flow |
$ | 0.1 | $ | 27.2 | $ | 12.9 | $ | 13.9 | $ | 2.6 | ||||||||||
CTS
Corporation
Projected Free Cash Flow
($ in millions)
Projected Free Cash Flow
($ in millions)
| Year | Year | Year | Year | Year | Year | Year | ||||||||||||||||||||||||||||||
| Ended | Ended | Ended | Ended | Ended | Ended | Ended | ||||||||||||||||||||||||||||||
| Year Ended | Year Ended | December | December | December | December | December | December | December | ||||||||||||||||||||||||||||
| December 31, | December 31, | 31, 2010 | 31, 2009 | 31, 2009 | 31, 2008 | 31, 2008 | 31, 2008 | 31, 2008 | ||||||||||||||||||||||||||||
| 2010 (9) | 2010 (8) | (7) | (6) | (5) | (1) | (2) | (3) | (4) | ||||||||||||||||||||||||||||
Cash flows provided from operations |
$ | 31-$39 | $ | 35-$42 | $ | 39-$44 | $ | 37-$42 | $ | 35-$40 | $ | 32-$36 | $ | 48-$55 | $ | 50-$57 | $ | 54-$54 | ||||||||||||||||||
Capital expenditures |
$ | (14)-$(17 | ) | $ | (15)-$(17 | ) | $ | (14 | ) | $ | (17 | ) | $ | (10 | ) | $ | (17 | ) | $ | (22)-$(25 | ) | $ | (22)-$(25 | ) | $ | (21)-$(25 | ) | |||||||||
Free cash flow |
$ | 17 -$22 | $ | 20 -$25 | $ | 25 -$30 | $ | 20 -$25 | $ | 25 -$30 | $ | 15 -$19 | $ | 26 -$30 | $ | 28 -$32 | $ | 33 - $29 | ||||||||||||||||||
| (1) | Estimate as of 10/27/2008 | |
| (2) | Estimate as of 7/30/2008 | |
| (3) | Estimate as of 4/30/2008 | |
| (4) | Estimate as of 1/30/2008 | |
| (5) | Estimate as of 10/28/2009 | |
| (6) | Estimate as of 1/27/2010 | |
| (7) | Estimate as of 4/27/2010 | |
| (8) | Estimate as of 7/27/2010 | |
| (9) | Estimate as of 10/27/2010 |
CTS Corporation
Definition of Financial Term — “Total Debt to Capitalization”
($ in millions)
Definition of Financial Term — “Total Debt to Capitalization”
($ in millions)
| 2010 | 2010 | 2010 | 2009 | 2008 | 2007 | 2006 | 2005 | |||||||||||||||||||||||||||||||||||||||||||||||||||||||||||||||||||||
| YTD | 1st Half | Q3 | Q2 | Q1 | Q4 | Q3 | Q2 | Q1 | Q4 | Q3 | Q2 | Q1 | Q4 | Q3 | Q2 | Q1 | Q4 | Q4 | ||||||||||||||||||||||||||||||||||||||||||||||||||||||||||
Notes payable |
$ | — | $ | — | $ | — | $ | — | $ | — | $ | — | $ | — | $ | — | $ | 0.2 | $ | — | $ | — | $ | — | $ | — | $ | 1.0 | $ | 1.9 | $ | 1.5 | $ | 3.5 | $ | 5.4 | $ | 13.3 | ||||||||||||||||||||||||||||||||||||||
Current portion of long-term debt |
— | — | — | — | — | — | — | — | — | — | — | — | — | — | — | — | — | 0.2 | 0.2 | |||||||||||||||||||||||||||||||||||||||||||||||||||||||||
Long-term debt |
77.1 | 65.9 | 77.1 | 65.9 | 56.0 | 50.4 | 49.5 | 51.0 | 85.9 | 80.0 | 98.4 | 90.0 | 113.7 | 68.3 | 55.7 | 55.1 | 54.4 | 54.4 | 59.7 | |||||||||||||||||||||||||||||||||||||||||||||||||||||||||
Total debt |
77.1 | 65.9 | 77.1 | 65.9 | 56.0 | 50.4 | 49.5 | 51.0 | 86.1 | 80.0 | 98.4 | 90.0 | 113.7 | 69.3 | 57.6 | 56.6 | 57.9 | 60.0 | 73.2 | |||||||||||||||||||||||||||||||||||||||||||||||||||||||||
Total shareholders’ equity |
265.1 | 256.9 | 265.1 | 256.9 | 251.2 | 247.5 | 241.9 | 237.1 | 242.6 | 277.5 | 340.0 | 335.2 | 326.1 | 326.4 | 332.1 | 328.4 | 326.8 | 322.6 | 333.0 | |||||||||||||||||||||||||||||||||||||||||||||||||||||||||
Total capitalization |
$ | 342.2 | $ | 322.8 | $ | 342.2 | $ | 322.8 | $ | 307.2 | $ | 297.9 | $ | 291.4 | $ | 288.1 | $ | 328.7 | $ | 357.5 | $ | 438.4 | $ | 425.2 | $ | 439.8 | $ | 395.7 | $ | 389.7 | $ | 385.0 | $ | 384.7 | $ | 382.6 | $ | 406.2 | ||||||||||||||||||||||||||||||||||||||
Total debt to capitalization |
22.5 | % | 20.4 | % | 22.5 | % | 20.4 | % | 18.2 | % | 16.9 | % | 17.0 | % | 17.7 | % | 26.2 | % | 22.4 | % | 22.4 | % | 21.2 | % | 25.9 | % | 17.5 | % | 14.8 | % | 14.7 | % | 15.1 | % | 15.7 | % | 18.0 | % | ||||||||||||||||||||||||||||||||||||||
CTS Corporation
Definition of Financial Term — “Controllable Working Capital as a Percentage of Annualized Sales”
($ in millions)
Controllable working capital is defined as accounts receivable plus inventories less accounts payable
Definition of Financial Term — “Controllable Working Capital as a Percentage of Annualized Sales”
($ in millions)
Controllable working capital is defined as accounts receivable plus inventories less accounts payable
| October 3, | April 4, | Full Year | September 27, | June 28, | March 29, | Full Year | September 28, | June 29, | March 30, | Full Year | Full Year | Full Year | ||||||||||||||||||||||||||||||||||||||||
| 2010 | 2010 | 2009 | 2009 | 2009 | 2009 | 2008 | 2008 | 2008 | 2008 | 2007 | 2006 | 2005 | ||||||||||||||||||||||||||||||||||||||||
Net Accounts Receivables |
$ | 90.1 | $ | 74.1 | $ | 71.7 | $ | 75.9 | $ | 73.6 | $ | 76.7 | $ | 94.2 | $ | 103.4 | $ | 110.5 | $ | 108.1 | $ | 100.7 | $ | 106.0 | $ | 90.8 | ||||||||||||||||||||||||||
Net Inventory |
76.6 | 60.0 | 54.3 | 60.5 | 61.7 | 70.2 | 70.9 | 88.1 | 86.6 | 83.8 | 73.8 | 60.5 | 60.6 | |||||||||||||||||||||||||||||||||||||||
Accounts Payable |
(70.5 | ) | (59.5 | ) | (52.3 | ) | (62.2 | ) | (53.0 | ) | (53.4 | ) | (71.3 | ) | (78.9 | ) | (85.7 | ) | (78.8 | ) | (84.2 | ) | (78.2 | ) | (68.7 | ) | ||||||||||||||||||||||||||
Controllable Working Capital |
96.2 | 74.5 | 73.7 | 74.2 | 82.3 | 93.5 | 93.8 | 112.6 | 111.4 | 113.1 | 90.3 | 88.3 | 82.7 | |||||||||||||||||||||||||||||||||||||||
Quarterly sales |
$ | 139.4 | $ | 129.4 | $ | 133.9 | $ | 126.6 | $ | 120.4 | $ | 118.1 | $ | 162.8 | $ | 170.0 | $ | 186.1 | $ | 172.8 | $ | 178.3 | $ | 173.5 | $ | 154.6 | ||||||||||||||||||||||||||
Acquisition Adjustments |
7.0 | |||||||||||||||||||||||||||||||||||||||||||||||||||
Adjusted quarterly sales |
$ | 139.4 | $ | 129.4 | $ | 133.9 | $ | 126.6 | $ | 120.4 | $ | 118.1 | $ | 162.8 | $ | 170.0 | $ | 186.1 | $ | 179.8 | $ | 178.3 | $ | 173.5 | $ | 154.6 | ||||||||||||||||||||||||||
Multiplied by 4 |
4 | 4 | 4 | 4 | 4 | 4 | 4 | 4 | 4 | 4 | 4 | 4 | 4 | |||||||||||||||||||||||||||||||||||||||
Annualized sales |
557.45 | 517.61 | 535.55 | 506.40 | 481.60 | 472.40 | 651.20 | 680.00 | 744.40 | 719.20 | 713.20 | 694.00 | 618.4 | |||||||||||||||||||||||||||||||||||||||
Controllable Working Capital % — Quarter/Annual |
17.3 | % | 14.4 | % | 13.8 | % | 14.7 | % | 17.1 | % | 19.8 | % | 14.4 | % | 16.6 | % | 15.0 | % | 15.7 | % | 12.7 | % | 12.7 | % | 13.4 | % | ||||||||||||||||||||||||||
| 1st Half | 2nd Half | 1st Half | 2nd Half | 1st Half | ||||||||||||||||
| 2010 | 2009 | 2009 | 2008 | 2008 | ||||||||||||||||
Net Accounts Receivables |
$ | 84.6 | $ | 71.7 | $ | 73.6 | $ | 94.2 | $ | 110.5 | ||||||||||
Net Inventory |
68.8 | 54.3 | 61.7 | 70.9 | 86.6 | |||||||||||||||
Accounts Payable |
(68.2 | ) | (52.3 | ) | (53.0 | ) | (71.3 | ) | (85.7 | ) | ||||||||||
Controllable Working Capital |
85.2 | 73.7 | 82.3 | 93.8 | 111.4 | |||||||||||||||
Quarterly sales |
$ | 138.9 | $ | 133.9 | $ | 120.4 | $ | 162.8 | $ | 186.1 | ||||||||||
Acquisition Adjustments |
||||||||||||||||||||
Adjusted quarterly sales |
$ | 138.9 | $ | 133.9 | $ | 120.4 | $ | 162.8 | $ | 186.1 | ||||||||||
Multiplied by 4 |
4 | 4 | 4 | 4 | 4 | |||||||||||||||
Annualized sales |
555.60 | 535.60 | 481.60 | 651.20 | 744.40 | |||||||||||||||
Controllable Working Capital % — Annual |
15.3 | % | 13.8 | % | 17.1 | % | 14.4 | % | 15.0 | % | ||||||||||
CTS Corporation
Definition of Financial Term -
Adjusted Return on Invested Capital
Definition of Financial Term -
Adjusted Return on Invested Capital
| Full Year | ||||||||||||||||||||
| 2009 | 2008 | 2007 | 2006 | 2005 | ||||||||||||||||
Operating earnings |
$ | (17.8 | ) | $ | 30.9 | $ | 32.3 | $ | 32.8 | $ | 37.9 | |||||||||
Charges (credits) to reported operating earnings: |
||||||||||||||||||||
Restructuring and asset impairment charges |
2.2 | 6.1 | 2.6 | 4.3 | ||||||||||||||||
Gain on sale of excess equipment less LTCC severance |
(1.2 | ) | ||||||||||||||||||
Gain on sale of excess Canadian land |
||||||||||||||||||||
Goodwill Impairment |
33.2 | |||||||||||||||||||
Total adjustments to reported operating earnings |
35.4 | 6.1 | 2.6 | 4.3 | (1.2 | ) | ||||||||||||||
Adjusted operating earnings |
$ | 17.6 | $ | 37.0 | $ | 34.9 | $ | 37.1 | $ | 36.7 | ||||||||||
* Tax rate |
20% | * | 12% | * | 20 | % | 20 | % | 37 | % | ||||||||||
Tax effected adjusted operating earnings |
$ | 14.1 | $ | 32.6 | $ | 27.9 | $ | 29.7 | $ | 23.1 | ||||||||||
Invested Capital: |
||||||||||||||||||||
Current Year: |
||||||||||||||||||||
Shareholders’ equity |
$ | 247.5 | $ | 277.5 | $ | 326.4 | $ | 322.6 | $ | 333.0 | ||||||||||
Long-term debt |
50.4 | 80.0 | 68.3 | 54.6 | 59.9 | |||||||||||||||
Notes payable and current portion of LT debt |
— | — | 1.0 | 5.6 | 13.5 | |||||||||||||||
Less: Cash |
(51.2 | ) | (44.6 | ) | (52.9 | ) | (38.6 | ) | (12.0 | ) | ||||||||||
Invested capital |
246.7 | 312.9 | $ | 342.8 | $ | 344.2 | 394.4 | |||||||||||||
Prior Year: |
||||||||||||||||||||
Shareholders’ equity |
$ | 277.5 | $ | 326.4 | 322.6 | 333.0 | 316.9 | |||||||||||||
Long-term debt |
80.0 | 68.3 | 54.6 | 59.9 | 83.4 | |||||||||||||||
Notes payable and current portion of LT debt |
— | 1.0 | 5.6 | 13.5 | 3.3 | |||||||||||||||
Less: Cash |
(44.6 | ) | (52.9 | ) | (38.6 | ) | (12.0 | ) | (61.0 | ) | ||||||||||
Invested capital |
312.9 | 342.8 | 344.2 | 394.4 | 342.6 | |||||||||||||||
Adjusted invested capital |
$ | 279.8 | $ | 327.9 | $ | 345.5 | $ | 372.3 | $ | 372.6 | ||||||||||
Adjusted return on invested capital |
5.0 | % | 9.9 | % | 8.1 | % | 8.0 | % | 6.2 | % | ||||||||||
Sales |
$ | 499.0 | $ | 691.7 | $ | 685.9 | $ | 655.6 | $ | 617.5 | ||||||||||
Tax effected adjusted operating earnings |
14.1 | 32.6 | 27.9 | 29.7 | 23.1 | |||||||||||||||
Tax effected adjusted operating margin as a
percentage of sales (a) |
2.8 | % | 4.7 | % | 4.1 | % | 4.5 | % | 3.7 | % | ||||||||||
Sales |
$ | 499.0 | $ | 691.7 | $ | 685.9 | $ | 655.6 | $ | 617.5 | ||||||||||
Adjusted invested capital |
279.8 | 327.9 | 345.5 | 372.3 | 372.6 | |||||||||||||||
Invested capital turns (b) |
1.78 | 2.11 | 1.99 | 1.76 | 1.66 | |||||||||||||||
Adjusted return on invested capital (a) x (b) |
5.0 | % | 9.9 | % | 8.1 | % | 8.0 | % | 6.2 | % | ||||||||||
| * | For 2009 & 2008, Tax rates are Adjusted Effective Tax Rates |
