Attached files
| file | filename |
|---|---|
| 8-K - FORM 8-K - PEABODY ENERGY CORP | c61182e8vk.htm |
| 1 Australia Analyst and Investor Tour November 10 - 12, 2010 Exhibit 99.1 |

| 2 2 Statement on Forward-Looking Information Some of the following information contains forward-looking statements within the meaning of Section 27A of the Securities Act of 1933 and Section 21E of the Securities Exchange Act of 1934, as amended, and is intended to come within the safe-harbor protection provided by those sections. Our forward-looking statements are based on numerous assumptions that the company believes are reasonable, but they are open to a wide range of uncertainties and business risks that may cause actual results to differ materially from expectations as of Oct. 19, 2010. These factors are difficult to accurately predict and may be beyond the company's control. The company does not undertake to update its forward-looking statements. Factors that could affect the company's results include, but are not limited to: demand for coal in United States and international power generation and steel production markets; price volatility and demand, particularly in higher-margin products and in our trading and brokerage businesses; reductions and/or deferrals of purchases by major customers and ability to renew sales contracts; credit and performance risks associated with customers, suppliers, trading, banks and other financial counterparties; geologic, equipment, permitting and operational risks related to mining; transportation availability, performance and costs; availability, timing of delivery and costs of key supplies, capital equipment or commodities such as diesel fuel, steel, explosives and tires; impact of weather on demand, production and transportation; successful implementation of business strategies, including our Btu Conversion and generation development initiatives; negotiation of labor contracts, employee relations and workforce availability; changes in postretirement benefit and pension obligations and funding requirements; replacement and development of coal reserves; access to capital and credit markets and availability and costs of credit, margin capacity, surety bonds, letters of credit, and insurance; effects of changes in interest rates and currency exchange rates (primarily the Australian dollar); effects of acquisitions or divestitures; economic strength and political stability of countries in which we have operations or serve customers; legislation, regulations and court decisions or other government actions, including new environmental requirements, changes in income tax regulations or other regulatory taxes; litigation, including claims not yet asserted; and other risks detailed in the company's reports filed with the Securities and Exchange Commission (SEC). The use of "Peabody," "the company," and "our" relate to Peabody, its subsidiaries and majority-owned affiliates. EBITDA or Adjusted EBITDA is defined as income from continuing operations before deducting net interest expense, income taxes, asset retirement obligation expense, and depreciation, depletion and amortization. EBITDA, which is not calculated identically by all companies, is not a substitute for operating income, net income or cash flow as determined in accordance with United States generally accepted accounting principles. Management uses EBITDA as a key measure of operating performance and also believes it is a useful indicator of the company's ability to meet debt service and capital expenditure requirements. 10/19/10 |

| 3 3 2006 2007 2008 2009 2010 EBITDA 909.7 969.7 1846.9 1290.1 1850 50 Year-to-date September 2010 results: Australia EBITDA doubles to $670 million U.S. EBITDA grows 14% to $854 million Operating cash flows reach record $884 million Adjusted diluted EPS increases 48% Substantial liquidity to fund growth $1,850 - $1,900 Strong Results, Outstanding Outlook 2010 Results May Rival 2008 Record EBITDA in Millions |

| Early Stages of Coal's Supercycle |

| 5 Major New Global Build Out of Coal Generation Under Way Source: Platts Worldwide Power Plant Database; EIA International Energy Outlook 2010 and Peabody analysis. Growth of global coal-based generation (billion kilowatt hours) based on 2007 - 2035 EIA data. Generation Demand Driven by Asia and Growing Share of Electricity Projected New Coal-Fueled Generating Capacity (GW) Global generation expected to grow by 400 GW by 2015 270 MTPA coal growth just in new plants starting up in 2010 Additional 1+ billion tonnes of new demand anticipated by 2015 2010 2011-2015 2015-2035 China 55 250 India 13 75 ROW 19 66 821 5 |

| 6 6 Global Met Coal Use Forecast to Rise 400 Million Tonnes by 2015 Expected Global Steel Production And Met Coal Demand Source: World Steel Association; third party data and Peabody analysis. Global steel production expected to rise nearly two-thirds by 2020 Bulk of market share growth in China and India Trend highlights structural shortage of premium coking coal Other India China EU/US 2010 2015 2020 ROW 696.1 831.6 969.3 China 645.9 955.9 1207 India 64 90.5 125.7 Met Coal Demand 937 1262 1534 Met Coal Demand (Million Tonnes) Steel Production (Million Tonnes) |

| 7 7 U.S. growth presented in short tons. Source: World Energy Outlook 2009, International Energy Agency; Annual Energy Outlook Forecasts, Energy Information Administration; Peabody analysis. China and India Lead Long-Term Coal Demand Growth +690 +2,210 +150 +50 +110 +380 Developing Asia Represents 90% of Long-Term Global Coal Demand Growth 2007 - 2030 (Tonnes in Millions) |
| Near- and Mid-Term Pacific Markets Outstanding for Coal |

| 9 9 Seaborne Thermal Coal Market Short Next Five Years; Implies Strong Pricing Driver 2010 2011 2012 2013 2014 2015 Atlantic 0 6 19 29 35 37 Other Pacific 0 5 17 30 50 60 China 0 2 4 6 8 13 India 0 20 40 60 80 90 Expected Increase in Seaborne Thermal Demand 2010 - 2015 India 125%-175% China 5%-25% Other Pacific ~20% Atlantic ~25% Expected Increase in Seaborne Thermal Supply 2010 - 2015 2010 2011 2012 2013 2014 2015 Australia 0 10 32 47 55 60 Indonesia 0 9 21 35 39 40 Russia 0 2 2 4 6 10 South Africa 0 2 5 7 9 9 Colombia 0 1 2 4 8 16 Other 0 0 1 2 10 15 Shortfall 0 9 17 26 46 60 Australia 30%-60% Indonesia 15%-25% Russia S. Africa Colombia Other Source: Peabody analysis. 2010 2015 2010 2015 50-75 Million Tonne Shortfall |

| 10 10 2015 Australia 37 Mongolia 14 Other Pacific 15 Russia 5 Seaborne Met Coal Market Fundamentally Short 2015 Brazil 20 India 14 China 15 Europe 4 South Korea 6 Japan 4 Other 2 Expected Increase in Seaborne Met Demand 2010 - 2015 Expected Increase in Seaborne Met Supply 2010 - 2015 30-40 ~10 ~10 0-5 (20-25) 55-65 Tonnes in millions. Source: Peabody analysis. 30-40 South Korea Other Atlantic |

| Peabody's Catalysts for Growth & Shareholder Value Upside |

| 12 12 Peabody Energy: Catalysts for Growth Bear Run Mine Expanding Production Multiple PRB Export Opportunities in Development Expanding Australia Seaborne Met, Thermal Volumes Metropolitan, Wilpinjong and Burton Construction Commenced Multiple JVs and Large Project Pipeline in China Pursuing Mongolia Opportunities, including JV with Winsway Strategic Discussions with Coal India for Long-term Supply Pursuing Indonesian Projects, Partners Expanding Global Trading & Brokerage School Creek: Best Long-term PRB Capacity Gateway Mine Expansion |

| 13 13 Peabody's Australia Growth Engine Key Takeaways Outstanding access to high-growth global markets at the early stages of long-term supercycle Well-managed portfolio of diverse operations and products delivering substantial margins, earnings and cash flows Significant growth program under way, driving earnings upside and value creation |

| Australian Election Produces Minority Government |

| 15 Policy Transition Group Consultation Enables Industry to Influence Framework Government has published preliminary Issues Paper Industry consultation is continuing Industry has raised concerns over several departures from pre- election agreed terms Credit for State royalty increases has emerged as a key issue Preliminary Design Paper due to Government by end of 2010 Will be accompanied by updated Issues Paper Coalition remains opposed to MRRT in any form |

| 16 Anticipated Timeline of MRRT Development and Implementation Tax Reform Timetable May 2, 2010 - RSPT announced July 2 - Revised Regime - MRRT announced August - Policy Transition Group formed Mid 2011 - Exposure Draft Legislation Late 2011 - Legislation Introduced Into Parliament July 2012 - Proposed Effective Date 2010 2011 2012 October - PTG Issues Paper published Late 2011/Early 2012 - Vote on Legislation Late 2010 - Updated Issues Paper October / November - PTG Consultations commenced Late 2010 - Preliminary Design Paper (may be pushed into 2011) |
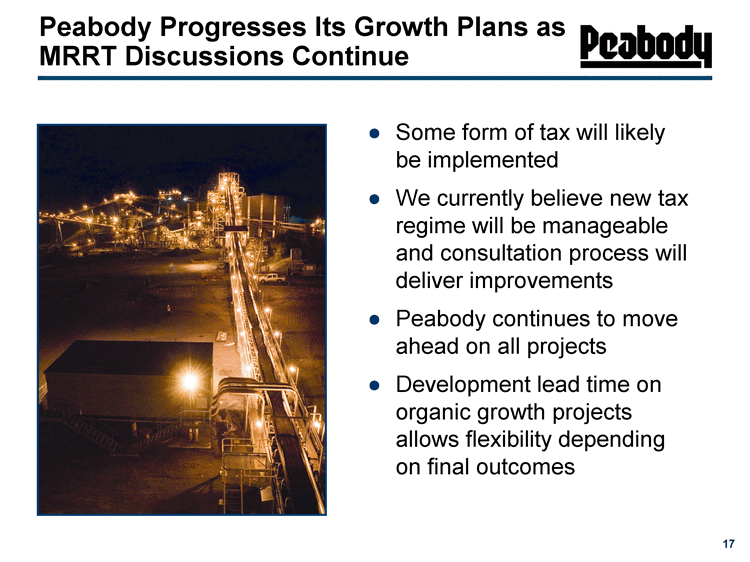
| 17 Peabody Progresses Its Growth Plans as MRRT Discussions Continue Some form of tax will likely be implemented We currently believe new tax regime will be manageable and consultation process will deliver improvements Peabody continues to move ahead on all projects Development lead time on organic growth projects allows flexibility depending on final outcomes |

| Serving High Growth Asian Markets from Expanding Australia Platform |

| 19 Focused Growth Strategy Export coal to Asia from Australia Expand coal trading business Build production base in China & Indonesia JVs Develop Mongolia- to-China platform World-class open cut mining expertise Proven record of environmental stewardship Culture of safety and continuous improvement Best-in-class engineering and management practices Peabody Asia 100 Vision Australia Represents the Basic Building Block Peabody's Core Competencies to Add Value |

| 20 Diversity In Product Mix, Regions and Ports HQHCC HCC SHCC PCI/Other 3.6 2.5 1.8 1.9 High Quality Hard 30 - 35% Hard 20 - 25% Semi- Hard 15 - 25% PCI 15 - 25% Expected 2010 Met Coal Mix Sales 2009 Quality Port Burton 2.5 M DBCT Eaglefield 0.9 M DBCT Millennium 0.8 M/P DBCT North Goonyella 1.8 M DBCT Wilkie Creek 2.3 T Brisbane Queensland 8.3 Metropolitan 1.5 M/P Port Kembla Wambo U/G 2.3 T/P Newcastle Wambo O/C 1.9 T Newcastle Wilpinjong 8.3 T/D Newcastle NSW 14.0 Total 22.3 Expected 2010 Sales Mix Met Seanorne Thermal Domestic Thermal 9.9 11.8 6.1 Domestic Thermal ~20 - 25% Seaborne Thermal ~40 - 45% Met ~35% Short tons in millions. T: thermal/steam, M: metallurgical, P: pulverized coal injection, D: domestic. |

| 21 21 International U.S. 44 85 21 Australia A Major Earnings Contributor 1st Qtr 2nd Qtr 1 99 2003 United States International $422 Million Values represent continuing operations. International/U.S. share unaudited. International U.S. 50 50 2010 Est. $1.85 - $1.9 Billion 2009 $1.29 Billion International EBITDA Grows Over Time |
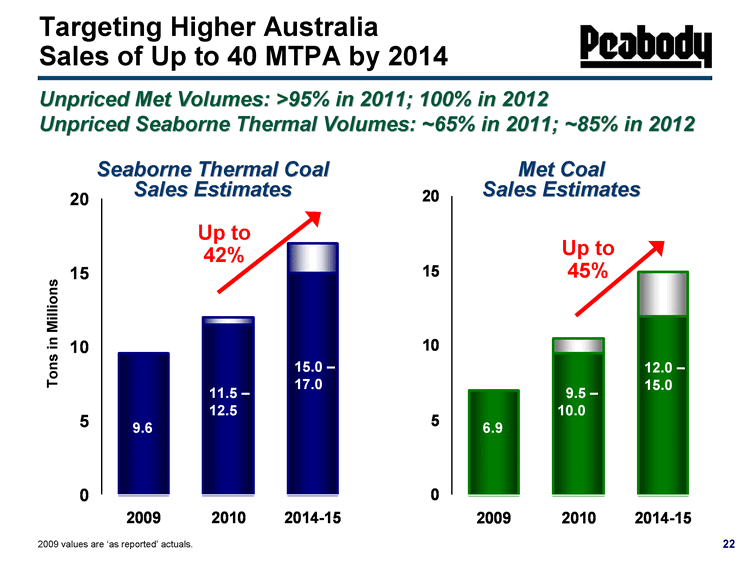
| 22 22 2009 2010 2014-15 Seaborne Thermal 9.6 11.5 15 0.5 2 Targeting Higher Australia Sales of Up to 40 MTPA by 2014 Tons in Millions 2009 2010 2014-15 Seaborne Met 7 9.5 12 1 3 11.5 - 12.5 15.0 - 17.0 9.6 9.5 - 10.0 12.0 - 15.0 6.9 Met Coal Sales Estimates Seaborne Thermal Coal Sales Estimates Up to 42% Up to 45% Unpriced Met Volumes: >95% in 2011; 100% in 2012 Unpriced Seaborne Thermal Volumes: ~65% in 2011; ~85% in 2012 2009 values are 'as reported' actuals. |

| 23 23 Metropolitan 1 MT HCC, $70 million Wambo 3 - 4 MT Thermal/PCI Millennium 2 - 3 MT SHCC/PCI Sufficient Rail/Port Access to Accommodate Growth Significant Progress in Peabody's Australia Project Pipeline Short tons in millions. Dollars represent projected capital expenditures. Met Seaborne Thermal 2011 2012 2013 2014 2015 Wilpinjong 2 - 3 MT, $90 million Burton 2 - 3 MT HCC Denham/Goonyella Corridor 5 - 6 MT HQHCC Under Construction In Development |

| 24 Fully permitted Expansion combined with modernization of mine Board approval granted January 2010 $70 million of expansion cap-ex Construction commenced; prep plant upgrade under way, new drift about to start Reposition mine in lowest cost quartile Mine Layout Project Description Underground mine HCC quality Additional 1 million tons by 2014 Australia Organic Growth Projects: Metropolitan Expansion Ships Via Unconstrained Port Kembla |

| 25 Australia Organic Growth Projects: Burton Extension Extending mine life via reopening of previously mined and partially reclaimed pit Enhances coal blending opportunities with other products from the Burton complex Fully permitted Development activities have begun Project Description Proposed Expansion Surface mine HCC quality Additional 2 - 3 million tons by 2012 Ships Via DBCT |

| 26 Expands the capacity and life of mine Opportunity to improve efficiencies Finalizing mine plan to optimize reserves EIS for environmental approvals submitted to Queensland Government Mine Layout Australia Organic Growth Projects: Millennium Expansion Project Description Surface mine SHCC/PCI quality Additional 2 - 3 million tons Full production by 2013 - 2014 Ships Via DBCT |
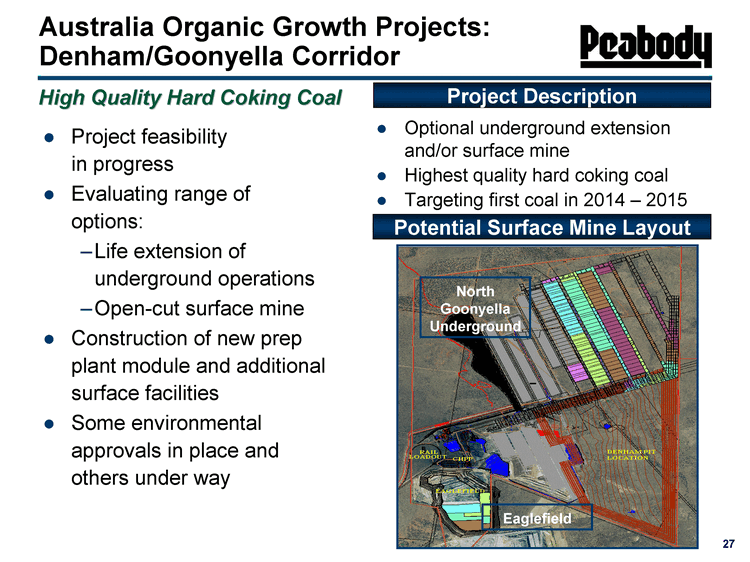
| 27 Project feasibility in progress Evaluating range of options: Life extension of underground operations Open-cut surface mine Construction of new prep plant module and additional surface facilities Some environmental approvals in place and others under way Project Description Potential Surface Mine Layout Optional underground extension and/or surface mine Highest quality hard coking coal Targeting first coal in 2014 - 2015 Australia Organic Growth Projects: Denham/Goonyella Corridor High Quality Hard Coking Coal North Goonyella Underground Eaglefield |

| 28 Permitting complete Increasing production at lowest-cost quartile operation Board approval granted July 2010 $90 million of expansion capital expenditure Expanding prep plant and coal handling capacity Procurement and development initiated Project Description Surface mine Low cost seaborne thermal coal Additional 2 - 3 million tons of seaborne product by 2012 - 2013 Expansion Overview Utilizing BTU's Expanding Newcastle Capacity Australia Organic Growth Projects: Wilpinjong Expansion |

| 29 Additional 3 - 4 million tons by 2014 - 2015 from open cut mine High quality, low ash thermal and PCI coal Feasibility/Design Stage Developing/optimizing mine plans for both open cut and underground operations Exploration drilling ongoing Project Description Current Proposal Australia Organic Growth Projects: Wambo Expansion Utilizing BTU's NCIG Capacity |

| 30 Sufficient Logistics Available to Support Organic Growth Plans 2010 2011 2012 2013 2014 Peabody Est. 7.965 9.073 10.117 11.766 12.031 DBCT Allocation 8.287 8.753 10.504 11.554 12.125 Peabody's Potential Sales vs. Allocation 2010 - 2014 Expected Logistic Chain Allocation Meets/Exceeds Planned Sales 2010 2011 2012 2013 2014 Peabody Est. 9.197 11.105 12.425 14.158 14.954 Newcastle 9.383 11.498 13.554 15.938 17.842 Dalrymple Bay Newcastle (PWCS & NCIG) Peabody Peabody Newcastle DBCT Peabody estimates and analysis, includes potential asset and Trading & Brokerage sales. Actual results may differ from forecast. Reference statement on forward-looking information. Excludes all domestic sales. Estimate Estimate Range |

| 31 31 Assessing additional expansions, extensions at existing operations including Burton North and Wilkie Creek Active exploration drilling programs under way Surat Basin Bowen Basin Assessing Additional Growth Projects Active Exploration Within Current Resource Base |

| 32 Peabody Rapidly Expanding Exploration Efforts Mongolia Mozambique China Indonesia Australia Source: Energy Information Administration International Energy Outlook 2010 and Peabody analysis. Major Undeveloped Met and Thermal Reserves Ramping up exploration program to capture full value chain economics Supplements M&A, JV and greenfield initiatives Teams established in Australia and Mongolia Assessing opportunities in China and Indonesia Active Exploration by Peabody Major Undeveloped Met Reserves Major Undeveloped Thermal Reserves |

| 33 Optimal location to serve Asian demand Premium met and thermal coal products Expanding export capability with rail/port access Significant organic growth program under way Additional growth prospects via exploration, potential M&A Peabody's Australia Portfolio Offers Multiple Advantages |

| 34 Australia Analyst and Investor Tour November 10 - 12, 2010 |
