Attached files
| file | filename |
|---|---|
| 8-K - FORM 8-K - NTELOS HOLDINGS CORP. | d8k.htm |
 Investor Presentation
Third Quarter 2010 Update
Exhibit 99.1 |
 1
Use of Non-GAAP Financial Measures
Included in this presentation are certain non-GAAP financial measures that
are not determined in accordance with US generally accepted accounting
principles. These financial performance measures are not indicative of cash
provided or used by operating activities and exclude the effects
of certain
operating, capital and financing costs and may differ from comparable
information provided by other companies, and they should not be considered
in isolation, as an alternative to, or more meaningful than measures of
financial performance determined in accordance with US generally
accepted
accounting principles. These financial performance measures are
commonly
used in the industry and are presented because NTELOS believes they
provide relevant and useful information to investors. NTELOS utilizes these
financial performance measures to assess its ability to meet future capital
expenditure and working capital requirements, to incur indebtedness if
necessary, and to fund continued growth. NTELOS also uses these
financial
performance measures to evaluate the performance of its business, for
budget planning purposes and as factors in its employee compensation
programs. |
 2
Special Note Regarding Forward-Looking
Statements
Any statements contained in this presentation that are not statements of
historical fact, including statements about our beliefs and expectations, are
forward-looking statements and should be evaluated as such. The words
“anticipates,”
“believes,”
“expects,”
“intends,”
“plans,”
“estimates,”
“targets,”
“projects,”
“should,”
“may,”
“will”
and similar words and expressions are
intended to identify forward-looking statements. Such forward-looking
statements reflect, among other things, our current expectations, plans and
strategies, and anticipated financial results, all of which are subject to known
and unknown risks, uncertainties and factors that may cause our actual
results to differ materially from those expressed or implied by these forward-
looking statements. Many of these risks are beyond our ability to control or
predict. Because of these risks, uncertainties and assumptions, you should not
place undue reliance on these forward-looking statements. Furthermore,
forward-looking statements speak only as of the date they are made. We do
not undertake any obligation to update or review any forward-looking
information, whether as a result of new information, future events or
otherwise. Important factors with respect to any such forward-looking
statements,
including
certain
risks
and
uncertainties
that
could
cause
actual
results to differ from those contained in the forward-looking statements,
include, but are not limited to: |
 3
Special Note Regarding Forward-Looking Statements
(cont.)
rapid development and intense competition in the telecommunications industry;
adverse economic conditions; operating and financial restrictions imposed by our
senior credit facility; our cash and capital requirements; declining prices for our
services; the potential to experience a high rate of customer turnover; our
dependence on our affiliation with Sprint Nextel (“Sprint”); a potential increase in
our roaming rates and wireless handset subsidy costs; the potential for Sprint to build
networks in our markets; federal and state regulatory fees, requirements and
developments; loss of our cell sites; the rates of penetration in the wireless
telecommunications industry; our reliance on certain suppliers and vendors; the
successful completion of the pending acquisition of the FiberNet business, and the
effect thereof on our business; our ability to successfully integrate the operations of
the FiberNet business upon its acquisition; the failure to realize synergies and cost
savings from the pending acquisition of the FiberNet business or delay in realization
thereof; and other unforeseen difficulties that may occur. These risks and
uncertainties are not intended to represent a complete list of all risks and
uncertainties inherent in our business, and should be read in conjunction with the
more detailed cautionary statements and risk factors included in our SEC filings,
including our Annual Reports filed on Forms 10-K.
|
 Company Overview |
 Company
Overview •
Leading provider
of
wireless
and
wireline
communications
services
in
Virginia,
West
Virginia,
Pennsylvania and Maryland
•
Strategies
•
Facilities based
•
Retail & Wholesale
•
Multiple products
•
Disciplined approach to capital investments
•
Leverage brand
•
Leverage common cost
•
Wireless revenue 5-year CAGR of 11%
•
Exclusive strategic wholesale Sprint agreement through July 2015
•
Wireline business includes a fiber-based CLEC with double digit strategic high-speed
broadband product revenue growth and an RLEC with strong Adjusted EBITDA margins
•
Continued
revenue
growth
fueled
by
investments
in
cell
sites
and
fiber
network
upgrades
and acquisitions
•
Strong growth in Free Cash Flows
5 |
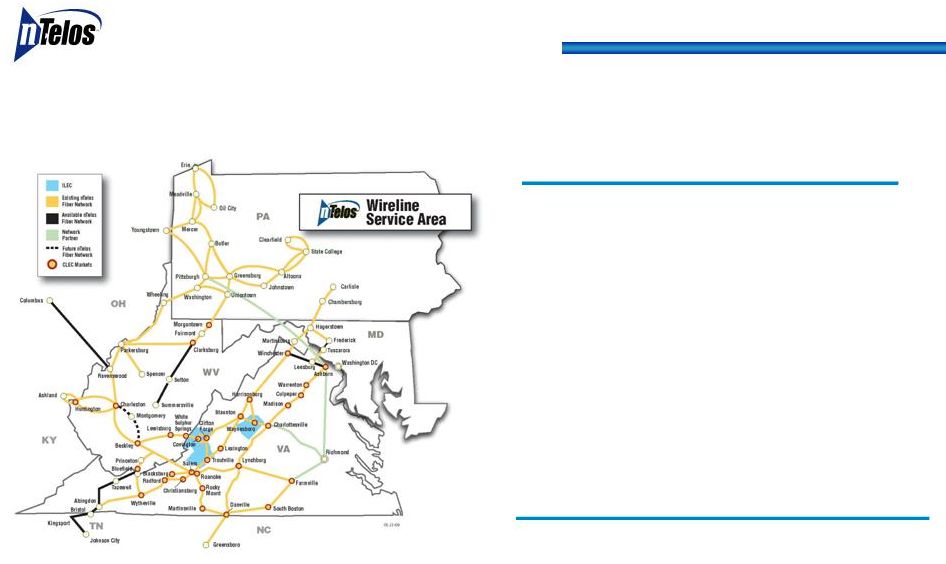
 6
Regionally-Focused Service Provider
($ in millions)
(1)
As of September 30, 2010 or for the twelve months ended September 30, 2010.
(2)
Throughout this presentation, year over year (YOY) comparisons are calculated using
the twelve months ended on September 30, 2009 and September 30, 2010.
•
Average of 23.0 MHz of spectrum
•
5.6 million covered POPs
•
434K
(1)
retail subscribers
•
Data ARPU growth of 37% driven by EV-DO
upgrade and expanded prepay data offerings
•
Wholesale revenues (primarily Sprint Nextel
agreement) of $113 million
•
37% YTD Adjusted EBITDA margin
Wireless ($406M Revenue / $149M Adj. EBITDA)
(1) (2) |
 7
Wireline: Repositioning as High Speed Data Provider
(1)
($ in millions)
(1)
As of September 30, 2010 or for the twelve months ended September 30, 2010.
•
Competitive Segment
•
Commercial or Institutional
Healthcare
Government
Education
Regional Banking
•
26% YoY
growth in strategic broadband and
video services
•
45% Adjusted EBITDA margin
•
Integration of 2,200 fiber route mile assets of
Allegheny Energy, Inc. complete
•
Acquisition of FiberNet
expected to close 4Q10
•
RLEC -
Growth in Data and Video
•
98% DSL coverage with 6 MB speed
•
23% IPTV penetration of homes passed with fiber;
30%-35% penetration of neighborhoods available over
18 months
Wireline
($131M Revenue / $75M Adj. EBITDA)
(1)
Proforma
for FiberNet
Acquisition |
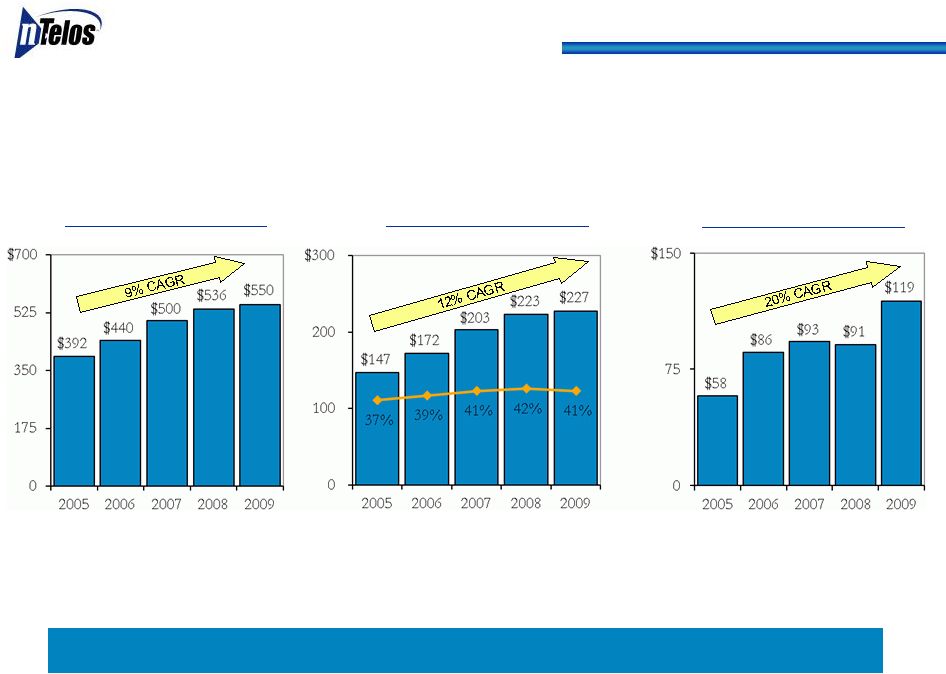 8
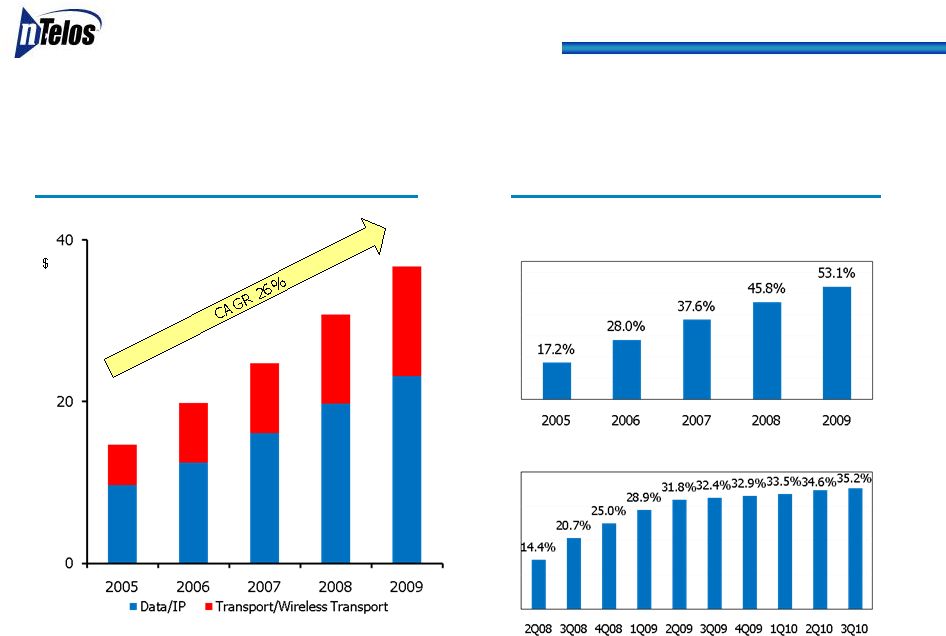
Focused on Growth Opportunities
($ in millions)
Total Revenue
Total Adj. EBITDA/
Margin %
Free Cash Flow Growth
(1)
Throughout this presentation, Free Cash Flow is defined as Consolidated Adjusted EBITDA less
CAPEX, exclusive of $26.7 million of fiber optics and network assets and transport and
data service contract assets acquired from Allegheny Energy, Inc. on December 31, 2009.
Note: Throughout
this
presentation,
Compound
Annual
Growth
Rates
(CAGR)
presented
are
calculated
over
the
period
of
2005
to
2009.
Free Cash Flow
(1) |
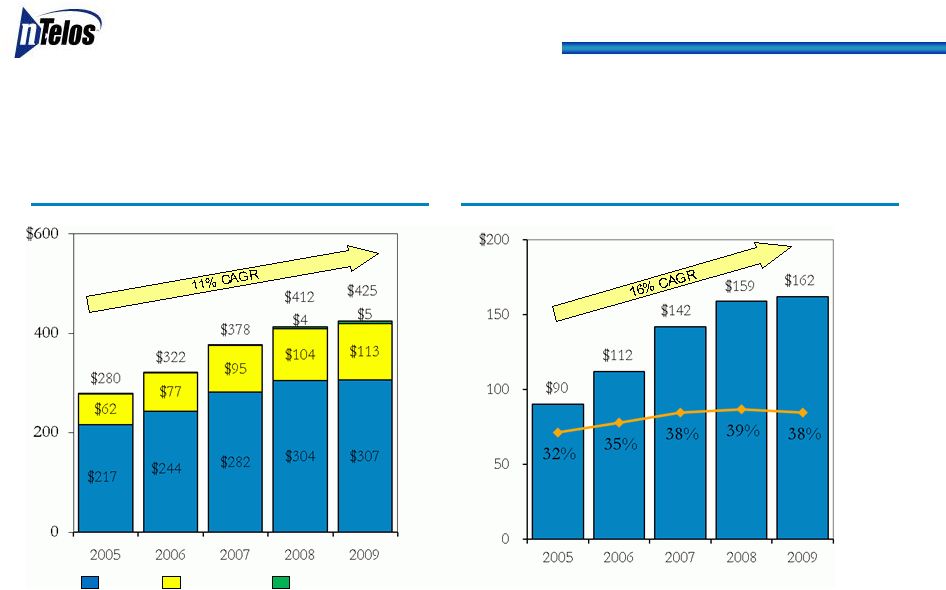 9
Revenue
(1)
Network Upgrade and Data Drives Wireless
($ in millions)
Adjusted EBITDA/Margin %
(1)
Refer to Form 10-K for 2009 for explanation and impact of change from gross to net
reporting of handset insurance revenues and costs effective April 1, 2008.
Retail
Wholesale
Roaming |
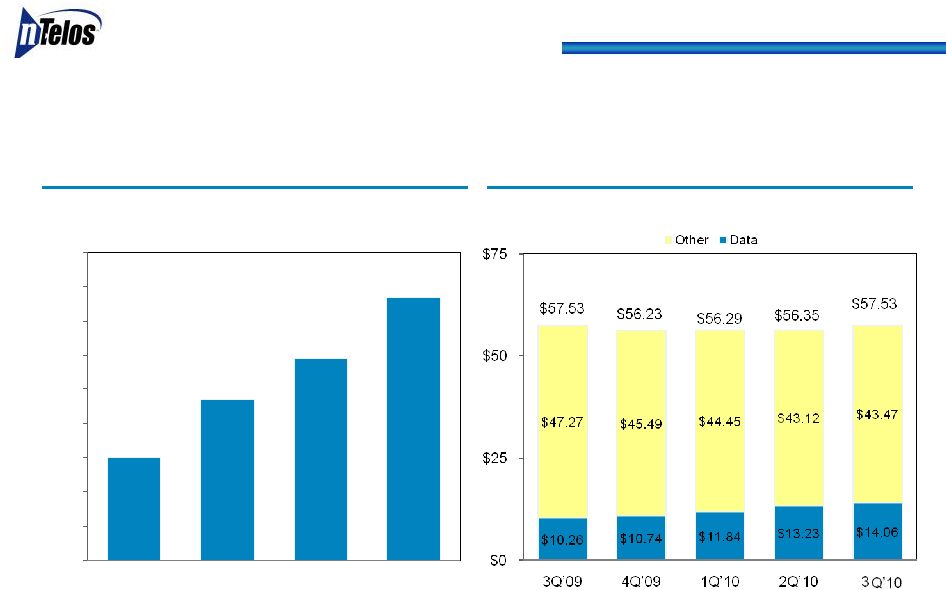
 10
3Q‘09 to 3Q‘10 Wireless Results
($ in millions)
Revenue
Adjusted EBITDA/Margin %
Postpay
subscriber
revenues
increased
$1.2
million
from
2Q’10
to
3Q’10
$69
$68
$68
$66
$66
$29
$28
$28
$28
$29
$5
$5
$8
$6
$6
$100
$104
$104
$102
$100
$0
$50
$100
3Q’09
4Q’09
1Q’10
2Q’10
3Q'10
Subscriber
Wholesale
Equipment/Other
$36
$38
$38
$36
$39
36%
39%
37%
38%
35%
$0
$25
$50
3Q’09
4Q’09
1Q’10
2Q’10
3Q'10
10%
15%
20%
25%
30%
35%
40%
45%
50%
55%
60% |
 •
NTELOS brand positioned as the best value in wireless
•
Leveraging
extensive
retail
presence
while
growing
indirect
distribution
channel
“Hub
and
Spoke”
distribution
Branded exclusive dealers program launched
Overall refurbish of retail stores
•
Approximately
91,000
total
device
upgrades
YTD
as
of
9/30/10,
up
9%
from
9/30/09
•
The
most
complete
nationwide
coverage
with
no
roaming
–
“Same
Nation.
Better
Price.”
•
Hagerstown and Martinsburg markets launched in 3Q’10
•
Emphasis on Postpay
plans
Expansion of data products and services
Device
line
up
includes
a
variety
of
smartphones
& data-centric brands and models
Smartphone
and
data
card
penetration
of
postpay
base 18% for 3Q’10, up from 11% in 3Q’09
•
FRAWG expansion to western markets 3Q’10
•
New
Prepay
pricing
July
1
–
ARPU for new sales up more than $3
•
Focus on churn improvement resulting in positive trends:
Churn
.
3Q’09
4Q’09
Postpay
2.4% 2.2%
Total
3.6% 3.4% Wireless Growth
Initiatives 1Q’10
2Q’10
3Q’10
2.3% 1.8%
3.1% 3.0%
3.4%
11
2.1% |
 2010
Distribution Update Shifting
direct
distribution
to
Postpay
focused, company owned locations
Relocation of Corporate Retail locations to high profile, highly visible locations:
Portsmouth, Harrisonburg,
Winchester,
Military,
Morgantown
Mall,
Huntington,
Suffolk
Redesign
of
larger
new
company
owned
stores
that
incorporates
brand
position
with
hi-tech,
modern look and feel
Corporate
Retail
overhaul
–
cultural change focused on Customer
Satisfaction
Training
Optimizing Full-Time/Part-Time employee usage for proper store coverage
Enhanced compensation rewards for upgrading and renewing customers
Explode Indirect Dealer channel to support higher prepay growth
New Exclusive Retailer Program (ERP)
ERP
dealers
expected
to
more
than
double
from
September
30,
2009
to
year-end
2010
12 |
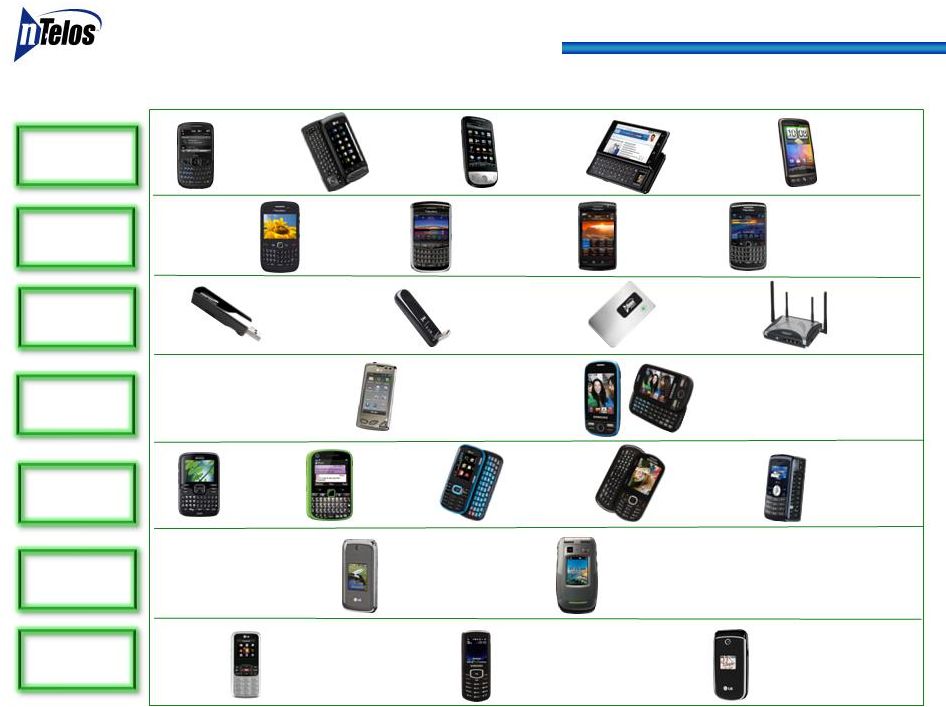 Feature 1X
and Value
BlackBerry
Curve 8530
Data
Card
QWERTY
Feature
EV-DO
Touch
LG Script
HTC Snap
Windows
Mobile
Novatel
MC760
Axesstel
MV440
HTC Hero
Android
Motorola
Quantico
BlackBerry
Tour 9630
Device Line-up 4Q 2010
Samsung
Stunt
LG 100
Smartphone
Novatel
MiFi
Franklin Wireless
U210
LG Ellipse
Kyocera
Torino
LG Nite
LG Wine II
Motorola
Grasp
LG Samba
Samsung
Messager
Touch
BlackBerry
Bold 9650
BlackBerry
Storm2 9550
(Nov)
Motorola
Milestone
Android
HTC Desire
Android
LG Axis
Android
(Nov)
Blackberry
Samsung
Profile
(Nov)
13 |
 14
Successful Growth in Data Subscribers and Postpay
ARPU
Postpay
Retail ARPU
Postpay
Subscribers with EV-DO
Data Devices
77%
30%
47%
59%
0%
10%
20%
30%
40%
50%
60%
70%
80%
90%
6/30/08
6/30/09
6/30/10
9/30/10 |
 15
Wireless
Wholesale
Revenue
(1)
Strategic
Network
Alliance
Leverages
NTELOS’
Network
•
Sprint Nextel Strategic Network
Alliance through at least July 2015
•
$9 million monthly minimum revenue
guarantee
•
Attractive contribution margin
•
Growing Usage
•
Significant growth in both home &
travel data usage since EV-DO
launched
•
Voice traffic back on the rise
•
October 2010 calculated revenues
exceeded the $9 million monthly
minimum –
first time since rate reset
in July 2009
($ in millions)
Attractive Margin Revenue Stream
$27
$27
$27
$27
$27
(1)
Dollars in millions, excludes roaming. |
 16
Greensboro, NC
(1)
As of September 30, 2010 or for the twelve months ended
September 30, 2010.
($ in millions)
Data Driving Wireline
Growth
(1)
Competitive
($75M Revenues / $34M Adj. EBITDA)
(1)
•
Revenue growth of 13% YoY
•
Adjusted EBITDA growth of 24% YoY
•
45% YTD Adjusted EBITDA margin
•
Strategic broadband and video revenue
growth of 21% YOY to $51 million
•
4,900 mile existing fiber network including
recently acquired 2,200 mile Allegheny
fiber network
•
3 markets launched in late 2009
•
4 markets launched by
year-end 2010
•
Repositioning assets (data/video)
•
Broadband customer penetration at 55%
•
IPTV now is available to over 10,000 homes
•
Continued strong Adjusted EBITDA margin
RLEC ($55M Revenue / $41M Adj. EBITDA)
(1) |
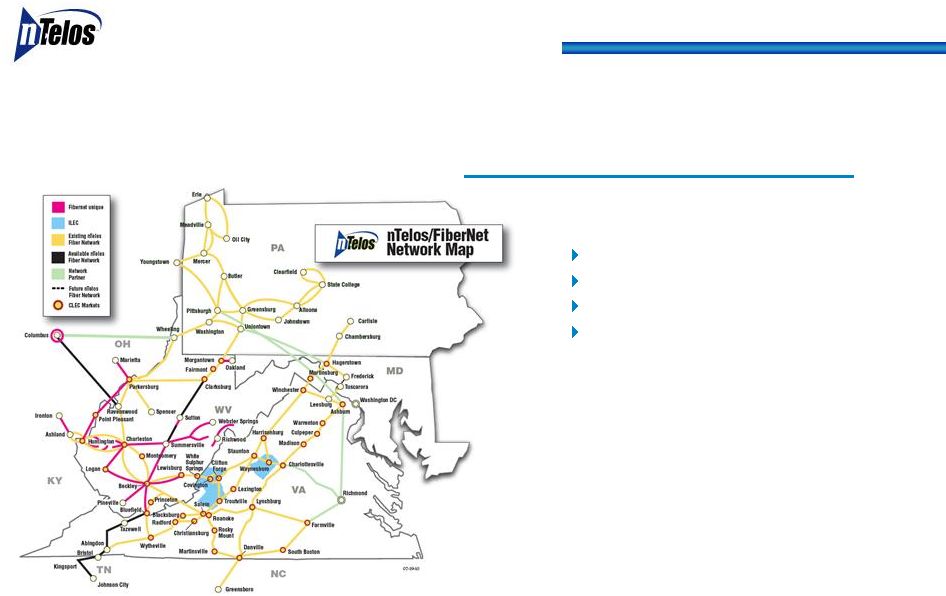
 NTELOS–FiberNet
Offers Strong Combination
Strategic Benefits of a Robust Mid-Atlantic Network
Continues regional broadband acquisition strategy
Enhances position in West Virginia and accelerates growth in Pennsylvania and
Maryland with more capacity
Increases capacity and growth potential for carrier transport and fiber to the cell
Significant Financial Benefits
Free cash flow accretive day one with growth potential
Significant synergies from network operations with more diverse routes into
more second tier and rural markets
Value enhancement with improved competitive position and growth profile
Stronger Regional Operations
Opportunity to extend “best-in-class”
operator in West Virginia
Add key
personnel
resources
to
NTELOS’
wireline
operations
Existing technology and systems can be leveraged and integrated quickly
17 |
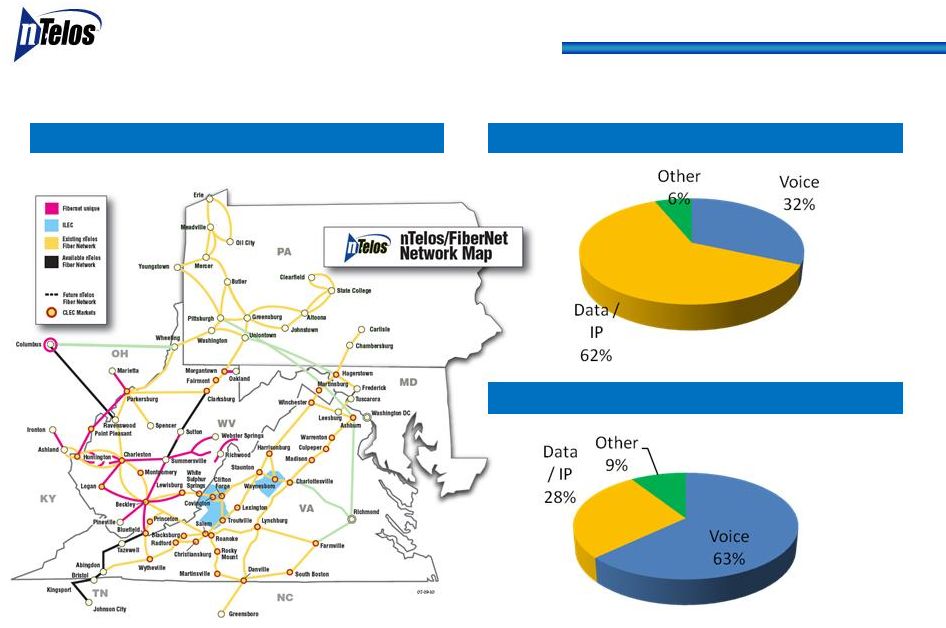 18
Consolidated Network
($ in millions)
NTELOS
Competitive Revenue
FiberNet
Revenue
(1)
Network Overlap Map
(1)(2)
(1)
FY 2009
(2)
NTELOS before intercompany eliminations
Proforma
for FiberNet
Acquisition |
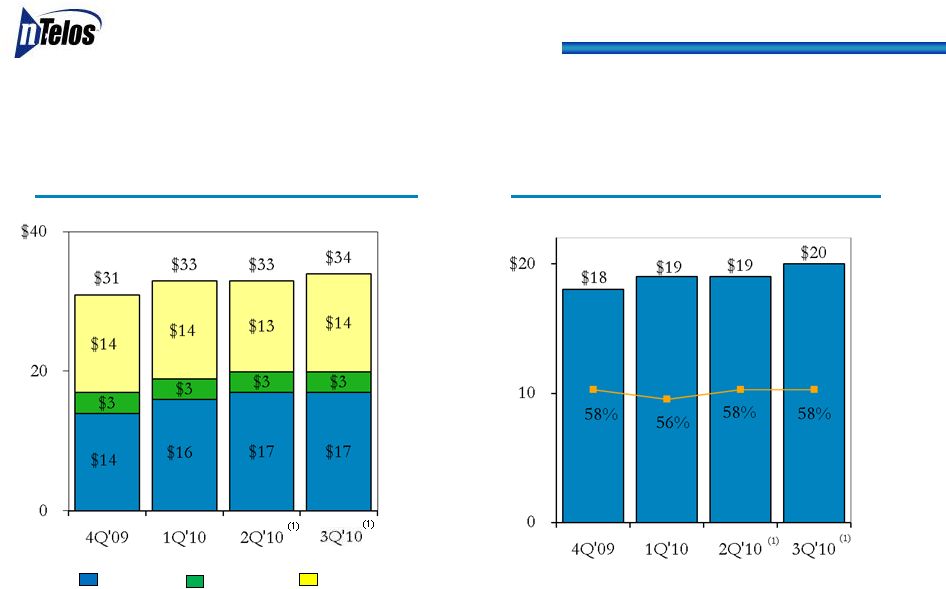
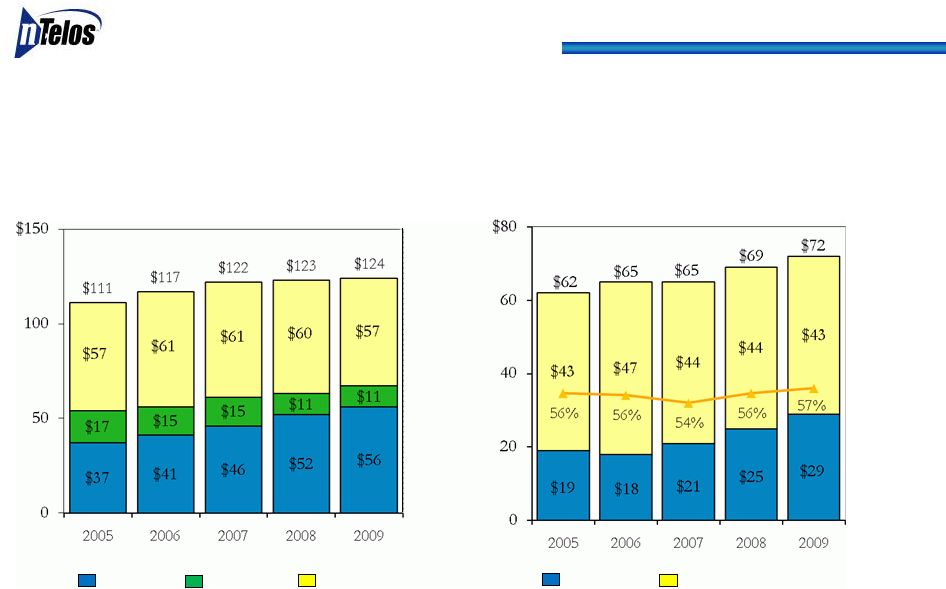 19
Adjusted EBITDA/Margin%
Revenue
Wireline
Provides Strong, Stable Cash Flow
($ in millions)
Note: Competitive -
Strategic includes voice and broadband data services, IPTV video, high-capacity network
access and transport services.
Competitive
-
Strategic
Competitive
-
Other
RLEC
Competitive
RLEC |
 20
Penetration
Transport/Data/IP Revenue
Competitive Growth Drivers
($ in millions)
Video –
Neighborhoods open in 1Q`08
Broadband –
Customer Penetration
(1) Revenue before intercompany eliminations
(1)
$14.7
$19.8
$24.8
$30.8
$36.8 |
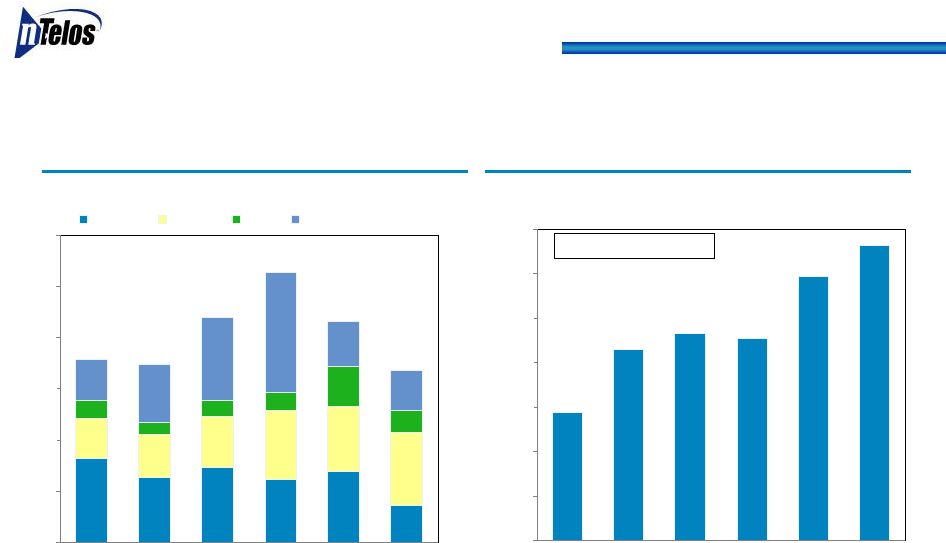
 21
Adjusted EBITDA/Margin%
Revenue
Wireline
YTD ‘10 over YTD ‘09 Strong, Stable Cash Flow
($ in millions)
(1)
Includes contributions from acquisition of certain Allegheny fiber optic and
network assets and related transport and data service contracts on 12/31/09.
Competitive
-
Strategic
Competitive
-
Other
RLEC
(1)
(1) |
 Financial
Overview |
 $119
$91
$93
$86
$58
$133
$0
$20
$40
$60
$80
$100
$120
$140
2005
2006
2007
2008
2009
LTM
9/30/10
Free Cash Flow
Consolidated CapEx
($ in millions)
Accelerating Consolidated Free Cash Flow
$41
$32
$37
$31
$35
$18
$20
$21
$25
$33
$31
$36
$8
$6
$7
$9
$20
$28
$41
$59
$22
$20
$10
$84
$110
$132
$87
$89
$108
$0
$25
$50
$75
$100
$125
$150
2005
2006
2007
2008
2009
LTM
9/30/10
Wireless
Wireline
Other
Discretionary
(1)
(1)
Includes incremental EVDO investment and strategic fiber builds.
(2)
Includes approximately $11M for a new wireless prepaid billing platform and a web portal.
2005 -
LTM: 23% CAGR
(2)
23 |
 ($ in
millions) (1)
Debt balances and related ratios are based on actual debt outstanding. Refer
to Form 10-K for the year ended December 31, 2009 for carrying basis of
debt obligations which are reported net of unamortized original issuance discounts.
(2)
Pro forma cash
reflects
reduction
in
cash
for
estimated
FiberNet
purchase
cost
and
related
fees
of approximately $173 million.
(3)
Pro
forma
LTM
9/30/10
reflects
FiberNet
adjusted
EBITDA of $26.0 million, before synergies of $7 million to $9 million expected to
be achieved during the year following the completion of integration.
Capitalization
24
PF LTM
2008
2009
LTM 9/30/10
9/30/10
1st lien senior secured credit facility
(1)
606.5
$
633.4
$
753.3
$
753
$
Capital Leases
1.4
$
1.5
$
1.8
$
2
$
Revolver
-
$
-
$
-
$
-
$
Total Debt
607.9
$
634.9
$
755.1
$
755
$
Cash
(2)
65.7
$
51.1
$
188.8
$
16
$
Net Debt (total Debt less Cash)
542.2
$
583.8
$
566.3
$
739
$
Adjusted EBITDA
223.2
$
227.1
$
217.2
$
243
$
(3)
Net Debt Leverage Ratio
2.4x
2.6x
2.6x
3.0x
(3) |
 Consistently
Strong Financial Performance Numerous Catalysts for Sustainable Topline
Growth
Focused on Long-Term Net Income and Free Cash Flow Growth
Diversified Business Model
Network Upgrade Drives Wireless Growth
Data Revenue Growth
High-Margin Wholesale Revenue
Strong Performing and Growing Regional Wireline
Business Focused on
Data Transport and IP based Services
Scalable Systems for Continued Expansion
Experienced Management Team
Successful acquisition integration track record
Summary
25 |
 Appendix
|
 27
Adjusted EBITDA Reconciliation
($ in millions)
9-months ended:
2005
2006
2007
2008
2009
9/30/10
Consolidated
Operating Income
$53
$61
$100
$115
$130
$94
Depreciation and Amortization
83
85
97
103
92
65
Capital and Operational Restructuring
Charges
15
-
-
-
-
-
Accretion of Asset Retirement Obligations
1
1
1
1
1
1
Advisory Termination Fees
-
13
-
-
-
-
Gain on Sale of Assets
(9)
-
-
-
-
-
Secondary Offering Costs
-
-
1
-
-
-
Equity Based Compensation
4
13
4
3
3
4
Acquisition Related Charges
-
-
-
-
-
1
Voluntary Early Retirement and Workforce Reduction Plans
-
-
-
1
1
-
Adjusted EBITDA
$147
$173
$203
$223
$227
$165 |
 28
Adjusted EBITDA Reconciliation
($ in millions)
9-months ended:
2005
2006
2007
2008
2009
9/30/10
Wireless
Operating Income
$32
$53
$71
$85
$97
$69
Depreciation and Amortization
57
58
70
73
63
43
Voluntary Early Retirement and Workforce Reduction Plans
-
-
-
-
1
-
Accretion of Asset Retirement Obligations
1
1
1
1
1
1
Adjusted EBITDA
$90
$112
$142
$159
$162
$113
Wireline
Operating Income
$36
$39
$38
$41
$43
$34
Depreciation and Amortization
25
26
27
27
29
23
Voluntary Early Retirement and Workforce Reduction Plans
-
-
-
1
-
-
Adjusted EBITDA
$61
$65
$65
$69
$72
$57 |
 29
ARPU
Reconciliation
($ in thousands, except for subscribers and ARPU data)
Nine Months Ended:
Three Months Ended:
September 30, 2009
September 30, 2010
September 30, 2009
September 30, 2010
Average Revenue per Handset/Unit (ARPU)
1
(amounts in thousands except for subscribers and ARPU)
Operating Revenues
135,686
$
134,267
$
416,351
$
404,140
$
Less: Wireline and other operating revenue
(31,460)
(33,895)
(94,061)
(100,120)
Wireless
communications revenue 104,226
100,372
322,290
304,020
Less: Equipment revenue from sales to new customers
(1,525)
(1,695)
(4,408)
(6,296)
Less: Equipment revenue from sales to existing customers
(4,788)
(3,621)
(14,537)
(11,653)
Less: Wholesale revenue
(28,507)
(28,713)
(89,870)
(85,060)
Plus (Less): Other revenues, eliminations and adjustments
856
(276)
51
(659)
Wireless
gross subscriber revenue 70,262
$
66,067
$
213,526
$
200,352
$
Less: Paid in advance subscriber revenue
(15,535)
(13,930)
(51,784)
(45,583)
(Less) Plus: Adjustments
(1,121)
211
(870)
151
Wireless
gross postpay subscriber revenue 53,606
$
52,348
$
160,872
$
154,920
$
Average subscribers
440,052
435,042
441,287
439,930
Total ARPU
53.22
$
50.62
$
53.76
$
50.60
$
Average postpay subscribers
310,601
303,329
312,348
303,463
Postpay ARPU
57.53
$
57.53
$
57.23
$
56.72
$
Wireless gross subscriber revenue
70,262
$
66,067
$
213,526
$
200,352
$
Less:
Wireless voice and other feature revenue
(57,942)
(49,845)
(177,686)
(154,455)
Wireless
data revenue 12,320
$
16,222
$
35,840
$
45,897
$
Average subscribers
440,052
435,042
441,287
439,930
Total Data ARPU
9.33
$
12.43
$
9.02
$
11.59
$
Wireless gross postpay subscriber revenue
53,606
$
52,348
$
160,872
$
154,920
$
Less: Wireless postpay voice and other feature revenue
(44,047)
(39,557)
(133,228)
(119,300)
Wireless
postpay data revenue 9,559
$
12,791
$
27,644
$
35,620
$
Average postpay subscribers
310,601
303,329
312,348
303,463
Postpay data ARPU
10.26
$
14.06
$
9.83
$
13.04
$
(1)
Average monthly revenues per subscriber/unit with service, or ARPU, is an industry metric that
measures service revenues per period divided by the weighted average number of
subscribers with service during that period. ARPU as defined may not be similar to ARPU measures of other companies, is
not a measurement under GAAP and should be considered in addition to, but not as a substitute
for, the information contained in the Company’s statement of operations. The
Company closely monitors the effects of new rate plans and service offerings on ARPU in order to determine their
effectiveness. ARPU provides management useful information concerning the appeal of
NTELOS rate plans and service offerings and the Company’s performance in attracting
and retaining high value customers. |
 30
Summary of Operating Results
($ in thousands)
Nine Months Ended:
Three Months Ended:
(1)
First
quarter
2010
includes
a
$0.9
million
charge
related
to
severance
benefits
pursuant
to
an
executive
employment
agreement.
Please see Form 8-K filed with
the
SEC
on
March
12,
2010
for
additional
information.
First
quarter
2009
includes
a
one-time
cash
payment
of
$1.0
million
to
James
A.
Hyde,
NTELOS'
then
newly
hired president and COO.
September 30, 2009
September 30, 2010
September 30, 2009
September 30, 2010
Operating Revenues
Wireless PCS Operations
104,226
$
100,372
$
322,290
$
304,020
$
Subscriber Revenues
69,060
65,983
212,438
199,920
Wholesale/Roaming Revenues, net
28,507
28,713
89,870
85,060
Equipment Revenues
6,313
5,316
18,945
17,949
Other Revenues
346
360
1,037
1,091
Wireline
Operations
RLEC
14,395
13,933
43,543
41,595
Competitive Wireline
16,944
19,851
50,154
58,148
WirelineTotal
31,339
33,784
93,697
99,743
Other
121
111
364
377
135,686
$
134,267
$
416,351
$
404,140
$
Operating Expenses
Wireless PCS Operations
65,106
$
63,956
$
196,363
$
191,090
$
Cost of Sales and Services
Cost of Sales -Equipment
8,509
7,246
27,323
21,622
Cost of Sales -Access & Other
11,389
9,669
33,228
28,283
Maintenance and Support
15,004
15,870
44,005
46,266
Customer Operations
24,938
25,301
75,016
76,517
Corporate Operations
5,266
5,870
16,791
18,402
Wireline
Operations
RLEC
3,326
3,428
10,792
11,028
Competitive Wireline
9,446
10,687
29,129
31,669
WirelineTotal
12,772
14,115
39,921
42,697
Other
1
1,170
1,112
5,041
5,274
79,048
$
79,183
$
241,325
$
239,061
$
Adjusted
EBITDA
(a
non-GAAP
Measure)
Wireless PCS Operations
39,120
$
37.5%
36,416
$
36.3%
125,927
$
112,930
$
Wireline
Operations
RLEC
11,069
76.9%
10,505
75.4%
32,751
30,567
Competitive Wireline
7,498
44.3%
9,164
46.2%
21,025
26,479
WirelineTotal
18,567
59.2%
19,669
58.2%
53,776
57,046
Other
1
(1,049)
(1,001)
(4,677)
(4,897)
56,638
$
41.7%
55,084
$
41.0%
175,026
$
165,079
$
Capital Expenditures
Wireless PCS Operations
7,759
$
9,669
$
42,381
$
29,754
$
Wireline
Operations
RLEC
3,636
2,411
10,498
7,904
Competitive Wireline
5,914
5,339
21,270
22,429
WirelineTotal
9,550
7,750
31,768
30,333
Other
4,161
2,291
16,863
7,445
21,470
$
19,710
$
91,012
$
67,532
$
Wireless PCS Operations
31,361
$
26,747
$
83,546
$
83,176
$
Wireline
Operations
RLEC
7,433
8,094
22,253
22,663
Competitive Wireline
1,584
3,825
(245)
4,050
WirelineTotal
9,017
11,919
22,008
26,713
Other
(5,210)
(3,292)
(21,540)
(12,342)
35,168
$
35,374
$
84,014
$
97,547
$
(before depreciation & amortization, asset
impairment charges, accretion of asset retirement obligations, equity based compensation, acquisition related charges and
charges from voluntary early retirement and workforce reduction plans, a non-GAAP
Measure of operating expenses) Adjusted
EBITDA
less
Capital
Expenditures
(a
non-GAAP
measure)
1
1 |