Attached files
| file | filename |
|---|---|
| 8-K - 8-K - ARES CAPITAL CORP | a10-17362_28k.htm |
| EX-99.1 - EX-99.1 - ARES CAPITAL CORP | a10-17362_2ex99d1.htm |
Exhibit 99.2
|
|
Third Quarter 2010 Investor Presentation ARES CAPITAL CORPORATION |
|
|
Important Notice This presentation contains “forward looking statements” within the meaning of Section 21E of the Securities Exchange Act of 1934, as amended, that are subject to risks and uncertainties. Actual outcomes and results could differ materially from those suggested by this presentation due to the impact of many factors beyond the control of Ares Capital Corporation, including those listed in the "Risk Factors" section of our filings with the Securities and Exchange Commission (“SEC”). Any such forward-looking statements are made pursuant to the safe harbor provisions available under applicable securities laws and Ares Capital Corporation assumes no obligation to update or revise any such forward-looking statements. Certain information discussed in this presentation (including information relating to portfolio companies) was derived from third party sources and has not been independently verified and, accordingly, the Company makes no representation or warranty in respect of this information. The following slides contain summaries of certain financial and statistical information about Ares Capital Corporation. The information contained in this presentation is summary information that is intended to be considered in the context of our SEC filings and other public announcements that we may make, by press release or otherwise, from time to time. We undertake no duty or obligation to publicly update or revise the information contained in this presentation. In addition, information related to past performance, while helpful as an evaluative tool, is not necessarily indicative of future results, the achievement of which cannot be assured. You should not view the past performance of Ares Capital Corporation, or information about the market, as indicative of Ares Capital Corporation’s future results. This presentation does not constitute an offer to sell or the solicitation of an offer to buy any securities of Ares Capital Corporation. |
|
|
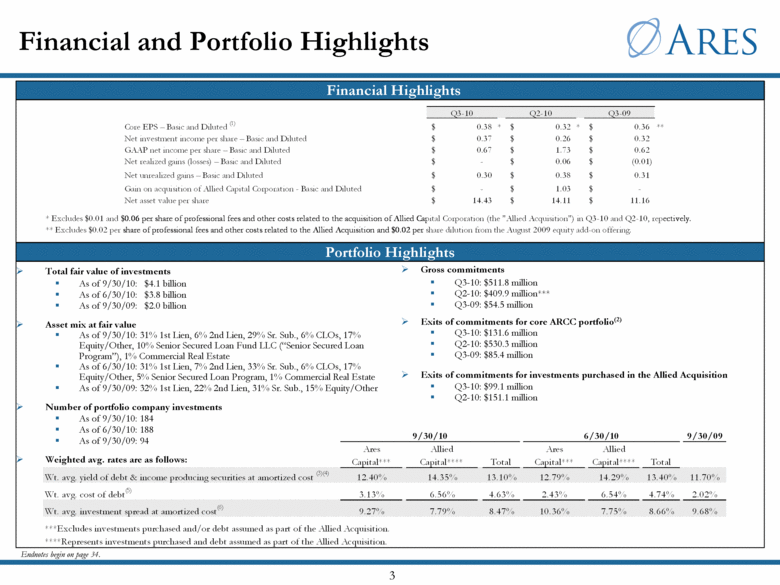
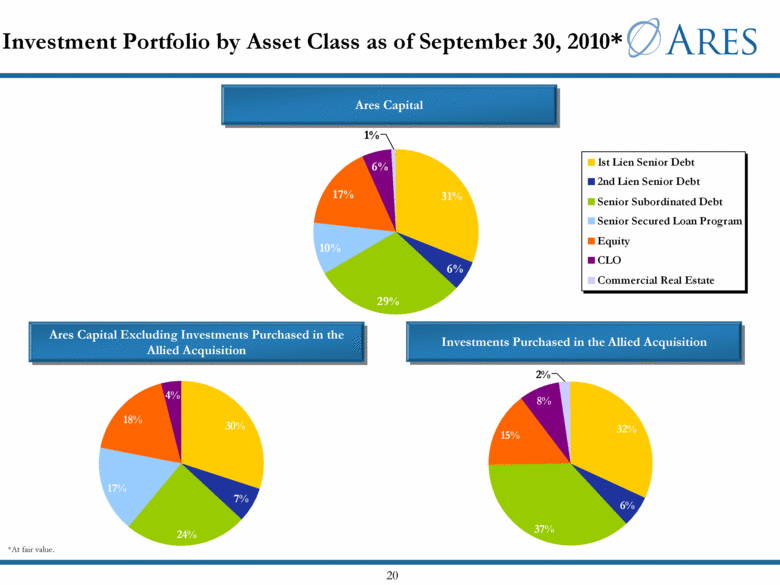
Financial and Portfolio Highlights Endnotes begin on page 34. Gross commitments Q3-10: $511.8 million Q2-10: $409.9 million*** Q3-09: $54.5 million Exits of commitments for core ARCC portfolio(2) Q3-10: $131.6 million Q2-10: $530.3 million Q3-09: $85.4 million Exits of commitments for investments purchased in the Allied Acquisition Q3-10: $99.1 million Q2-10: $151.1 million Total fair value of investments As of 9/30/10: $4.1 billion As of 6/30/10: $3.8 billion As of 9/30/09: $2.0 billion Asset mix at fair value As of 9/30/10: 31% 1st Lien, 6% 2nd Lien, 29% Sr. Sub., 6% CLOs, 17% Equity/Other, 10% Senior Secured Loan Fund LLC (“Senior Secured Loan Program”), 1% Commercial Real Estate As of 6/30/10: 31% 1st Lien, 7% 2nd Lien, 33% Sr. Sub., 6% CLOs, 17% Equity/Other, 5% Senior Secured Loan Program, 1% Commercial Real Estate As of 9/30/09: 32% 1st Lien, 22% 2nd Lien, 31% Sr. Sub., 15% Equity/Other Number of portfolio company investments As of 9/30/10: 184 As of 6/30/10: 188 As of 9/30/09: 94 Weighted avg. rates are as follows: Portfolio Highlights Financial Highlights Wt. avg. investment spread at amortized cost(6) * Excludes $0.01 and $0.06 per share of professional fees and other costs related to the acquisition of Allied Capital Corporation (the "Allied Acquisition") in Q3-10 and Q2-10, repectively. Q3-10 Q2-10 Q3-09 $ 0.38 * $ 0.32 * $ 0.36 ** $ 0.37 $ 0.26 $ 0.32 $ 0.67 $ 1.73 $ 0.62 $ - $ 0.06 $ (0.01) $ 0.30 $ 0.38 $ 0.31 $ - $ 1.03 $ - $ 14.43 $ 14.11 $ 11.16 ** Excludes $0.02 per share of professional fees and other costs related to the Allied Acquisition and $0.02 per share dilution from the August 2009 equity add-on offering. Weighted avg. rates are as follows: Capital*** Capital**** Total Capital*** Capital**** Total Wt. avg. yield of debt & income producing securities at amortized cost (3)(4) 12.40% 14.35% 13.10% 12.79% 14.29% 13.40% 11.70% Wt. avg. cost of debt(5) 3.13% 6.56% 4.63% 2.43% 6.54% 4.74% 2.02% Wt. avg. investment spread at amortized cost(6) 9.27% 7.79% 8.47% 10.36% 7.75% 8.66% 9.68% ***Excludes investments purchased and/or debt assumed as part of the Allied Acquisition. ****Represents investments purchased and debt assumed as part of the Allied Acquisition. 9/30/10 6/30/10 9/30/09 Ares Allied Ares Allied 9/30/10 6/30/10 9/30/09 Ares Allied Ares Allied |
|
|
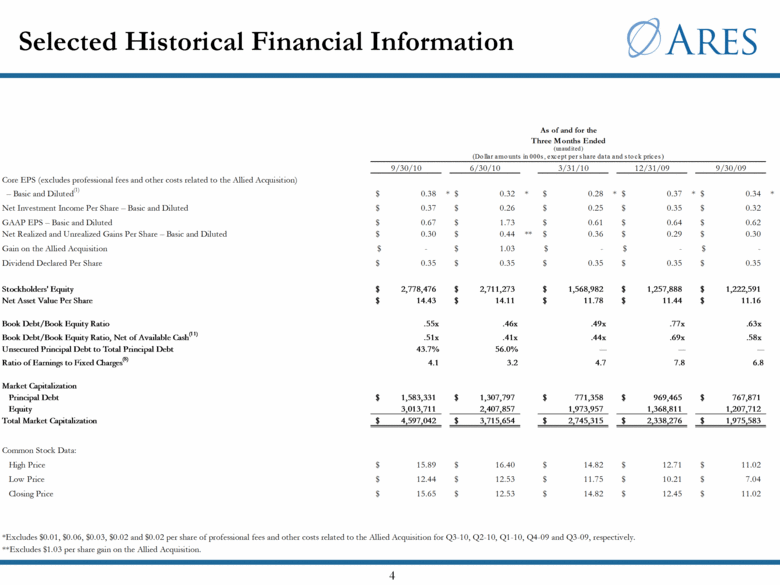
Selected Historical Financial Information **Excludes $1.03 per share gain on the Allied Acquisition. "As of and for the Three Months Ended" (unaudited) (Dollar amounts in 000s, except per share data and stock prices) 9/30/10 6/30/10 3/31/10 12/31/09 9/30/09 "Core EPS (excludes professional fees and other costs related to the Allied Acquisition) – Basic and Diluted(1)" $0.38 * $0.32 * $0.28 * $0.37 * $0.34 Net Investment Income Per Share – Basic and Diluted $0.37 $0.26 $0.25 $0.35 $0.32 GAAP EPS – Basic and Diluted $0.67 $1.73 $0.61 $0.64 $0.62 Net Realized and Unrealized Gains Per Share – Basic and Diluted $0.30 $0.44 ** $0.36 $0.29 $0.30 Gain on the Allied Acquisition $- $1.03 $- $- $- Dividend Declared Per Share $0.35 $0.35 $0.35 $0.35 $0.35 Stockholders' Equity $2,778,476 $2,711,273 $1,568,982 $1,257,888 $1,222,591 Net Asset Value Per Share $14.43 $14.11 $11.78 $11.44 $11.16 Book Debt/Book Equity Ratio .55x .46x .49x .77x .63x Book Debt/Book Equity Ratio, Net of Available Cash(11) .51x .41x .44x .69x .58x Unsecured Principal Debt to Total Principal Debt 43.7% 56.0% — — — Ratio of Earnings to Fixed Charges(8) 4.1 3.2 4.7 7.8 6.8 Market Capitalization Principal Debt $1,583,331 $1,307,797 $771,358 $969,465 $767,871 Equity 3,013,711 2,407,857 1,973,957 1,368,811 1,207,712 Total Market Capitalization $4,597,042 $3,715,654 $2,745,315 $2,338,276 $1,975,583 Common Stock Data: High Price $15.89 $16.40 $14.82 $12.71 $11.02 Low Price $12.44 $12.53 $11.75 $10.21 $7.04 Closing Price $15.65 $12.53 $14.82 $12.45 $11.02 *Excludes $0.01, $0.06, $0.03, $0.02 and $0.02 per share of professional fees and other costs related to the Allied Acquisition for Q3-10, Q2-10, Q1-10, Q4-09 and Q3-09, respectively. **Excludes $1.03 per share gain on the Allied Acquisition. |
|
|
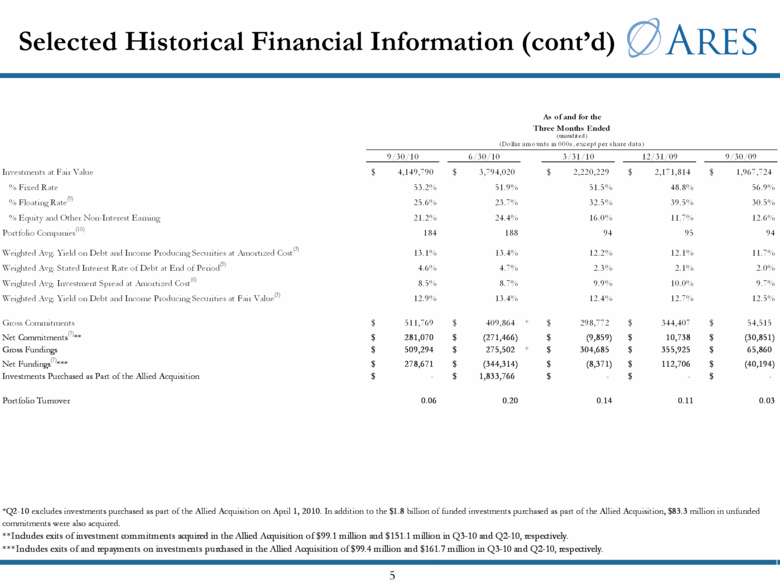
Selected Historical Financial Information (cont’d) *Q2-10 excludes investments purchased as part of the Allied Acquisition on April 1, 2010. In addition to the $1.8 billion of funded investments purchased as part of the Allied Acquisition, $83.3 million in unfunded commitments were also acquired. As of and for the Three Months Ended (unaudited) (Dollar amounts in 000s, except per share data) 9/30/10 6/30/10 3/31/10 12/31/09 9/30/09 Investments at Fair Value $ 4,149,790 $ 3,794,020 $ 2,220,229 $ 2,171,814 $ 1,967,724 % Fixed Rate 53.2% 51.9% 51.5% 48.8% 56.9% % Floating Rate(9) 25.6% 23.7% 32.5% 39.5% 30.5% % Equity and Other Non-Interest Earning 21.2% 24.4% 16.0% 11.7% 12.6% Portfolio Companies(10) 184 188 94 95 94 Weighted Avg. Yield on Debt and Income Producing Securities at Amortized Cost(3) 13.1% 13.4% 12.2% 12.1% 11.7% Weighted Avg. Stated Interest Rate of Debt at End of Period(5) 4.6% 4.7% 2.3% 2.1% 2.0% Weighted Avg. Investment Spread at Amortized Cost(6) 8.5% 8.7% 9.9% 10.0% 9.7% Weighted Avg. Yield on Debt and Income Producing Securities at Fair Value(3) 12.9% 13.4% 12.4% 12.7% 12.5% Gross Commitments $ 511,769 $ 409,864 * $ 298,772 $ 344,407 $ 54,515 Net Commitments(7)** $ 281,070 $ (271,466) $ (9,859) $ 10,738 $ (30,851) Gross Fundings $ 509,294 $ 275,502 * $ 304,685 $ 355,925 $ 65,860 Net Fundings(7)*** $ 278,671 $ (344,314) $ (8,371) $ 112,706 $ (40,194) Investments Purchased as Part of the Allied Acquisition $ - $ 1,833,766 $ - $ - $ - Portfolio Turnover 0.06 0.20 0.14 0.11 0.03 **Includes exits of investment commitments acquired in the Allied Acquisition of $99.1 million and $151.1 million in Q3-10 and Q2-10, respectively. ***Includes exits of and repayments on investments purchased in the Allied Acquisition of $99.4 million and $161.7 million in Q3-10 and Q2-10, respectively. |
|
|
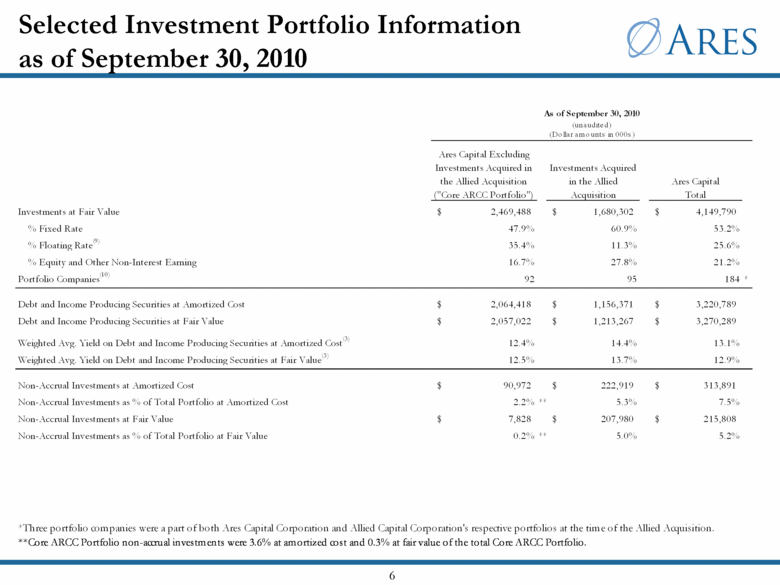
Selected Investment Portfolio Information as of September 30, 2010 As of September 30, 2010 (unaudited) (Dollar amounts in 000s) Ares Capital Excluding Investments Acquired in the Allied Acquisition ("Core ARCC Portfolio") Investments Acquired in the Allied Acquisition Ares Capital Total Investments at Fair Value $ 2,469,488 $ 1,680,302 $ 4,149,790 % Fixed Rate 47.9% 60.9% 53.2% % Floating Rate(9) 35.4% 11.3% 25.6% % Equity and Other Non-Interest Earning 16.7% 27.8% 21.2% Portfolio Companies(10) 92 95 184 * Debt and Income Producing Securities at Amortized Cost $ 2,064,418 $ 1,156,371 $ 3,220,789 Debt and Income Producing Securities at Fair Value $ 2,057,022 $ 1,213,267 $ 3,270,289 Weighted Avg. Yield on Debt and Income Producing Securities at Amortized Cost(3) 12.4% 14.4% 13.1% Weighted Avg. Yield on Debt and Income Producing Securities at Fair Value(3) 12.5% 13.7% 12.9% Non-Accrual Investments at Amortized Cost $ 90,972 $ 222,919 $ 313,891 Non-Accrual Investments as % of Total Portfolio at Amortized Cost 2.2% ** 5.3% 7.5% Non-Accrual Investments at Fair Value $ 7,828 $ 207,980 $ 215,808 Non-Accrual Investments as % of Total Portfolio at Fair Value 0.2% ** 5.0% 5.2% *Three portfolio companies were a part of both Ares Capital Corporation and Allied Capital Corporation's respective portfolios at the time of the Allied Acquisition. **Core ARCC Portfolio non-accrual investments were 3.6% at amortized cost and 0.3% at fair value of the total Core ARCC Portfolio. |
|
|
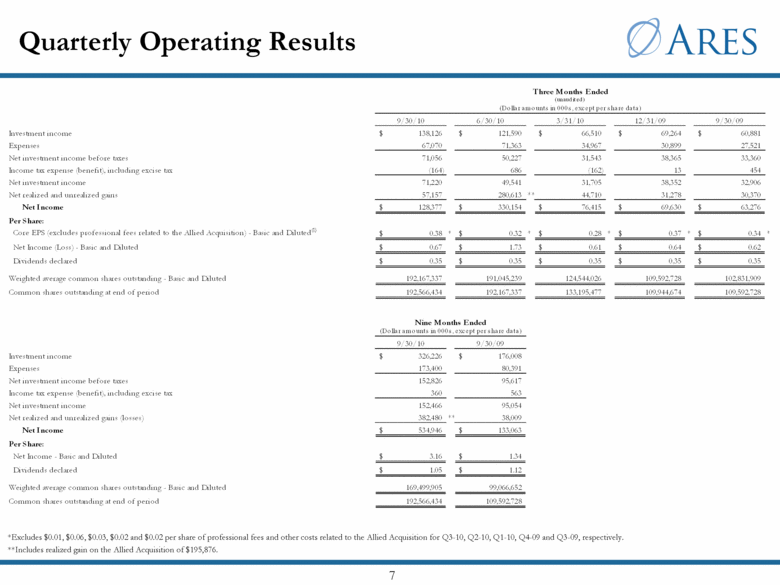
Quarterly Operating Results *Excludes $0.01, $0.06, $0.03, $0.02 and $0.02 per share of professional fees and other costs related to the Allied Acquisition for Q3-10, Q2-10, Q1-10, Q4-09 and Q3-09, respectively. **Includes realized gain on the Allied Acquisition of $195,876. Three Months Ended (unaud ited ) (Dollar amounts in 000s, except per share data) 9/30/10 6/30/10 3/31/10 12/31/09 9/30/09 Investment income $ 138,126 $ 121,590 $ 66,510 $ 69,264 $ 60,881 Expenses 67,070 71,363 34,967 30,899 27,521 Net investment income before taxes 71,056 50,227 31,543 38,365 33,360 Income tax expense (benefit), including excise tax (164) 686 (162) 13 454 Net investment income 71,220 49,541 31,705 38,352 32,906 Net realized and unrealized gains 57,157 280,613 ** 44,710 31,278 30,370 Net Income $ 128,377 $ 330,154 $ 76,415 $ 69,630 $ 63,276 Per Share: Core EPS (excludes professional fees related to the Allied Acquisition) - Basic and Diluted(1) $ 0.38 * $ 0.32 * $ 0.28 * $ 0.37 * $ 0.34 * Net Income (Loss) - Basic and Diluted $ 0.67 $ 1.73 $ 0.61 $ 0.64 $ 0.62 Dividends declared $ 0.35 $ 0.35 $ 0.35 $ 0.35 $ 0.35 Weighted average common shares outstanding - Basic and Diluted 192,167,337 191,045,239 124,544,026 109,592,728 102,831,909 Common shares outstanding at end of period 192,566,434 192,167,337 133,195,477 109,944,674 109,592,728 Nine Months Ended (Dollar amounts in 000s, except per share data) 9/30/10 9/30/09 Investment income $ 326,226 $ 176,008 Expenses 173,400 80,391 Net investment income before taxes 152,826 95,617 Income tax expense (benefit), including excise tax 360 563 Net investment income 152,466 95,054 Net realized and unrealized gains (losses) 382,480 ** 38,009 Net Income $ 534,946 $ 133,063 Per Share: Net Income - Basic and Diluted $ 3.16 $ 1.34 Dividends declared $ 1.05 $ 1.12 Weighted average common shares outstanding - Basic and Diluted 169,499,905 99,066,652 Common shares outstanding at end of period 192,566,434 109,592,728 |
|
|
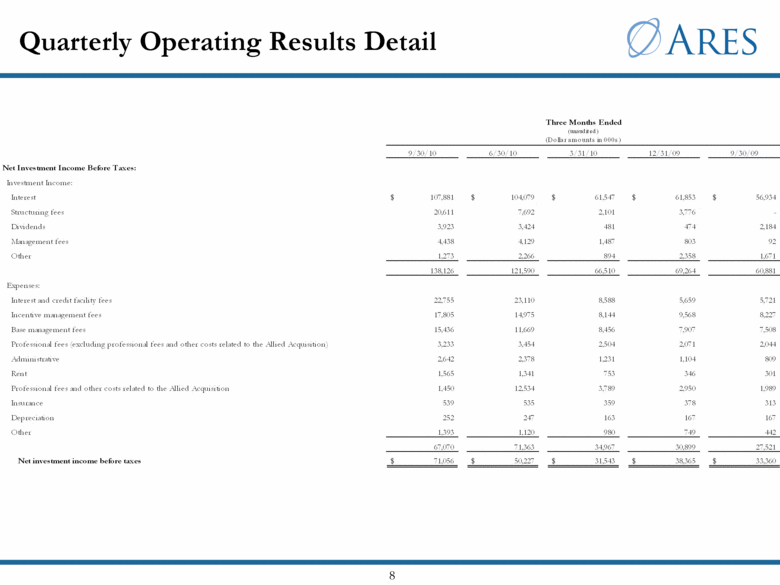
Quarterly Operating Results Detail 67,070 Three Months Ended (unaud ited ) (Dollar amounts in 000s) 9/30/10 6/30/10 3/31/10 12/31/09 9/30/09 Net Investment Income Before Taxes: Investment Income: Interest $ 107,881 $ 104,079 $ 61,547 $ 61,853 $ 56,934 Structuring fees 20,611 7,692 2,101 3,776 - Dividends 3,923 3,424 481 474 2,184 Management fees 4,438 4,129 1,487 803 92 Other 1,273 2,266 894 2,358 1,671 138,126 121,590 66,510 69,264 60,881 Expenses: Interest and credit facility fees 22,755 23,110 8,588 5,659 5,721 Incentive management fees 17,805 14,975 8,144 9,568 8,227 Base management fees 15,436 11,669 8,456 7,907 7,508 Professional fees (excluding professional fees and other costs related to the Allied Acquisition) 3,233 3,454 2,504 2,071 2,044 Administrative 2,642 2,378 1,231 1,104 809 Rent 1,565 1,341 753 346 301 Professional fees and other costs related to the Allied Acquisition 1,450 12,534 3,789 2,950 1,989 Insurance 539 535 359 378 313 Depreciation 252 247 163 167 167 Other 1,393 1,120 980 749 442 67,070 71,363 34,967 30,899 27,521 Net investment income before taxes $ 71,056 $ 50,227 $ 31,543 $ 38,365 $ 33,360 |
|
|
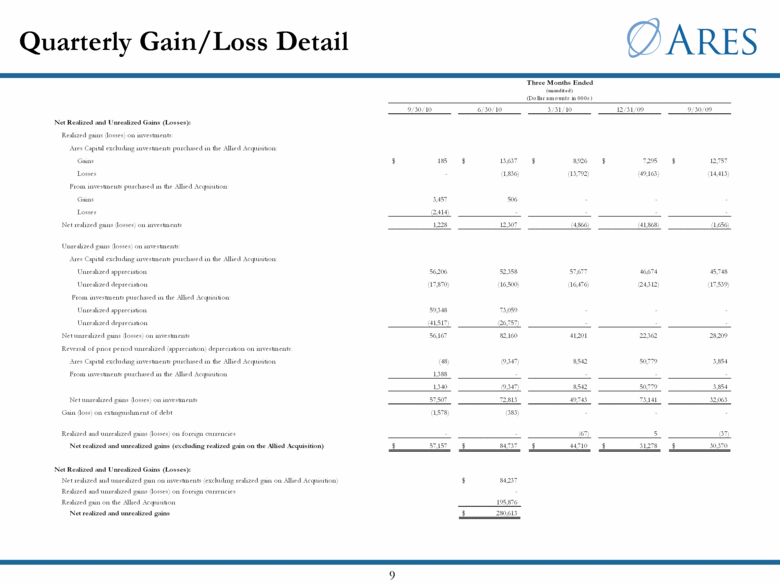
Quarterly Gain/Loss Detail Realized gain on the Allied Acquisition Three Months Ended (unaud ited ) (Dollar amounts in 000s) 9/30/10 6/30/10 3/31/10 12/31/09 9/30/09 Net Realized and Unrealized Gains (Losses): Realized gains (losses) on investments: Ares Capital excluding investments purchased in the Allied Acquisition: Gains $ 185 $ 13,637 $ 8,926 $ 7,295 $ 12,757 Losses - (1,836) (13,792) (49,163) (14,413) From investments purchased in the Allied Acquisition: Gains 3,457 506 - - -Losses (2,414) - - - -Net realized gains (losses) on investments 1,228 12,307 (4,866) (41,868) (1,656) Unrealized gains (losses) on investments: Ares Capital excluding investments purchased in the Allied Acquisition: Unrealized appreciation 56,206 52,358 57,677 46,674 45,748 Unrealized depreciation (17,870) (16,500) (16,476) (24,312) (17,539) From investments purchased in the Allied Acquisition: Unrealized appreciation 59,348 73,059 - - -Unrealized depreciation (41,517) (26,757) - - -Net unrealized gains (losses) on investments 56,167 82,160 41,201 22,362 28,209 Reversal of prior period unrealized (appreciation) depreciation on investments: Ares Capital excluding investments purchased in the Allied Acquisition (48) (9,347) 8,542 50,779 3,854 From investments purchased in the Allied Acquisition 1,388 - - - - 1,340 (9,347) 8,542 50,779 3,854 Net unrealized gains (losses) on investments 57,507 72,813 49,743 73,141 32,063 Gain (loss) on extinguishment of debt (1,578) (383) - - - Realized and unrealized gains (losses) on foreign currencies - - (67) 5 (37) Net realized and unrealized gains (excluding realized gain on the Allied Acquisition) $ 57,157 $ 84,737 $ 44,710 $ 31,278 $ 30,370 Net Realized and Unrealized Gains (Losses): Net realized and unrealized gain on investments (excluding realized gain on Allied Acquisition) $ 84,237 Realized and unrealized gains (losses) on foreign currencies -Realized gain on the Allied Acquisition 195,876 Net realized and unrealized gains $ 280,613 |
|
|
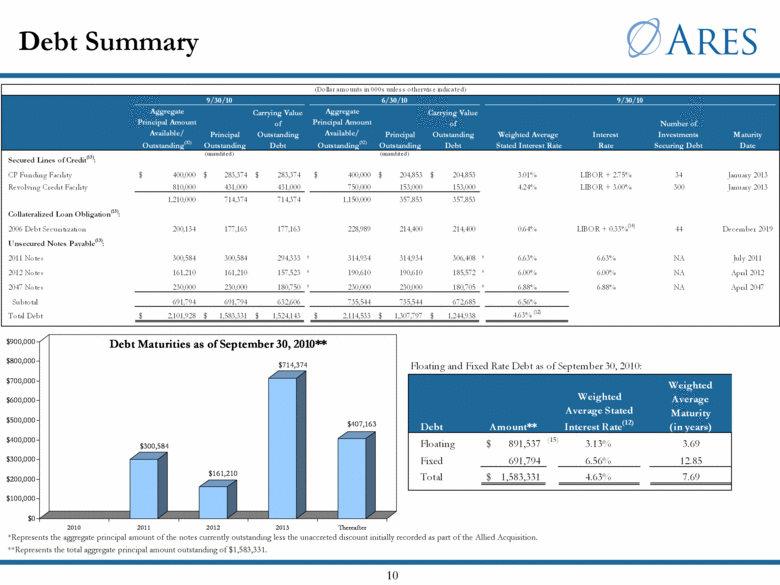
Debt Summary *Represents the aggregate principal amount of the notes currently outstanding less the unaccreted discount initially recorded as part of the Allied Acquisition. **Represents the total aggregate principal amount outstanding of $1,583,331. (15) Aggregate Principal Amount Available/ Outstanding(32) $300,584 $161,210 $714,374 $407,163 $0 $100,000 $200,000 $300,000 $400,000 $500,000 $600,000 $700,000 $800,000 $900,000 2010 2011 2012 2013 Thereafter Debt Maturities as of September 30, 2010** |
|
|
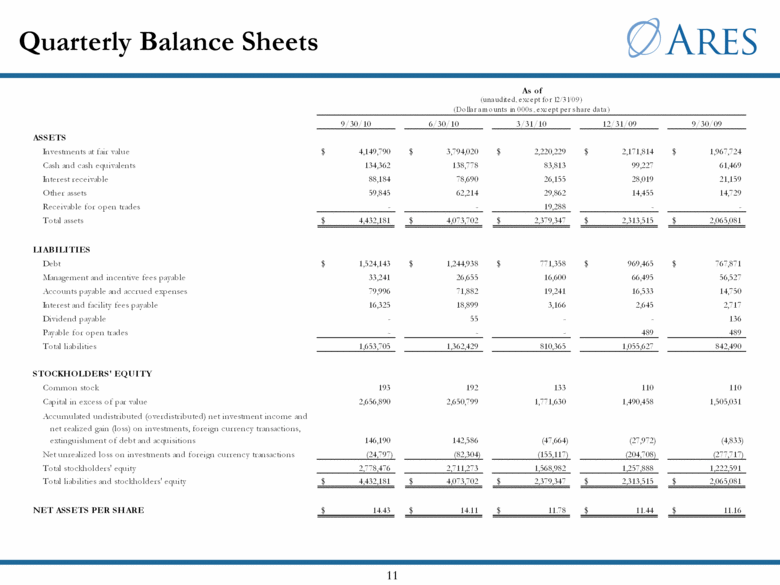
Quarterly Balance Sheets As of (unaudited, except for 12/31/09) (Dollar amounts in 000s, except per share data) 9/30/10 6/30/10 3/31/10 12/31/09 9/30/09 ASSETS Investments at fair value $ 4,149,790 $ 3,794,020 $ 2,220,229 $ 2,171,814 $ 1,967,724 Cash and cash equivalents 134,362 138,778 83,813 99,227 61,469 Interest receivable 88,184 78,690 26,155 28,019 21,159 Other assets 59,845 62,214 29,862 14,455 14,729 Receivable for open trades - - 19,288 - -Total assets $ 4,432,181 $ 4,073,702 $ 2,379,347 $ 2,313,515 $ 2,065,081 LIABILITIES Debt $ 1,524,143 $ 1,244,938 $ 771,358 $ 969,465 $ 767,871 Management and incentive fees payable 33,241 26,655 16,600 66,495 56,527 Accounts payable and accrued expenses 79,996 71,882 19,241 16,533 14,750 Interest and facility fees payable 16,325 18,899 3,166 2,645 2,717 Dividend payable - 55 - - 136 Payable for open trades - - - 489 489 Total liabilities 1,653,705 1,362,429 810,365 1,055,627 842,490 STOCKHOLDERS' EQUITY Common stock 193 192 133 110 110 Capital in excess of par value 2,656,890 2,650,799 1,771,630 1,490,458 1,505,031 Accumulated undistributed (overdistributed) net investment income and net realized gain (loss) on investments, foreign currency transactions, extinguishment of debt and acquisitions 146,190 142,586 (47,664) (27,972) (4,833) Net unrealized loss on investments and foreign currency transactions (24,797) (82,304) (155,117) (204,708) (277,717) Total stockholders' equity 2,778,476 2,711,273 1,568,982 1,257,888 1,222,591 Total liabilities and stockholders' equity $ 4,432,181 $ 4,073,702 $ 2,379,347 $ 2,313,515 $ 2,065,081 NET ASSETS PER SHARE $ 14.43 $ 14.11 $ 11.78 $ 11.44 $ 11.16 |
|
|
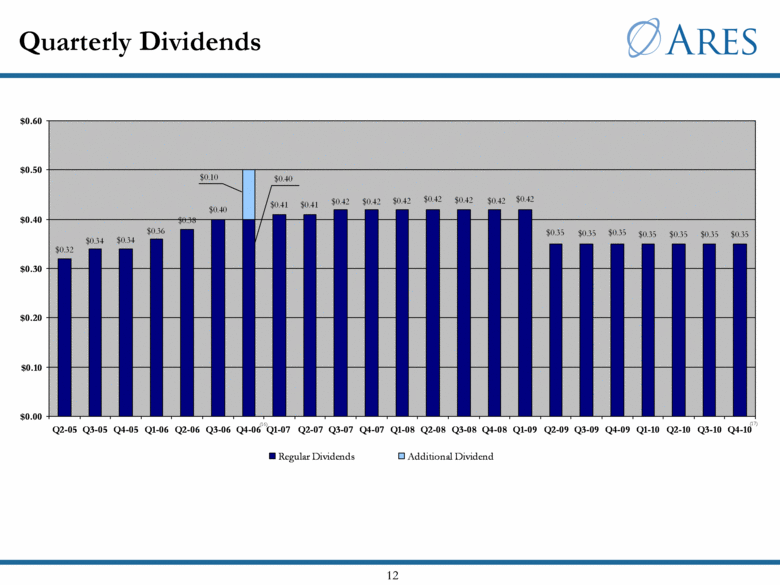
Quarterly Dividends (17) (16) $0.35 $0.35 $0.35 $0.35 $0.35 $0.35 $0.35 $0.32 $0.34 $0.34 $0.36 $0.38 $0.40 $0.40 $0.41 $0.41 $0.42 $0.42 $0.42 $0.42 $0.42 $0.42 $0.42 $0.10 $0.00 $0.10 $0.20 $0.30 $0.40 $0.50 $0.60 Q2-05 Q3-05 Q4-05 Q1-06 Q2-06 Q3-06 Q4-06 Q1-07 Q2-07 Q3-07 Q4-07 Q1-08 Q2-08 Q3-08 Q4-08 Q1-09 Q2-09 Q3-09 Q4-09 Q1-10 Q2-10 Q3-10 Q4-10 Regular Dividends Additional Dividend |
|
|
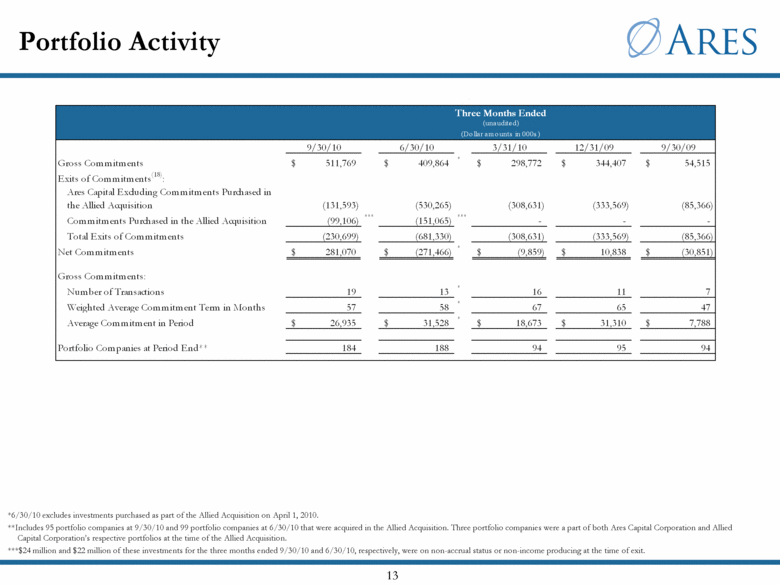
Portfolio Activity *6/30/10 excludes investments purchased as part of the Allied Acquisition on April 1, 2010. **Includes 95 portfolio companies at 9/30/10 and 99 portfolio companies at 6/30/10 that were acquired in the Allied Acquisition. Three portfolio companies were a part of both Ares Capital Corporation and Allied Capital Corporation’s respective portfolios at the time of the Allied Acquisition. ***$24 million and $22 million of these investments for the three months ended 9/30/10 and 6/30/10, respectively, were on non-accrual status or non-income producing at the time of exit. Three Months Ended (una udite d) (Dollar amounts in 000s) 9/30/10 6/30/10 3/31/10 12/31/09 9/30/09 Gross Commitments $ 511,769 $ 409,864 * $ 298,772 $ 344,407 $ 54,515 Exits of Commitments(18): Ares Capital Excluding Commitments Purchased in the Allied Acquisition (131,593) (530,265) (308,631) (333,569) (85,366) Commitments Purchased in the Allied Acquisition (99,106) *** (151,065) *** - - -Total Exits of Commitments (230,699) (681,330) (308,631) (333,569) (85,366) Net Commitments $ 281,070 $ (271,466) * $ (9,859) $ 10,838 $ (30,851) Gross Commitments: Number of Transactions 19 13 * 16 11 7 Weighted Average Commitment Term in Months 57 58 * 67 65 47 Average Commitment in Period $ 26,935 $ 31,528 * $ 18,673 $ 31,310 $ 7,788 Portfolio Companies at Period End** 184 188 94 95 94 |
|
|
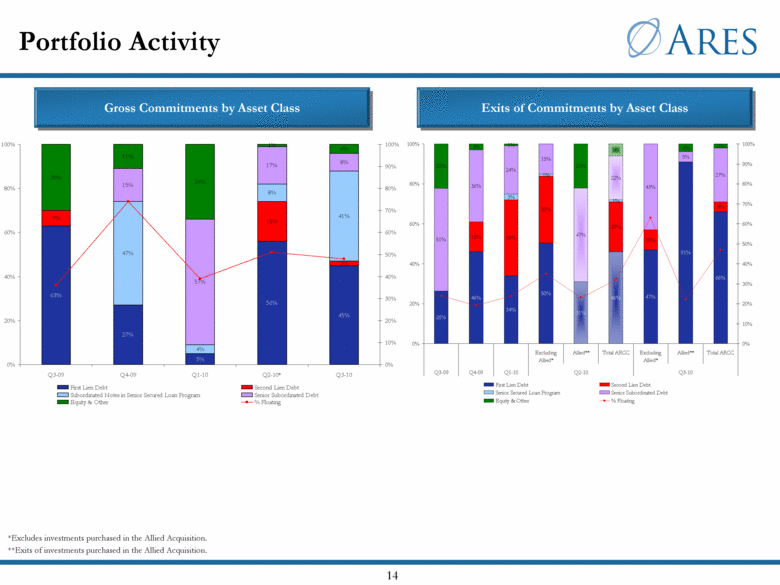
Portfolio Activity *Excludes investments purchased in the Allied Acquisition. **Exits of investments purchased in the Allied Acquisition. Gross Commitments by Asset Class Exits of Commitments by Asset Class 26% 46% 34% 50% 31% 46% 47% 91% 66% 15% 38% 33% 25% 10% 5% 3% 1% 1% 51% 36% 24% 15% 47% 22% 43% 5% 27% 22% 3% 1% 22% 6% 4% 2% 0% 20% 40% 60% 80% 100% Excluding Allied* Allied** Total ARCC Excluding Allied* Allied** Total ARCC Q3-09 Q4-09 Q1-10 Q2-10 Q3-10 0% 10% 20% 30% 40% 50% 60% 70% 80% 90% 100% First Lien Debt Second Lien Debt Senior Secured Loan Program Senior Subordinated Debt Equity & Other % Floating 63% 27% 5% 56% 45% 7% 18% 2% 47% 4% 8% 41% 15% 57% 17% 8% 30% 11% 34% 1% 4% 0% 20% 40% 60% 80% 100% Q3-09 Q4-09 Q1-10 Q2-10* Q3-10 0% 10% 20% 30% 40% 50% 60% 70% 80% 90% 100% First Lien Debt Second Lien Debt Subordinated Notes in Senior Secured Loan Program Senior Subordinated Debt Equity & Other % Floating |
|
|
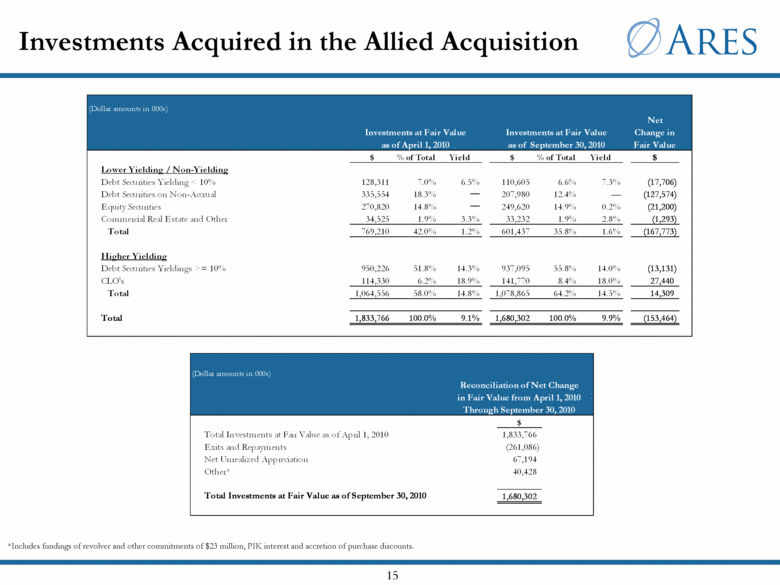
Investments Acquired in the Allied Acquisition *Includes fundings of revolver and other commitments of $23 million, PIK interest and accretion of purchase discounts. $ % of Total Yield $ % of Total Yield $ Lower Yielding / Non-Yielding Debt Securities Yielding < 10% 128,311 7.0% 6.5% 110,605 6.6% 7.3% (17,706) Debt Securities on Non-Accrual 335,554 18.3% — 207,980 12.4% — (127,574) Equity Securities 270,820 14.8% — 249,620 14.9% 0.2% (21,200) Commercial Real Estate and Other 34,525 1.9% 3.3% 33,232 1.9% 2.8% (1,293) Total 769,210 42.0% 1.2% 601,437 35.8% 1.6% (167,773) Higher Yielding Debt Securities Yieldings >= 10% 950,226 51.8% 14.3% 937,095 55.8% 14.0% (13,131) CLO's 114,330 6.2% 18.9% 141,770 8.4% 18.0% 27,440 Total 1,064,556 58.0% 14.8% 1,078,865 64.2% 14.5% 14,309 Total 1,833,766 100.0% 9.1% 1,680,302 100.0% 9.9% (153,464)$ Total Investments at Fair Value as of April 1, 2010 1,833,766 Exits and Repayments (261,086) Net Unrealized Appreciation 67,194 Other* 40,428 Total Investments at Fair Value as of September 30, 2010 1,680,302 (Dollar amounts in 000s) "Investments at Fair Value as of April 1, 2010" "Investments at Fair Value as of September 30, 2010" "As of 9/30/2010" Net Change in Fair Value (Dollar amounts in 000s) Reconciliation of Net Change in Fair Value from April 1, 2010 Through September 30, 2010 |
|
|
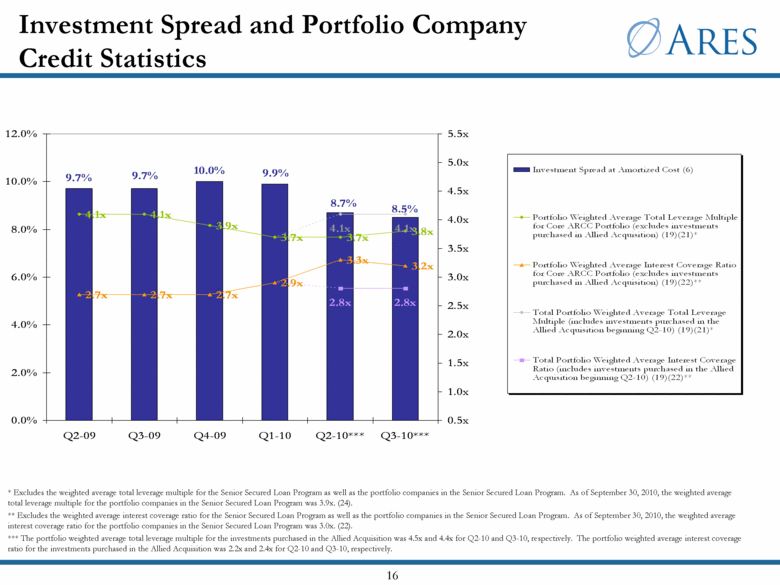
Investment Spread and Portfolio Company Credit Statistics * Excludes the weighted average total leverage multiple for the Senior Secured Loan Program as well as the portfolio companies in the Senior Secured Loan Program. As of September 30, 2010, the weighted average total leverage multiple for the portfolio companies in the Senior Secured Loan Program was 3.9x. (24). ** Excludes the weighted average interest coverage ratio for the Senior Secured Loan Program as well as the portfolio companies in the Senior Secured Loan Program. As of September 30, 2010, the weighted average interest coverage ratio for the portfolio companies in the Senior Secured Loan Program was 3.0x. (22). *** The portfolio weighted average total leverage multiple for the investments purchased in the Allied Acquisition was 4.5x and 4.4x for Q2-10 and Q3-10, respectively. The portfolio weighted average interest coverage ratio for the investments purchased in the Allied Acquisition was 2.2x and 2.4x for Q2-10 and Q3-10, respectively. 9.7% 9.9% 10.0% 8.7% 9.7% 8.5% 4.1x 4.1x 3.9x 3.7x 3.7x 3.8x 2.7x 2.7x 2.7x 2.9x 3.3x 3.2x 4.1x 4.1x 2.8x 2.8x 0.0% 2.0% 4.0% 6.0% 8.0% 10.0% 12.0% Q2-09 Q3-09 Q4-09 Q1-10 Q2-10*** Q3-10*** 0.5x 1.0x 1.5x 2.0x 2.5x 3.0x 3.5x 4.0x 4.5x 5.0x 5.5x Investment Spread at Amortized Cost (6) Portfolio Weighted Average Total Leverage Multiple for Core ARCC Portfolio (excludes investments purchased in Allied Acquisition) (19)(21)* Portfolio Weighted Average Interest Coverage Ratio for Core ARCC Portfolio (excludes investments purchased in Allied Acquisition) (19)(22)** Total Portfolio Weighted Average Total Leverage Multiple (includes investments purchased in the Allied Acquisition beginning Q2-10) (19)(21)* Total Portfolio Weighted Average Interest Coverage Ratio (includes investments purchased in the Allied Acquisition beginning Q2-10) (19)(22)** |
|
|
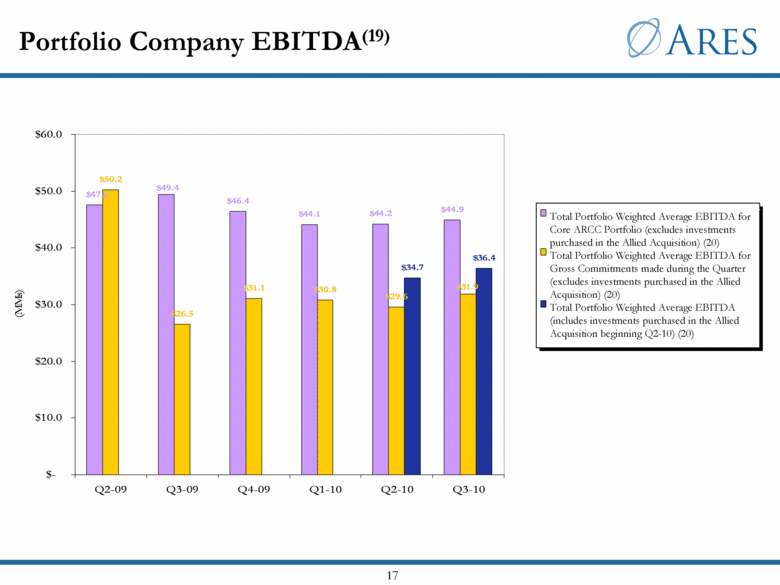
Portfolio Company EBITDA(19) Total Portfolio Weighted Average EBITDA for Core ARCC Portfolio (excludes investments purchased in the Allied Acquisition) (20) Total Portfolio Weighted Average EBITDA (includes investments purchased in the Allied Acquisition beginning Q2-10) (20) Total Portfolio Weighted Average EBITDA for Gross Commitments made during the Quarter (excludes investments purchased in the Allied Acquisition) (20) $46.4 $44.1 $44.2 $44.9 $50.2 $26.5 $31.1 $30.8 $29.6 $34.7 $36.4 $49.4 $47.6 $31.9 $- $10.0 $20.0 $30.0 $40.0 $50.0 $60.0 Q2-09 Q3-09 Q4-09 Q1-10 Q2-10 Q3-10 (MMs) $ |
|
|
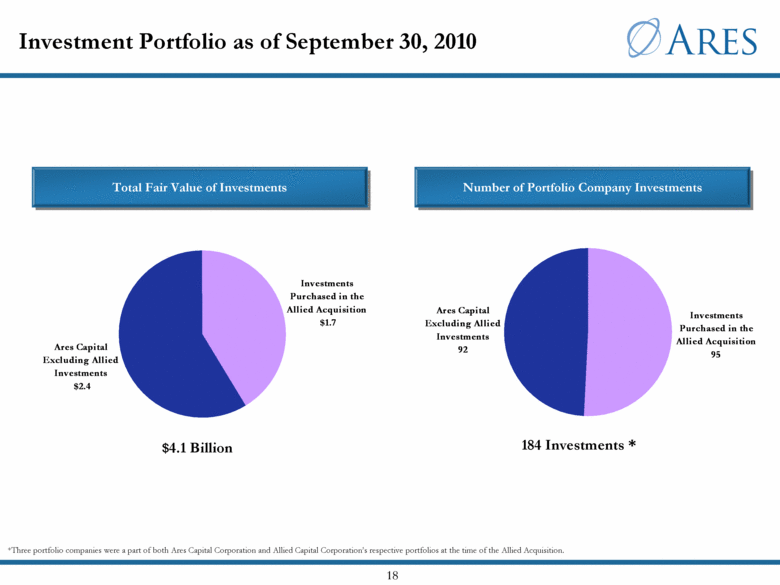
Investment Portfolio as of September 30, 2010 $4.1 Billion Total Fair Value of Investments Number of Portfolio Company Investments 184 Investments * *Three portfolio companies were a part of both Ares Capital Corporation and Allied Capital Corporation’s respective portfolios at the time of the Allied Acquisition. Ares Capital Excluding Allied Investments $2.4 Investments Purchased in the Allied Acquisition $1.7 Investments Purchased in the Allied Acquisition 95 Ares Capital Excluding Allied Investments 92 |
|
|
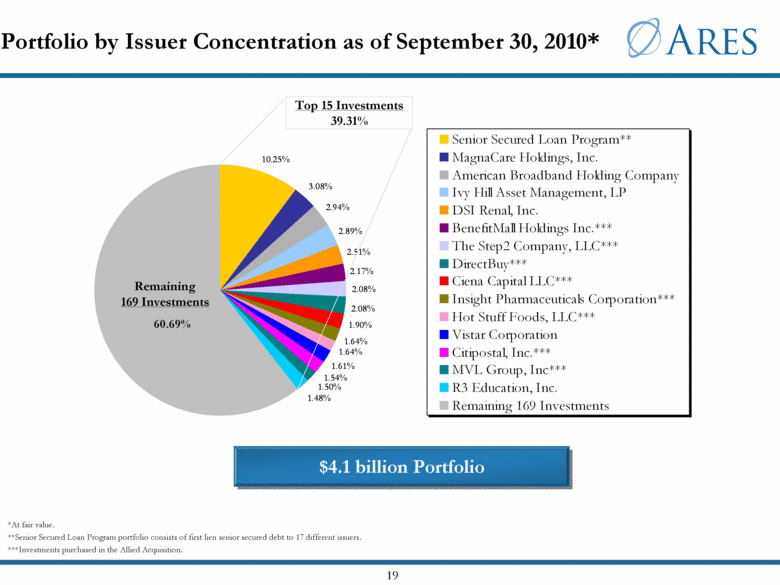
Portfolio by Issuer Concentration as of September 30, 2010* Remaining 169 Investments Top 15 Investments 39.31% $4.1 billion Portfolio *At fair value. **Senior Secured Loan Program portfolio consists of first lien senior secured debt to 17 different issuers. ***Investments purchased in the Allied Acquisition. 10.25% 3.08% 2.94% 2.89% 2.51% 2.17% 2.08% 2.08% 1.90% 1.64% 1.64% 1.61% 1.54% 1.50% 1.48% 60.69% Senior Secured Loan Program** MagnaCare Holdings, Inc. American Broadband Holding Company Ivy Hill Asset Management, LP DSI Renal, Inc. BenefitMall Holdings Inc.*** The Step2 Company, LLC*** DirectBuy*** Ciena Capital LLC*** Insight Pharmaceuticals Corporation*** Hot Stuff Foods, LLC*** Vistar Corporation Citipostal, Inc.*** MVL Group, Inc*** R3 Education, Inc. Remaining 169 Investments |
|
|
Investment Portfolio by Asset Class as of September 30, 2010* Investments Purchased in the Allied Acquisition Ares Capital Ares Capital Excluding Investments Purchased in the Allied Acquisition *At fair value. 31% 6% 10% 6% 1% 29% 17% 1st Lien Senior Debt 2nd Lien Senior Debt Senior Subordinated Debt Senior Secured Loan Program Equity CLO Commercial Real Estate 32% 6% 8% 2% 15% 37% 30% 7% 17% 4% 24% 18% |
|
|
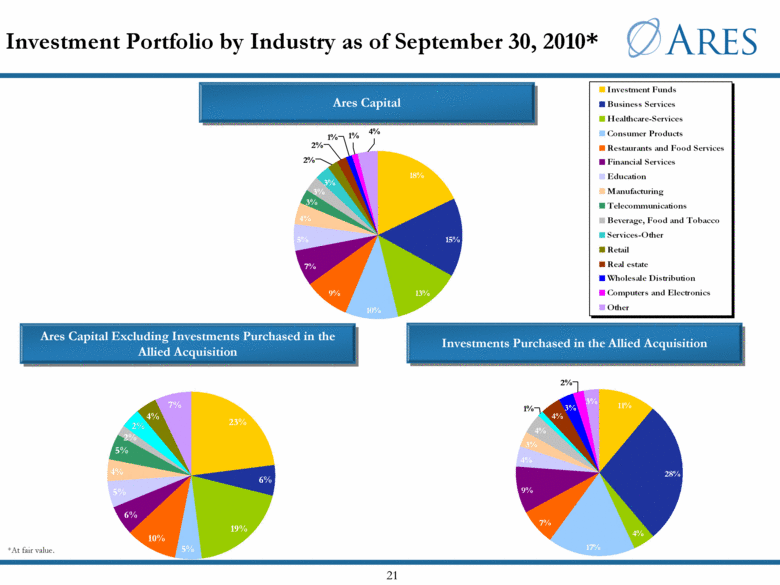
Ares Capital Excluding Investments Purchased in the Allied Acquisition Investment Portfolio by Industry as of September 30, 2010* Investments Purchased in the Allied Acquisition Ares Capital *At fair value. 23% 6% 19% 5% 10% 6% 5% 4% 5% 2% 4% 7% 2% 11% 28% 4% 17% 7% 9% 4% 3% 4% 4% 3% 3% 2% 1% 15% 4% 7% 2% 3% 1% 10% 13% 9% 1% 4% 5% 3% 3% 2% 18% Investment Funds Business Services Healthcare-Services Consumer Products Restaurants and Food Services Financial Services Education Manufacturing Telecommunications Beverage, Food and Tobacco Services-Other Retail Real estate Wholesale Distribution Computers and Electronics Other |
|
|
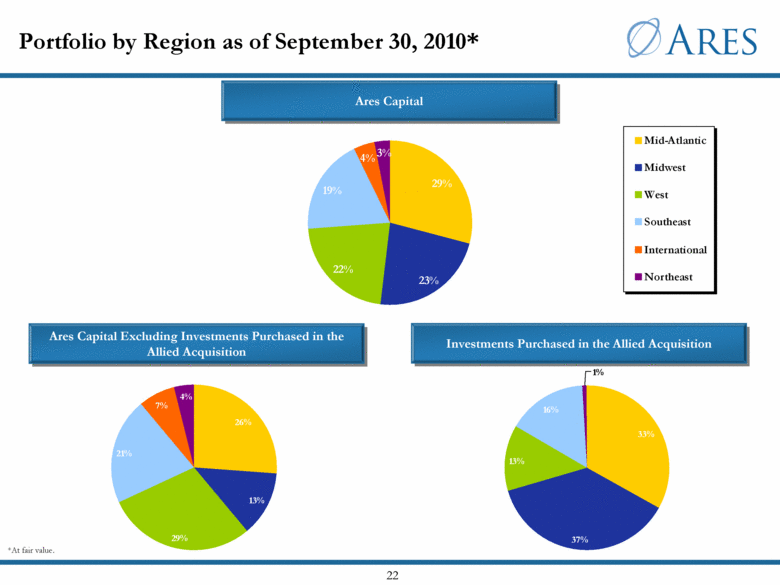
Portfolio by Region as of September 30, 2010* Investments Purchased in the Allied Acquisition Ares Capital Ares Capital Excluding Investments Purchased in the Allied Acquisition *At fair value. 33% 37% 13% 16% 1% 26% 13% 29% 21% 7% 4% 29% 23% 22% 19% 4% 3% Mid-Atlantic Midwest West Southeast International Northeast |
|
|
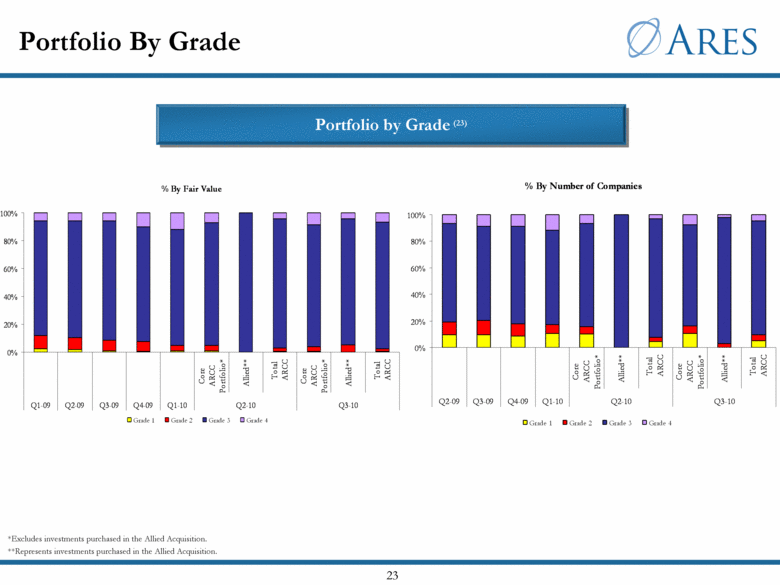
Portfolio By Grade Portfolio by Grade (23) *Excludes investments purchased in the Allied Acquisition. **Represents investments purchased in the Allied Acquisition. % By Fair Value 0% 20% 40% 60% 80% 100% Core ARCC Portfolio* Allied** Total ARCC Core ARCC Portfolio* Allied** Total ARCC Q1-09 Q2-09 Q3-09 Q4-09 Q1-10 Q2-10 Q3-10 Grade 1 Grade 2 Grade 3 Grade 4 % By Number of Companies 0% 20% 40% 60% 80% 100% Core ARCC Portfolio* Allied** Total ARCC Core ARCC Portfolio* Allied** Total ARCC Q2-09 Q3-09 Q4-09 Q1-10 Q2-10 Q3-10 Grade 1 Grade 2 Grade 3 Grade 4 |
|
|
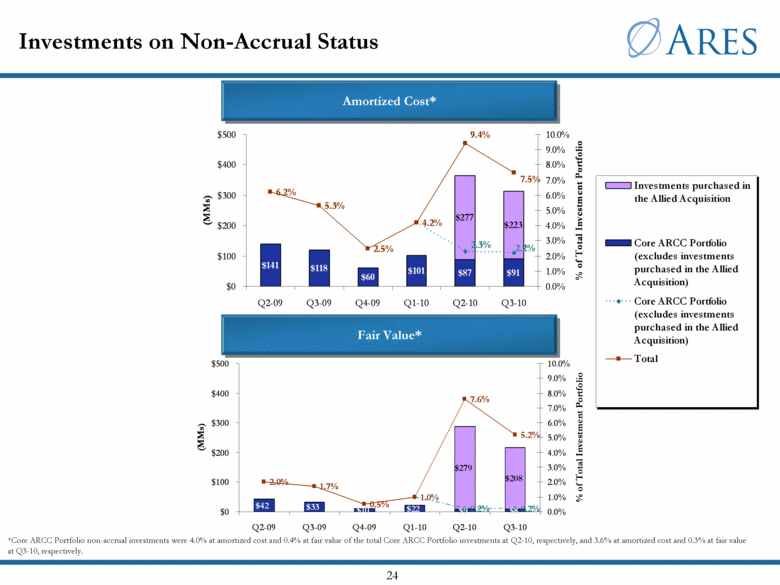
Investments on Non-Accrual Status Amortized Cost* Fair Value* *Core ARCC Portfolio non-accrual investments were 4.0% at amortized cost and 0.4% at fair value of the total Core ARCC Portfolio investments at Q2-10, respectively, and 3.6% at amortized cost and 0.3% at fair value at Q3-10, respectively. $141 $118 $60 $101 $87 $91 $277 $223 6.2% 5.3% 2.5% 4.2% 9.4% 7.5% 2.2% 2.3% $0 $100 $200 $300 $400 $500 Q2-09 Q3-09 Q4-09 Q1-10 Q2-10 Q3-10 (MMs) 0.0% 1.0% 2.0% 3.0% 4.0% 5.0% 6.0% 7.0% 8.0% 9.0% 10.0% % of Total Investment Portfolio Investments purchased in the Allied Acquisition Core ARCC Portfolio (excludes investments purchased in the Allied Acquisition) Core ARCC Portfolio (excludes investments purchased in the Allied Acquisition) Total $42 $33 $10 $22 $9 $8 $279 $208 1.0% 0.2% 0.2% 2.0% 1.7% 0.5% 1.0% 7.6% 5.2% $0 $100 $200 $300 $400 $500 Q2-09 Q3-09 Q4-09 Q1-10 Q2-10 Q3-10 (MMs) 0.0% 1.0% 2.0% 3.0% 4.0% 5.0% 6.0% 7.0% 8.0% 9.0% 10.0% % of Total Investment Portfolio |
|
|
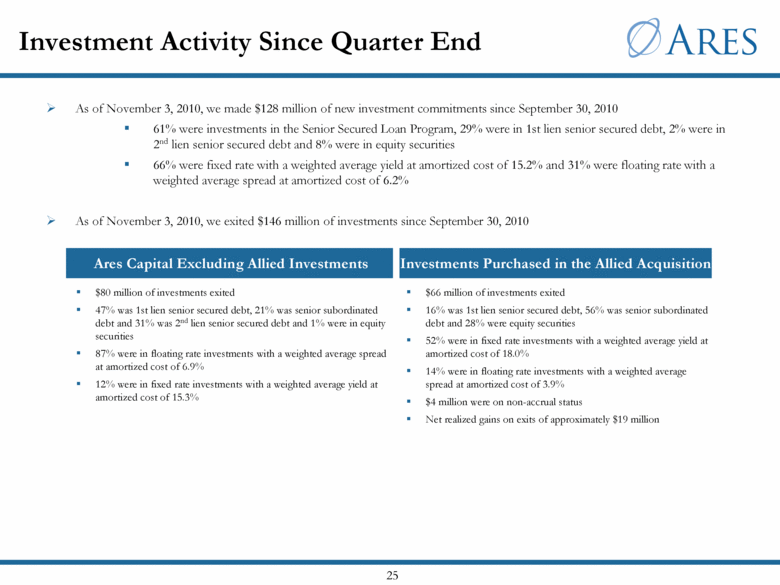
As of November 3, 2010, we made $128 million of new investment commitments since September 30, 2010 61% were investments in the Senior Secured Loan Program, 29% were in 1st lien senior secured debt, 2% were in 2nd lien senior secured debt and 8% were in equity securities 66% were fixed rate with a weighted average yield at amortized cost of 15.2% and 31% were floating rate with a weighted average spread at amortized cost of 6.2% As of November 3, 2010, we exited $146 million of investments since September 30, 2010 Investment Activity Since Quarter End $66 million of investments exited 16% was 1st lien senior secured debt, 56% was senior subordinated debt and 28% were equity securities 52% were in fixed rate investments with a weighted average yield at amortized cost of 18.0% 14% were in floating rate investments with a weighted average spread at amortized cost of 3.9% $4 million were on non-accrual status Net realized gains on exits of approximately $19 million Investments Purchased in the Allied Acquisition $80 million of investments exited 47% was 1st lien senior secured debt, 21% was senior subordinated debt and 31% was 2nd lien senior secured debt and 1% were in equity securities 87% were in floating rate investments with a weighted average spread at amortized cost of 6.9% 12% were in fixed rate investments with a weighted average yield at amortized cost of 15.3% Ares Capital Excluding Allied Investments |
|
|
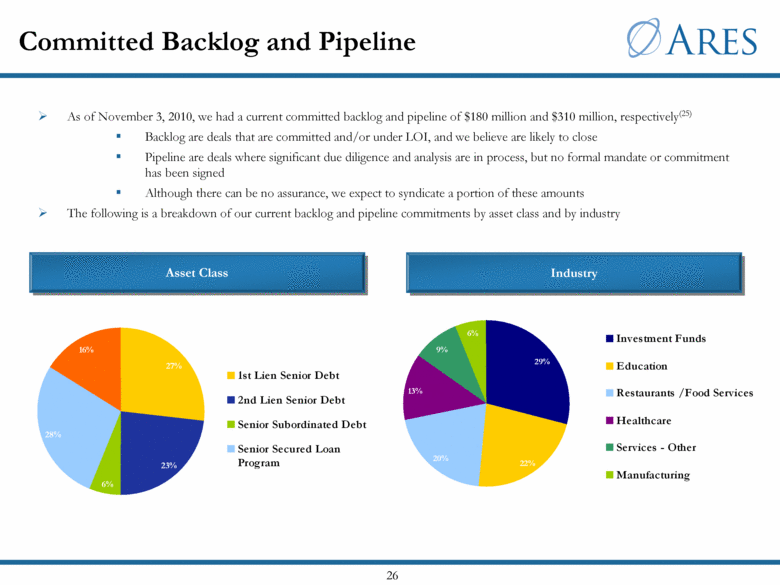
As of November 3, 2010, we had a current committed backlog and pipeline of $180 million and $310 million, respectively(25) Backlog are deals that are committed and/or under LOI, and we believe are likely to close Pipeline are deals where significant due diligence and analysis are in process, but no formal mandate or commitment has been signed Although there can be no assurance, we expect to syndicate a portion of these amounts The following is a breakdown of our current backlog and pipeline commitments by asset class and by industry Committed Backlog and Pipeline Asset Class Industry 29% 9% 20% 13% 6% 22% Investment Funds Education Restaurants /Food Services Healthcare Services - Other Manufacturing |
|
|
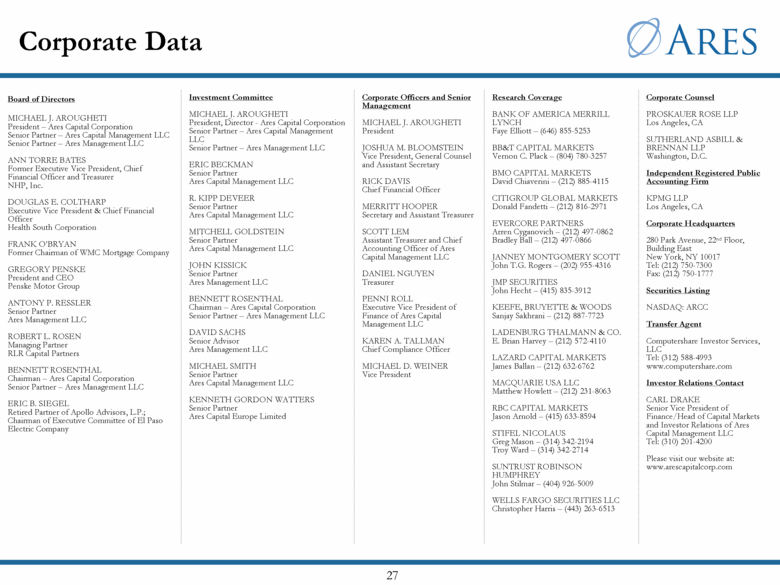
Corporate Data Corporate Counsel PROSKAUER ROSE LLP Los Angeles, CA SUTHERLAND ASBILL & BRENNAN LLP Washington, D.C. Independent Registered Public Accounting Firm KPMG LLP Los Angeles, CA Corporate Headquarters 280 Park Avenue, 22nd Floor, Building East New York, NY 10017 Tel: (212) 750-7300 Fax: (212) 750-1777 Securities Listing NASDAQ: ARCC Transfer Agent Computershare Investor Services, LLC Tel: (312) 588-4993 www.computershare.com Investor Relations Contact CARL DRAKE Senior Vice President of Finance/Head of Capital Markets and Investor Relations of Ares Capital Management LLC Tel: (310) 201-4200 Please visit our website at: www.arescapitalcorp.com Research Coverage BANK OF AMERICA MERRILL LYNCH Faye Elliott – (646) 855-5253 BB&T CAPITAL MARKETS Vernon C. Plack – (804) 780-3257 BMO CAPITAL MARKETS David Chiaverini – (212) 885-4115 CITIGROUP GLOBAL MARKETS Donald Fandetti – (212) 816-2971 EVERCORE PARTNERS Arren Cyganovich – (212) 497-0862 Bradley Ball – (212) 497-0866 JANNEY MONTGOMERY SCOTT John T.G. Rogers – (202) 955-4316 JMP SECURITIES John Hecht – (415) 835-3912 KEEFE, BRUYETTE & WOODS Sanjay Sakhrani – (212) 887-7723 LADENBURG THALMANN & CO. E. Brian Harvey – (212) 572-4110 LAZARD CAPITAL MARKETS James Ballan – (212) 632-6762 MACQUARIE USA LLC Matthew Howlett – (212) 231-8063 RBC CAPITAL MARKETS Jason Arnold – (415) 633-8594 STIFEL NICOLAUS Greg Mason – (314) 342-2194 Troy Ward – (314) 342-2714 SUNTRUST ROBINSON HUMPHREY John Stilmar – (404) 926-5009 WELLS FARGO SECURITIES LLC Christopher Harris – (443) 263-6513 Corporate Officers and Senior Management MICHAEL J. AROUGHETI President JOSHUA M. BLOOMSTEIN Vice President, General Counsel and Assistant Secretary RICK DAVIS Chief Financial Officer MERRITT HOOPER Secretary and Assistant Treasurer SCOTT LEM Assistant Treasurer and Chief Accounting Officer of Ares Capital Management LLC DANIEL NGUYEN Treasurer PENNI ROLL Executive Vice President of Finance of Ares Capital Management LLC KAREN A. TALLMAN Chief Compliance Officer MICHAEL D. WEINER Vice President Investment Committee MICHAEL J. AROUGHETI President, Director - Ares Capital Corporation Senior Partner – Ares Capital Management LLC Senior Partner – Ares Management LLC ERIC BECKMAN Senior Partner Ares Capital Management LLC R. KIPP DEVEER Senior Partner Ares Capital Management LLC MITCHELL GOLDSTEIN Senior Partner Ares Capital Management LLC JOHN KISSICK Senior Partner Ares Management LLC BENNETT ROSENTHAL Chairman – Ares Capital Corporation Senior Partner – Ares Management LLC DAVID SACHS Senior Advisor Ares Management LLC MICHAEL SMITH Senior Partner Ares Capital Management LLC KENNETH GORDON WATTERS Senior Partner Ares Capital Europe Limited Board of Directors MICHAEL J. AROUGHETI President – Ares Capital Corporation Senior Partner – Ares Capital Management LLC Senior Partner – Ares Management LLC ANN TORRE BATES Former Executive Vice President, Chief Financial Officer and Treasurer NHP, Inc. DOUGLAS E. COLTHARP Executive Vice President & Chief Financial Officer Health South Corporation FRANK O’BRYAN Former Chairman of WMC Mortgage Company GREGORY PENSKE President and CEO Penske Motor Group ANTONY P. RESSLER Senior Partner Ares Management LLC ROBERT L. ROSEN Managing Partner RLR Capital Partners BENNETT ROSENTHAL Chairman – Ares Capital Corporation Senior Partner – Ares Management LLC ERIC B. SIEGEL Retired Partner of Apollo Advisors, L.P.; Chairman of Executive Committee of El Paso Electric Company |
|
|
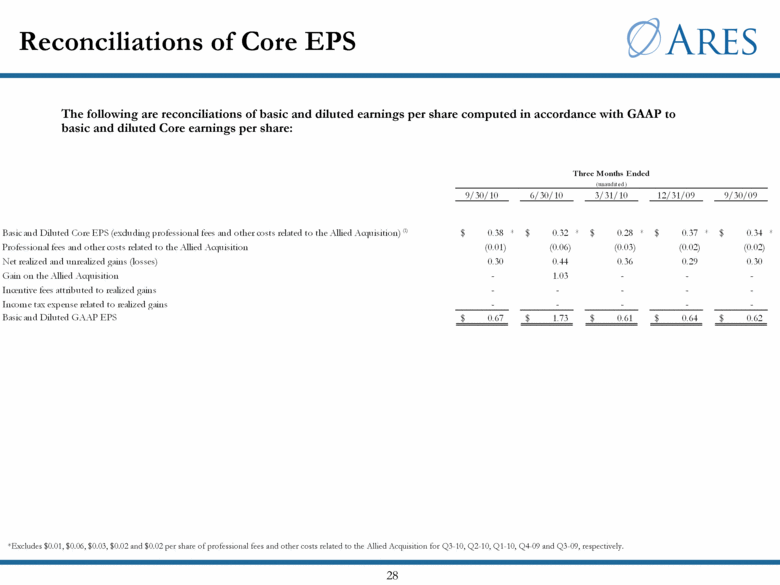
Reconciliations of Core EPS The following are reconciliations of basic and diluted earnings per share computed in accordance with GAAP to basic and diluted Core earnings per share: *Excludes $0.01, $0.06, $0.03, $0.02 and $0.02 per share of professional fees and other costs related to the Allied Acquisition for Q3-10, Q2-10, Q1-10, Q4-09 and Q3-09, respectively. Three Months Ended (unaudited) 9/30/10 6/30/10 3/31/10 12/31/09 9/30/09 Basic and Diluted Core EPS (excluding professional fees and other costs related to the Allied Acquisition) (1) $ 0.38 * $ 0.32 * $ 0.28 * $ 0.37 * $ 0.34 * Professional fees and other costs related to the Allied Acquisition (0.01) (0.06) (0.03) (0.02) (0.02) Net realized and unrealized gains (losses) 0.30 0.44 0.36 0.29 0.30 Gain on the Allied Acquisition - 1.03 - - -Incentive fees attributed to realized gains - - - - -Income tax expense related to realized gains - - - - -Basic and Diluted GAAP EPS $ 0.67 $ 1.73 $ 0.61 $ 0.64 $ 0.62 |
|
|
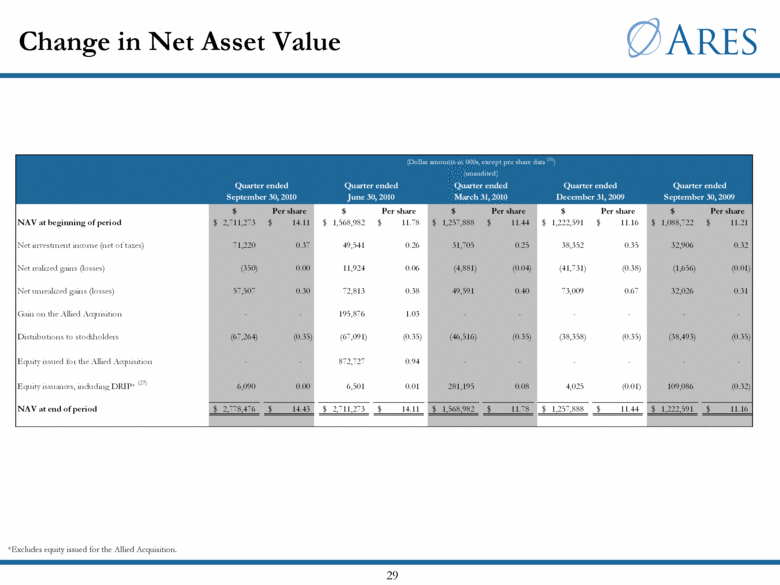
Change in Net Asset Value *Excludes equity issued for the Allied Acquisition. Equity issuances, including DRIP* (27) (Dollar amounts in 000s, except per share data (26)) (unaudited) Quarter ended Quarter ended Quarter ended Quarter ended Quarter ended September 30, 2010 June 30, 2010 March 31, 2010 December 31, 2009 September 30, 2009 $ Per share $ Per share $ Per share $ Per share $ Per share NAV at beginning of period $ 2,711,273 $ 14.11 $ 1,568,982 $ 11.78 $ 1,257,888 $ 11.44 $ 1,222,591 $ 11.16 $ 1,088,722 $ 11.21 Net investment income (net of taxes) 71,220 0.37 49,541 0.26 31,705 0.25 38,352 0.35 32,906 0.32 Net realized gains (losses) (350) 0.00 11,924 0.06 (4,881) (0.04) (41,731) (0.38) (1,656) (0.01) Net unrealized gains (losses) 57,507 0.30 72,813 0.38 49,591 0.40 73,009 0.67 32,026 0.31 Gain on the Allied Acquisition - - 195,876 1.03 - - - - - -Distributions to stockholders (67,264) (0.35) (67,091) (0.35) (46,516) (0.35) (38,358) (0.35) (38,493) (0.35) Equity issued for the Allied Acquisition - - 872,727 0.94 - - - - - -Equity issuances, including DRIP* (27) 6,090 0.00 6,501 0.01 281,195 0.08 4,025 (0.01) 109,086 (0.32) NAV at end of period $ 2,778,476 $ 14.43 $ 2,711,273 $ 14.11 $ 1,568,982 $ 11.78 $ 1,257,888 $ 11.44 $ 1,222,591 $ 11.16 |
|
|
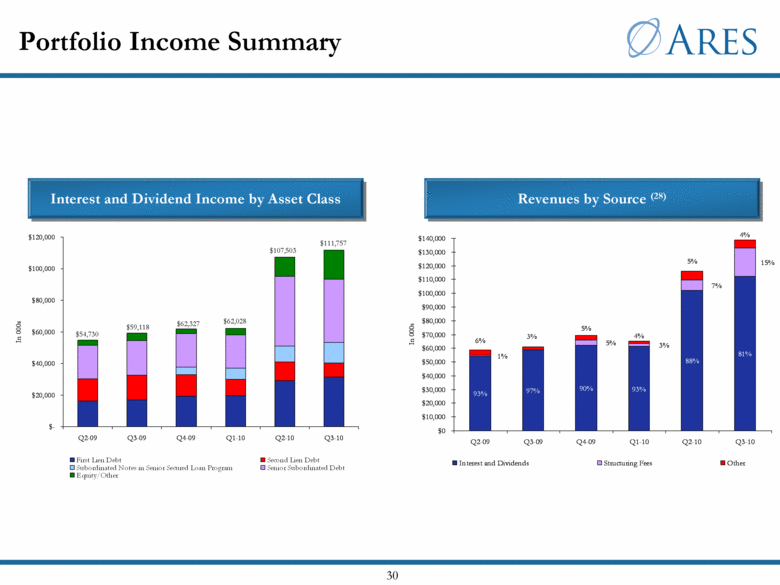
Portfolio Income Summary Revenues by Source (28) Interest and Dividend Income by Asset Class $54,730 $59,118 $62,327 $62,028 $107,503 $111,757 93% 97% 90% 93% 88% 81% 15% 1% 5% 3% 7% 6% 3% 5% 5% 4% 4% $0 $10,000 $20,000 $30,000 $40,000 $50,000 $60,000 $70,000 $80,000 $90,000 $100,000 $110,000 $120,000 $130,000 $140,000 Q2-09 Q3-09 Q4-09 Q1-10 Q2-10 Q3-10 In 000s Interest and Dividends Structuring Fees Other $- $20,000 $40,000 $60,000 $80,000 $100,000 $120,000 Q2-09 Q3-09 Q4-09 Q1-10 Q2-10 Q3-10 In 000s First Lien Debt Second Lien Debt Subordinated Notes in Senior Secured Loan Program Senior Subordinated Debt Equity/Other |
|
|
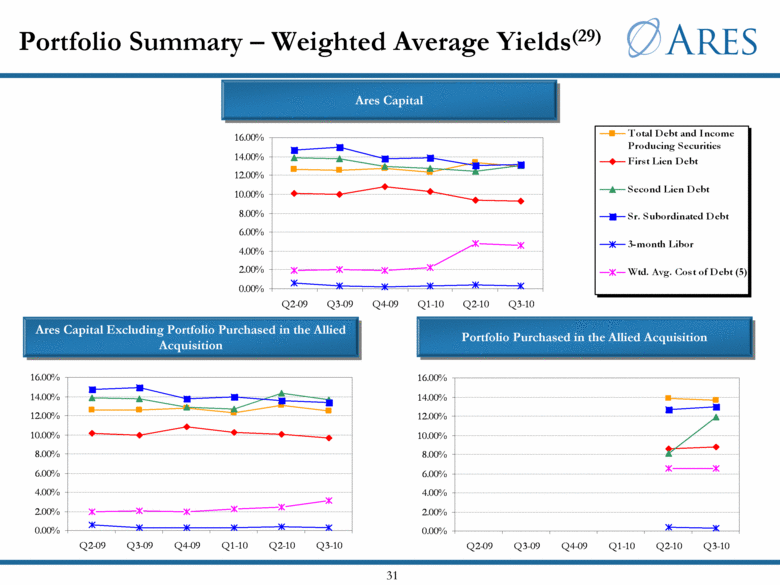
Portfolio Summary – Weighted Average Yields(29)Portfolio Purchased in the Allied Acquisition Ares Capital Ares Capital Excluding Portfolio Purchased in the Allied Acquisition 0.00% 2.00% 4.00% 6.00% 8.00% 10.00% 12.00% 14.00% 16.00% Q2-09 Q3-09 Q4-09 Q1-10 Q2-10 Q3-10 0.00% 2.00% 4.00% 6.00% 8.00% 10.00% 12.00% 14.00% 16.00% Q2-09 Q3-09 Q4-09 Q1-10 Q2-10 Q3-10 16.00% Total Debt and Income Producing Securities 14.00% First Lien Debt 12.00% Second Lien Debt 10.00% 8.00% Sr. Subordinated Debt 6.00% 3-month Libor 4.00% 2.00% Wtd. Avg. Cost of Debt (5) 0.00% Q2-09 Q3-09 Q4-09 Q1-10 Q2-10 Q3-10 |
|
|
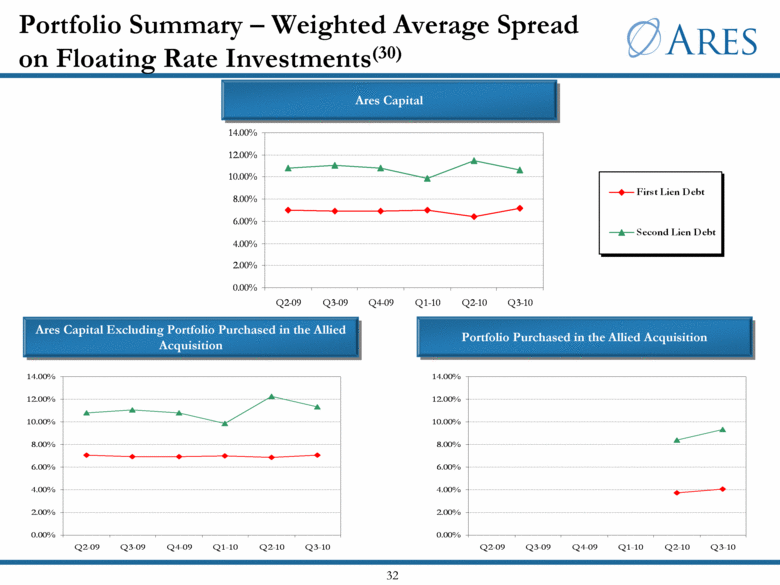
Portfolio Summary – Weighted Average Spread on Floating Rate Investments(30) Portfolio Purchased in the Allied Acquisition Ares Capital Ares Capital Excluding Portfolio Purchased in the Allied Acquisition 0.00% 2.00% 4.00% 6.00% 8.00% 10.00% 12.00% 14.00% Q2-09 Q3-09 Q4-09 Q1-10 Q2-10 Q3-10 0.00% 2.00% 4.00% 6.00% 8.00% 10.00% 12.00% 14.00% Q2-09 Q3-09 Q4-09 Q1-10 Q2-10 Q3-10 14.00% 12.00% 10.00% First Lien Debt 8.00% 6.00% Second Lien Debt 4.00% 2.00% 0.00% Q2-09 Q3-09 Q4-09 Q1-10 Q2-10 Q3-10 |
|
|
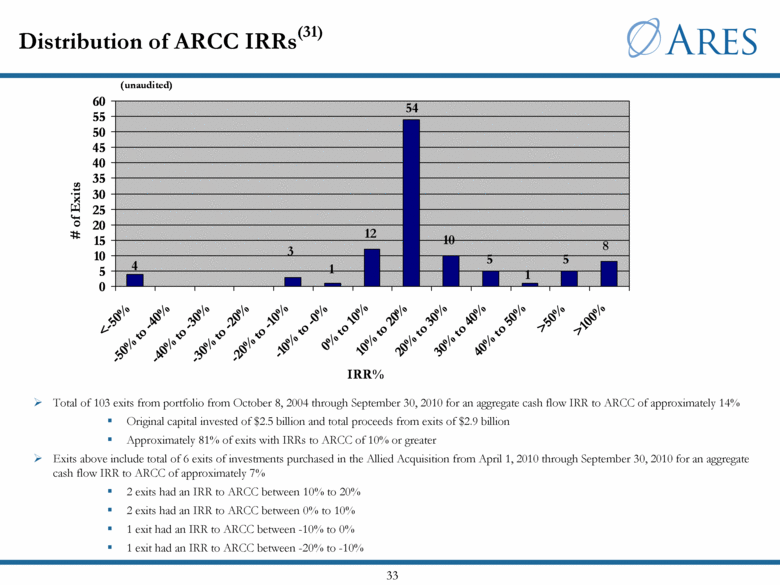
Distribution of ARCC IRRs(31) Total of 103 exits from portfolio from October 8, 2004 through September 30, 2010 for an aggregate cash flow IRR to ARCC of approximately 14% Original capital invested of $2.5 billion and total proceeds from exits of $2.9 billion Approximately 81% of exits with IRRs to ARCC of 10% or greater Exits above include total of 6 exits of investments purchased in the Allied Acquisition from April 1, 2010 through September 30, 2010 for an aggregate cash flow IRR to ARCC of approximately 7% 2 exits had an IRR to ARCC between 10% to 20% 2 exits had an IRR to ARCC between 0% to 10% 1 exit had an IRR to ARCC between -10% to 0% 1 exit had an IRR to ARCC between -20% to -10% (unaudited) 4 3 1 12 54 10 5 1 5 8 0 5 10 15 20 25 30 35 40 45 50 55 60 <-50% -50% to -40% -40% to -30% -30% to -20% -20% to -10% -10% to -0% 0% to 10% 10% to 20% 20% to 30% 30% to 40% 40% to 50% >50% >100% IRR% # of Exits |
|
|
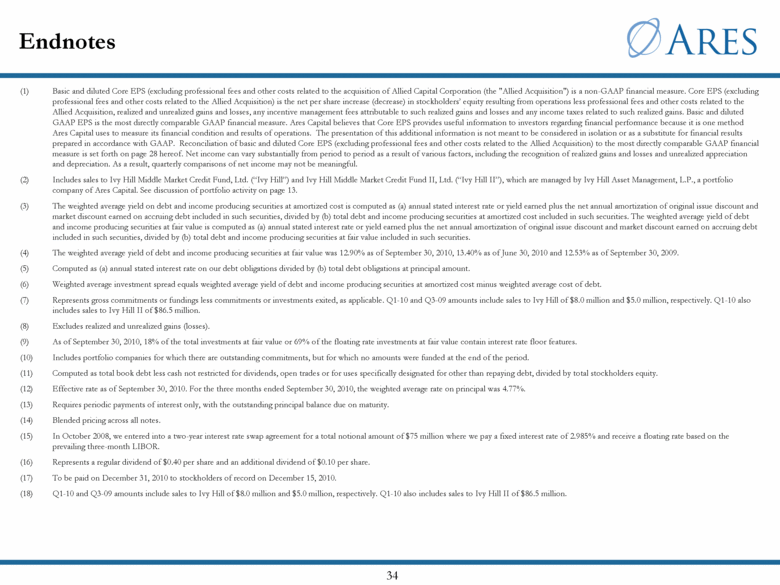
Endnotes Basic and diluted Core EPS (excluding professional fees and other costs related to the acquisition of Allied Capital Corporation (the "Allied Acquisition") is a non-GAAP financial measure. Core EPS (excluding professional fees and other costs related to the Allied Acquisition) is the net per share increase (decrease) in stockholders’ equity resulting from operations less professional fees and other costs related to the Allied Acquisition, realized and unrealized gains and losses, any incentive management fees attributable to such realized gains and losses and any income taxes related to such realized gains. Basic and diluted GAAP EPS is the most directly comparable GAAP financial measure. Ares Capital believes that Core EPS provides useful information to investors regarding financial performance because it is one method Ares Capital uses to measure its financial condition and results of operations. The presentation of this additional information is not meant to be considered in isolation or as a substitute for financial results prepared in accordance with GAAP. Reconciliation of basic and diluted Core EPS (excluding professional fees and other costs related to the Allied Acquisition) to the most directly comparable GAAP financial measure is set forth on page 28 hereof. Net income can vary substantially from period to period as a result of various factors, including the recognition of realized gains and losses and unrealized appreciation and depreciation. As a result, quarterly comparisons of net income may not be meaningful. Includes sales to Ivy Hill Middle Market Credit Fund, Ltd. (“Ivy Hill”) and Ivy Hill Middle Market Credit Fund II, Ltd. (“Ivy Hill II”), which are managed by Ivy Hill Asset Management, L.P., a portfolio company of Ares Capital. See discussion of portfolio activity on page 13. The weighted average yield on debt and income producing securities at amortized cost is computed as (a) annual stated interest rate or yield earned plus the net annual amortization of original issue discount and market discount earned on accruing debt included in such securities, divided by (b) total debt and income producing securities at amortized cost included in such securities. The weighted average yield of debt and income producing securities at fair value is computed as (a) annual stated interest rate or yield earned plus the net annual amortization of original issue discount and market discount earned on accruing debt included in such securities, divided by (b) total debt and income producing securities at fair value included in such securities. The weighted average yield of debt and income producing securities at fair value was 12.90% as of September 30, 2010, 13.40% as of June 30, 2010 and 12.53% as of September 30, 2009. Computed as (a) annual stated interest rate on our debt obligations divided by (b) total debt obligations at principal amount. Weighted average investment spread equals weighted average yield of debt and income producing securities at amortized cost minus weighted average cost of debt. Represents gross commitments or fundings less commitments or investments exited, as applicable. Q1-10 and Q3-09 amounts include sales to Ivy Hill of $8.0 million and $5.0 million, respectively. Q1-10 also includes sales to Ivy Hill II of $86.5 million. Excludes realized and unrealized gains (losses). As of September 30, 2010, 18% of the total investments at fair value or 69% of the floating rate investments at fair value contain interest rate floor features. Includes portfolio companies for which there are outstanding commitments, but for which no amounts were funded at the end of the period. Computed as total book debt less cash not restricted for dividends, open trades or for uses specifically designated for other than repaying debt, divided by total stockholders equity. Effective rate as of September 30, 2010. For the three months ended September 30, 2010, the weighted average rate on principal was 4.77%. Requires periodic payments of interest only, with the outstanding principal balance due on maturity. Blended pricing across all notes. In October 2008, we entered into a two-year interest rate swap agreement for a total notional amount of $75 million where we pay a fixed interest rate of 2.985% and receive a floating rate based on the prevailing three-month LIBOR. Represents a regular dividend of $0.40 per share and an additional dividend of $0.10 per share. To be paid on December 31, 2010 to stockholders of record on December 15, 2010. Q1-10 and Q3-09 amounts include sales to Ivy Hill of $8.0 million and $5.0 million, respectively. Q1-10 also includes sales to Ivy Hill II of $86.5 million. (1) (2) (3) (4) (5) (6) (7) (8) (9) (10) (11) (12) (13) (14) (15) (16) (17) (18) |
|
|
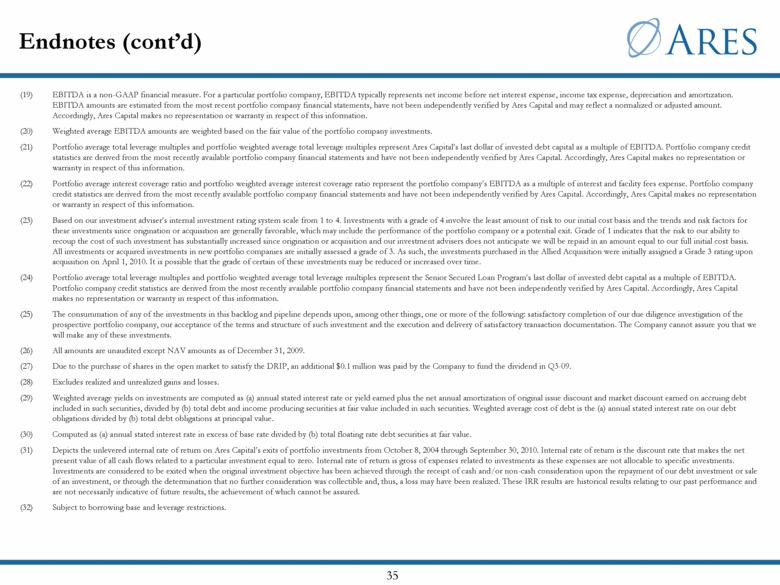
Endnotes (cont’d) EBITDA is a non-GAAP financial measure. For a particular portfolio company, EBITDA typically represents net income before net interest expense, income tax expense, depreciation and amortization. EBITDA amounts are estimated from the most recent portfolio company financial statements, have not been independently verified by Ares Capital and may reflect a normalized or adjusted amount. Accordingly, Ares Capital makes no representation or warranty in respect of this information. Weighted average EBITDA amounts are weighted based on the fair value of the portfolio company investments. Portfolio average total leverage multiples and portfolio weighted average total leverage multiples represent Ares Capital’s last dollar of invested debt capital as a multiple of EBITDA. Portfolio company credit statistics are derived from the most recently available portfolio company financial statements and have not been independently verified by Ares Capital. Accordingly, Ares Capital makes no representation or warranty in respect of this information. Portfolio average interest coverage ratio and portfolio weighted average interest coverage ratio represent the portfolio company’s EBITDA as a multiple of interest and facility fees expense. Portfolio company credit statistics are derived from the most recently available portfolio company financial statements and have not been independently verified by Ares Capital. Accordingly, Ares Capital makes no representation or warranty in respect of this information. Based on our investment adviser’s internal investment rating system scale from 1 to 4. Investments with a grade of 4 involve the least amount of risk to our initial cost basis and the trends and risk factors for these investments since origination or acquisition are generally favorable, which may include the performance of the portfolio company or a potential exit. Grade of 1 indicates that the risk to our ability to recoup the cost of such investment has substantially increased since origination or acquisition and our investment advisers does not anticipate we will be repaid in an amount equal to our full initial cost basis. All investments or acquired investments in new portfolio companies are initially assessed a grade of 3. As such, the investments purchased in the Allied Acquisition were initially assigned a Grade 3 rating upon acquisition on April 1, 2010. It is possible that the grade of certain of these investments may be reduced or increased over time. Portfolio average total leverage multiples and portfolio weighted average total leverage multiples represent the Senior Secured Loan Program’s last dollar of invested debt capital as a multiple of EBITDA. Portfolio company credit statistics are derived from the most recently available portfolio company financial statements and have not been independently verified by Ares Capital. Accordingly, Ares Capital makes no representation or warranty in respect of this information. The consummation of any of the investments in this backlog and pipeline depends upon, among other things, one or more of the following: satisfactory completion of our due diligence investigation of the prospective portfolio company, our acceptance of the terms and structure of such investment and the execution and delivery of satisfactory transaction documentation. The Company cannot assure you that we will make any of these investments. All amounts are unaudited except NAV amounts as of December 31, 2009. Due to the purchase of shares in the open market to satisfy the DRIP, an additional $0.1 million was paid by the Company to fund the dividend in Q3-09. Excludes realized and unrealized gains and losses. Weighted average yields on investments are computed as (a) annual stated interest rate or yield earned plus the net annual amortization of original issue discount and market discount earned on accruing debt included in such securities, divided by (b) total debt and income producing securities at fair value included in such securities. Weighted average cost of debt is the (a) annual stated interest rate on our debt obligations divided by (b) total debt obligations at principal value. Computed as (a) annual stated interest rate in excess of base rate divided by (b) total floating rate debt securities at fair value. Depicts the unlevered internal rate of return on Ares Capital’s exits of portfolio investments from October 8, 2004 through September 30, 2010. Internal rate of return is the discount rate that makes the net present value of all cash flows related to a particular investment equal to zero. Internal rate of return is gross of expenses related to investments as these expenses are not allocable to specific investments. Investments are considered to be exited when the original investment objective has been achieved through the receipt of cash and/or non-cash consideration upon the repayment of our debt investment or sale of an investment, or through the determination that no further consideration was collectible and, thus, a loss may have been realized. These IRR results are historical results relating to our past performance and are not necessarily indicative of future results, the achievement of which cannot be assured. Subject to borrowing base and leverage restrictions. (19) (20) (21) (22) (23) (24) (25) (26) (27) (28) (29) (30) (31) (32) |

