Attached files
| file | filename |
|---|---|
| 8-K - 8-K - ACCURIDE CORP | a10-20624_28k.htm |
| EX-99.1 - EX-99.1 - ACCURIDE CORP | a10-20624_2ex99d1.htm |
Exhibit 99.2
|
|
3rd Quarter 2010 Earnings Call November 4, 2010 |
|
|
2 Overview Third Quarter Highlights Industry Update Corporate Initiatives Financial Information Third Quarter Results Financial Structure Fourth Quarter and 2010 Outlook Q&A Closing Comments Bill Lasky President, CEO & Chairman Jim Woodward Senior Vice President & Chief Financial Officer Bill Lasky Jim Woodward Bill Lasky Agenda |
|
|
3 Statements contained in this news release that are not purely historical are forward-looking statements within the meaning of Section 27A of the Securities Act of 1933, as amended, and Section 21E of the Securities Exchange Act of 1934, as amended, including statements regarding Accuride’s expectations, hopes, beliefs and intentions with respect to future results. Such statements are subject to the impact on Accuride’s business and prospects generally of, among other factors, market demand in the commercial vehicle industry, general economic, business and financing conditions, labor relations, governmental action, competitor pricing activity, expense volatility and other risks detailed from time to time in Accuride’s Securities and Exchange Commission filings, including those described in Item 1A of Accuride’s Annual Report on Form 10-K for the fiscal year ended December 31, 2009. Any forward-looking statement reflects only Accuride’s belief at the time the statement is made. Although Accuride believes that the expectations reflected in these forward-looking statements are reasonable, it cannot guarantee its future results, levels of activity, performance or achievements. Except as required by law, Accuride undertakes no obligation to update any forward-looking statements to reflect events or developments after the date of this news release. Forward Looking Statements |
|
|
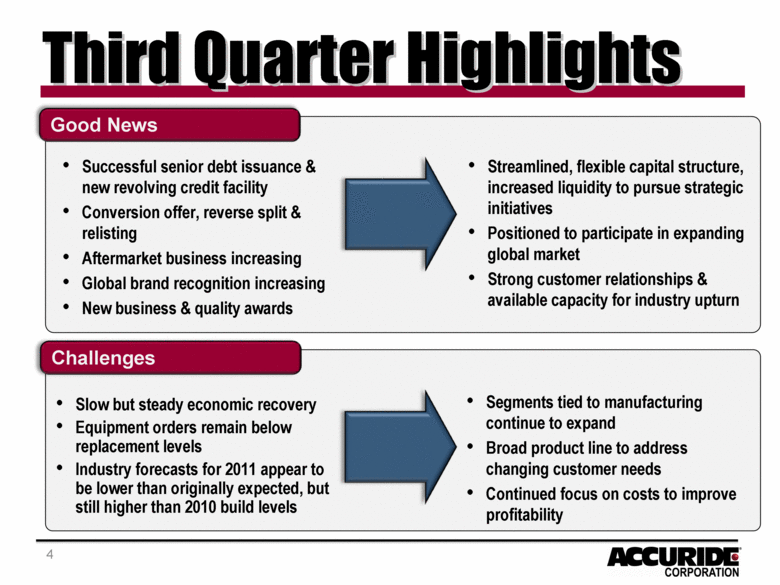
Good News Successful senior debt issuance & new revolving credit facility Conversion offer, reverse split & relisting Aftermarket business increasing Global brand recognition increasing New business & quality awards Slow but steady economic recovery Equipment orders remain below replacement levels Industry forecasts for 2011 appear to be lower than originally expected, but still higher than 2010 build levels Challenges Third Quarter Highlights Streamlined, flexible capital structure, increased liquidity to pursue strategic initiatives Positioned to participate in expanding global market Strong customer relationships & available capacity for industry upturn Segments tied to manufacturing continue to expand Broad product line to address changing customer needs Continued focus on costs to improve profitability 4 |
|
|
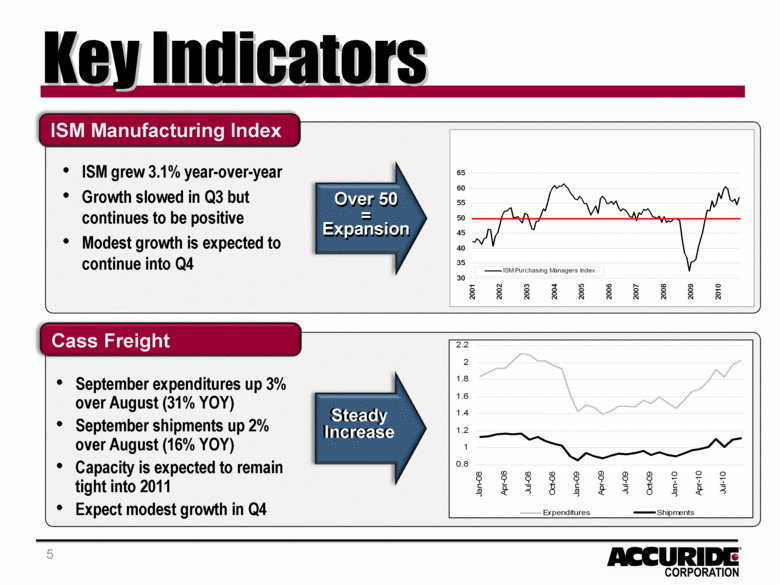
5 ISM Manufacturing Index ISM grew 3.1% year-over-year Growth slowed in Q3 but continues to be positive Modest growth is expected to continue into Q4 September expenditures up 3% over August (31% YOY) September shipments up 2% over August (16% YOY) Capacity is expected to remain tight into 2011 Expect modest growth in Q4 Cass Freight Key Indicators Steady Increase Over 50 = Expansion 0.8 1 1.2 1.4 1.6 1.8 2 2.2 Jan-08 Apr-08 Jul-08 Oct-08 Jan-09 Apr-09 Jul-09 Oct-09 Jan-10 Apr-10 Jul-10 Expenditures Shipments 30 35 40 45 50 55 60 65 2001 2002 2003 2004 2005 2006 2007 2008 2009 2010 ISM Purchasing Managers Index |
|
|
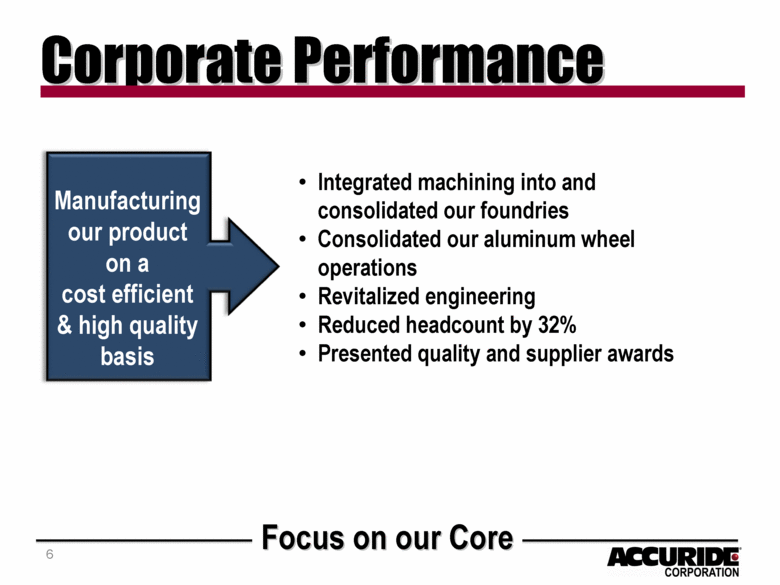
6 Corporate Performance Focus on our Core Integrated machining into and consolidated our foundries Consolidated our aluminum wheel operations Revitalized engineering Reduced headcount by 32% Presented quality and supplier awards Manufacturing our product on a cost efficient & high quality basis |
|
|
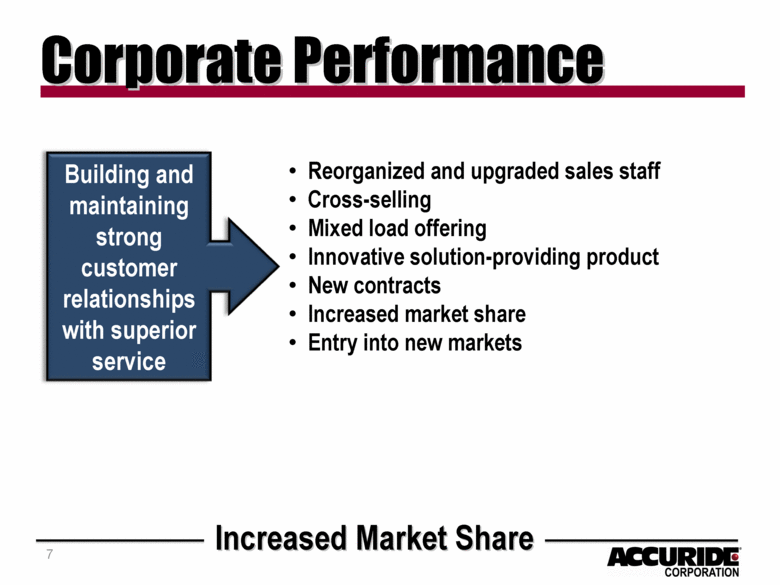
7 Reorganized and upgraded sales staff Cross-selling Mixed load offering Innovative solution-providing product New contracts Increased market share Entry into new markets Building and maintaining strong customer relationships with superior service Corporate Performance Increased Market Share |
|
|
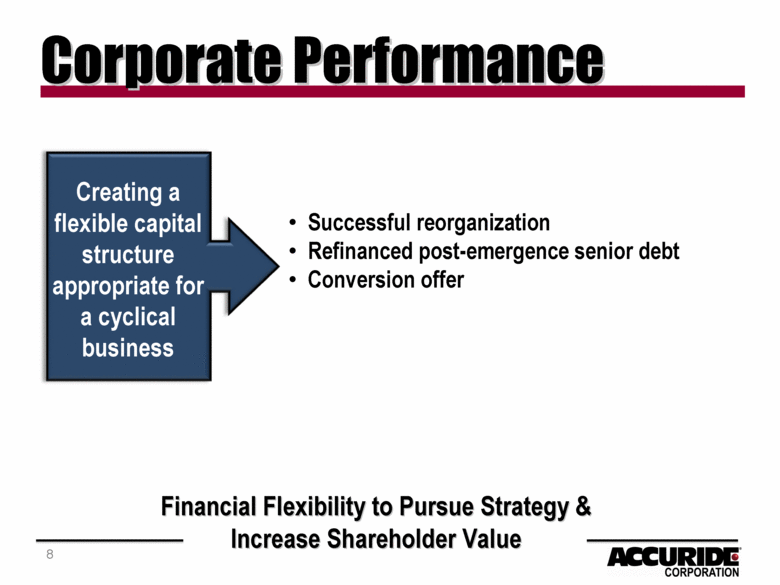
8 Successful reorganization Refinanced post-emergence senior debt Conversion offer Creating a flexible capital structure appropriate for a cyclical business Corporate Performance Financial Flexibility to Pursue Strategy & Increase Shareholder Value |
|
|
9 Financials |
|
|
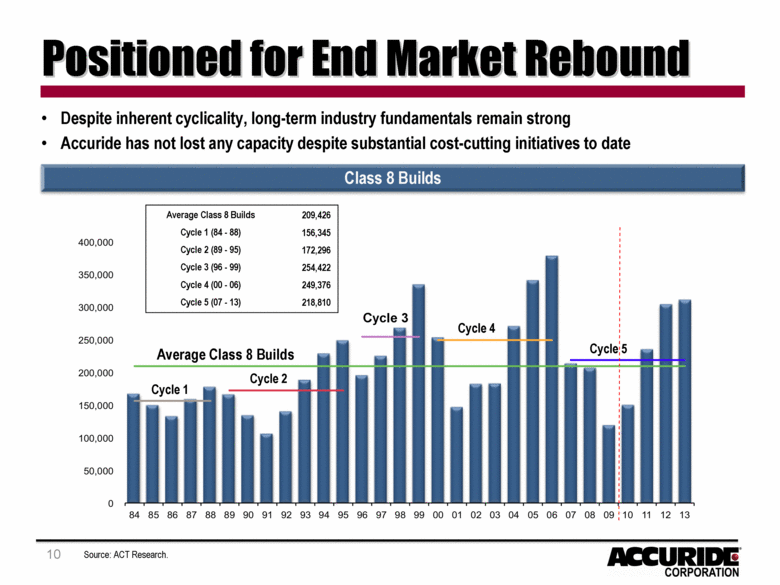
10 Positioned for End Market Rebound Despite inherent cyclicality, long-term industry fundamentals remain strong Accuride has not lost any capacity despite substantial cost-cutting initiatives to date Source: ACT Research. Cycle 2 Cycle 1 Cycle 3 Cycle 4 Average Class 8 Builds Cycle 5 Average Class 8 Builds Cycle 1 (84 - 88) Cycle 2 (89 - 95) Cycle 3 (96 - 99) Cycle 4 (00 - 06) Cycle 5 (07 - 13) 209,426 156,345 172,296 254,422 249,376 218,810 Class 8 Builds |
|
|
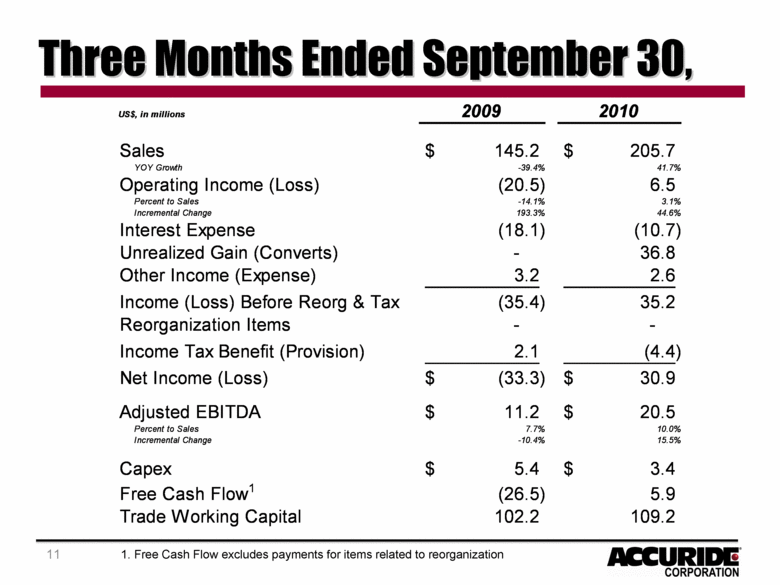
11 Three Months Ended September 30, 1. Free Cash Flow excludes payments for items related to reorganization US$, in millions 2009 2010 Sales 145.2 $ 205.7 $ YOY Growth -39.4% 41.7% Operating Income (Loss) (20.5) 6.5 Percent to Sales -14.1% 3.1% Incremental Change 193.3% 44.6% Interest Expense (18.1) (10.7) Unrealized Gain (Converts) - 36.8 Other Income (Expense) 3.2 2.6 Income (Loss) Before Reorg & Tax (35.4) 35.2 Reorganization Items - - Income Tax Benefit (Provision) 2.1 (4.4) Net Income (Loss) (33.3) $ 30.9 $ Adjusted EBITDA 11.2 $ 20.5 $ Percent to Sales 7.7% 10.0% Incremental Change -10.4% 15.5% Capex 5.4 $ 3.4 $ Free Cash Flow1 (26.5) 5.9 Trade Working Capital 102.2 109.2 |
|
|
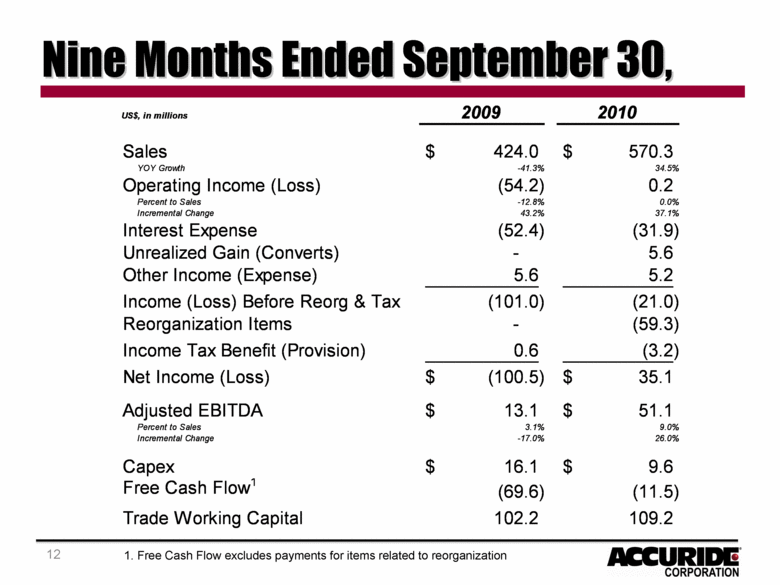
12 Nine Months Ended September 30, 1. Free Cash Flow excludes payments for items related to reorganization US$, in millions 2009 2010 Sales 424.0 $ 570.3 $ YOY Growth -41.3% 34.5% Operating Income (Loss) (54.2) 0.2 Percent to Sales -12.8% 0.0% Incremental Change 43.2% 37.1% Interest Expense (52.4) (31.9) Unrealized Gain (Converts) - 5.6 Other Income (Expense) 5.6 5.2 Income (Loss) Before Reorg & Tax (101.0) (21.0) Reorganization Items - (59.3) Income Tax Benefit (Provision) 0.6 (3.2) Net Income (Loss) (100.5) $ 35.1 $ Adjusted EBITDA 13.1 $ 51.1 $ Percent to Sales 3.1% 9.0% Incremental Change -17.0% 26.0% Capex 16.1 $ 9.6 $ Free Cash Flow1 (69.6) (11.5) Trade Working Capital 102.2 109.2
|
|
|
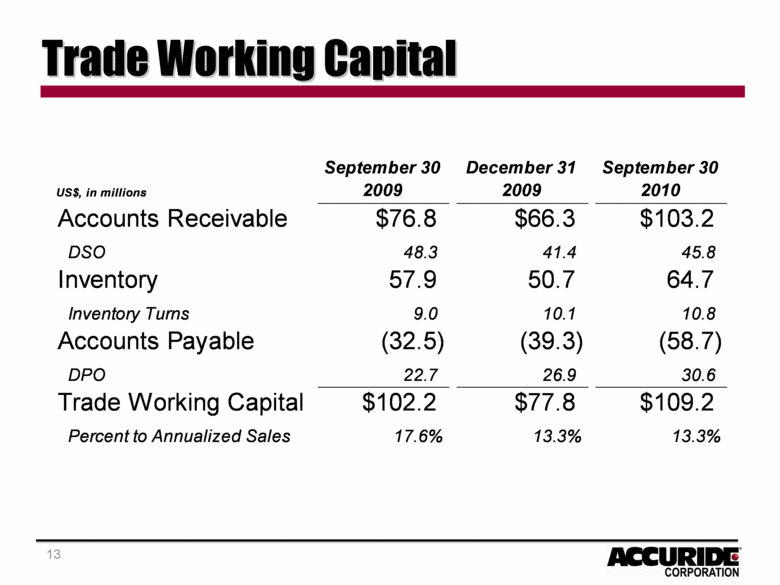
13 Trade Working Capital US$, in millions 2009 2010 Sales 424.0 $ 570.3 $ YOY Growth -41.3% 34.5% Operating Income (Loss) (54.2) 0.2 Percent to Sales -12.8% 0.0% Incremental Change 43.2% 37.1% Interest Expense (52.4) (31.9) Unrealized Gain (Converts) - 5.6 Other Income (Expense) 5.6 5.2 Income (Loss) Before Reorg & Tax (101.0) (21.0) Reorganization Items - (59.3) Income Tax Benefit (Provision) 0.6 (3.2) Net Income (Loss) (100.5) $ 35.1 $ Adjusted EBITDA 13.1 $ 51.1 $ Percent to Sales 3.1% 9.0% Incremental Change -17.0% 26.0% Capex 16.1 $ 9.6 $ Free Cash Flow1 (69.6) (11.5) Trade Working Capital 102.2 109.2 |
|
|
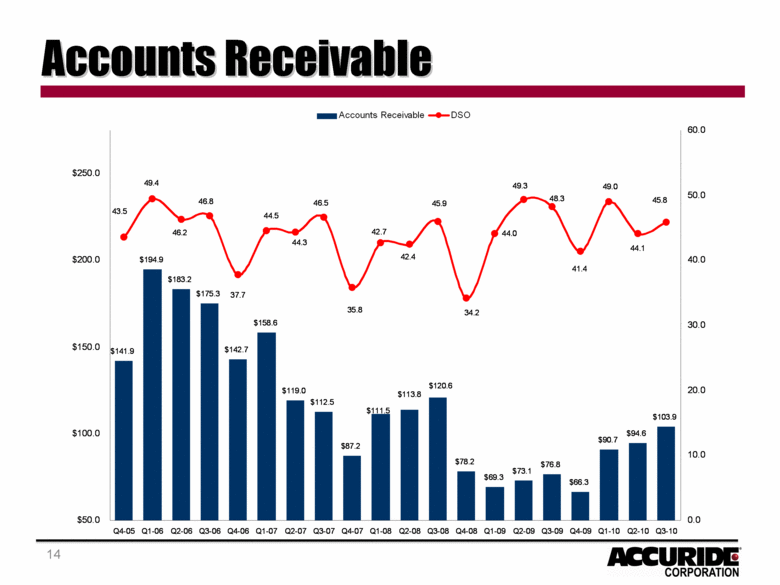
14 Accounts Receivable |
|
|
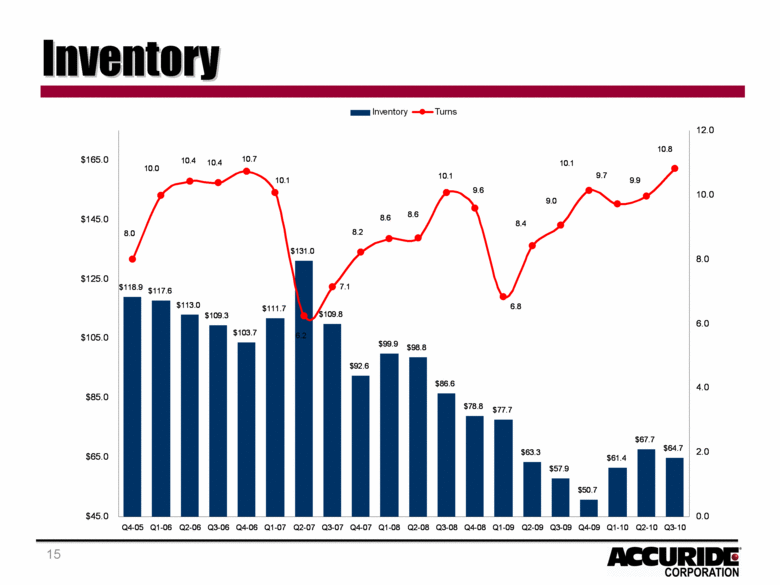
15 Inventory |
|
|
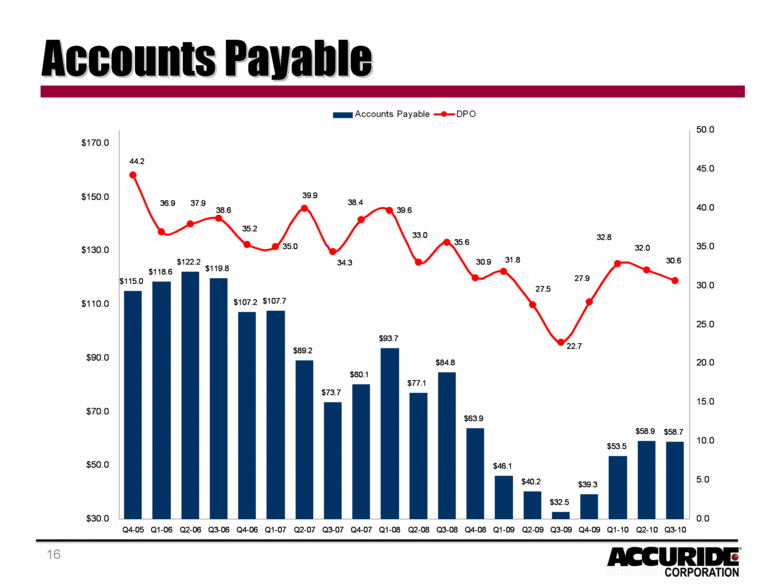
16 Accounts Payable |
|
|
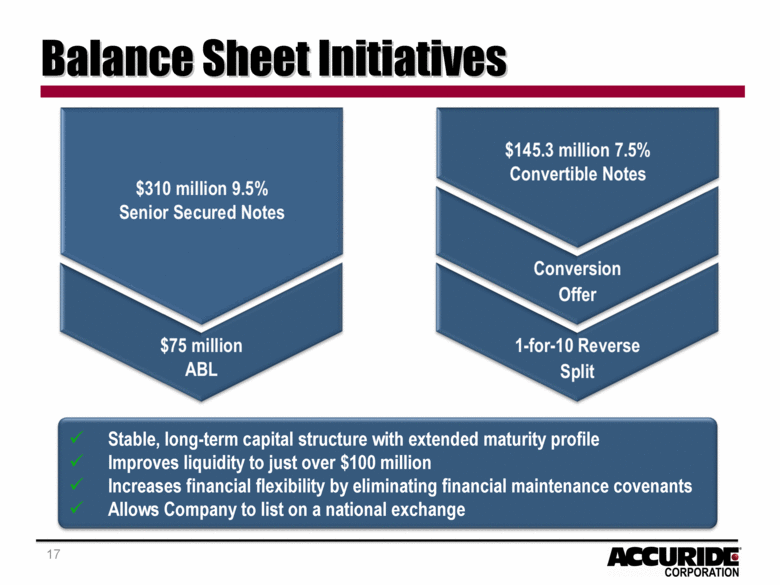
17 Balance Sheet Initiatives Stable, long-term capital structure with extended maturity profile Improves liquidity to just over $100 million Increases financial flexibility by eliminating financial maintenance covenants Allows Company to list on a national exchange |
|
|
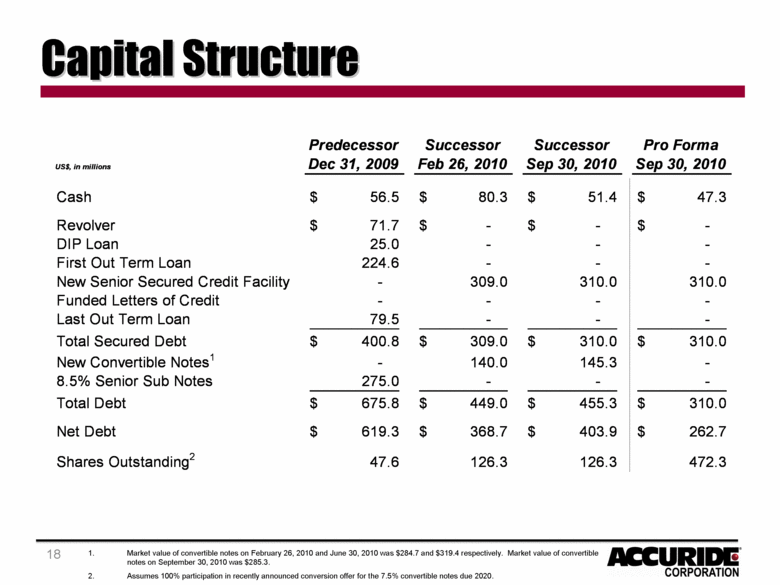
18 Capital Structure Market value of convertible notes on February 26, 2010 and June 30, 2010 was $284.7 and $319.4 respectively. Market value of convertible notes on September 30, 2010 was $285.3. Assumes 100% participation in recently announced conversion offer for the 7.5% convertible notes due 2020. US$, in millions 2009 2010 Sales 424.0 $ 570.3 $ YOY Growth -41.3% 34.5% Operating Income (Loss) (54.2) 0.2 Percent to Sales -12.8% 0.0% Incremental Change 43.2% 37.1% Interest Expense (52.4) (31.9) Unrealized Gain (Converts) - 5.6 Other Income (Expense) 5.6 5.2 Income (Loss) Before Reorg & Tax (101.0) (21.0) Reorganization Items - (59.3) Income Tax Benefit (Provision) 0.6 (3.2) Net Income (Loss) (100.5) $ 35.1 $ Adjusted EBITDA 13.1 $ 51.1 $ Percent to Sales 3.1% 9.0% Incremental Change -17.0% 26.0% Capex 16.1 $ 9.6 $ Free Cash Flow1 (69.6) (11.5) Trade Working Capital 102.2 109.2
|
|
|
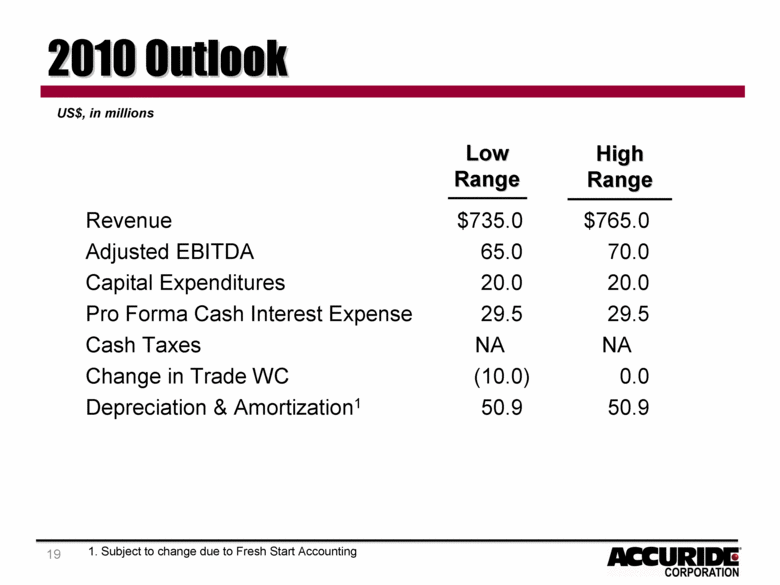
19 2010 Outlook Revenue $735.0 $765.0 Adjusted EBITDA 65.0 70.0 Capital Expenditures 20.0 20.0 Pro Forma Cash Interest Expense 29.5 29.5 Cash Taxes NA NA Change in Trade WC (10.0) 0.0 Depreciation & Amortization1 50.9 50.9 Low Range High Range US$, in millions 1. Subject to change due to Fresh Start Accounting |
|
|
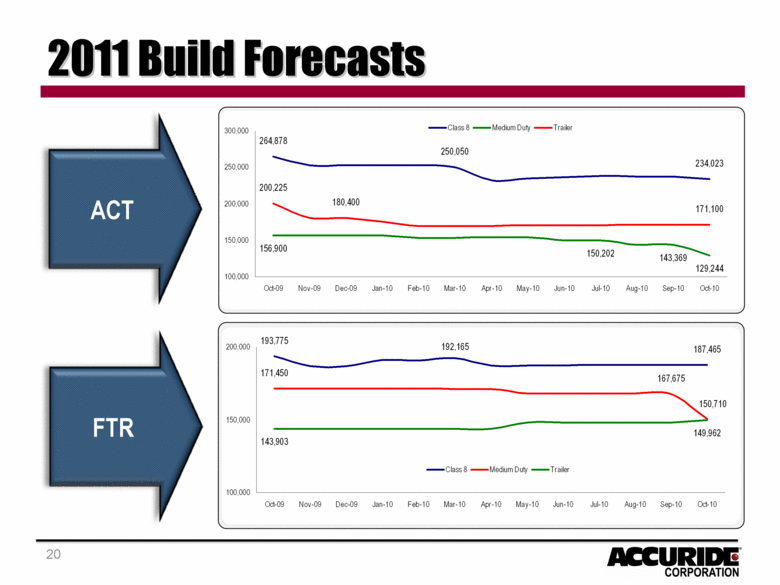
20 2011 Build Forecasts ACT FTR |
|
|
21 Questions? |
|
|
22 Appendix |
|
|
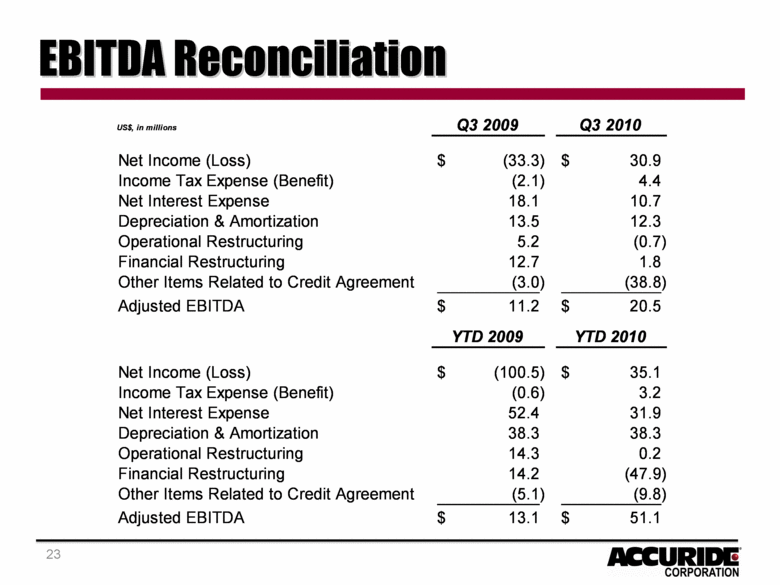
23 EBITDA Reconciliation US$, in millions 2009 2010 Sales 424.0 $ 570.3 $ YOY Growth -41.3% 34.5% Operating Income (Loss) (54.2) 0.2 Percent to Sales -12.8% 0.0% Incremental Change 43.2% 37.1% Interest Expense (52.4) (31.9) Unrealized Gain (Converts) - 5.6 Other Income (Expense) 5.6 5.2 Income (Loss) Before Reorg & Tax (101.0) (21.0) Reorganization Items - (59.3) Income Tax Benefit (Provision) 0.6 (3.2) Net Income (Loss) (100.5) $ 35.1 $ Adjusted EBITDA 13.1 $ 51.1 $ Percent to Sales 3.1% 9.0% Incremental Change -17.0% 26.0% Capex 16.1 $ 9.6 $ Free Cash Flow1 (69.6) (11.5) Trade Working Capital 102.2 109.2 |
|
|
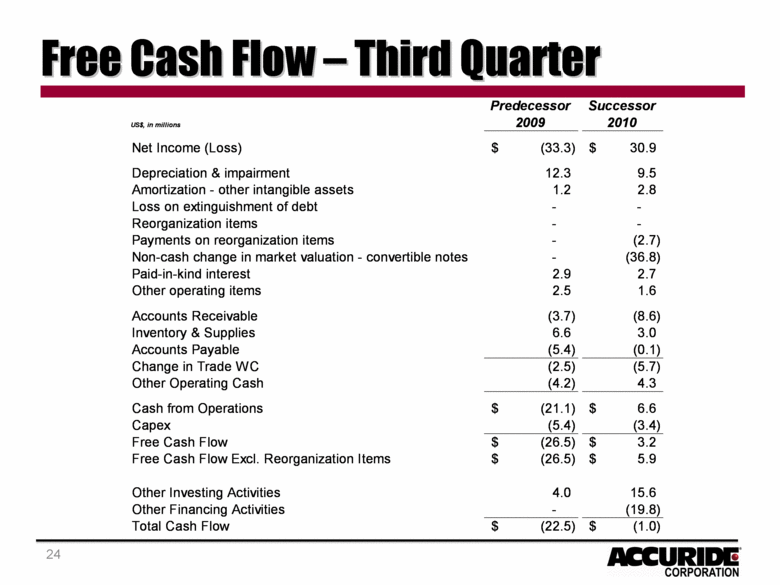
24 Free Cash Flow – Third Quarter Predecessor Successor US$, in millions 2009 2010 Net Income (Loss) (33.3) $ 30.9 $ Depreciation & impairment 12.3 9.5 Amortization - other intangible assets 1.2 2.8 Loss on extinguishment of debt - - Reorganization items - - Payments on reorganization items - (2.7) Non-cash change in market valuation - convertible notes - (36.8) Paid-in-kind interest 2.9 2.7 Other operating items 2.5 1.6 Accounts Receivable (3.7) (8.6) Inventory & Supplies 6.6 3.0 Accounts Payable (5.4) (0.1) Change in Trade WC (2.5) (5.7) Other Operating Cash (4.2) 4.3 Cash from Operations (21.1) $ 6.6 $ Capex (5.4) (3.4) Free Cash Flow (26.5) $ 3.2 $ Free Cash Flow Excl. Reorganization Items (26.5) $ 5.9 $ Other Investing Activities 4.0 15.6 Other Financing Activities - (19.8) Total Cash Flow (22.5) $ (1.0) $
|
|
|
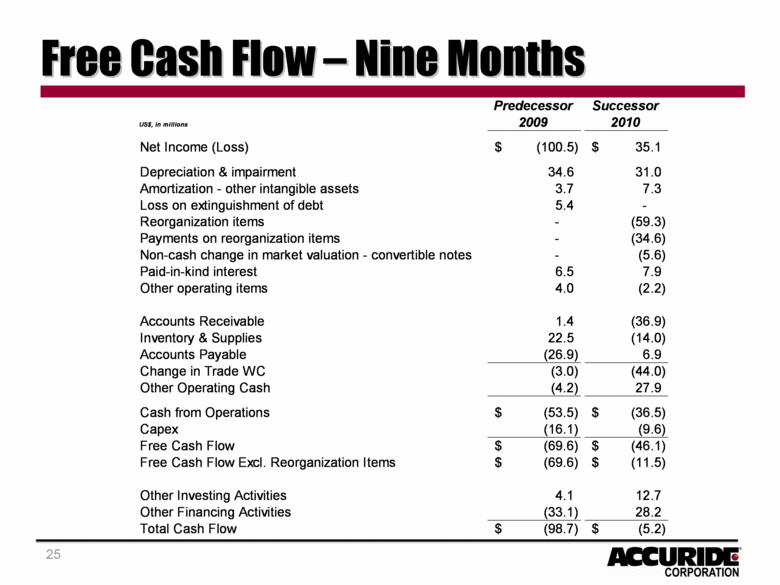
25 Free Cash Flow – Nine Months Predecessor Successor US$, in millions 2009 2010 Net Income (Loss) (100.5) $ 35.1 $ Depreciation & impairment 34.6 31.0 Amortization - other intangible assets 3.7 7.3 Loss on extinguishment of debt 5.4 - Reorganization items - (59.3) Payments on reorganization items - (34.6) Non-cash change in market valuation - convertible notes - (5.6) Paid-in-kind interest 6.5 7.9 Other operating items 4.0 (2.2) Accounts Receivable 1.4 (36.9) Inventory & Supplies 22.5 (14.0) Accounts Payable (26.9) 6.9 Change in Trade WC (3.0) (44.0) Other Operating Cash (4.2) 27.9 Cash from Operations (53.5) $ (36.5) $ Capex (16.1) (9.6) Free Cash Flow (69.6) $ (46.1) $ Free Cash Flow Excl. Reorganization Items (69.6) $ (11.5) $ Other Investing Activities 4.1 12.7 Other Financing Activities (33.1) 28.2 Total Cash Flow (98.7) $ (5.2) $ |
|
|
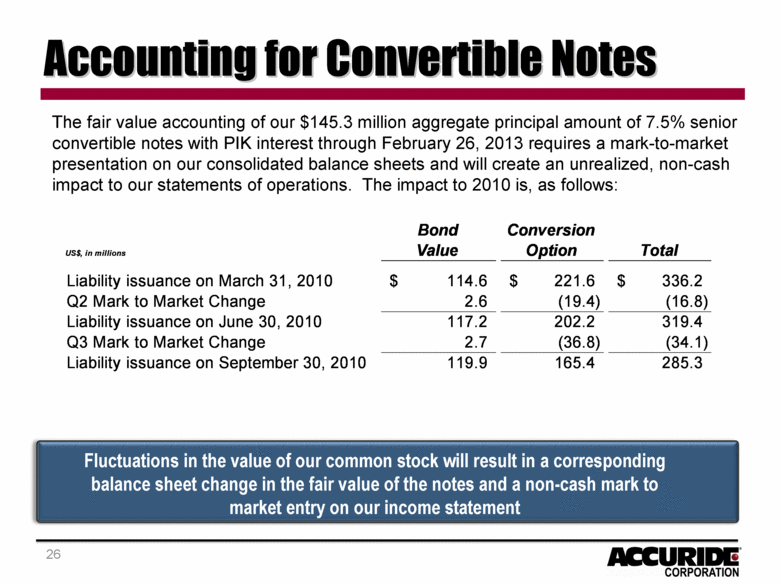
26 Accounting for Convertible Notes The fair value accounting of our $145.3 million aggregate principal amount of 7.5% senior convertible notes with PIK interest through February 26, 2013 requires a mark-to-market presentation on our consolidated balance sheets and will create an unrealized, non-cash impact to our statements of operations. The impact to 2010 is, as follows: Fluctuations in the value of our common stock will result in a corresponding balance sheet change in the fair value of the notes and a non-cash mark to market entry on our income statement Bond Conversion US$, in millions Value Option Total Liability issuance on March 31, 2010 114.6 $ 221.6 $ 336.2 $ Q2 Mark to Market Change 2.6 (19.4) (16.8) Liability issuance on June 30, 2010 117.2 202.2 319.4 Q3 Mark to Market Change 2.7 (36.8) (34.1) Liability issuance on September 30, 2010 119.9 165.4 285.3
|
|
|
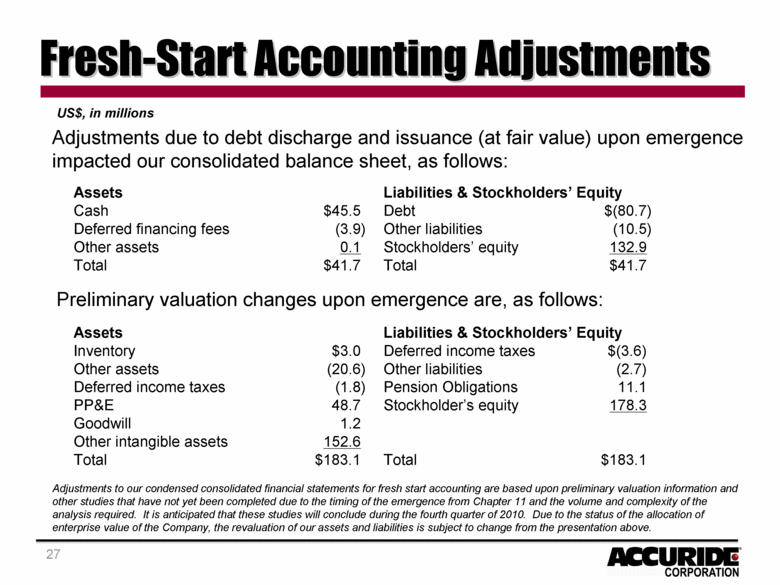
27 Fresh-Start Accounting Adjustments Adjustments to our condensed consolidated financial statements for fresh start accounting are based upon preliminary valuation information and other studies that have not yet been completed due to the timing of the emergence from Chapter 11 and the volume and complexity of the analysis required. It is anticipated that these studies will conclude during the fourth quarter of 2010. Due to the status of the allocation of enterprise value of the Company, the revaluation of our assets and liabilities is subject to change from the presentation above. Adjustments due to debt discharge and issuance (at fair value) upon emergence impacted our consolidated balance sheet, as follows: Preliminary valuation changes upon emergence are, as follows: Assets Liabilities & Stockholders’ Equity Cash $45.5 Debt $(80.7 ) Deferred financing fees (3.9 ) Other liabilities (10.5 ) Other assets 0.1 Stockholders’ equity 132.9 Total $41.7 Total $41.7 Assets Liabilities & Stockholders’ Equity Inventory $3.0 Deferred income taxes $(3.6) Other assets (20.6 ) Other liabilities (2.7) Deferred income taxes (1.8 ) Pension Obligations 11.1 PP&E 48.7 Stockholder’s equity 178.3 Goodwill 1.2 Other intangible assets 152.6 Total $183.1 Total $183.1 US$, in millions |

