Attached files
| file | filename |
|---|---|
| 8-K - FORM 8-K - NAVISTAR INTERNATIONAL CORP | d8k.htm |
 NYSE:
NAV Exhibit 99.1
34
Annual
Gabelli
&
Co.
Automotive Aftermarket Symposium
November 1, 2010
th |
 2
NYSE: NAV
Safe Harbor
Statement
Information provided and statements contained in this presentation that are not
purely historical are forward-looking statements within the meaning of
Section 27A of the Securities Act of 1933, as
amended, Section
21E of the Securities Exchange Act of 1934, as amended, and the Private Securities
Litigation Reform Act of 1995. Such forward-looking statements only
speak as of the date of this presentation and the Company assumes no
obligation to update the information included in this
presentation. Such forward-looking statements include information concerning
our possible or assumed future results of operations, including descriptions
of our business strategy. These statements often include words such as
“believe,” “expect,”
“anticipate,”
“intend,”
“plan,”
“estimate,”
or similar
expressions. These statements are not guarantees of performance or results and they
involve risks, uncertainties, and assumptions. For a further description of
these factors, see Item 1A, Risk Factors,
included within our Form 10-K for the year ended October
31, 2009, which was filed on
December 21, 2009. Although we believe that these forward-looking
statements are based on reasonable assumptions, there are many factors that
could affect our actual financial results or results
of operations and could cause actual results to differ materially from those in the
forward-looking statements. All future written and oral
forward-looking statements by us or persons acting on our behalf are
expressly qualified in their entirety by the cautionary statements contained or referred to above.
Except for our ongoing obligations to disclose material information as required by
the federal securities laws, we do not have any obligations or intention to
release publicly any revisions to any forward- looking statements to
reflect events or circumstances in the future or to reflect the occurrence of
unanticipated events. |
 3
NYSE: NAV
Other Cautionary Notes
•
The financial information herein contains audited and unaudited
information and has been prepared by management in good faith
and based on data currently available to the Company.
•
Certain Non-GAAP measures are used in this presentation to assist
the reader in understanding our core manufacturing business.
We
believe this information is useful and relevant to assess and
measure the performance of our core manufacturing business as it
illustrates manufacturing performance without regard to selected
historical legacy costs (i.e. pension and other postretirement costs).
It also excludes financial services and other expenses that may not
be related to the core manufacturing business. Management often
uses this information to assess and measure the performance of our
operating segments.
A reconciliation to the most appropriate GAAP
number is included in the appendix of this presentation.
|
 4
NYSE: NAV
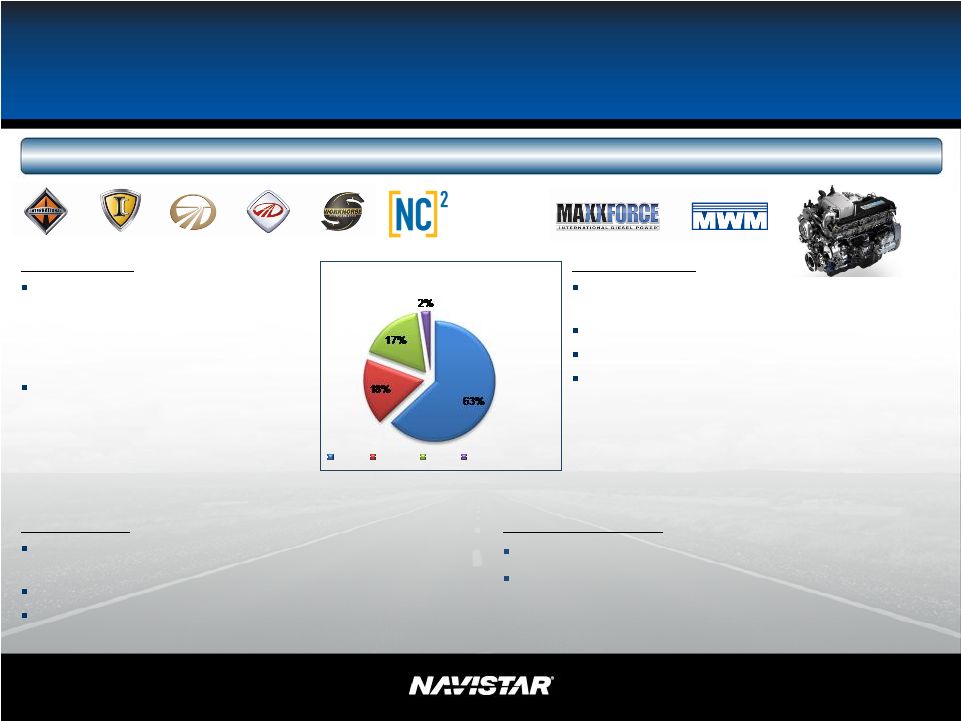
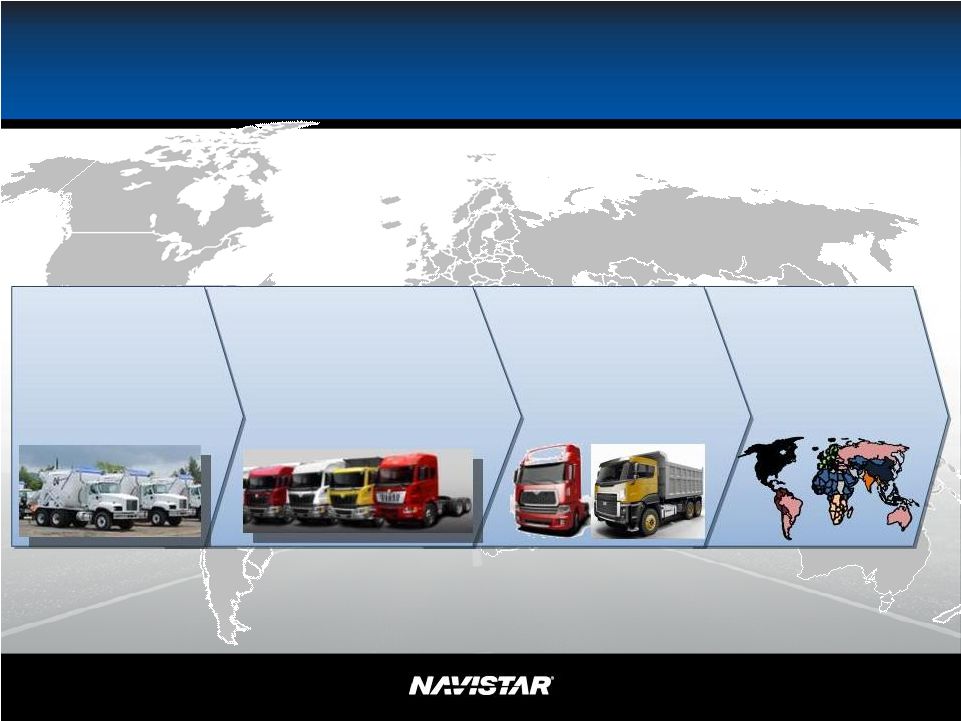
Company Overview
Truck Group
North American market share leader
with regional and long-haul class 8
trucks, recreational vehicles, class 6-7
trucks, buses, military vehicles and
severe service trucks
Products, parts and services sold
through an extensive dealer network in
North America, Brazil and more than
90 other countries globally
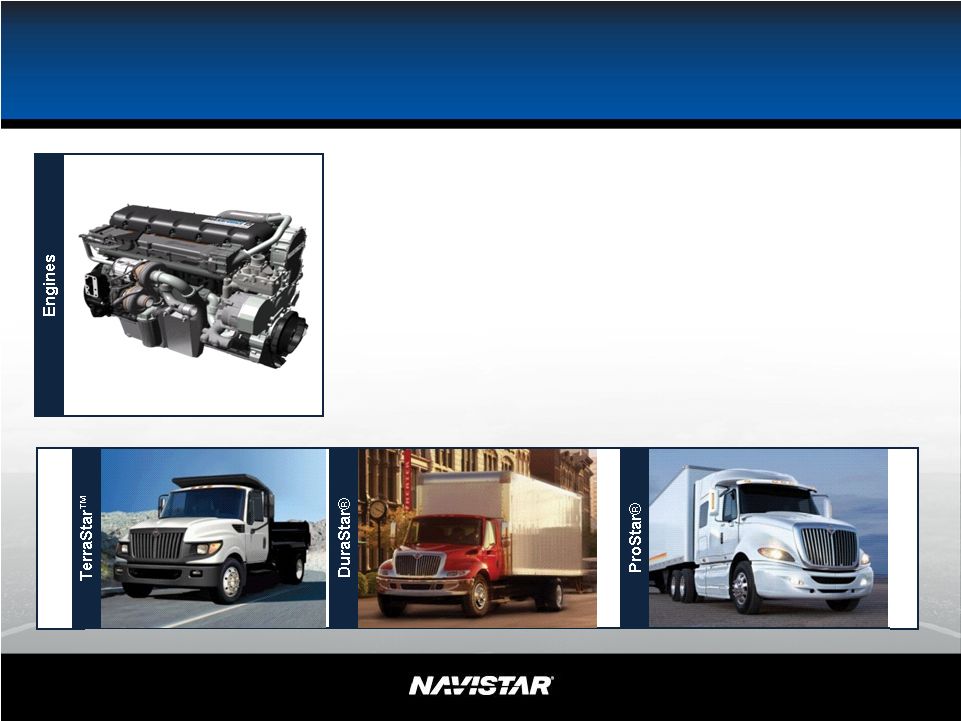
Engine Group
Engine manufacturer of mid-range and
heavy-duty diesel engines
Products sold directly to major global OEMs
Manufacturing locations in U.S. and Brazil
Industries and applications include:
agriculture, industrial, buses, commercial on-
highway trucks, consumer vehicles, military,
marine vessels and commercial off-highway
vehicles
Parts Group
Distribution business that provides high-margin and
non-cyclical earnings
Strong growth in revenue and earnings
Most extensive distribution channel in truck and mid-
range diesel
Navistar Financial
Provide wholesale, retail and account financing
Manage / facilitate alliance finance partners providing
wholesale, retail and account financing
Consolidated 2009 Revenues
Truck
Engine
Parts
Financial Services
Founded over 100 years ago, Navistar’s 2009 revenues were $11.6 billion, $8.8 billion July 2010 YTD
|
 5
NYSE: NAV
•
Postretirement
•
Capital structure
•
Labor legacy
Navistar Strategy to Create
Shareholder Value
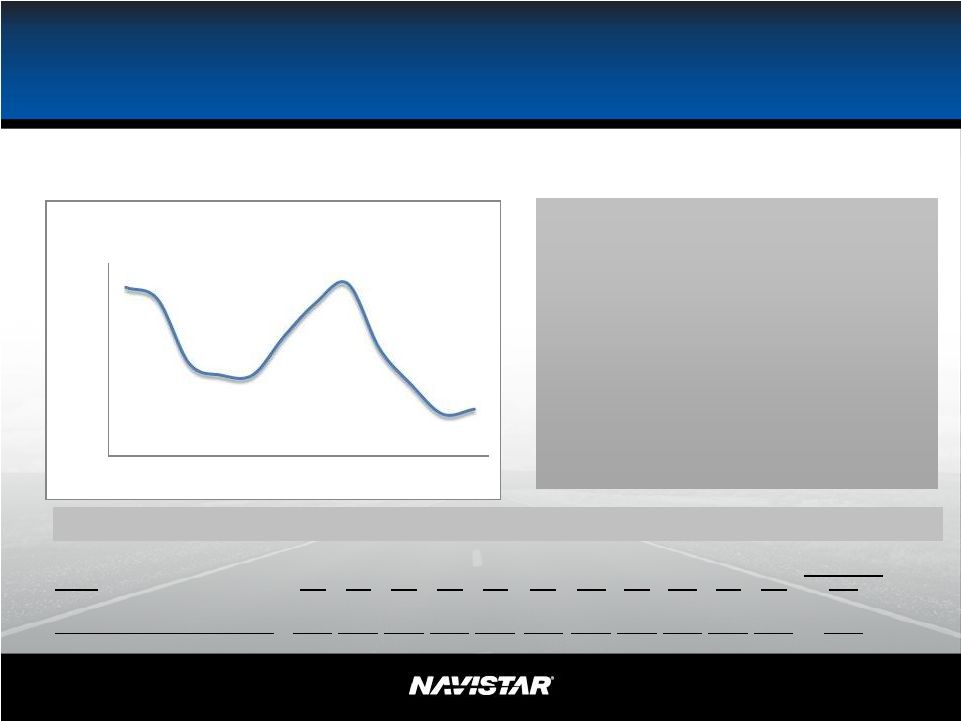
Navistar Environment
Navistar Environment
Current 2010
Forecast
Industry
FY99
FY00
FY01
FY02
FY03
FY04
FY 05
FY06
FY 07
FY08
FY09
FY 10
School Bus
33,800
33,900
27,900
27,400
29,200
26,200
26,800
28,200
24,500
24,400
22,600
20,000
Class 6-7 - Medium
126,000
129,600
96,000
72,700
74,900
99,200
104,600
110,400
88,500
59,600
39,800
46,000
Combined Class 8 (Heavy & Severe Service)
286,000
258,300
163,700
163,300
159,300
219,300
282,900
316,100
206,000
160,100
119,400
126,500
Total Industry Demand
445,800
421,800
287,600
263,400
263,400
344,700
414,300
454,700
319,000
244,100
181,800
192,500
Actual
United States and Canadian Class 6-8 Truck Industry - Retail Sales Volume
Historical Information
Industry Environment
Industry Environment
100,000
200,000
300,000
400,000
500,000
1999
2000
2001
2002
2003
2004
2005
2006
2007
2008
2009
2010
Fcst
U.S. and Canada Class 6-8 Retail
Industry |
 6
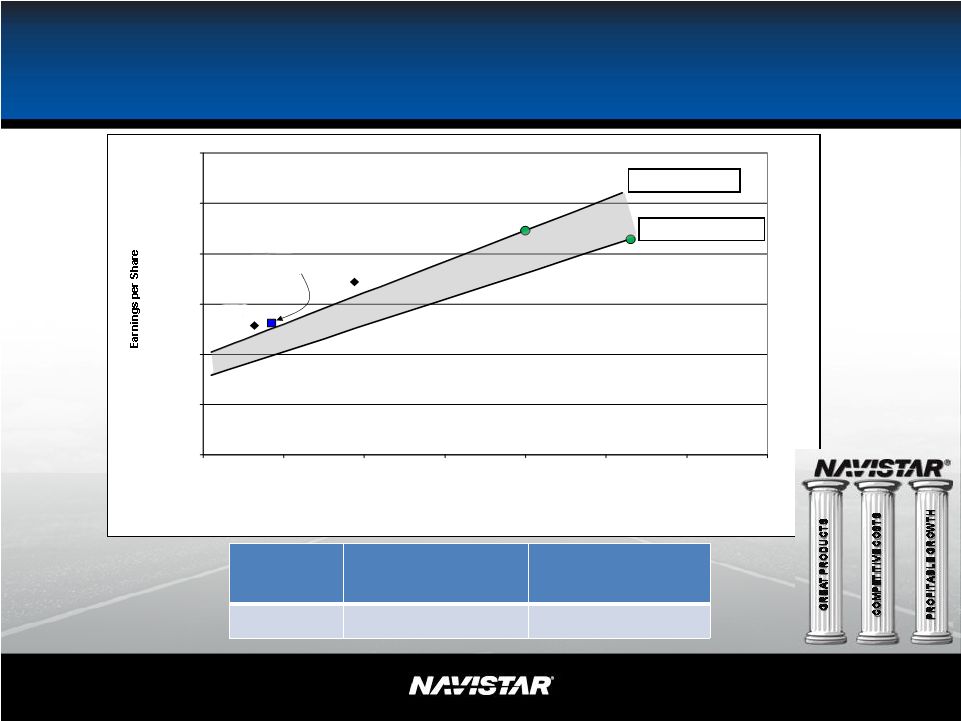
NYSE: NAV
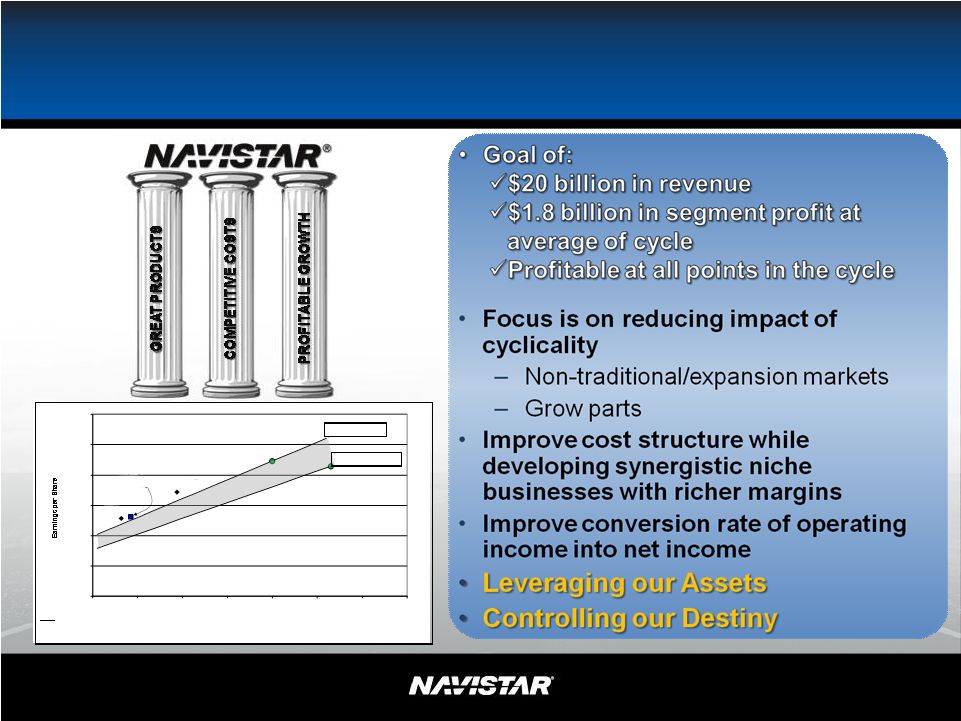
Strategy
Notes:
* 2008 excludes Impairment
** 2009 excludes Ford and 1-time items
*** Assumes attainment of mature global growth by end of calendar year
2013 $(10.00)
$(5.00)
$-
$5.00
$10.00
$15.00
$20.00
150
200
250
300
350
400
450
500
Traditional Industry Volume (Thousands of Units)
2010
Guidance
Midpoint
Original $1.6B Segment
Profit Goal
@ 415kunits
$1.8B Segment Profit
Goal
@ 350kunits***
2008
Actual*
2009
Actual**
Note: This is not meant for updated guidance, it is for illustrative purposes only. This
slide contains non-GAAP information, please see the Reg G in appendix for detailed reconciliation. |
 Strategic Framework Remains Intact
DIFFERENTIATION &
LEADERSHIP
7
NYSE: NAV |
 8
NYSE: NAV
Medium
Truck
Great Products –
Market Share
52% Market Share
3Q10
Severe
Service
Truck
Heavy
Truck
FY07
60%
FY08
55%
FY09
61%
Sep YTD10
58%
FY07
36%
FY08
36%
FY09
35%
Sep YTD10
37%
FY07
25%
FY08
27%
FY09
34%
Sep YTD10
34%
FY07
15%
FY08
19%
FY09
25%
Sep YTD10
25%
Class 8
School
Bus
(U.S. & Canada)
Note: Market share based on brand and Severe Service Truck market share excludes military and
stripped chassis 36% Market Share
3Q10
35% Market Share
3Q10
30% Market Share
3Q10
31% Market Share
3Q10
School Bus & Combined Class 6-8 Market Share –
Sep YTD08: 27%; Sep YTD09: 35% Sep YTD10: 33% |
 9
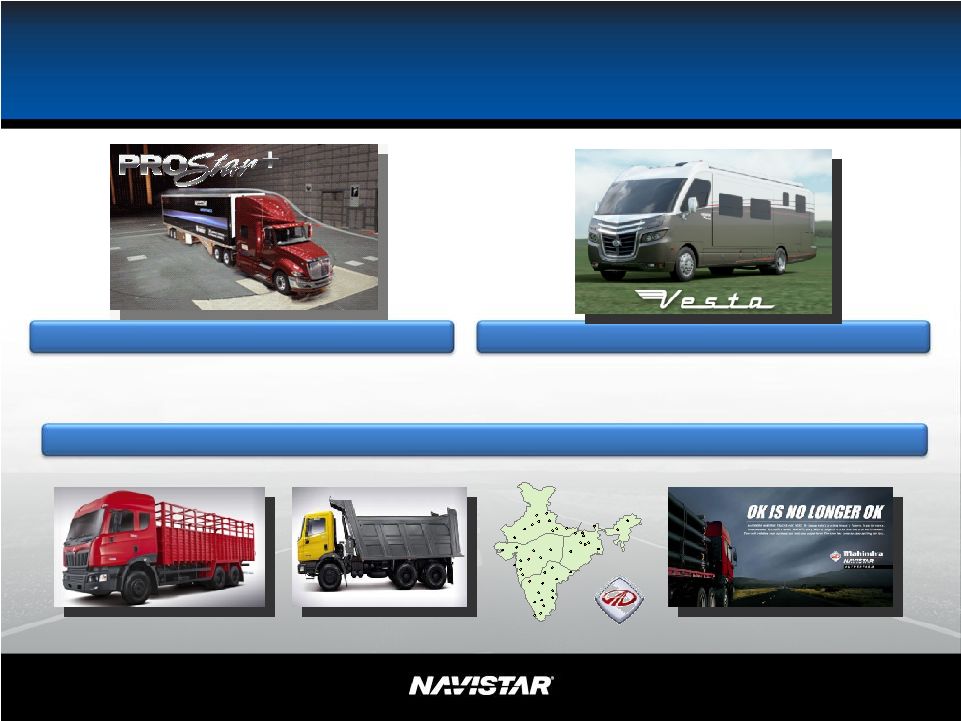
NYSE: NAV
Game Changers
Fully
vertically
integrated
“Motorhome
of
the
Future”
4.5% Fuel Economy Improvement
Disruptive
Thinking
–
Reshaping
the
Standards
Fuel
Fuel
economy
economy
improvement
improvement
vs.
vs.
2009
2009
ProStar
ProStar
Most aerodynamic, ergonomic and fuel efficient
Most aerodynamic, ergonomic and fuel efficient
®
® |
 NYSE:
NAV 10
MaxxForce
MaxxForce
DT
DT
MaxxForce
MaxxForce
9
9
MaxxForce
MaxxForce
10
10
MaxxForce
MaxxForce
11
11
MaxxForce
MaxxForce
13
13
Engine Differentiation -
Integration
MaxxForce
MaxxForce
15
15
Acteon
Acteon
3.0L
3.0L
Sprint 4.1L
Sprint 4.1L
MaxxForce
MaxxForce
7
7
Regional Haul 2008
Line Haul 2010
4
Quarter
2010
th |
 11
NYSE: NAV
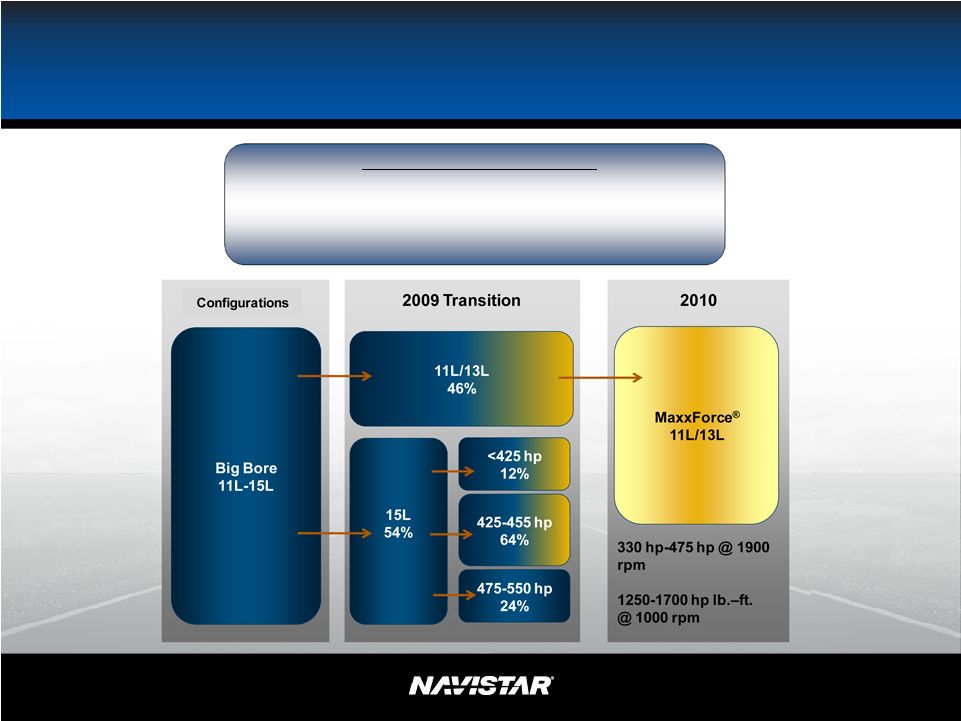
2010 U.S. and Canada Heavy Strategy
2010 and 2011 Strategy
•Convert
•Convert
customers to the 13L
•Drive customer –
pre/post buy |
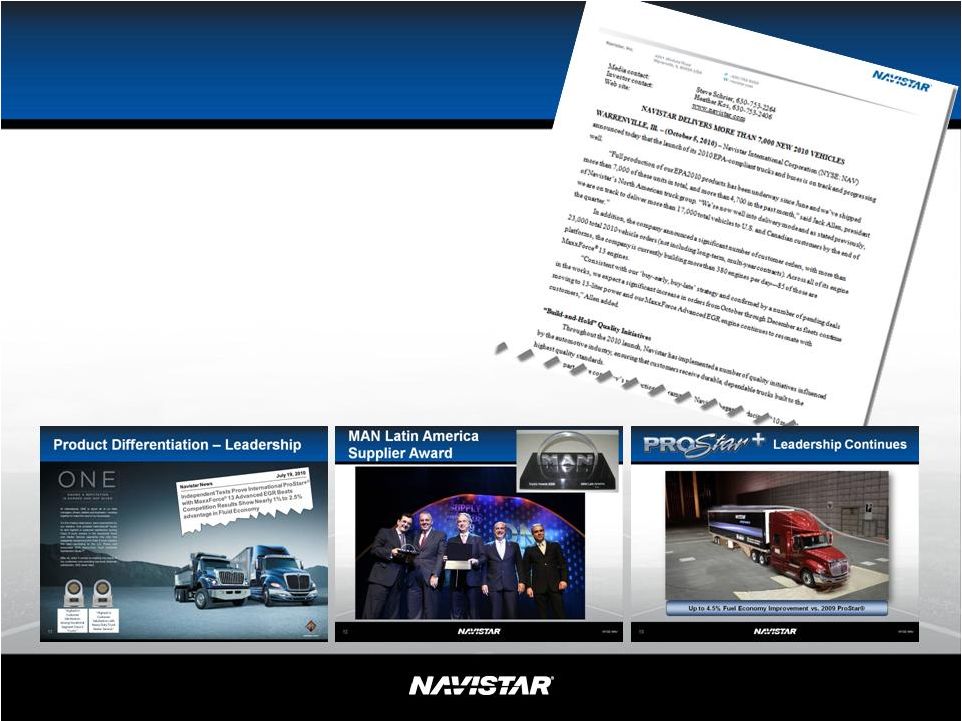 Product Leadership
•
Approximately 28,000
2010 orders
•
Shipments on track
12
NYSE: NAV |
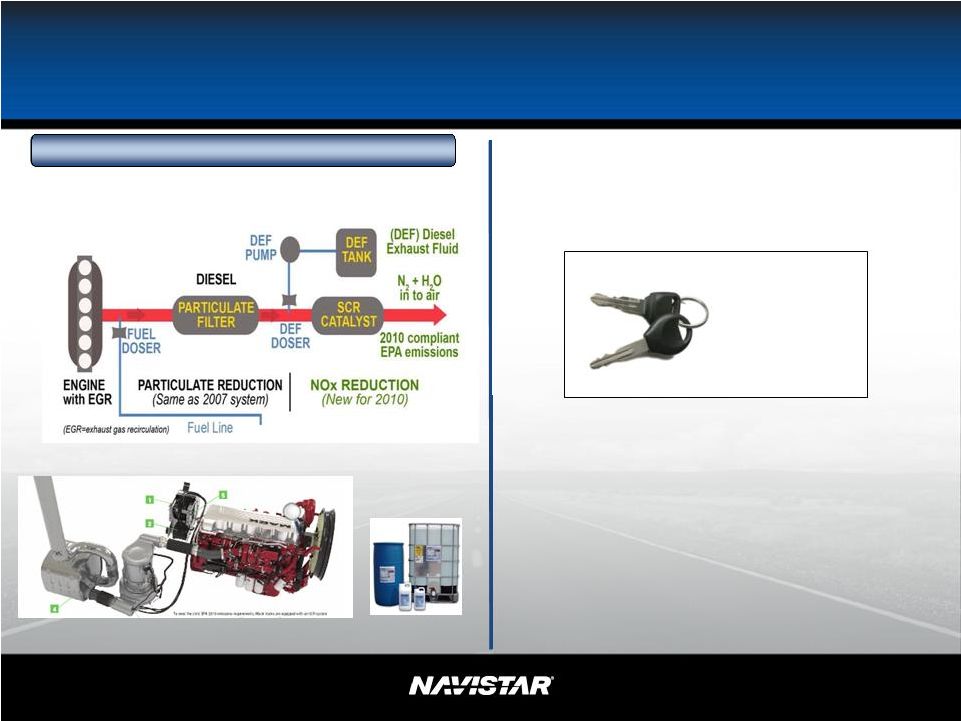 Navistar Differentiation –
LEADING
Ease for Customer
•
Easy for operators
•
Easy to understand
•
Easy to maintain
•
Dealer and customer friendly
Navistar’s enhanced EGR 2010 solution
The competitor’s 2010 urea-based solution
Nothing new
–
just turn the
key
Class 4/5
13
NYSE: NAV |
 14
NYSE: NAV
Conventional
Conventional with improved aero devices
On-off fans
Visco-electric fans
Smaller, higher performance engines
Fixed fans
Turbo-charging
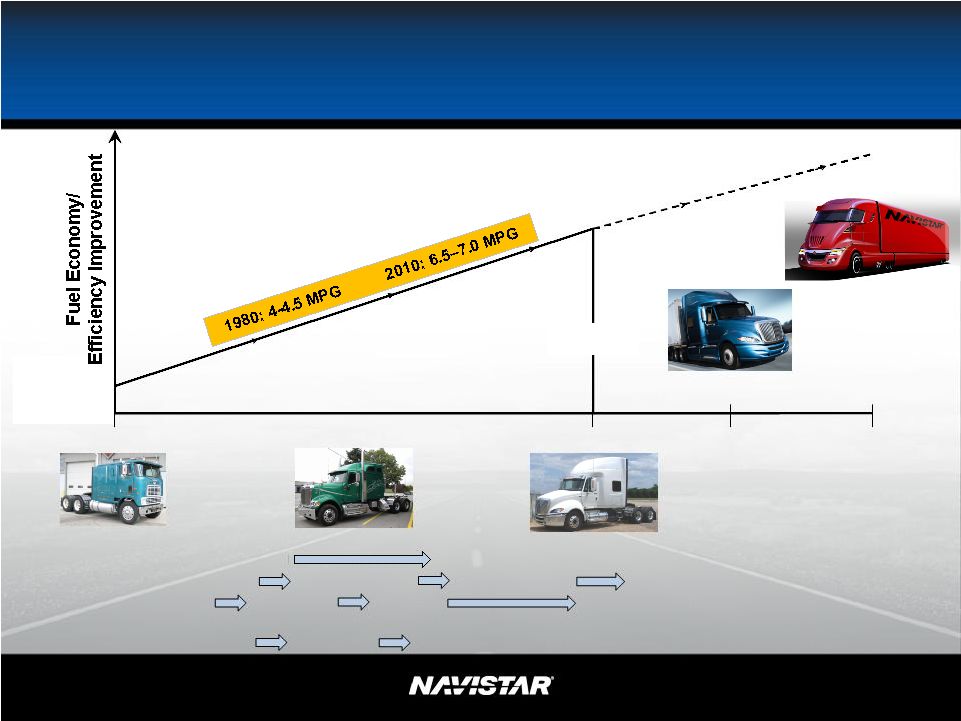
Evolutionary Path of Operational
Efficiency
1980’s
2010
2014
2017
Today
9670
ProStar
ProStar
with
Enhancements
SuperTruck
Biased ply with
tubes Tubeless
radials Gear fast/run slow, cruise control, automated manuals, etc.
Engines
Controls
Aerodynamics
Cooling
1990’s
9900i
Tires
Electronic Controls
Charged-air-Cooling
Viscous fans
Cab-Over-Engine |
 15
NYSE: NAV
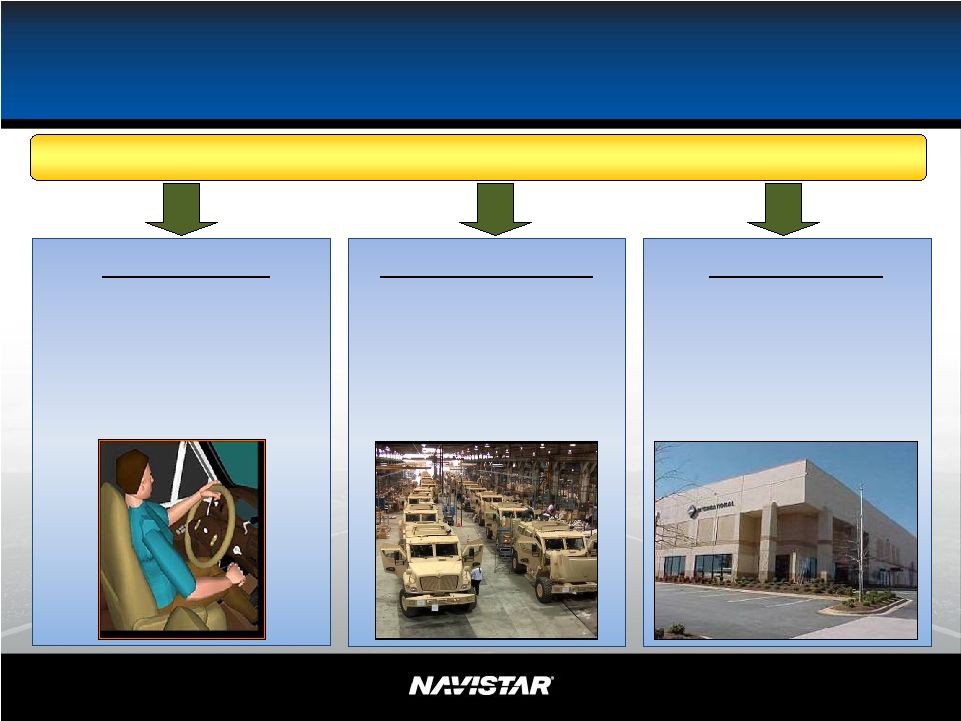
Military Differentiation –
Commercial Expertise
SUSTAINMENT
•
1,100 locations worldwide
•
80 plus locations in 70
countries
MANUFACTURING
•
Extremely flexible assembly
facilities to meet urgent
requirements
ENGINEERING
•
3,000 Engineers
•
Designed for assembly
•
Rapid response
•
Global resources/capabilities
–
Suppliers integrated into
design
ENABLERS FOR OUR SUCCESS
ENABLERS FOR OUR SUCCESS |
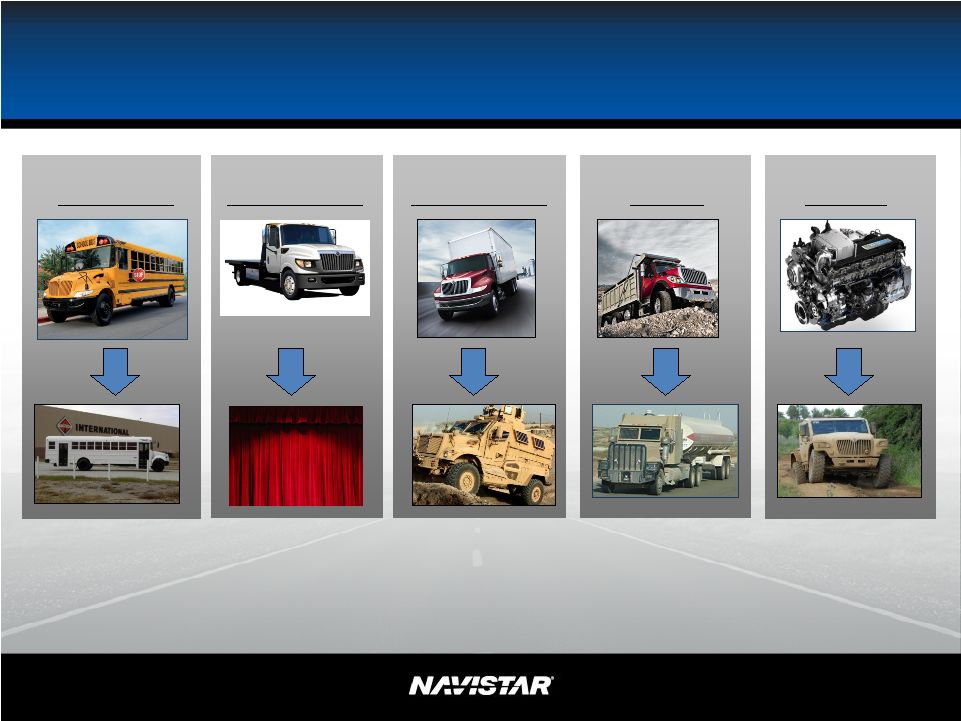 16
NYSE: NAV
School Bus
Class 6 and 7
Combined
Class 8
Engines
Class 4 and 5
Existing Platforms + Survivability Solutions = Success
Existing Platforms + Survivability Solutions = Success
Navistar Defense
Leveraging Platforms |
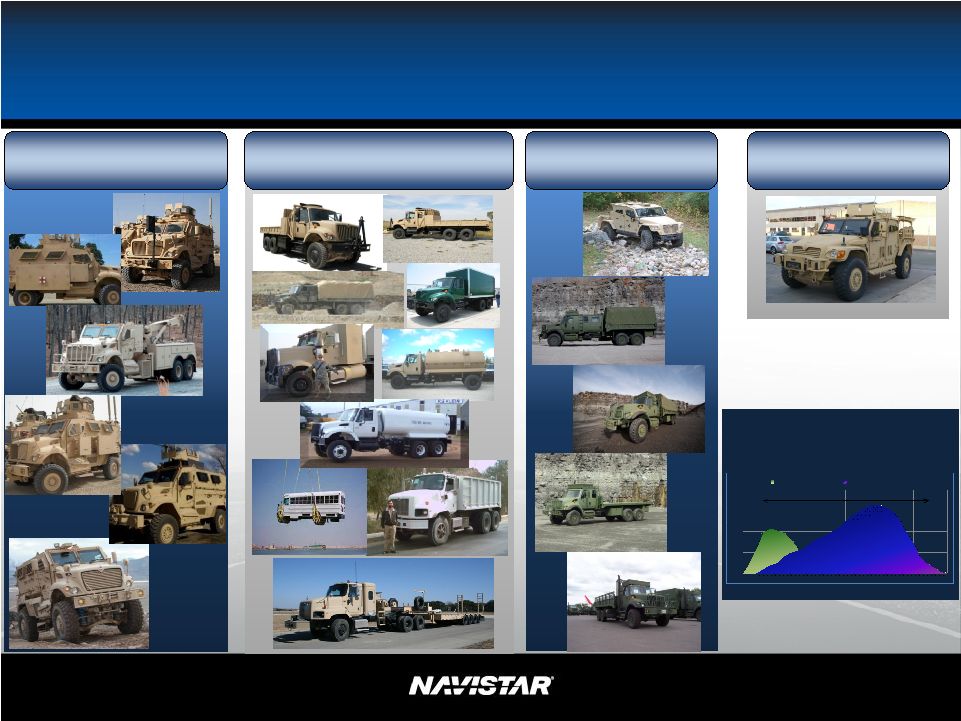
 17
NYSE: NAV
COTS
MilCOTS
True Tactical Vehicles
Field Service Reps
Integrated Logistics
Services
Parts Support Reset,
Refurbish, Repower
Independent
Suspension
Emergency
Egress Windows
MXT Limited Slip
Differential
Upgrade
Navistar Defense Business Model
“Leveraging what we have and what others have built.”
Leveraging what we have and what others have built.” |
  18
NYSE: NAV
Canada DND
TACOM
Navistar Defense Overview
Diversification and Global Expansion
U.K. MoD
DoD Program Cost
Distribution
Program Spend
Program Years
System Acquisition
Support and Sustainment
28%
72%
28%
72%
Life Cycle Cost
JPO
U.S. and Allies |
 19
NYSE: NAV
Next In
Rank
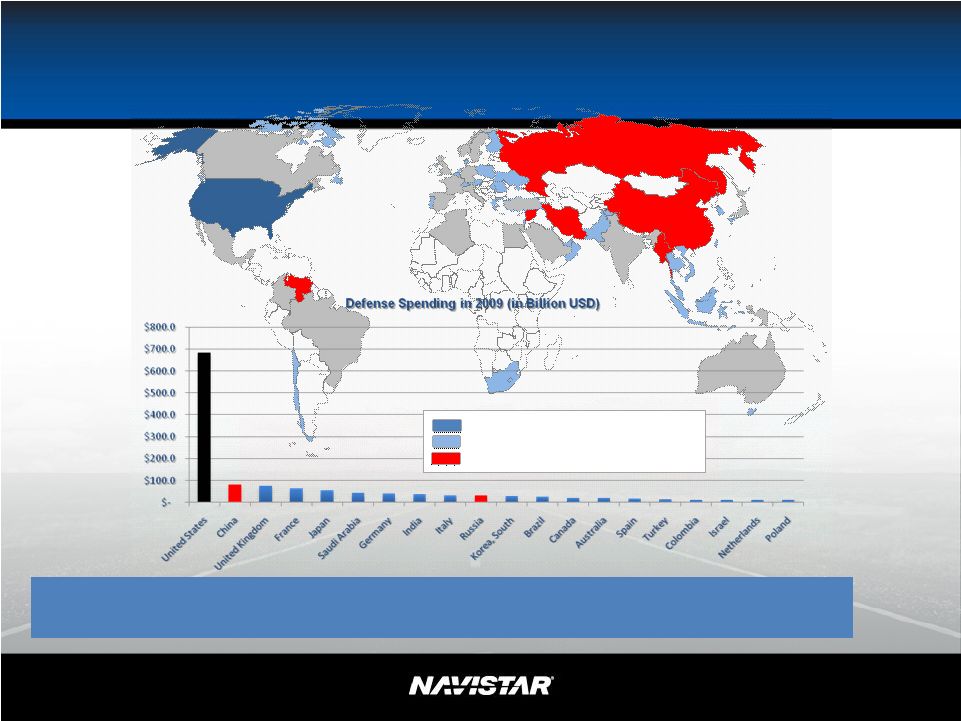
International Market
GLOBAL DEFENSE BUDGETS
Iran
Colombia
Israel
Netherlands
Poland
Taiwan
Greece
Singapore
United Arab
Emirates
Sweden
Norway
Pakistan
Egypt
Algeria
Belgium
Thailand
Switzerland
Oman
Chile
Denmark
50 Countries (Including US) Define 87% of the Global Defense Marketplace;
13 of top 15 Accessible to US Defense Companies
Copyright ©
Jane’s
Information Group Inc., 2010.
All rights reserved.
1.
China
2.
United Kingdom
3.
France
4.
Japan
5.
Saudi Arabia
6.
Germany
7.
India
8.
Italy
9.
Russia
10.
S. Korea
11.
Brazil
12.
Canada
13.
Australia
14.
Spain
15.
Turkey
Domestic US Markets
Accessible International Markets
Excluded International Markets
Top 15
Countries |
 20
NYSE: NAV
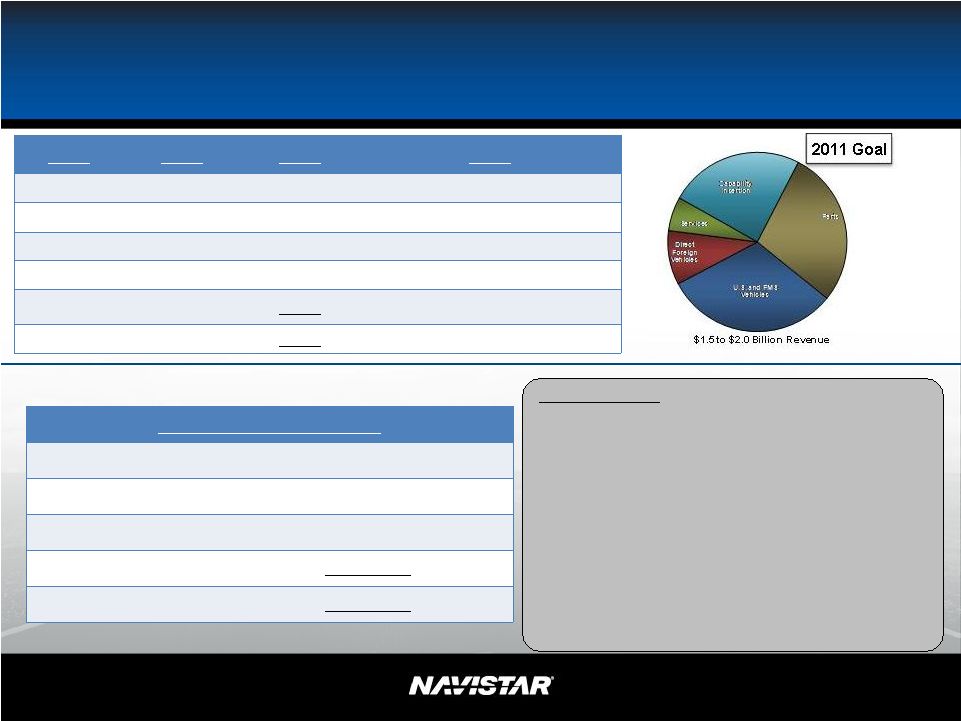
Navistar Defense
Sustainable Revenue
2008
2009
2010
2011
> $2B
> $2B
> $2B
$1.5-$2.0B
•
U.S. and FMS
$1.2B
Continue at lower rate (-)
•
Foreign Direct
$0.3B
U.K./Canada/26 countries (+/-)
•
Parts & Services
$0.5B
Continue w/more vehicles (+/-)
•
Capability Insertion
$0.1B
Increasing (+)
•
Total
$2.1B
Opportunity
•Tactical vehicles –
urgent need & new
variants
•Capability insertion –
rolling chassis &
upgrades
•Programs / products
—
HMMWV Recap
—
FHTV
—
JLTV
—
Tatra
•Program of record label
2011 Recurring Business
•
U.S. and FMS
$0.4 -
$0.5B
•
Foreign Direct
$0.2B
•
Parts & Services*
$0.5B
•
Capability Insertion
$0.2 -
$0.3B
Total
$1.3 -
$1.5B
*The Services portion of this business is recorded in the Truck segment revenues
|
 21
NYSE: NAV
•
Moving from focused facilities to
flexible manufacturing to maximize
logistics cost
•
School bus: All assembly in Tulsa
•
Huntsville –
ability to produce
V8/I6/DT engines on same line
What’s next?
Engineering consolidation
Competitive Cost Structure |
 22
NYSE: NAV
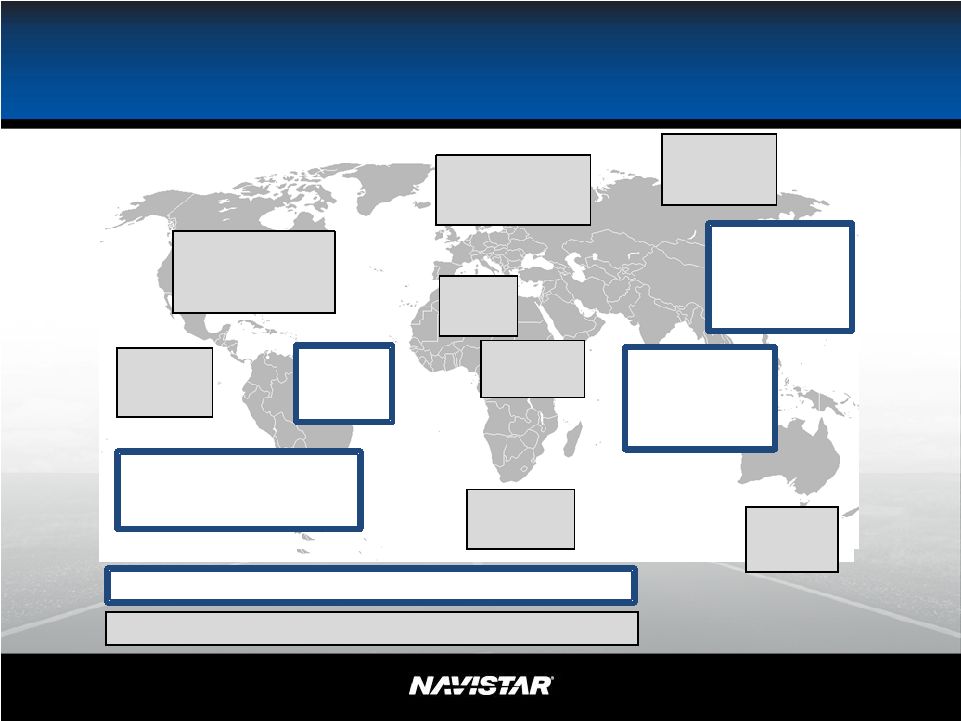
Global Truck Market Demand &
Near Term Opportunities
North America
(U.S. and Canada)
2008: 389K
2015: 485K
China
2008: 754K
2015: 1.2M
India
2008: 229K
2015: 361K
Western Europe
2008: 341K
2015: 366K
Mercosur
2008: 138K
2015: 158K
Latin America
(Other)
2008: 39K
2015: 40K
Mexico
2008: 36K
2015: 34K
Russia
2008: 136K
2015: 193K
Australia
2008: 25K
2015: 29K
South Africa
2008: 22K
2015: 24K
Middle East
2008: 87K
2015: 105K
Turkey
2008: 21K
2015: 41K
Significant Future
Growth Opportunities, High GDP Growth
Sustaining
Markets,
Modest
Growth
Areas,
Lower
GDP
Growth |
 23
NYSE: NAV
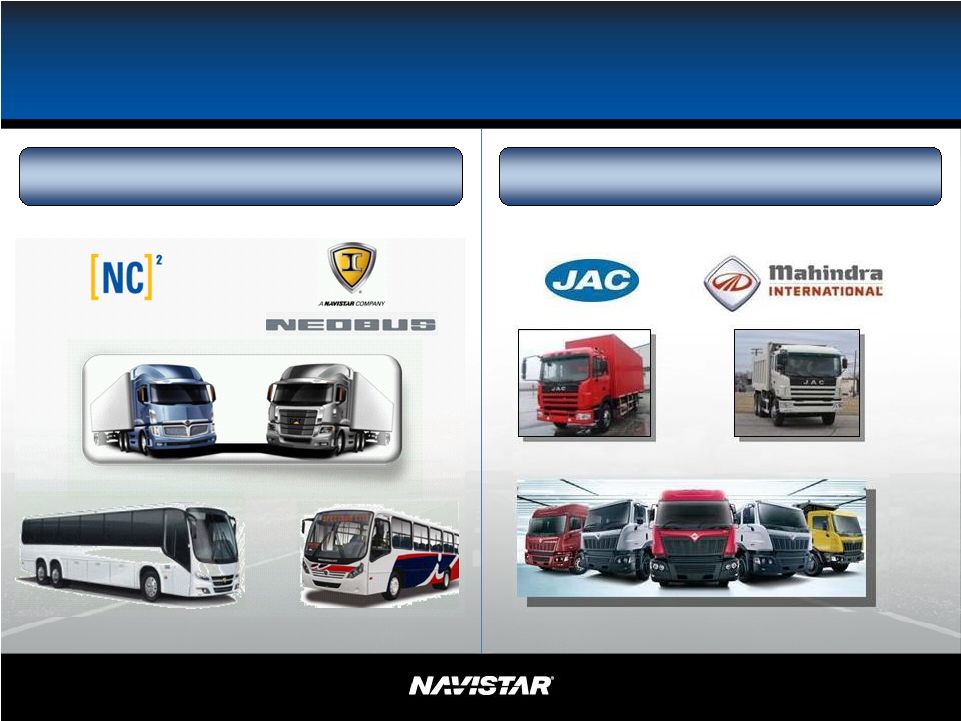
Access to Global Markets
NC
2
& IC Bus Growth
China & India Joint Ventures
JAC JV pending government approval
Neobus
is currently in concept stage |
 NYSE:
NAV 24
Global Truck Operations
2010
Profitable
Exports and
Investing
2011
Expanded Exports
and Continuing
Investment
2012
Growth and
Profitability
2015
Global
Vision |
 NYSE:
NAV Parts Segment |
 26
NYSE: NAV
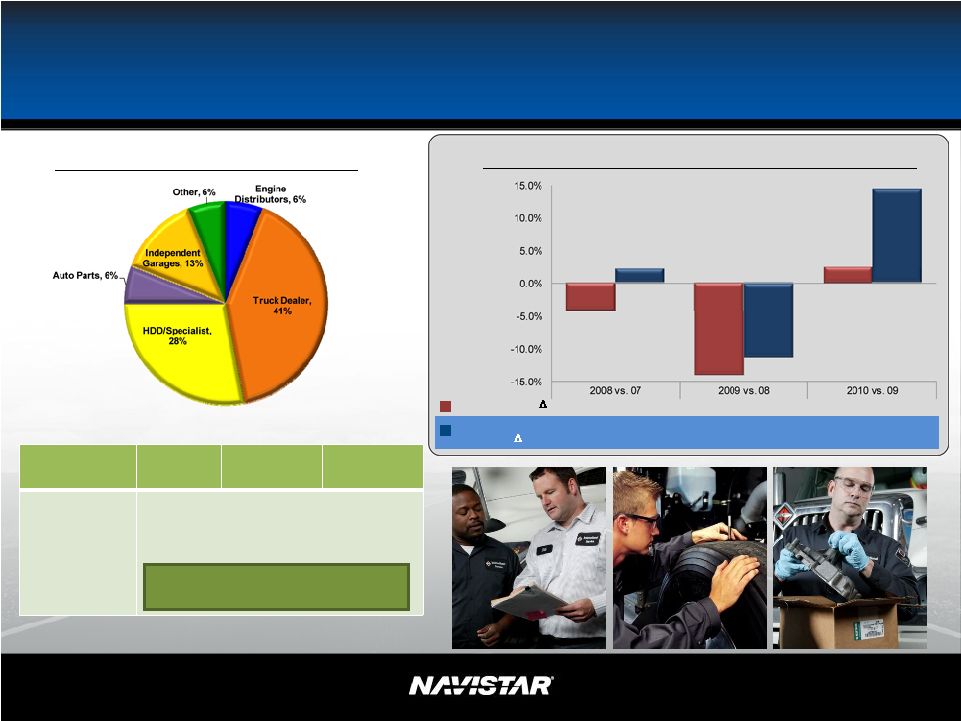
Parts Business –
Gaining Market Share
Approx. $14B U.S. Retail Market
2010
2011
2012
2013+
Year over year
3% commercial
margin
percentage
increase
Realize benefits of Truck and Engine
Strategy
Parts Segment: Double digit top
line growth with excellent return
on assets
Market Size: Navistar vs. Overall Parts Market
YOY Change %
Total Industry
-4.3%
-13.9%
2.5%
Navistar U.S.
Net Sales
2.2%
-11.2%
14.4% |
 27
NYSE: NAV
Parts Business
Grow with Truck and Engine
•
MaxxForce
®
11L/13L/15L
($400-500M
revenue at maturity)
•
OEM engine growth
(150,000-200,000 units
by end of 2013)
•
Global truck
(100,000 units by end of 2013)
•
Market share growth in core business |
 28
NYSE: NAV
2007 Product Offerings
2011 Product Offerings
Well Positioned for Future
NGV Platform
Purchased Engines
NGV Platform
4.8L
7.2L
9.3L
Global Powertrain |
 29
NYSE: NAV
Navistar Well Positioned for
Industry Recovery
Note:
This
is
not
meant
for
updated
guidance,
it
is
for
illustrative
purposes
only.
This
slide
contains
non-GAAP
information,
please
see
the
Reg
G
in
appendix
for
detailed
reconciliation.
FY2009
Actual
3Q2010
R&D
$433M
$338M
$(10.00)
$(5.00)
$-
$5.00
$10.00
$15.00
$20.00
150
200
250
300
350
400
450
500
Traditional Industry Volume (Thousands of Units)
2010
Guidance
Midpoint
Original $1.6B Segment
Profit Goal@ 415k
units
$1.8B Segment Profit
Goal
@ 350k
units***
2008
Actual*
2009
Actual**
Notes:
* 2008 excludes Impairment
** 2009 excludes Ford and 1-time items
*** Assumes attainment of mature global growth by end of calendar year
2013 |
 30
NYSE: NAV
Frequently Asked Questions
Q1:
What should we assume for capital expenditures in 2010?
A:
For
2010,
excluding
our
NFC
and
Dealcor
acquisition
of
vehicles
for
leasing,
we
expect
our
capital
expenditures to be at our normal $250 million to $350 million range. We continue to
fund our strategic programs.
Q2:
What is in your Dealcor
debt?
A:
Dealcor
debt is comprised of wholesale (floor plan) financing and also retail financing on
lease and rental fleets for company owned dealers.
Q3:
How many Dealcor
dealers did you have as of July 31, 2010?
A:
Of
our
278
primary
NAFTA
dealers,
we
have
ownership
interest
in
11
DealCor
dealers
as
of
September
30,
2010.
We
expect
to
further
reduce
our
number
of
Dealcor
dealers
before
calendar year end.
Q4:
When is the next refinancing due at NFC?
A:
Our TRAC facility, which funds fleets and national accounts, matures in January of
2011. Q5:
Are there any requirements for NFC leverage?
A:
NFC is compliant with our revolver leverage covenant of 6 to 1. This ratio
calculation excludes qualified retail and lease securitization debt.
|
 31
NYSE: NAV
Frequently Asked Questions
Q6:
How do you fund your wholesale business?
A:
We primarily finance our wholesale portfolio in traditional private or public
securitizations, and through our bank facility.
Q7:
How are your dealers doing?
A:
We think our dealers, which have always been one of our strengths, are well
positioned. We traditionally have not had any significant dealer
losses and expect that trend to continue in the future. Q8:
What kind of rates do you charge your dealers and customers?
A:
Generally, our rates vary (those with higher credit risk have always had to pay
higher interest rates) and are usually in line with the market.
Q9:
How is your NFC portfolio performing?
A:
NFC portfolio performance is improving, which has resulted in a lower provision for
losses.
Repossessions, past due accounts and losses peaked in 2008 and have continued to
show improvement, with considerable improvement lately.
Q10:
What is your total amount of capacity at NFC?
A:
Total availability in our funding facilities is more than $750 million as of July
31, 2010. Q11:
What is the status of the retail financing alliance with GE Capital in the United
States? A:
Navistar
Capital
–
the
alliance
we
formed
with
GE
Capital
to
support
the
sale
of
Navistar
products
–
is
off to a great start and progressing consistent with expectations.
|
 32
NYSE: NAV
Frequently Asked Questions
Q12:
Why have NFC’s wholesale receivables and debt moved onto the balance sheet?
A:
NFC amended its wholesale securitization trust to allow NFC some control over receivables
transferred to the trust, which is a variable interest entity of which NFC is the primary
beneficiary. Under current accounting rules, the amendment requires NFC to consolidate
the assets and liabilities of the wholesale securitization trust onto the balance sheet.
Q13:
What is the current Joint Light Tactical Vehicle (JLTV) program status?
A:
As part of the Technology Development (TD) phase, Navistar and BAE delivered right-hand drive
prototypes to Australia on June 21 following delivery of prototypes to the U.S. in May.
A:
At this time, we stand ready to support any needs from the military should they choose to retrofit the
remainder of the MaxxPro fleet with DXM™ independent suspension. Navistar has
produced 1,130 MaxxPro Dash units with DXM independent suspension and will retrofit another
1,222 Dash units in theater with the capability.
Q15:
What are your margins for military vehicles?
A:
We do not break margins out specific to our military vehicles. These numbers are reported as part of
our Truck Group financials.
Q16:
What funding is available in the DoD FY 2011 budget for the MRAP program?
A:
Funding has not yet been approved, but a proposed budget includes $3.4B for the MRAP program. In
the past, the MRAP program has been financed with supplemental war funding.
Q14:
What
is
the
status
of
any
MaxxPro®
Dash
rolling
chassis
orders? |
 33
NYSE: NAV
Frequently Asked Questions
Q17:
What
will
Navistar
do
to
meet
the
0.2
NOx
emissions
when
its
credits
are
depleted?
A:
Navistar remains committed to its strategy of providing solutions that let
customers focus on their business, not emissions regulations.
Solutions under development are multi-pronged and include our
prime
path
of
in-cylinder
solutions
along
with
application-specific
solutions
such
as
the
Amminex
metal
ammine-based NOx
reductant
delivery system which Navistar announced in December 2009.
Q18:
What are the 2010 emissions requirements?
A:
The
rules
allow
manufacturers
to
go
to
0.5
NOx
if
they
cleaned
up
the
environment
earlier
with
advanced
technology;
manufacturers
need
to
be
at
0.2
NOx
if
they
chose
not
to
introduce
advanced
technologies earlier.
Q19:
Why do parts margins fluctuate year to year?
A:
In 2009 and 2008 the Parts business benefitted from substantial fielding orders to
support the MRAP launch in the field with higher margins than the commercial
business. In 2009 the Military business
was
38%
percent
of
the
total
Parts
Revenue.
We
expect
2010
to
be
down
to
17%
of
the
total
with
margins closer to commercial as more of the military business was in lower margin
sustainment orders.
Our commercial business is performing well with 14% top line sales growth and
improving ROS % from cost reductions and
leveraging SG&A. |
 34
NYSE: NAV
Frequently Asked Questions
Q20:
How much net operating losses remain, and why is there still a valuation allowance
against deferred tax assets?
A:
The Company has approximately $288 million of U.S. federal net operating losses
available as of October 31, 2009 to offset future taxable income.
Applying a federal tax rate of 35%, these losses have an undiscounted cash
value of $101 million. In addition, the value of our state and foreign NOLs
are $82 million and $102 million, respectively, for a total value of
tax-effected, undiscounted cash of $285 million. (The difference
from the reported balance is attributed to stock option accounting.) A
substantial portion of these NOL assets are subject to a valuation allowance. In addition to the
deferred tax assets attributable to the NOLs, we have other deferred tax assets
arising from temporary book-tax differences subject to a valuation
allowance of $1.7 billion, for a total balance of deferred tax assets
subject to a valuation allowance of $2 billion. Under U.S. GAAP rules, when the Company is
able to demonstrate sufficient earnings (both historically and in the future) to
absorb these future deductions, the Company would release its valuation
allowances. Based on evidence to date, we believe it is reasonably possible
that the Company may release all or a portion of its U.S. valuation
allowance in the next twelve months. When the full valuation allowance is
released, $72 million would favorably impact shareowner’s equity and the
balance would favorably impact net income. |
 35
NYSE: NAV
Frequently Asked Questions
Q21: How has recent tax legislation affected Navistar?
A:
The Worker, Homeownership, and Business Assistance Act of 2009 provides an opportunity to carry
back alternative minimum tax net operating losses from the Company’s 2010 fiscal year and to
receive a refund of alternative minimum tax payments made in the prior five fiscal years.
The Company intends to take advantage of this opportunity to the fullest extent allowable by
law. Other recent international legislation would not have a material impact on our financial statements in
the near term, due to the fact that we currently have a full valuation allowance against our
U.S. deferred tax assets and are still utilizing U.S. net operating losses. We
continually monitor legislative changes to address adverse tax implications that may occur in
the future. Q22: What makes up our consolidated tax expense?
A:
Our pre-tax operating profits reflect our worldwide operations; similarly our consolidated tax
expense reflects the impact of differing tax positions throughout the world. In general, we
currently have full valuation allowances against the deferred tax assets of our U.S. and
Canadian operations. Consequently, our tax expense in those jurisdictions is generally
limited to current state or local taxes and the impact of alternative minimum taxes. Our
Brazilian and Mexican operations are profitable and as a result we accrue taxes in those
jurisdictions. This combination of factors causes our overall consolidated effective tax
rate to be fairly low. |
 36
NYSE: NAV
Frequently Asked Questions
Q23:
Your tax footnote in the 10K discloses gross deferred tax assets of $2.2 billion. How will
those assets be used to offset future taxable income?
A:
Simply put, deferred tax assets represent the value of future tax deductions attributable to items
that have already been expensed or deducted for book purposes. The most commonly
understood component of deferred tax assets is the value of our net operating losses, which
will serve to reduce taxable income in the future. In addition, we have several other
major components of deferred taxes which will reduce taxable income in the future. For
example, the Company has accrued significant OPEB, pension and other employee benefit expenses
during prior years based on expected payments to be made in the future. As these payments
are made, the Company will realize tax deductions to the extent of its future taxable income. Q24: What causes the variance between manufacturing cash interest payments and GAAP
interest expense?
A:
The main variance between cash and GAAP interest results from the recent issuance of new manufacturing
debt. In October 2009, we issued $1 billion of senior unsecured high yield notes and $570
million of senior subordinated convertible notes. As a result of this issuance, future
manufacturing interest expense will be higher than cash interest payments due to the
amortization of debt issuance costs which are amortized over the life of each note ($36
million), amortization of the original issue discount of the high yield notes ($37 million) and
amortization of the embedded call option in the convertible notes ($114 million). In FY 2010, this
variance will be much larger due to the timing of interest payments on the high yield notes.
Interest payment dates are in May and November starting in May 2010. Therefore, we will
only have one cash payment this fiscal year even though expense will show the full year
amount. As a result of this and other non-cash interest expense, FY 2010 may show a
variance of approximately $66 million between cash and GAAP interest. |
 37
NYSE: NAV
Frequently Asked Questions
Q25:
What are the $225 million of Recovery Zone Facility Revenue Bonds (RZB) Series 2010 due
October 15, 2040 being used for?
A:
We are using the proceeds to invest in our product development strategy. Great products are a key
pillar of our three pronged strategy. Streamlining and improving our product development
processes will continue to provide competitive advantages for us in the marketplace. The
funding from RZFB will allow us to consolidate many facilities into a new facility and make
necessary renovations to that facility. Additionally we will invest in an existing
facility, which includes investments in equipment and technology that will help us create and
improve our product development process and thus shareholder value.
Q26:
Why did you use RZB financing?
A:
The recovery zone facility bonds are a cost effective, long-term form of capital that is
complementary to our capital structure. The bonds have a 30 year maturity and a fixed rate
coupon of 6.50% per annum. They are callable at par any time after 10 years (October 15,
2020). Issuing bonds in the tax-exempt market gave us exposure to a new source of
investors that we wouldn’t otherwise have access to if not for the Recovery Zone Facility
Bond program. |
 38
NYSE: NAV
Frequently Asked Questions
Q27:
What are the benefits of an integrated product development organization?
A:
Great Products is one of the three pillars of our strategy.
Product development is therefore a
foundation of our strategy.
We believe that by consolidating our Truck and Engine product
development organizations we will leverage the capabilities of both organizations
and obtain benefits and cost savings that would not be possible by
maintaining separate Truck and Engine development groups.
We believe those benefits/savings will come in several areas including:
Engineering
–
improved Truck and Engine engineering collaboration will produce better product
designs resulting in
enhanced materials savings and faster time to market
Quality
–
centralizing the quality function with a singular focus will improve
end-to-end accountability and result in lower warranty costs
Customer
Service
–
consolidating
disparate
customer
service
functions
and
field
and
technical
services
will improve the customer experience and reduce repair time
Purchasing
–
Consolidating the Truck, Engine and Parts procurement will improve collaboration
and reduce transactional activity
Beyond the benefits of an integrated product development organization, we believe
the HQ consolidation will also result in
benefits and cost savings in:
Human
Resources
–
consolidating
HR
activity
around
core
service
offerings
such
as
compensation
&
benefits, talent management and strategic services will build global and M&A
competencies to support future growth
Finance
–
centralizing core functions and shifting transactional activities to shared or
outsourced services will improve finance efficiencies
|
 39
NYSE: NAV
SEC Regulation G |
 40
NYSE: NAV
SEC Regulation G –
Fiscal Year Comparison
Future
2009
U.S. and Canada Industry
414,500
350,000
($billions)
Sales and revenues, net
$ 15 +
$ 20 +
($millions)
Manufacturing segment profit*
$ 1,600
Below the line items
Income excluding income tax
Income tax expense
(298)
Net Income attributable to Navistar International Corporation (NIC)
Diluted earnings per share ($'s) attributable to NIC
$12.31
Weighted average shares outstanding: diluted (millions)
Original Target
@ 414.5k Industry
Revised Target
@ 350k Industry
$ 1,780
(590)
~ 72.5
$892
~ 72.5
(500)
1,100
(275)
$825
$11.46
1,190
Manufacturing Segment Profit is not in accordance with, or an alternative for, U.S. generally accepted
accounting principles (GAAP). The non-GAAP financial information presented herein should be
considered supplemental to, and not as a substitute for, or superior to, financial measures calculated in accordance with GAAP. However, we believe that non-GAAP reporting,
giving effect to the adjustments shown in the reconciliation above, provides meaningful information
and therefore we use it to supplement our GAAP reporting by identifying items that may not be
related to the core manufacturing business. Management often uses this information to assess and measure the performance of our operating segments. We have chosen to
provide this supplemental information to investors, analysts and other interested parties to enable
them to perform additional analyses of operating results, to illustrate the results of
operations giving effect to the non-GAAP adjustments shown in the above reconciliations and to
provide an additional measure of performance. |
 41
NYSE: NAV
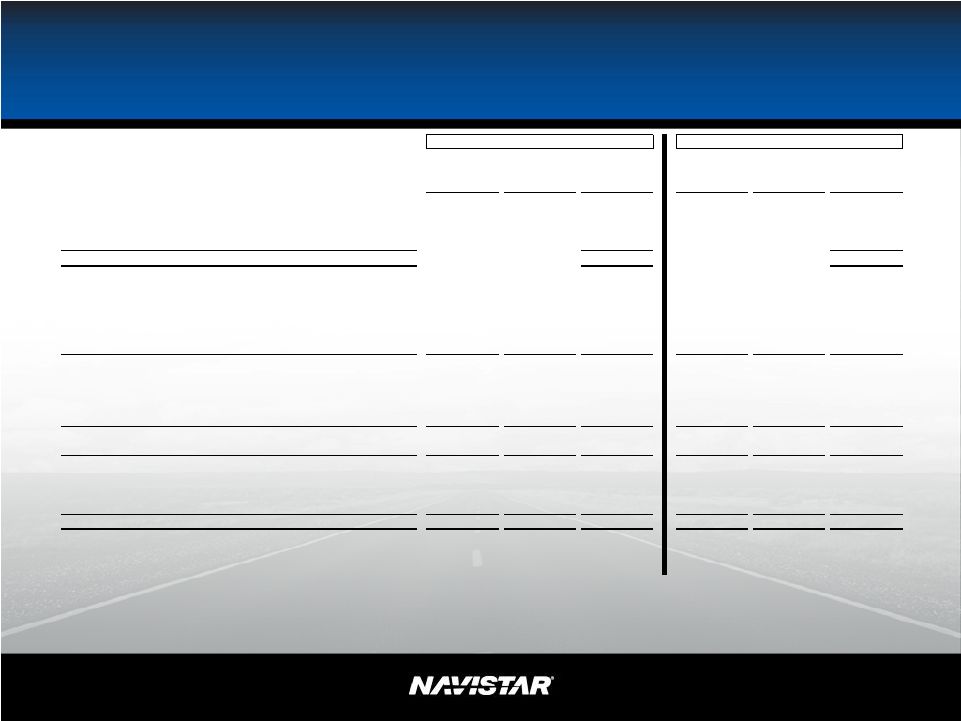
SEC Regulation G –
Fiscal Year Comparison
2009
2008
Non GAAP
Non GAAP
As Reported
Non GAAP
Non GAAP
As Reported
Without
Impacts
Impacts
With Impacts
Without
Impacts
Impacts
With Impacts
U.S. and Canada Industry
181,800
244,100
($billions)
Sales and revenues, net
11.6
$
14.7
$
($millions)
Manufacturing segment profit
(excluding items listed below)
707
$
-
$
707
$
1,088
$
-
$
1,088
$
Ford settlement net of related charges
160
160
(37)
(37)
Impairment of property, plant and equipment
(31)
(31)
(358)
(358)
Manufacturing segment profit
707
129
836
1,088
(395)
693
Below the line items
(excluding items listed below)
(468)
(468)
(502)
(502)
Write-off of debt issuance cost
(11)
(11)
-
Below the line items
(468)
(11)
(479)
(502)
-
(502)
Income (loss) excluding income tax
239
118
357
586
(395)
191
Income tax benefit (expense)
(34)
(3)
(37)
(58)
1
(57)
Net Income (loss)
205
$
115
$
320
$
528
$
(394)
$
134
$
Diluted earnings (loss) per share ($'s)
2.86
$
1.60
$
4.46
$
7.21
$
(5.39)
$
1.82
$
Weighted average shares outstanding: diluted (millions)
71.8
71.8
73.2
73.2
This presentation is not in accordance with, or an alternative for, U.S. generally accepted
accounting principles (GAAP). The non-GAAP financial information presented herein should be considered
supplemental to, and not as a substitute for, or superior to, financial measures calculated in
accordance with GAAP. However, we believe that non-GAAP reporting, giving effect to the adjustments shown in
the reconciliation above, provides meaningful information and therefore we use it to supplement our
GAAP reporting by identifying items that may not be related to the core manufacturing business.
Management often uses this information to assess and measure the performance of our operating segments.
We have chosen to provide this supplemental information to investors, analysts and other
interested parties to enable them to perform additional analyses of operating results, to illustrate
the results of operations giving effect to the non-GAAP adjustments shown in the above reconciliations and to
provide an additional measure of performance. |
 42
NYSE: NAV
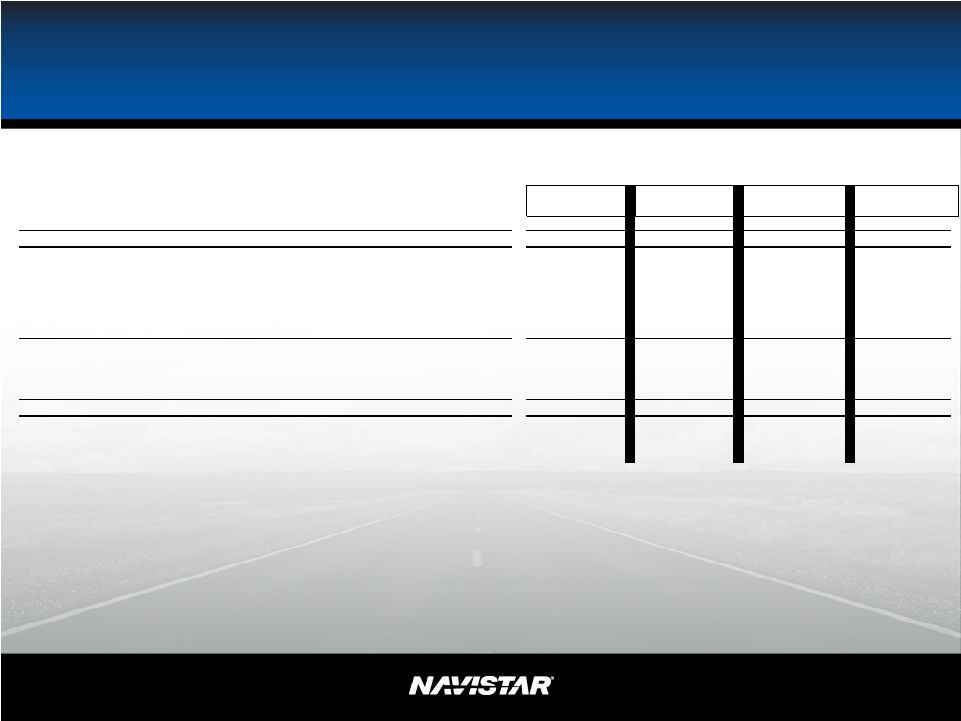
SEC Regulation G –
Quarterly Comparison
This presentation is not in accordance with, or an alternative for, U.S. generally
accepted accounting principles (GAAP). The non-GAAP financial information presented herein should be
considered supplemental to, and not as a substitute for, or superior to, financial measures calculated
in accordance with GAAP. However, we believe that non-GAAP reporting, giving effect to
the adjustments shown in the reconciliation above, provides meaningful information and therefore we use it to supplement our GAAP reporting by identifying items that may not be related
to the core manufacturing business. Management often uses this information to assess and measure
the performance of our operating segments. We have chosen to provide this supplemental
information to investors, analysts and other interested parties to enable them to perform additional analyses of operating results, to illustrate the results of operations giving
effect to the non-GAAP adjustments shown in the above reconciliations and to provide an additional
measure of performance. 2010 Q3
2009 Q3
2010 Nine Months
2009 Nine Months
As Reported
As Reported
As Reported
As Reported
Sales and revenues, net
3.2
$
2.5
$
8.8
$
8.3
$
($ millions)
Manufacturing segment profit
278
110
595
604
Below the line items
(122)
(92)
(394)
(338)
Income (loss) excluding income tax
156
18
201
266
Income tax benefit (expense)
(19)
(30)
(17)
(32)
Net
Income
(loss)
attributable
to
navistar
International
Corporation
137
$
(12)
$
184
$
234
$
Diluted
earnings
(loss)
per
share
($'s)
attributable
to
Navistar
International
Corporation
1.83
$
(0.16)
$
2.51
$
3.27
$
Weighted average shares outstanding: diluted
(millions) 74.3
70.8
73.1
71.7
Note: In the third quarter 2010, related to the ratification of a new collective
bargaining agreement at ICC, we incurred $10 million of restructuring benefits offset by $6 million
of charges in costs of products sold for supplemental unemployment and healthcare
benefits. |