Attached files
| file | filename |
|---|---|
| 8-K - FORM 8-K - VALLEY NATIONAL BANCORP | d8k.htm |
 ©
2010 Valley National Bank. Member FDIC. Equal Opportunity Lender.
Investor Presentation
EXHIBIT 99.1 |
 ©
2010 Valley National Bank. Member FDIC. Equal Opportunity Lender.
2
Information For Investors And Shareholders
This presentation contains forward-looking statements concerning Valley’s future
business outlook, financial condition and operating results. Readers are advised not to
place undue reliance on these forward-looking statements as they are influenced by
certain risk factors and unpredictable events. The foregoing contains
forward-looking statements within the meaning of the Private Securities Litigation
Reform Act of 1995. Such statements are not historical facts and include expressions about
management’s confidence and strategies and management’s expectations about new and
existing programs and products, relationships, opportunities, taxation, technology and
market conditions. These
statements
may
be
identified
by
such
forward-looking
terminology
as
“will,”
“may,”
“expect,”
“believe,”
“view,”
“opportunity,”
“should,”
“allow,”
“continues,”
“reflects,”
“typically,”
“usually,”
“anticipate,”
or similar statements or variations of such terms. Such forward-looking statements
involve certain risks and uncertainties. Actual results may differ materially from such
forward-looking statements. Factors that may cause actual results to differ
materially from those contemplated by such
forward-looking
statements
include,
but
are
not
limited
to
those
factors
disclosed
in
Valley’s
Current Report on Form 8-K filed on October 21, 2010, Quarterly Report on Form 10-Q
for the quarter ended June 30, 2010 and our Annual Report on Form 10-K for the year
ended December 31, 2009.
Valley disclaims any obligation to update or revise forward-looking statements for any
reason. |
 ©
2010 Valley National Bank. Member FDIC. Equal Opportunity Lender.
3
Valley National Bank Today
About Valley
Regional Bank Holding Company
Approximately $14.1 Billion in
Assets
Headquartered in Wayne, New
Jersey
37
th
Largest United States
Chartered
Commercial Bank
Largest Commercial Bank
Headquartered in New Jersey
Operates 200 Branches in 135
Communities Serving 14 counties
throughout Northern and Central
New Jersey, Manhattan, Brooklyn
and Queens
Traded on the NYSE (VLY)
Significant Attributes
Consistent Shareholder Returns
Focus on Credit Quality
Conservative Strategies
Affluent and Heavily Populated
Footprint
Strong Customer Service
Experienced Senior and Executive
Management |
 ©
2010 Valley National Bank. Member FDIC. Equal Opportunity Lender.
4
Management Approach
Large percentage of retail ownership
Long-term investment approach
Focus on cash and stock dividends
Large insider ownership, family members, retired
employees and retired directors
Market Cap of $2.1 Billion
Approximately 233 institutional holders
36.57% of total outstanding shares
Source: Bloomberg as of 10/24/10
Large Bank that Operates and Feels Like a Small Closely Held Company
|
 ©
2010 Valley National Bank. Member FDIC. Equal Opportunity Lender.
5
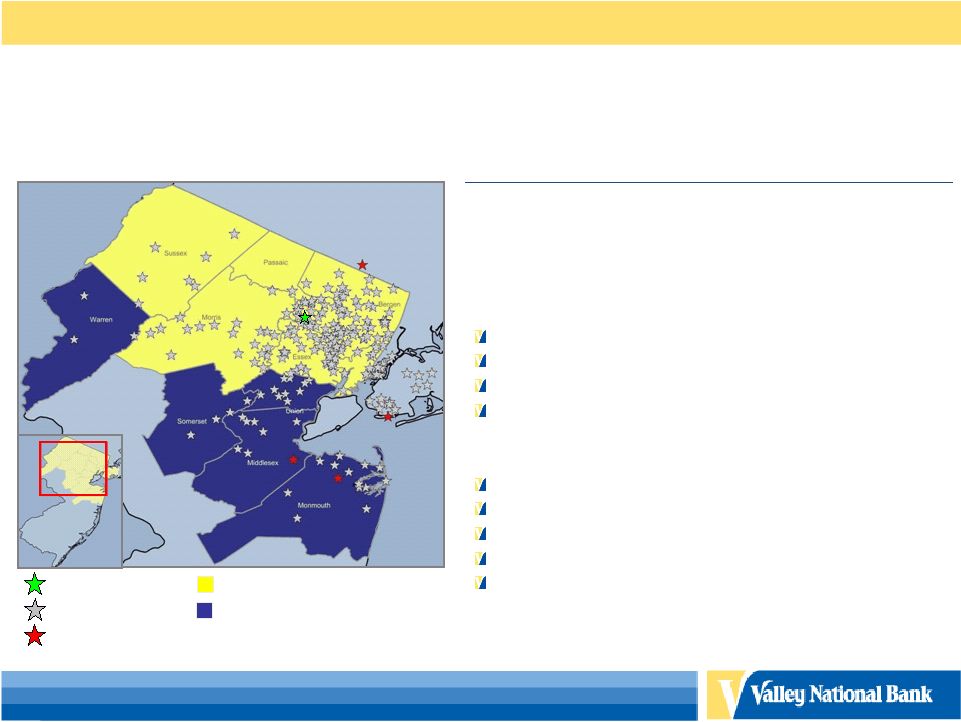
Footprint & Demographics
Valley’s Emerging NJ Market
Valley’s Core NJ Market
Branches Under Construction
Current Branches
Valley’s Core New Jersey Market
Total
Market
Deposits
-
$106.9
billion
Market Average Deposits per Branch $76.0 million
Valley
Branches
–
133
Valley’s
Market
Share
–
6.63%
Valley’s Emerging New Jersey Market
Total
Market
Deposits
-
$64.3
billion
Market Average Deposits per Branch $68.2 million
Existing
Valley
Branches
–
38
Branches
Under
Construction
–
3
Valley’s
Market
Share
–
1.59%
Headquarters
Region
Population
Median HH
Income
Total Market
Deposits
Valley’s NJ Marketplace
5.9 million
$78,074
$171 billion
Balance of NJ Marketplace
2.9 million
$61,436
$74 billion
NJ Total
8.8 million
$73,077
$245 billion
Valley’s NJ Marketplace
Demographic Data from SNL Financial Inc. as of 6/2009 Valley Branch data as of
6/30/2010 |
 ©
2010 Valley National Bank. Member FDIC. Equal Opportunity Lender.
6
Footprint & Demographics
Valley’s Emerging Manhattan Market
Total Market Deposits -
$418.3 billion
Market Average Deposits per Branch $621.6 million
Existing Valley Branches –
16
Valley’s Market Share –
0.28%
Valley’s Emerging Queens Market
Total Market Deposits -
$41.3 billion
Market Average Deposits per Branch $96.3 million
Existing Valley Branches –
5
Valley’s Market Share –
0.17%
Valley’s Emerging Brooklyn/Kings Market
Total Market Deposits -
$34.1 billion
Market Average Deposits per Branch $99.6 million
Existing Valley Branches –
8
Branches Under Construction -
1
Valley’s Market Share –
0.58%
Region
Population
Median HH
Income
Total Market
Deposits
Valley’s NY Marketplace
6.5 million
$57,864
$493 billion
Balance of NY Marketplace
13.0 million
$52,640
$288 billion
NY Total
19.5 million
$52,893
$781 billion
Valley’s Emerging NYC Markets
Branches Under Construction
Current Branches
Valley’s NY Marketplace
Demographic Data from SNL Financial Inc. as of 6/2009 Valley Branch data as of
6/30/2010 |
 ©
2010 Valley National Bank. Member FDIC. Equal Opportunity Lender.
7
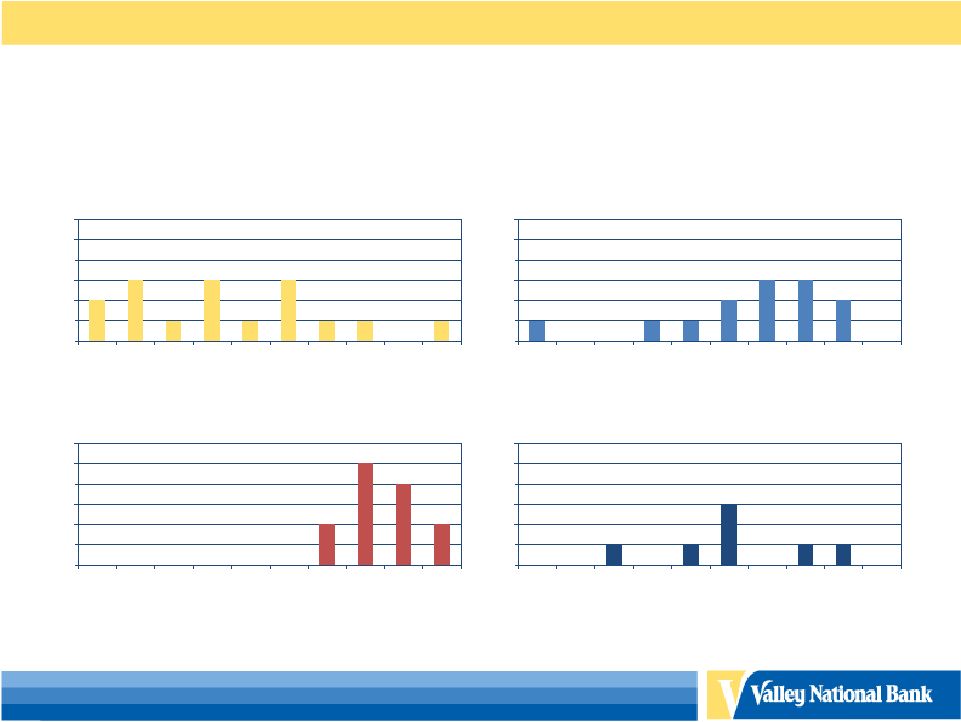
De Novo Branch Expansion
NJ Core Market
0
1
2
3
4
5
6
2001
2002
2003
2004
2005
2006
2007
2008
2009
2010
NJ Emerging Market
0
1
2
3
4
5
6
2001
2002
2003
2004
2005
2006
2007
2008
2009
2010
Brooklyn / Queens
0
1
2
3
4
5
6
2001
2002
2003
2004
2005
2006
2007
2008
2009
2010
Manhattan
0
1
2
3
4
5
6
2001
2002
2003
2004
2005
2006
2007
2008
2009
2010 |
 ©
2010 Valley National Bank. Member FDIC. Equal Opportunity Lender.
8
Centralized & Efficient Operations
Single core data processing system
Last 3 bank acquisitions were converted within 90
days of transaction completion date
Centralized, in-house back office operations
All 200 branches operate within a 60 mile radius of
Headquarters
Approximately 2,700 FTE employees
12/31/2007
12/31/2008
12/31/2009
6/30/2010
FTE Employees
2,562
2,783
2,727
2,730
# of Branch Offices
176
195
197
200
Employees / Offices
14.56
14.27
13.84
13.65 |
 ©
2010 Valley National Bank. Member FDIC. Equal Opportunity Lender.
9
0.00%
1.00%
2.00%
3.00%
4.00%
5.00%
Valley National Bank
Commercial Banks with Assets >$10B
Non-Interest Exp / Total Assets
Source –
SNL Financial |
 ©
2010 Valley National Bank. Member FDIC. Equal Opportunity Lender.
10
Valley’s 3Q 2010 Highlights
Credit Quality
Total 30+ day delinquencies were 1.70% of entire loan portfolio
Out of approximately 22,000 residential mortgages and home equity loans only 248 loans
were
past
due
30
days
or
more
at
September
30,
2010
Net charge-offs were $6.1 million or 0.26% of average total loans on an annualized
basis Total
non-accrual
loans
were
1.12%
of
total
loans
compared
to
1.10%
for
2
nd
Quarter,
2010
Net Income
3Q
net
income
available
to
common
shareholders
was
$32.6
million
($0.20
Diluted
EPS)
Net interest margin on a tax equivalent basis increased 6 basis points to 3.78% compared to
the previous quarter
Capital
Continued strong capital ratios
Tangible Common Equity to Risk-Weighted Assets of 8.89%
Tier I Ratio of 10.73%
Tier II Ratio of 12.58% |
 ©
2010 Valley National Bank. Member FDIC. Equal Opportunity Lender.
11
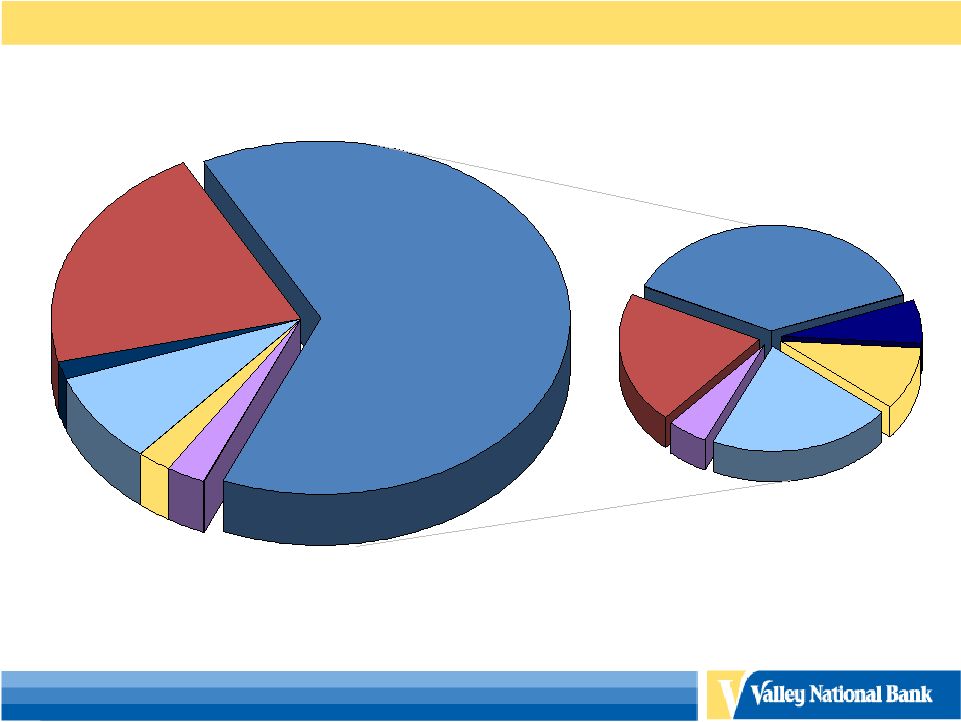
Asset and Loan Composition
Non-Covered
Loans 64%
Securities 21%
Cash 2%
Intangible
Assets 2%
Covered Loans
3%
Total Other
Assets 8%
Total Assets = $14.1 Billion
As of 9/30/10
Commercial
Real Estate
38%
Residential
Mortgages
21%
Commercial
Loans 20%
Construction
Loans 5%
Auto Loans
10%
Other
Consumer
6%
Non-Covered Loans (Gross) = $9.1 Billion
*Other Assets includes bank owned branch locations carried at a
cost estimated to be less than the current market value. |
 ©
2010 Valley National Bank. Member FDIC. Equal Opportunity Lender.
12
Total Commercial Real Estate -
$3.3 Billion
(Non-Covered Loans)
As of 9/30/10
Primary Property
Type
$ Amount
(Millions)
% of
Total
Average
LTV
Retail
879
27%
50%
Industrial
653
20%
52%
Office
431
13%
55%
Mixed Use
372
11%
44%
Apartments
337
10%
51%
Healthcare
237
7%
62%
Specialty
216
7%
50%
Residential
81
2%
51%
Land Loans
69
2%
74%
Other
23
1%
47%
Diversified Commercial Real Estate Portfolio
27%
20%
13%
11%
10%
7%
7%
2%
2%
1%
-Average LTV based on current balances and most recent appraised value
-The total CRE loan balance is based on Valley’s internal loan hierarchy
structure and does not reflect loan classifications reported in Valley’s SEC
and bank regulatory reports.
-The chart above does not include $401 million in construction loans.
|
 ©
2010 Valley National Bank. Member FDIC. Equal Opportunity Lender.
13
27%
22%
18%
12%
6%
6%
4%
3%
2%
Total Retail Property Types -
$879 Million
(Non-Covered Loans)
Retail Property Type
% of
Total
Average
LTV
Multi-Tenanted -
Anchor
27%
49%
Single Tenant
22%
51%
Multi-Tenanted -
No Anchor
18%
55%
Auto Dealership
12%
52%
Private & Public Clubs
6%
32%
Food Establishments
6%
54%
Private Education Facilities
4%
52%
Entertainment Facilities
3%
42%
Auto Servicing
2%
53%
As of 9/30/10
Retail Composition of Commercial Real Estate
-Average LTV based on current balances and most recent appraised value
-The chart above does not include construction loans. |
 ©
2010 Valley National Bank. Member FDIC. Equal Opportunity Lender.
14
As of 9/30/10
13%
11%
5%
5%
3%
2%
2%
1%
47%
Construction Loan Composition
Total (Non-Covered) Construction Loans -
$401 Million
Primary Property Type
$ Amount
(Millions)
% of
Total
Residential
188
47%
Land Loans
53
13%
Retail
44
11%
Mixed Use
42
11%
Apartments
21
5%
Other
20
5%
Office
12
3%
Healthcare
9
2%
Specialty
7
2%
Industrial
5
1%
-Construction loan balance is based on Valley’s internal loan hierarchy
structure and does not reflect loan classifications reported in Valley’s SEC
and bank regulatory reports. |
 ©
2010 Valley National Bank. Member FDIC. Equal Opportunity Lender.
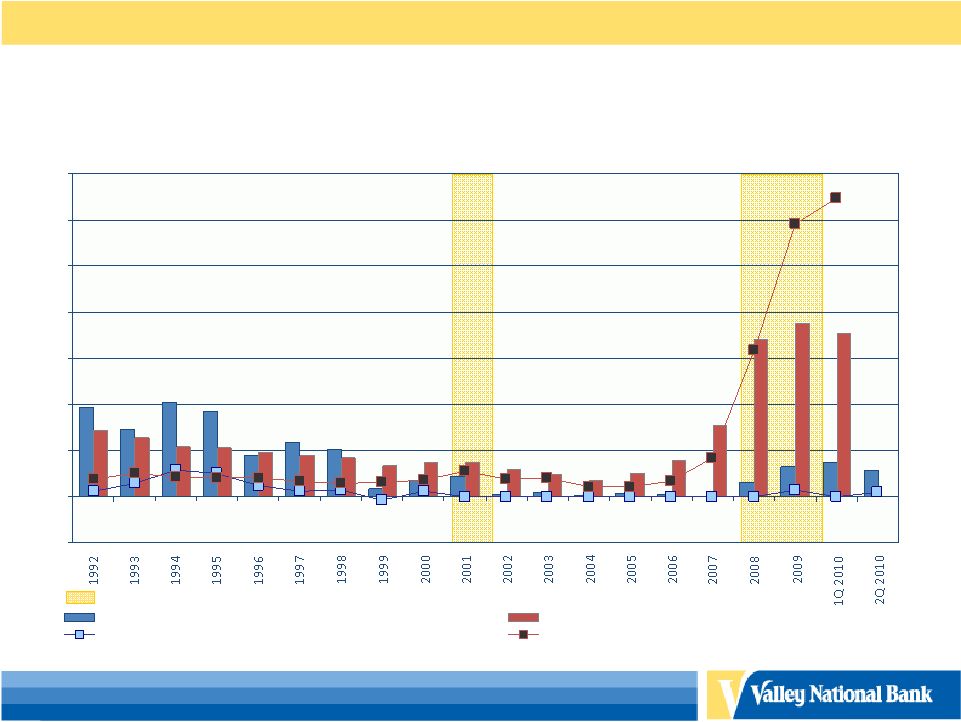
15
Loan Quality 1992 –
2Q 2010
Source –
FDIC
Recession
Total Loan Portfolio
Non-Current Loans: Loans and leases 90 days or more past due plus loans in non
accrual status, as a percent of gross loans and leases. 0.00%
1.00%
2.00%
3.00%
4.00%
5.00%
6.00%
Valley's Non-Current Loans to Total Loans
FDIC Insured Banks Non-Current Loans to Total Loans
Valley Net Charge-offs to Average Loans
FDIC Insured BanksNet
Charge-offs to Average Loans |
 ©
2010 Valley National Bank. Member FDIC. Equal Opportunity Lender.
16
Loan Quality 1992 –
2Q 2010
Recession
Residential Mortgages
Valley’s elevated levels between 1993 and 1997 are mainly attributable to
acquisitions. Source –
FDIC
0.00%
1.00%
2.00%
3.00%
4.00%
5.00%
6.00%
7.00%
8.00%
9.00%
10.00%
Valley's Non-Current Loans to Total Loans
FDIC Insured Banks Non-Current Loans to Total Loans
Valley Net Charge-offs to Average Loans
FDIC Insured BanksNet
Charge-offs
to
Average Loans |
 ©
2010 Valley National Bank. Member FDIC. Equal Opportunity Lender.
17
Loan Quality 1992 –
2Q 2010
Valley’s elevated levels between 1993 and 1997 are mainly attributable to
acquisitions. Recession
Home Equity
Source –
FDIC
-0.50%
0.00%
0.50%
1.00%
1.50%
2.00%
2.50%
3.00%
3.50%
Valley's Non-Current Loans to Total Loans
FDIC Insured Banks Non-Current Loans to Total Loans
Valley Net Charge-offs to Average Loans
FDIC Insured BanksNet
Charge-offs
to Average Loans |
 ©
2010 Valley National Bank. Member FDIC. Equal Opportunity Lender.
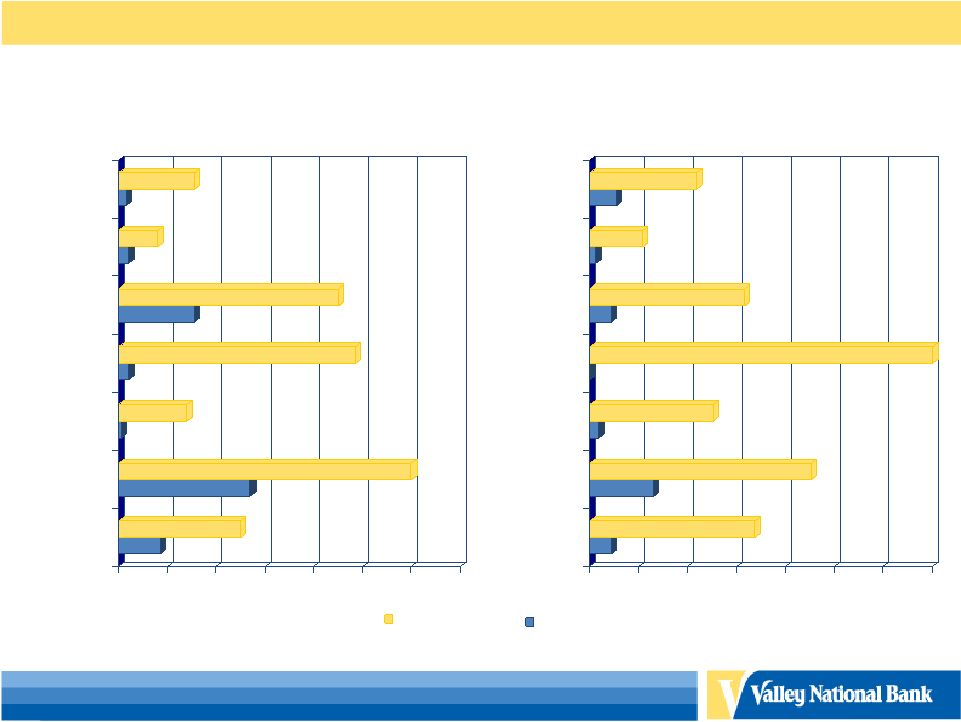
18
0.17%
0.50%
0.54%
1.20%
0.01%
0.28%
0.04%
0.97%
0.31%
0.90%
0.04%
0.16%
0.03%
0.31%
0.00%
0.20%
0.40%
0.60%
0.80%
1.00%
1.20%
1.40%
Net Charge-offs to Average Loans (%)
Total Loans
Consumer
Home Equity
Construction &
Development
Commercial Loans
Commercial Real
Estate
1-4 Family
Peer Group
0.22%
1.69%
0.65%
2.26%
0.09%
1.26%
0.00%
5.25%
0.22%
1.58%
0.06%
0.54%
0.27%
1.09%
0.00%
0.50%
1.00%
1.50%
2.00%
2.50%
3.00%
3.50%
Net Charge-offs to Average Loans (%) Annualized
Total Loans
Consumer
Home Equity
Construction &
Development
Commercial Loans
Commercial Real
Estate
1-4 Family
Valley
Net Charge-offs to Average Loans
Source -
SNL Financial As of 10/26/10
Peer group consists of banks with total assets between $3 billion and $50 billion.
2003 -
2009
2Q 2010 |
 ©
2010 Valley National Bank. Member FDIC. Equal Opportunity Lender.
19
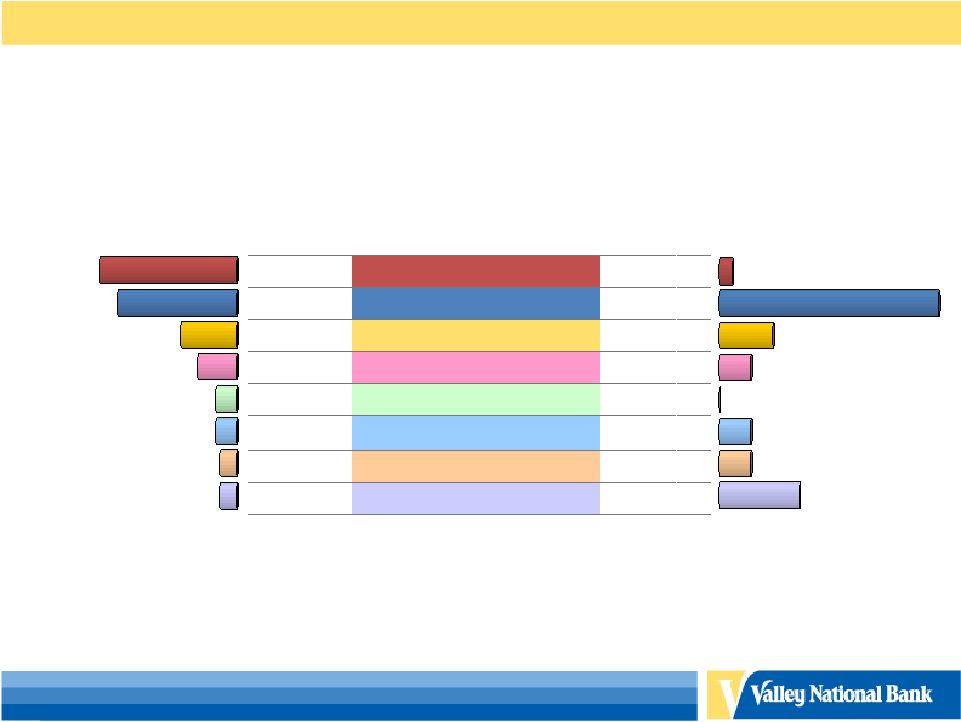
Investment Portfolio
Q3 2010
Investment Types
2007
34%
GSE MBS (GNMA)
3%
25%
GSE MBS (FNMA/FHLMC)
49%
15%
Trust Preferred
12%
10%
State, County & Municipals
7%
6%
US Treasury
0%
5%
Other
7%
4%
Private Label MBS
5%
4%
Corporate Debt
18%
$2.9 Billion
Investment Portfolio
$3.1 Billion
As of 9/30/10 and 12/31/07
Duration of MBS Securities
1.69 Years
2.64 Years |
 ©
2010 Valley National Bank. Member FDIC. Equal Opportunity Lender.
20
Securities by Investment Grade
AAA Rated 67%
AA Rated 6%
A Rated 5%
BBB Rated 6%
Non Investment Grade 5%
Not Rated 11%
As of 9/30/10
AAA Rated
Not Rated
Non-investment
grade
A Rated
AA Rated
BBB Rated |
 ©
2010 Valley National Bank. Member FDIC. Equal Opportunity Lender.
21
Deposits and Borrowings Composition
Total Deposits
72%
Other
Liabilities 2%
Short-term
Borrowings 3%
Long-term
Borrowings
23%
Total Liabilities = $12.8 Billion
As of 09/30/10
Savings,
NOW and
MMDA
44%
Non-
Interest
Bearing
27%
Time
Deposits
29%
Total Deposits = $9.3 Billion |
 ©
2010 Valley National Bank. Member FDIC. Equal Opportunity Lender.
22
Equity Composition / Ratios*
Tangible
Common
Equity 71%
Other Equity
2%
Trust Preferred
13%
Sub-debt 6%
LL Reserve 8%
Total Tier II Equity = $1.3 Billion
As of 9/30/10
Unrealized gain on facilities owned of approximately $200 million over
book, not incorporated in capital ratios reflected above.
*Non-GAAP reconciliations shown on slide 26.
Capital Ratios
As of
9/30/2010
“Well
Capitalized”
Tangible Common Equity /
Tangible Assets
6.84%
-
Tangible Common Equity /
Risk-Weighted Assets
8.89%
-
Tier I
10.73%
6.00%
Tier II
12.58%
10.00%
Leverage
8.27%
5.00%
Book Value
$7.93
-
Tangible Book Value
$5.84
- |
 ©
2010 Valley National Bank. Member FDIC. Equal Opportunity Lender.
23
Shareholder Returns
(1) All per share amounts have been adjusted retroactively for stock
splits and stock dividends during the periods presented. (2) Net income
includes other-than-temporary impairment charges on investment securities totaling $2.9 million, $4.0 million,
$49.9 million, and $10.4 million, net of tax benefit, for nine months ended
9/30/2010, 2009, 2008, and 2007, respectively. Historical Financial Data (1)
(Dollars in millions, except for share data)
9/30/2010
14,088
$
93.0
$
$0.58
0.93
%
10.24
%
$0.54
5/10 -
5%
Stock Dividend
2009
14,284
116.1
0.64
0.81
8.64
0.72
5/09 -
5%
Stock Dividend
2008
14,718
93.6
0.64
0.69
8.74
0.73
5/08 -
5%
Stock Dividend
2007
12,749
153.2
1.10
1.25
16.43
0.74
5/07 -
5%
Stock Dividend
2006
12,395
163.7
1.15
1.33
17.24
0.70
5/06 -
5%
Stock Dividend
2005
12,436
163.4
1.17
1.39
19.17
0.69
5/05 -
5%
Stock Dividend
2004
10,763
154.4
1.16
1.51
22.77
0.66
5/04 -
5%
Stock Dividend
2003
9,873
153.4
1.15
1.63
24.21
0.63
5/03 -
5%
Stock Dividend
2002
9,148
154.6
1.12
1.78
23.59
0.60
5/02 -
5:4
Stock Split
2001
8,590
135.2
0.94
1.68
19.70
0.56
5/01 -
5%
Stock Dividend
2000
6,426
106.8
0.90
1.72
20.28
0.53
5/00 -
5%
Stock Dividend
1999
6,360
106.3
0.85
1.75
18.35
0.50
5/99 -
5%
Stock Dividend
1998
5,541
97.3
0.82
1.82
18.47
0.45
5/98 -
5:4
Stock Split
1997
5,091
85.0
0.75
1.67
18.88
0.40
5/97 -
5%
Stock Dividend
1996
4,687
67.5
0.66
1.47
17.23
0.35
5/96 -
5%
Stock Dividend
1995
4,586
62.6
0.60
1.40
16.60
0.34
5/95 -
5%
Stock Dividend
1994
3,744
59.0
0.66
1.60
20.03
0.32
5/94 -
10%
Stock Dividend
1993
3,605
56.4
0.65
1.62
21.42
0.26
4/93 -
5:4
Stock Split
1992
3,357
43.4
0.50
1.36
19.17
0.22
4/92 -
3:2
Stock Split
1991
3,055
31.7
0.37
1.29
15.40
0.21
1990
2,149
28.6
0.33
1.44
14.54
0.21
Period End
Total Assets
Net Income
(2)
Common Stock Splits and Dividends
Diluted
Earnings Per
Common
Share
Return on
Average
Assets
Return on
Average
Equity
Cash Dividends
Declared Per
Common Share |
 ©
2010 Valley National Bank. Member FDIC. Equal Opportunity Lender.
24
For More Information
Log onto our web site: www.valleynationalbank.com
E-mail requests to: dgrenz@valleynationalbank.com
Call Shareholder Relations at: (973) 305-3380
Write to: Valley National Bank
1455 Valley Road
Wayne, New Jersey 07470
Attn: Dianne M. Grenz, First Senior Vice President
Director of Marketing, Shareholder & Public Relations
Log onto our website above or www.sec.gov
to obtain free copies of
documents filed by Valley with the SEC |
 ©
2010 Valley National Bank. Member FDIC. Equal Opportunity Lender.
25
Non-GAAP Disclosure Reconciliations
($ in Thousands)
9/30/2010
Total Assets
$14,087,611
Less: Goodwill & Other Intangible
Assets
(337,431)
Total Tangible Assets
$13,750,180
Risk Weighted Assets
$10,579,775
Total Equity
$1,278,019
Less: Goodwill & Other Intangible
Assets
(337,431)
Total Tangible Shareholders’
Equity
$940,588
Ratios
TCE / TA
6.84%
TCE / RWA
8.89%
*All data as of 9/30/10
9/30/2010
Common Shares Outstanding
161,123,404
Shareholders’
Equity
$1,278,019
Less: Preferred Stock
-
Less: Goodwill and Other Intangible
Assets
(337,431)
Tangible Shareholders’
Equity
$940,588
Tangible Book Value
$5.84 |