Attached files
| file | filename |
|---|---|
| EX-99 - UIL EXHIBIT 99 - PRESS RELEASE - UIL HOLDINGS CORP | uil_exh99.htm |
| 8-K - UIL FORM 8-K DATED SEPTEMBER 29, 2010 - UIL HOLDINGS CORP | uil_form8kdated09292010.htm |

1
EEI Nov. 2010
45th Annual EEI Financial Conference
November 2010
EXHIBIT 99.1

2
EEI Nov. 2010
2
Important Note to Investors
James P. Torgerson
President and Chief Executive Officer, UIL Holdings Corporation
Richard J. Nicholas
Executive Vice President and Chief Financial Officer, UIL Holdings Corporation
Safe Harbor Provision
Certain statements contained herein, regarding matters that are not historical facts, are forward-looking statements (as defined in the Private Securities
Litigation Reform Act of 1995). These include statements regarding management’s intentions, plans, beliefs, expectations or forecasts for the future
including, without limitation, UIL’s expectations with respect to the benefits, costs and other anticipated financial impacts of the proposed gas
company acquisition transaction; future financial and operating results of UIL; UIL’s plans, objectives, expectations and intentions with respect to
future operations and services; approval of the proposed transaction by governmental regulatory authorities; the satisfaction of the closing conditions to
the proposed transaction; and the timing of the completion of the proposed transaction. Such forward-looking statements are based on UIL’s
expectations and involve risks and uncertainties; consequently, actual results may differ materially from those expressed or implied in the statements.
Such risks and uncertainties include, but are not limited to, general economic conditions, legislative and regulatory changes, changes in demand for
electricity and other products and services, changes in financial markets, unanticipated weather conditions, changes in accounting principles, policies
or guidelines, and other economic, competitive, governmental, and technological factors affecting the operations, timing, markets, products, services
and prices of UIL’s subsidiaries. Examples of such risks and uncertainties specific to the transaction include, but are not limited to: the possibility that
the proposed transaction is delayed or does not close, including due to the failure to receive required regulatory approvals, the taking of governmental
action (including the passage of legislation) to block the transaction, or the failure of other closing conditions; and the possibility that the expected
benefits will not be realized, or will not be realized within the expected time period. The foregoing and other factors are discussed and should be
reviewed in UIL’s most recent Annual Report on Form 10-K and other subsequent filings with the Securities and Exchange Commission. Forward-
looking statements included herein speak only as of the date hereof and the UIL undertakes no obligation to revise or update such statements to reflect
events or circumstances after the date hereof or to reflect the occurrence of unanticipated events or circumstances.
Reconciliation of Non-GAAP Financial Measures
Financial measures highlighted in this presentation may be considered non-GAAP financial measures such as Earnings Before Interest Expense,
Income Tax, Depreciation and Amortization (“EBITDA”), Adjusted EBITDA and Adjusted Net Income. Comparable GAAP financial measures and a
reconciliation of GAAP financial measures to non-GAAP financial measures are available in the Appendix to this presentation.
Income Tax, Depreciation and Amortization (“EBITDA”), Adjusted EBITDA and Adjusted Net Income. Comparable GAAP financial measures and a
reconciliation of GAAP financial measures to non-GAAP financial measures are available in the Appendix to this presentation.

3
EEI Nov. 2010
Today’s Topics
Ø Gas Companies Acquisition Update
Ø UI Transmission Growth
Ø YTD Accomplishments
Ø UI Base 10-year Capital Expenditure Forecast
Ø Near-term Capital Expenditures including Gas Companies
Ø GenConn
Ø NEEWS
Ø Near-term Average Rate Base Forecast
Ø Energy Conservation & Smart System
Ø 3Q & YTD 2010 Financial Results
Ø 2010 Guidance
Ø Looking Forward to 2011

4
EEI Nov. 2010
4
Investment Highlights
Attractive Dividend
(6% Yield) (2)
› Current annual dividend of $1.728 per share
› Core regulated earnings combined with the enhanced cash flow and expected earnings per
share accretion from the acquisition provide continued support for UIL’s dividend
share accretion from the acquisition provide continued support for UIL’s dividend
Visible Regulated
Growth
Opportunities
Growth
Opportunities
› Approximately $2.1B of regulated capital investment in The United Illuminating Company
(UI) 10-year plan
(UI) 10-year plan
» UI 5-year Rate Base CAGR of 8.2% (9.4% including equivalent GenConn rate base) (1)
» Includes $0.6B of highly attractive transmission projects
› Pending acquisition provides additional avenue for growth through investment in gas
distribution system
distribution system
Conservative
Financial Strategy
Financial Strategy
› Maintenance of investment grade credit ratings is an important objective
FERC-Regulated
Electric
Transmission
Electric
Transmission
› 2009 earned composite return on equity of 12.52%
› Proven ability to partner reaching beyond service territory
› New England renewable portfolio standards driving need for major transmission build
Note: (1) CAGRs calculated based on annual average rate base from 2010-2015
(2) Based on share price of $28.41 as of October 25, 2010
Attractive Regulated
Utility
Utility
› Proven ability to earn allowed electric return
› Highly experienced with Connecticut regulatory proceedings
› Constructive long-term rate plan in Massachusetts comes with acquisition
5
EEI Nov. 2010
5
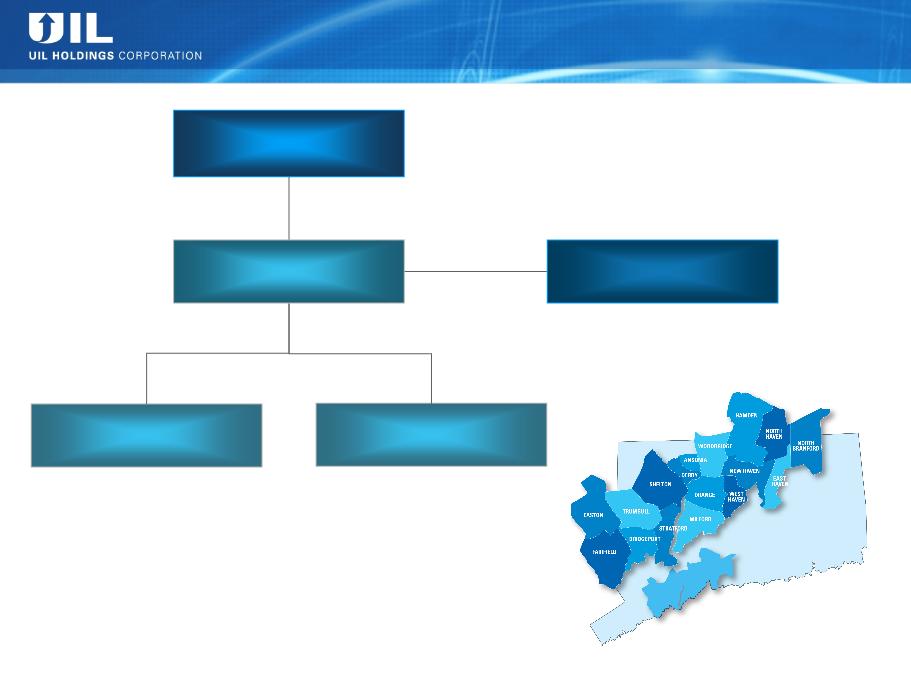
UIL - Current Corporate Structure
Retail Distribution
~60% of rate base
~60% of rate base
~53% of ’09 Net Income (4)
Transmission
~40% of rate base
~40% of rate base
~47% of ’09 Net Income
› 2009 Distribution Avg. Rate Base
$492M
$492M
› 2009 CTA (5) Avg. Rate Base $162M
› Allowed ROE of 8.75% in 2010 with
full revenue decoupling
full revenue decoupling
› Attractive FERC authorized ROE
› Expected 2010 composite ROE of
12.4%-12.5%
12.4%-12.5%
› Collaborating on CT portion of New
England East West Solution
(“NEEWS”) projects
England East West Solution
(“NEEWS”) projects
› Joint venture between UI and NRG
› ~400MW of new peaking generation in CT
› Regulated cost of service with 9.75% ROE
lifetime floor
lifetime floor
› Regulated T&D utility
› ~324,000 customers (3)
› Market cap of ~$1.4B (1)
› 1,066 employees (2)
› 335 square miles (2)
› Population of ~736,000
(2)
(2)
Note: (1) Based on share price of $28.41 as of October 25, 2010
(2) As of 12/31/09
(3) As of 9/30/10
(4) Includes UIL Corporate. Retail Distribution ~ 58% of ’09 Net Income
(5) CTA = Competitive Transition Assessment
UIL Holdings Corporation
GenConn Energy LLC
The United Illuminating
Company
Company
UI Service Territory

6
EEI Nov. 2010
Pending Acquisition of SCG, CNG & Berkshire
› Connecticut Department of Public Utility Control (DPUC)
» Draft decision received
» Final decision expected 11/10
› Massachusetts Department of Public Utilities (DPU)
» Order issued 8/31 stating no approval required under MA Law
» MA AG filed petition for reconsideration on 9/20
4 UIL/Iberdrola joint response filed 10/4
4 DPU ruling still pending
› Completed Financing Plan
» $501.5M net proceeds equity financing completed on 9/22
» $443.5M net proceeds 4.625% UIL senior unsecured debt issued on 10/7
› Working diligently through transition plan
› If the DPUC draft decision is adopted as a final decision, UIL expects to close
on the acquisition of the gas companies in mid-November
on the acquisition of the gas companies in mid-November

7
EEI Nov. 2010
7
UIL - Post-acquisition Corporate Structure
› Service territory: 512 sq
miles from Westport, CT to
Old Saybrook, CT
miles from Westport, CT to
Old Saybrook, CT
› ~173,000 customers
› 324 employees
› 2,269 miles of mains with
~131,000 services
~131,000 services
› 2009 rate case allowed ROE
of 9.26% (1)
of 9.26% (1)
Southern Connecticut Gas
(SCG)
(SCG)
› Service territory: 716 sq
miles in Greater Hartford-
New Britain area and
Greenwich
miles in Greater Hartford-
New Britain area and
Greenwich
› ~158,000 customers
› 341 employees
› 2,011 miles of mains with
~124,000 services
~124,000 services
› 2009 rate case allowed ROE
of 9.31% (1)
of 9.31% (1)
Connecticut Natural Gas
(CNG)
(CNG)
› Service territory: 738 sq
miles in Western MA
including Pittsfield and
North Adams
miles in Western MA
including Pittsfield and
North Adams
› ~35,000 customers
› 127 employees
› 738 miles of mains
› Allowed ROE of 10.50%
Berkshire Gas Company
(Berkshire)
(Berkshire)
› Service territory: 335 sq
miles
miles
› ~324,000 customers
› 1,066 employees
› Allowed Distribution ROE
of 8.75%
of 8.75%
› Allowed ’09 Transmission
ROE (composite) of 12.52%
ROE (composite) of 12.52%
› 50% interest in GenConn
Energy LLC
Energy LLC
The United Illuminating
Company (UI)
Company (UI)
Note: (1) Includes 10 basis point penalty reduction
UIL Holdings
Corporation
Corporation
Connecticut Energy
Corporation
Corporation
(Holding Company for SCG)
BER
(Holding Company for
Berkshire)
Berkshire)
Service Area Key
SCG
CNG
UI
Berkshire
Overlapping Territory
CTG Resources, Inc.
(Holding Company for CNG)
8
EEI Nov. 2010
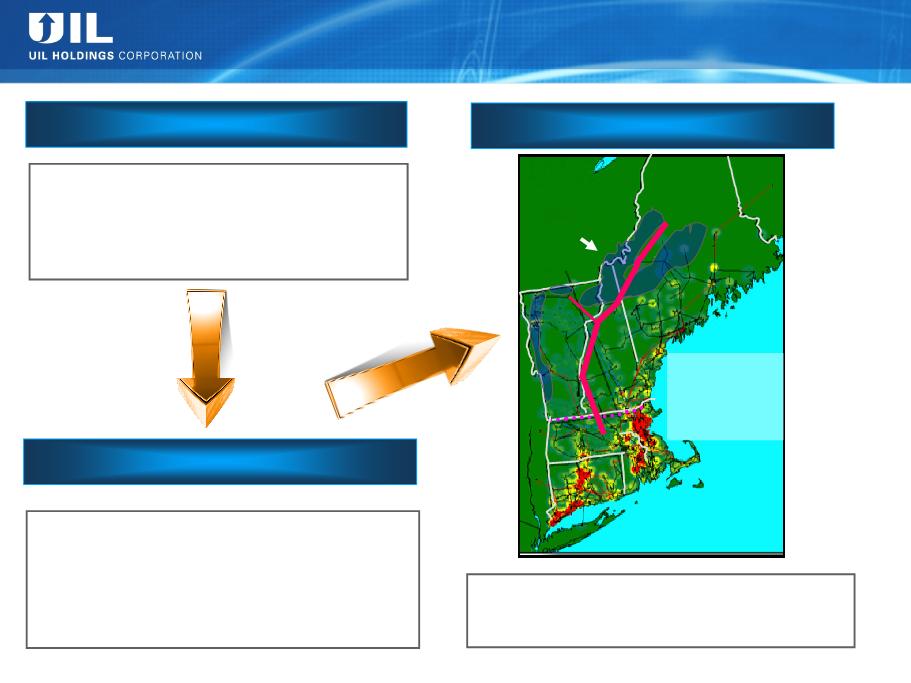
UI Transmission Growth
Renewable Requirement, Potential Solution
Renewable Requirement, Potential Solution
Need Statement
Potential Solution
› Renewable Portfolio Standard (RPS)
Requirement is ~3x current renewables level
Requirement is ~3x current renewables level
› CT requirement is > than UI’s entire load
› Gap will likely be filled by renewables remote
from load
from load
8
Assessment
Governors’ Blueprint, ISO-NE Study
› Significant Transmission build-out indicated
› Potential $7B - $10B range, could be higher or
lower to satisfy a 4,000 - 12,000 MW need
lower to satisfy a 4,000 - 12,000 MW need
› Cost to New England likely to be significantly
less than importation of midwestern wind
less than importation of midwestern wind
North-South
Interface:
Interface:
80% of NE
electric load is
below this line
electric load is
below this line
Vast majority of
potential onshore
renewables (wind)
potential onshore
renewables (wind)
are in northern NE
Collaborative effort between UI, NU, NSTAR and
NGrid to research and develop potential
solutions to the region’s RPS requirements
NGrid to research and develop potential
solutions to the region’s RPS requirements

9
EEI Nov. 2010
(1) The revenue decoupling mechanism was allowed to continue until the Department issues its
final ruling in 2011 on the evaluation of this adjustment mechanism.
final ruling in 2011 on the evaluation of this adjustment mechanism.
YTD Accomplishments/Milestones
ü Transformative Gas Companies Acquisition Underway
ü Successful Execution of Financing Plan
ü Executing on 10-year Capital Expenditure Plan
ü GenConn Devon is Operational
ü Collaborating on CT Portion of New England East West
Solution projects
Solution projects
ü Continued Enhancement of UI’s Smart System
ü Continuation of Revenue Decoupling (1)
10
EEI Nov. 2010
* Equity investment - Devon plant now operating, Middletown expected operation June 2011.
Amounts may not add due to rounding.
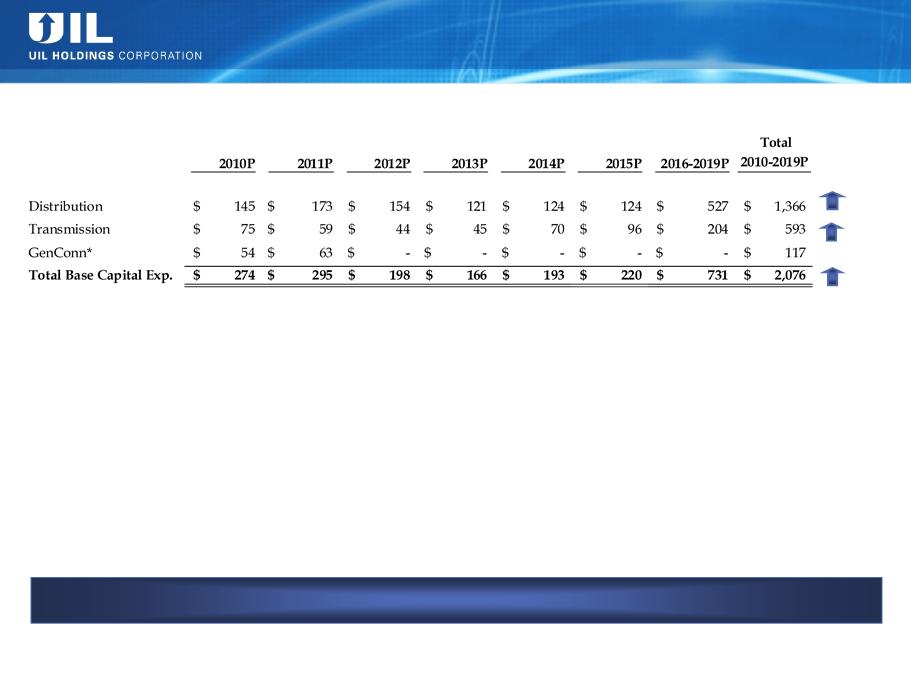
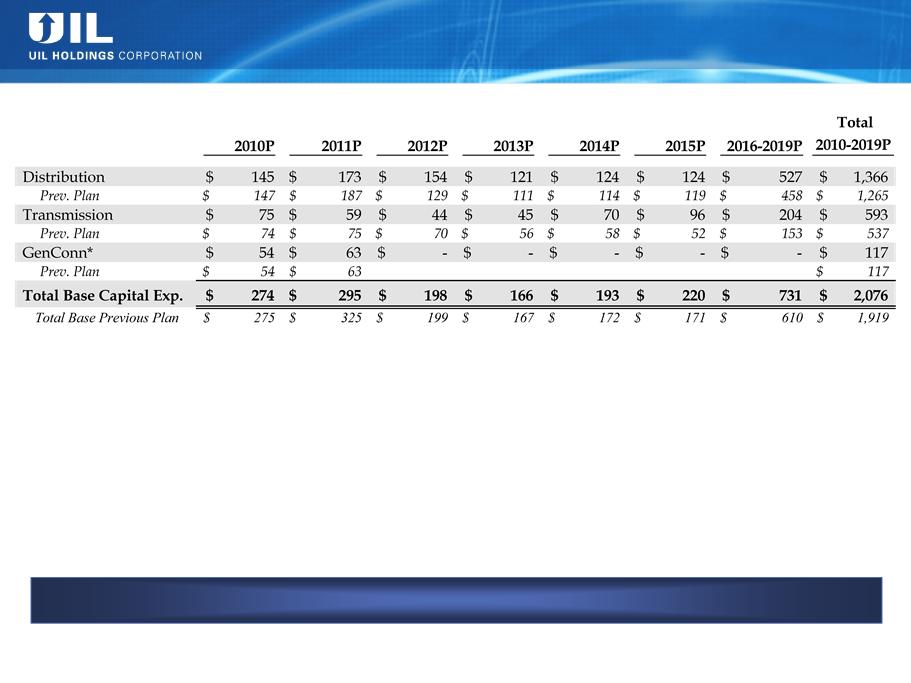
Explanations to Previous Plan
› Distribution
» 2 additional substation rebuilds
» Increases in IT related/Core Support
7%
10%
8%
Indentified projects with clear need and regulatory support
› Transmission
» Timing and amount of NEEWS investments
» 2 additional substation rebuilds
($ in millions)
Updated UI Base 10-yr CapEx Forecast
11
EEI Nov. 2010
11
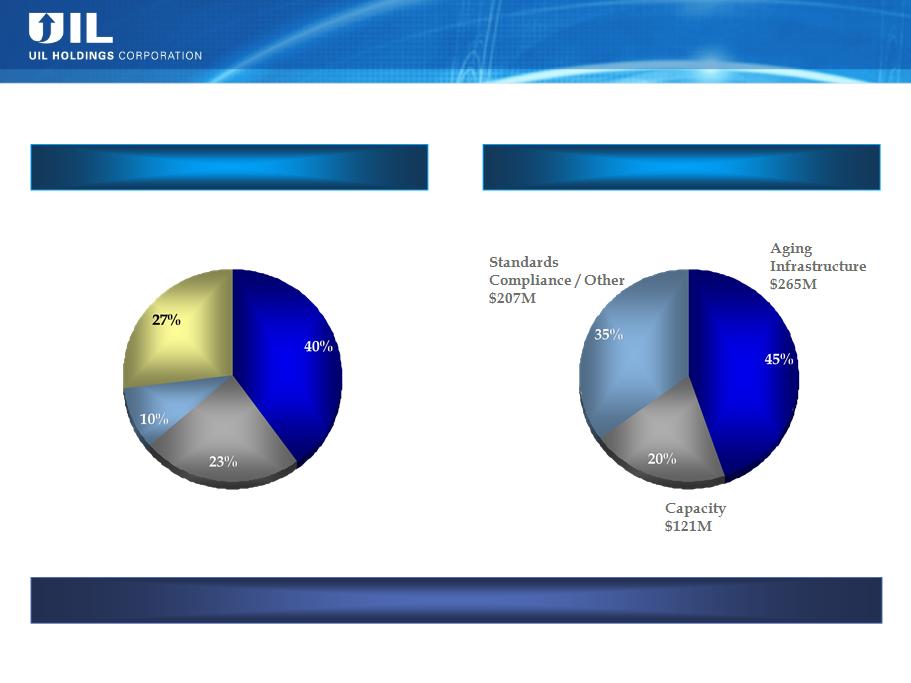
Transmission Investments
Distribution Investments
UI Base 10-Year T&D Capital
Investment Program
Investment Program
2010P - 2019P: $1,366M
2010P - 2019P: $593M
Capacity
$320M
$320M
Aging
Infrastructure
$547M
Infrastructure
$547M
System
Operations
$130M
Operations
$130M
Core Support
$369M
$369M
Note: (1) Includes $117M of GenConn capital expenditures
Amounts may not add due to rounding.
Approximately $2.1B (1) of Regulated Investment in Base Program for 2010P - 2019P
12
EEI Nov. 2010
12
|
Total Capex ($M)
|
2011P - 2015P
|
|
Distribution
|
$695
|
|
Transmission
|
314
|
|
GenConn
|
63
|
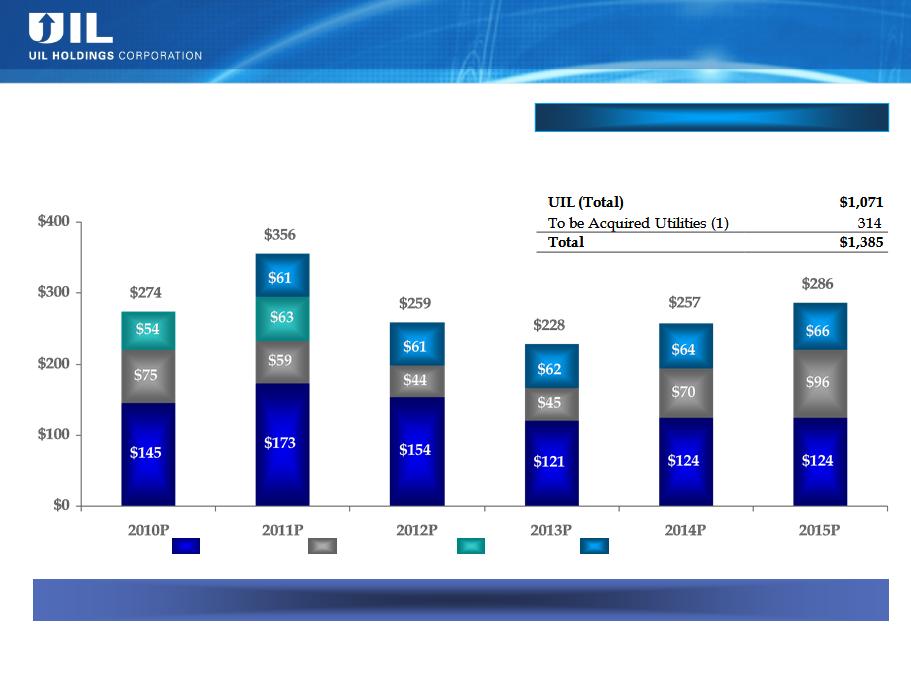
UIL Near-Term Regulated Capital Investment
Pipeline
Pipeline
($M)
Identified Projects With Clear Need
Distribution
GenConn
Transmission
To be Acquired Utilities
(1)
Note: (1) 2011 projections include to be Acquired Utilities’ full-year projected capex. To be Acquired Utilities’ projected capex provided by Iberdrola, USA.
Amounts may not add due to rounding.
20%
27%
53%
18%
17%
48%
24%
17%
59%
27%
20%
53%
25%
27%
48%
17%
23%
34%
43%
13
EEI Nov. 2010
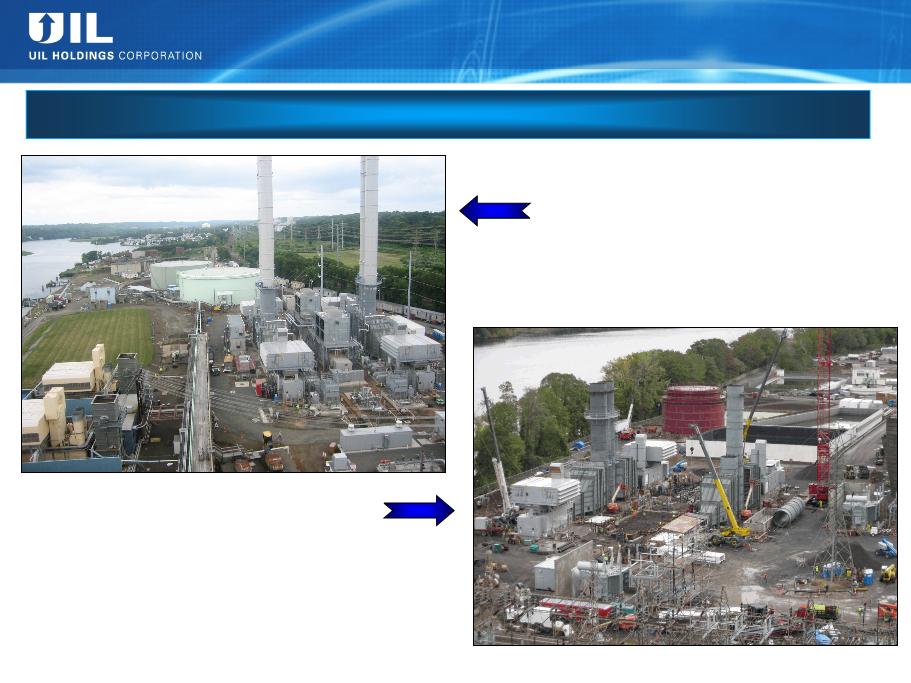
Devon Facility
› Operating
› Contractual requirements met
on 9/10/10
on 9/10/10
Middletown Facility
› 55% complete as of week ending 10/22
› Expected to be operational in June 2011
50/50 Joint Venture between UI and NRG
GenConn Energy
14
EEI Nov. 2010
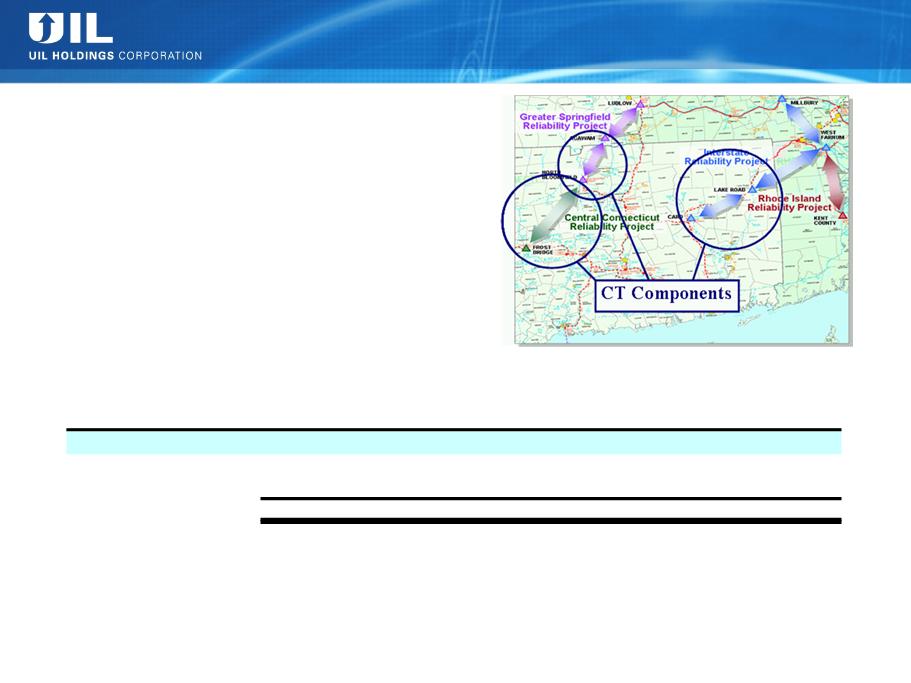
UI Transmission - Participation in NEEWS
» UI’s portion - increased to the greater
of $69M or 8.4% of CL&P’s costs for
the CT portions
of $69M or 8.4% of CL&P’s costs for
the CT portions
UI’s Investment increased from
$60M to $69M
$60M to $69M
($ in millions)
Potential UI Investment*
2010P
2011P
2012P
2013P
2014P
2015P
2016P
Total
Current Projection
7
$
3
$
9
$
8
$
12
$
23
$
7
$
69
$
Previous Projection
7
$
3
$
26
$
17
$
7
$
-
$
-
$
60
$
Difference
-
$
-
$
(17)
$
(9)
$
5
$
23
$
7
$
9
$
* Based on NU's latest projection of UI's Investment in CL&P's portion of the NEEWS Projects.
15
EEI Nov. 2010
UI’s 50% Share ($M): 2010P 2011P 2012P 2013P 2014P 2015P
15
Near-Term Average Rate Base Profile
(Excluding GenConn Equity Investments)
(Excluding GenConn Equity Investments)
($M)
48%
40%
12%
29%
21%
5%
35%
3%
41%
Attractive Rate Base Growth Even With a Declining CTA Balance
1%
23%
38%
38%
39%
45%
21%
38%
23%
Avg. GenConn RB Equivalent
$153
Avg. GenConn Equity “Rate Base”
$77
$188
$94
$177
$89
$199
$99
$52
$26
40%
37%
23%
$167
$84
To be Acquired Utilities’ rate base projections provided by Iberdrola, USA.
Amounts may not add due to rounding.
Distribution
GenConn
Acquired Utilities
Transmission
16
EEI Nov. 2010
Energy Conservation

17
EEI Nov. 2010
CT Energy Efficiency Fund Activities in 2009
UI approximately 20%
UI has been a leader in energy efficiency programs for more than 2 decades
Leader in Conservation & Demand Response Programs
› Nationally and internationally
recognized for its programs
recognized for its programs
› Small Business Energy Advantage
Program incorporates innovative
“on-bill financing”
Program incorporates innovative
“on-bill financing”
› 863 million annual lifetime
kilowatt hour savings
kilowatt hour savings
(5-year average)
› 433 thousand annual lifetime tons
of carbon dioxide emissions
of carbon dioxide emissions
(5-year average)
› Annual pre-tax income
approximately $1 million
approximately $1 million

18
EEI Nov. 2010
UI is a leading demand response provider throughout New England
Leader in Conservation & Demand Response Programs
› Home Depot, Walmart and Kohl’s
stores throughout New England
participate in UI’s Load Response
Program
stores throughout New England
participate in UI’s Load Response
Program
› In total, UI enrolls over 600
individual customer assets and
over 80 MW of load in the
Forward Capacity Market (FCM)
individual customer assets and
over 80 MW of load in the
Forward Capacity Market (FCM)
› Active in ISO-NE Markets
Committee and FCM Working
Group to help shape demand
response programs that customers
value
Committee and FCM Working
Group to help shape demand
response programs that customers
value
› Annual pre-tax income of more
than $0.5 million
than $0.5 million

19
EEI Nov. 2010
Source: U.S. Department of Energy
End-Use Customers
› Home Area Networks
› Electric Vehicles
› Distributed Resources
Modernization of UI’s Electric System
UI’s Smart System
Monitors
› SCADA
Optimizes the Operation
› Voltage Control
› Automatic switching & restoration
Distribution System
› Outage Detection
› Advanced Meter Infrastructure
› Meter Data Management
› Smart Meter Deployment
» 17,000+ meters installed
» 40,000 two-way meters installed by
year-end 2010
» 80,000 two-way meters installed by
year-end 2011

20
EEI Nov. 2010
› UI is currently conducting a one-year HAN pilot
with 950 households
with 950 households
› Enables two-way communication with the new meter
into customer’s home
into customer’s home
› Customers can access near real-time energy usage
information from their homes and on-line
information from their homes and on-line
› Creates opportunities for customers to save energy
» Dynamic Pricing
» Residential Demand Response
» Integration of distributed resources
» Next generation energy efficiency appliances
such as electric vehicles and smart appliances
such as electric vehicles and smart appliances
Home Area Network (HAN) Pilot

21
EEI Nov. 2010
Financial Results

22
EEI Nov. 2010
|
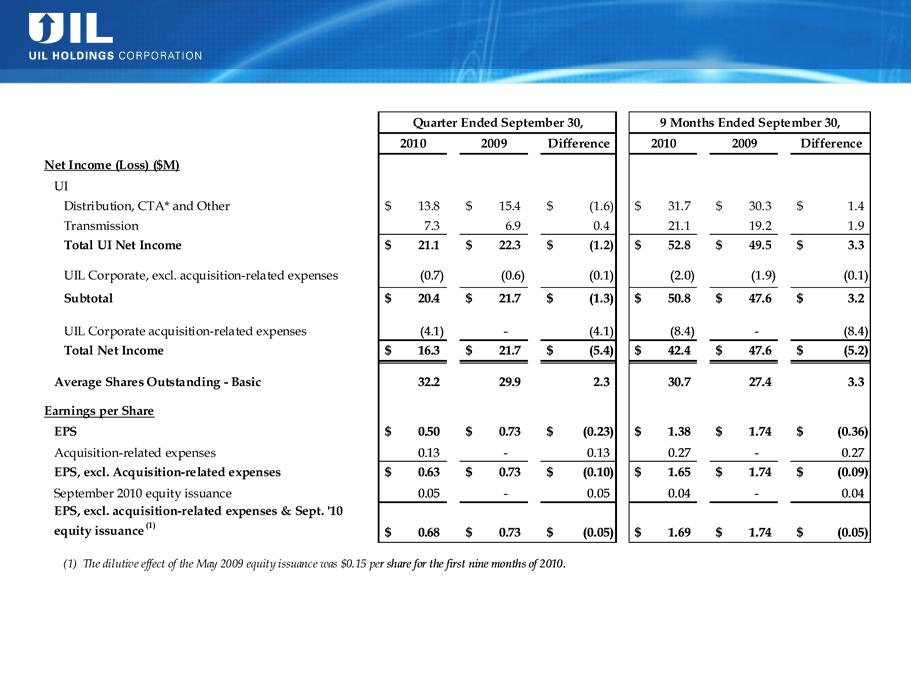
(1) The dilutive effect of the May 2009 equity issuance was $0.15 per share for the first nine months of 2010.
|
Net Income 3Q ’10 vs. 3Q ’09
› Unfavorable variance of $1.3 million, excluding $4.1
million acquisition-related expenses in 3Q ‘10
million acquisition-related expenses in 3Q ‘10
» Higher Distribution O&M expense due to timing
» Lower CTA rate base
» Timing of below the line income
Net Income YTD 2010 vs. 2009
› Favorable variance of $3.2 million, excluding $8.4
million acquisition-related expenses in 2010
million acquisition-related expenses in 2010
» Increased Distribution revenues partially offset
by increased O&M and interest expenses
by increased O&M and interest expenses
» Increased Allowance for Funds Used During
Construction
Construction
3Q & YTD 2010 Financial Results - Summary
23
EEI Nov. 2010
* Competitive Transition Assessment
3Q & YTD 2010 Financial Results - Details

24
EEI Nov. 2010
24
Pro Forma Near-Term Debt Maturities
Standalone Liquidity Overview (9/30/10)*
Strong Liquidity Position and Manageable
Near-Term Debt Maturities
Near-Term Debt Maturities
*UIL Plans to Increase Size of Credit Facilities to Provide Adequate Liquidity for Larger Business
Amounts may not add due to rounding.
($M)
UI Equity Bridge Loan
To be Acquired
Utilities
**
Notes: All 2010 debt maturities have either been remarketed or repaid
** To be remarketed
25
EEI Nov. 2010
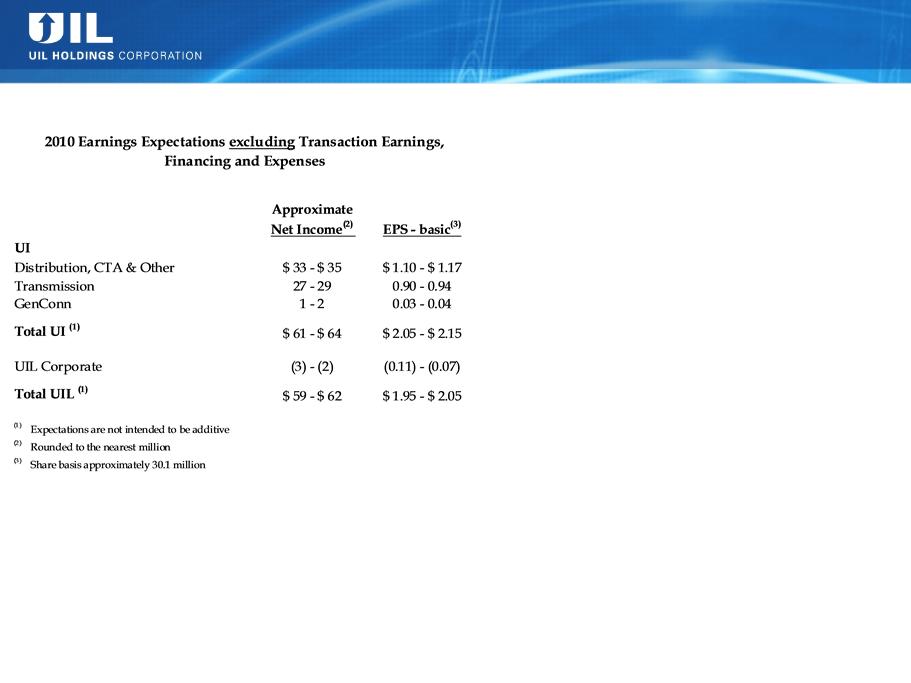
Guidance Assumptions
2010 Earnings Guidance as of November 1, 2010
Narrowing Range
Narrowing Range
› Better than anticipated Distribution, CTA &
Other earnings performance for first nine
months of 2010 with updated projections for 4Q
’10 O&M expenses
Other earnings performance for first nine
months of 2010 with updated projections for 4Q
’10 O&M expenses
› Increase in Transmission Allowance for Funds
Used During Construction
Used During Construction
› Earnings impact from a delay in GenConn
Devon achieving commercial operation
Devon achieving commercial operation
› UIL Corporate updated to reflect tax rate true-
ups
ups

26
EEI Nov. 2010
Looking Forward to 2011
› Gas companies acquisition
» Transition year - work through Transitional Services Agreement
› Driving to earn allowed returns on all regulated businesses
› Continual management of O&M expenses
› Executing on capital expenditure plan à realizing rate base growth
› GenConn Middletown scheduled to be operational June 2011

27
EEI Nov. 2010
27
Attractive Dividend
› UIL has paid a consecutive quarterly dividend for over 100 years (1)
› Dividend has been set at current annual level of $1.728 per share for
more than 14 years
more than 14 years
› Management is focused on maintaining the dividend and reducing
the payout ratio over time through earnings growth
the payout ratio over time through earnings growth
› Pending acquisition will provide additional earnings and cash flow to
help achieve this objective
help achieve this objective
Note: (1) Refers to UIL and UI

28
EEI Nov. 2010
28
Investment Highlights
Attractive Dividend
(6% Yield) (2)
› Current annual dividend of $1.728 per share
› Core regulated earnings combined with the enhanced cash flow and expected earnings per
share accretion from the acquisition provide continued support for UIL’s dividend
share accretion from the acquisition provide continued support for UIL’s dividend
Visible Regulated
Growth
Opportunities
Growth
Opportunities
› Approximately $2.1B of regulated capital investment in The United Illuminating Company
(UI) 10-year plan
(UI) 10-year plan
» UI 5-year Rate Base CAGR of 8.2% (9.4% including equivalent GenConn rate base) (1)
» Includes $0.6B of highly attractive transmission projects
› Pending acquisition provides additional avenue for growth through investment in gas
distribution system
distribution system
Conservative
Financial Strategy
Financial Strategy
› Maintenance of investment grade credit ratings is an important objective
FERC-Regulated
Electric
Transmission
Electric
Transmission
› 2009 earned composite return on equity of 12.52%
› Proven ability to partner reaching beyond service territory
› New England renewable portfolio standards driving need for major transmission build
Note: (1) CAGRs calculated based on annual average rate base from 2010-2015
(2) Based on share price of $28.41 as of October 25, 2010
Attractive Regulated
Utility
Utility
› Proven ability to earn allowed electric return
› Highly experienced with Connecticut regulatory proceedings
› Constructive long-term rate plan in Massachusetts comes with acquisition

29
EEI Nov. 2010
Q&A

30
EEI Nov. 2010
Appendix

31
EEI Nov. 2010
Pending Acquisition of SCG, CNG and Berkshire
Description
› Acquisition of three regulated gas LDCs owned by Iberdrola USA with
approximately 366,000 customers(1) announced on May 25, 2010
approximately 366,000 customers(1) announced on May 25, 2010
» Southern Connecticut Gas - 173,000 customers(1)
» Connecticut Natural Gas - 158,000 customers(1)
» Berkshire Gas Company - 35,000 customers(1)
Purchase Price
› $1,296M less net debt of approximately $411M for an expected cash payment at
closing of approximately $885M, subject to post closing adjustments
closing of approximately $885M, subject to post closing adjustments
Tax Treatment
Financing Plan
ü Completed $524M equity issuance, 20.355 million shares @ $25.75
ü Issued $450M of 4.625%UIL Holdings senior unsecured debt
Note: (1) As of 6/30/10.
› UIL expects to realize transaction related tax benefits of approximately
$135M on a net present value basis (19 year schedule)
$135M on a net present value basis (19 year schedule)
» Front-end loaded with over half of the expected benefits realized in the first
six years following closing due to accelerated tax depreciation on the
majority of the tax write-up
six years following closing due to accelerated tax depreciation on the
majority of the tax write-up
» $20M of cash tax benefit expected in the first year following closing (2011)
Status Update
› Connecticut Department of Public Utility Control (DPUC) à filed 7/16; hearings concluded; draft
decision received 10/27, final decision expected 11/10
decision received 10/27, final decision expected 11/10
ü Massachusetts Department of Public Utilities (DPU) à 8/31 ruling stating DPU approval not required
under Massachusetts law à 9/20 Massachusetts AG filed motion for reconsideration àUIL/Iberdrola joint
response filed 10/4
under Massachusetts law à 9/20 Massachusetts AG filed motion for reconsideration àUIL/Iberdrola joint
response filed 10/4
ü HSR (Hart-Scott-Rodino) à expired without comment
ü No shareowner vote required
› If the DPUC draft decision is adopted as a final decision, UIL expects to close on the
acquisition of the gas companies in mid-November
acquisition of the gas companies in mid-November
32
EEI Nov. 2010
› Connecticut Department of Public Utility Control (DPUC)
› Distribution currently operating under 2 year rate plan with full revenue decoupling pilot*
› Allowed ROE of 8.75%, based on a capital structure of 50.0% equity
› Federal Energy Regulatory Commission (FERC)
› Transmission trued up on an annual basis to allowed composite ROE based on FERC approved formula rate
› 2010 composite ROE of approximately 12.4%-12.5%, based on a capital structure of 50.0% equity
› DPUC Contracts for Differences with CL&P (subsidiary of Northeast Utilities) and cost sharing agreement (80% CL&P /
20% UI)
20% UI)
› Allowed ROE has a lifetime floor of 9.75% based on a capital structure of 50.0% equity
› Connecticut Department of Public Utility Control (DPUC)
› 2009 Rate Case decision is under appeal and has been stayed pending determination of the appeal
› Currently operating under old rates with embedded overearnings credit - new rates per rate case virtually the same as old
rates currently in place
rates currently in place
› Allowed ROE of 9.26%, based on a capital structure of 52.0% equity
› Massachusetts Department of Public Utilities (DPU)
› 10 year constructive rate plan expiring 1/31/12
› Rates adjusted annually based on inflation and other factors
32
Regulatory Overview
Distribution
Transmission
(1) The revenue decoupling mechanism was allowed to continue until the Department issues its
final ruling in 2011 on the evaluation of this adjustment mechanism.
final ruling in 2011 on the evaluation of this adjustment mechanism.
› Connecticut Department of Public Utility Control (DPUC)
› 2009 Rate Case decision is under appeal and has been stayed pending determination of the appeal
› Currently operating under old rates with embedded overearnings credit - new rates per rate case virtually the same as old
rates currently in place
rates currently in place
› Allowed ROE of 9.31%, based on a capital structure of 52.5% equity
33
EEI Nov. 2010
33
|
|
2009
|
|
6 Months Ended June 30, 2010
|
||||
|
($M)
|
UIL
|
Target
|
Pro Forma (1)
|
|
UIL
|
Target
|
Pro Forma (1)
|
|
Gross Margin
|
$563
|
$323
|
$887
|
|
$298
|
$187
|
$486
|
|
Adjusted EBITDA (2)
|
$220
|
$128
|
$348
|
|
$113
|
$92
|
$212
|
|
Adjusted Net Income (2)
|
$54
|
||||||
|
Average Basic Shares
Outstanding (000s) |
28,027
|
|
45,548
|
|
30,037
|
|
47,558
|
|
Adjusted Net Income per
Basic Share |
$1.94
|
NA
|
$1.74
|
|
$0.87
|
NA
|
$1.23
|
|
Long-Term Debt
|
|
|
|
|
$676
|
$378
|
$1,490
|
Summary Pro Forma Financials
Note: (1) Assumes $436M of debt acquisition financing with 4.50% coupon, and $475M of equity acquisition financing issued at August 17, 2010 price of $27.11; does not include any expected savings
(2) Non-GAAP financial measure. For a reconciliation to net income on next 2 slides.
Amounts may not add due to rounding.

34
EEI Nov. 2010
34
Net Income to Adjusted EBITDA Reconciliation
|
|
UIL Holdings
|
Target
|
Pro Forma
|
|||
|
($M)
|
FY 2009
|
Six Months
Ended June 30, 2010 |
FY 2009
|
Six Months
Ended June 30, 2010 |
FY 2009
|
Six Months
Ended June 30, 2010
|
|
Net Income (GAAP)
|
$54
|
$26
|
$25
|
($235)
|
$67
|
($211)
|
|
Adjustments
|
|
|
|
|
|
|
|
Interest Expense, Net
|
$40
|
$21
|
$35
|
$16
|
$95
|
$47
|
|
Income Tax Expense
|
33
|
19
|
4
|
25
|
29
|
42
|
|
Depreciation and Amortization
|
98
|
54
|
46
|
24
|
144
|
78
|
|
Other Deductions / (Income)
|
(6)
|
(8)
|
(3)
|
(5)
|
(8)
|
(13)
|
|
One-Time Adjustments
|
|
|
|
|
|
|
|
Goodwill Impairment
|
$-
|
$-
|
$-
|
$271
|
$-
|
$271
|
|
Workforce Separation Costs
|
-
|
-
|
2
|
(2)
|
2
|
(2)
|
|
Expenses Related to Retirement and Insurance
Plans |
-
|
-
|
13
|
(2)
|
13
|
(2)
|
|
Expense Allocations from Parent and
Miscellaneous Items |
-
|
-
|
6
|
-
|
6
|
-
|
|
Total Pre-tax Adjustments
|
$166
|
$87
|
$103
|
$327
|
$281
|
$422
|
|
Adjusted EBITDA
|
$220
|
$113
|
$128
|
$92
|
$348
|
$212
|
Amounts may not add due to rounding.
Source: Adjustments based on notes in audited financial statements and financials provided by Iberdrola USA management.
34

35
EEI Nov. 2010
35
Adjusted Net Income Reconciliation
|
|
UIL Holdings
|
Target
|
Pro Forma
|
|||
|
($M)
|
FY 2009
|
Six Months
Ended June 30, 2010 |
FY 2009
|
Six Months
Ended June 30, 2010 |
FY 2009
|
Six Months
Ended June 30, 2010
|
|
Net Income (GAAP)
|
$54
|
$26
|
$25
|
($235)
|
$67
|
($211)
|
|
One-Time Adjustments
|
|
|
|
|
|
|
|
Goodwill Impairment
|
$-
|
$-
|
$-
|
$271
|
$-
|
$271
|
|
Workforce Separation Costs
|
-
|
-
|
1
|
(1)
|
1
|
(1)
|
|
Expenses Related to Retirement and Insurance
Plans |
-
|
-
|
7
|
(1)
|
7
|
(1)
|
|
Expense Allocations from Parent and
Miscellaneous Items |
-
|
-
|
4
|
-
|
4
|
-
|
|
Total After-tax Adjustments
|
$-
|
$-
|
$12
|
$269
|
$12
|
$269
|
|
Adjusted Net Income
|
$54
|
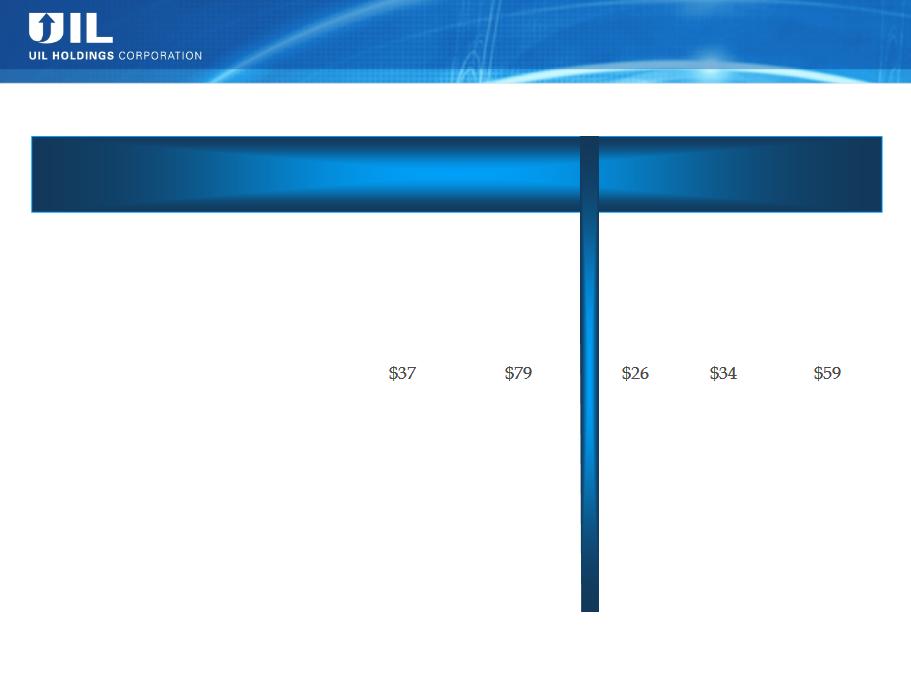
$26
|
$37
|
$34
|
$79
|
$59
|
Amounts may not add due to rounding.
Source: Adjustments based on notes in audited financial statements and financials provided by Iberdrola USA management.
36
EEI Nov. 2010
* Equity investment - Devon plant now operating, Middletown expected operation June 2011.
Amounts may not add due to rounding.
Indentified projects with clear need and regulatory support
Explanations to Previous Plan
› Distribution
» 2 additional substation rebuilds
» Increases in IT related/Core Support
› Transmission
» Timing and amount of NEEWS investments
» 2 additional substation rebuilds
($ in millions)
UI Base 10-yr CapEx
Current Plan vs. Previous Plan
Current Plan vs. Previous Plan

37
EEI Nov. 2010
Connecticut RPS Requirements
(Percentage of Retail Load)
Class 1 resources include energy derived from solar, wind, fuel cell, methane gas from landfills, ocean thermal, wave,
tidal, run-of-river hydropower (<5MW, began operation after July 1, 2003), sustainable biomass (NOx emission <0.075
lbs/MMBtu of heat input)
tidal, run-of-river hydropower (<5MW, began operation after July 1, 2003), sustainable biomass (NOx emission <0.075
lbs/MMBtu of heat input)
Class 2 resources include other biomass (NOx emission <0.2 lbs/MMBtu of heat input, began operation before July 1,
1998), small run-of-river hydroelectric (<5MW, began operation before July 1, 2003) and municipal solid waste trash-to-
energy facilities.
1998), small run-of-river hydroelectric (<5MW, began operation before July 1, 2003) and municipal solid waste trash-to-
energy facilities.
Class 3 include customer-sited combined heat and power (with operating efficiency >50% of facilities installed after
January 1, 2006), waste heat recovery systems (installed on or after April 1, 2007), electricity savings from conservation
and load management programs (began on or after January 1, 2006)
January 1, 2006), waste heat recovery systems (installed on or after April 1, 2007), electricity savings from conservation
and load management programs (began on or after January 1, 2006)
CT RPS Requirements
38
EEI Nov. 2010
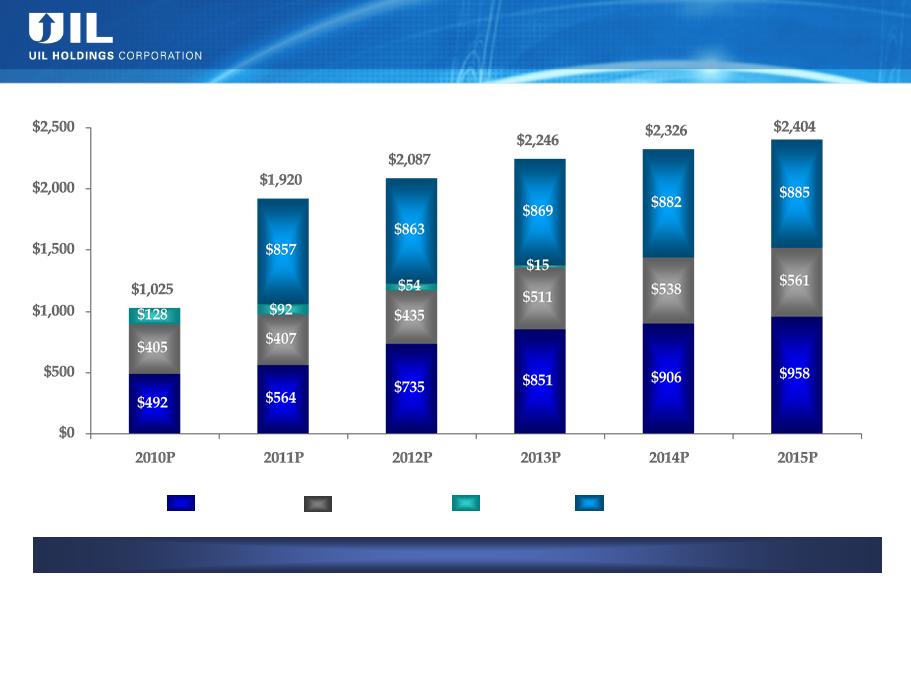
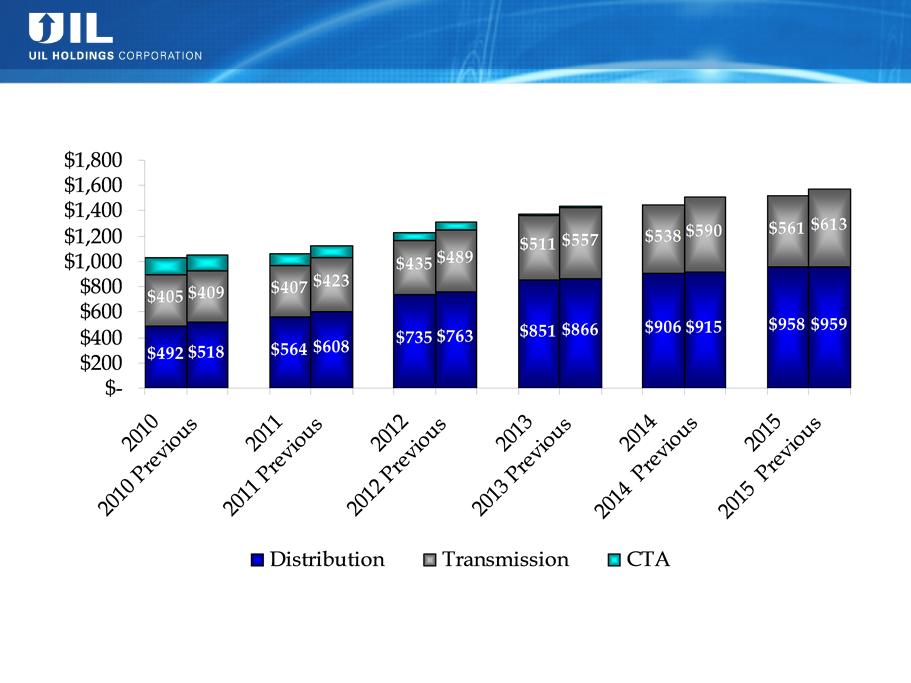
($M)
* CTA Avg Rate Base figures unchanged from previous forecast -- $128M ’10, $92 ’11, $54M ’12 and $15M ‘13
*
$1,025
$1,055
$1,063
$1,123
$1,224
$1,307
$1,377
$1,438
$1,444
$1,505
$1,519
$1,572
UI Avg Rate Base 2010 - 2015
Current Forecast vs. Previous Forecast
Current Forecast vs. Previous Forecast

39
EEI Nov. 2010
UI Distribution Avg Rate Base 2010 - 2015
Current Forecast vs. Previous Forecast Bridge
Current Forecast vs. Previous Forecast Bridge
Explanations
› Shift in IT-related Core Support CapEx timing coupled with increased Aging
Infrastructure expenditures
Infrastructure expenditures
› Tax Repairs and Maintenance election - approx. $36M of cash tax benefit in 2010,
increased Accumulated Deferred Income Tax rate base offset
increased Accumulated Deferred Income Tax rate base offset
› Expected 2011 Pension contribution of $45-$50M up from previous estimate of $21M

40
EEI Nov. 2010
($ in millions)
Transmission Average Rate Base
Current vs. Previous Forecast
2010
Current
vs.
Previous
2011
Current
vs.
Previous
2012
Current
vs.
Previous
2013
Current
vs.
Previous
2014
Current
vs.
Previous
2015
Current
vs.
Previous
Plant In Service
(3)
$
(9)
$
(43)
$
(37)
$
(42)
$
(43)
$
Accum Depreciation
(1)
$
(1)
$
(6)
$
(4)
$
(6)
$
(6)
$
Accum Def Income Taxes
(1)
$
(5)
$
(5)
$
(5)
$
(4)
$
(3)
$
Other
1
$
(1)
$
(1)
$
(1)
$
(1)
$
(1)
$
Total Transmission Avg Rate Base
UI Transmission Avg Rate Base 2010 - 2015
Current Forecast vs. Previous Forecast Bridge
Current Forecast vs. Previous Forecast Bridge
Explanations
› Shift in timing and overall amount of NEEWS investment
» New in-service dates for Interstate (2015) and CCRP (2016) reflect regional and state review processes
› Shift in timing and overall amount of Pequonnock 115kV Fault Duty Mitigation project
› Tax Repairs and Maintenance election - approx. $4M of cash tax benefit in 2010,
increased Accumulated Deferred Income Tax rate base offset
increased Accumulated Deferred Income Tax rate base offset

41
EEI Nov. 2010
41
GenConn Energy LLC
› 50/50 debt/equity
Status
› On 7/30/10, the 2011 revenue requirement
application for both the Devon and
Middletown facilities was filed with the DPUC
application for both the Devon and
Middletown facilities was filed with the DPUC
› Final regulatory review of construction costs
will be part of 2013 revenue requirement
proceeding
will be part of 2013 revenue requirement
proceeding
Financing