Attached files
| file | filename |
|---|---|
| 8-K - SUNOCO LOGISTICS PARTNERS LP--FORM 8-K - Energy Transfer Operating, L.P. | d8k.htm |
| EX-99.1 - PRESS RELEASE - Energy Transfer Operating, L.P. | dex991.htm |
 Third Quarter 2010
Earnings Conference Call
October 28, 2010
Sunoco Logistics Partners L.P.
Exhibit 99.2 |
 Forward-Looking Statement
You should review this slide presentation in conjunction with the third
quarter 2010 earnings conference call for Sunoco Logistics
Partners L.P., held on October 28 at 8:30 a.m. EDT. You may listen to
the
audio
portion
of
the
conference
call
on
our
website
at
www.sunocologistics.com
or
by
dialing
(USA
toll-
free) 1-888-889-4955. International callers should dial
1-312-470-0130. Please enter Conference ID
“Sunoco Logistics”.
Audio replays of the conference call will be available for two weeks
after the conference call beginning approximately two hours
following the completion of the call. To access the replay, dial 1-800-294-7481.
International callers should dial 1-203-369-3233.
During the call, those statements we make that are not historical facts
are forward-looking statements. Although we believe the
assumptions underlying these statements are reasonable, investors are
cautioned that such forward-looking statements involve risks that may
affect our business prospects and performance, causing actual
results to differ from those discussed during the conference call. Such risks
and uncertainties include, among other things: our ability to
successfully consummate announced acquisitions
and
organic
growth
projects
and
integrate
them
into
existing
business
operations;
the
ability
of
announced acquisitions to be cash-flow accretive; increased
competition; changes in the demand both for crude oil that we buy
and sell, as well as for crude oil and refined products that we store and distribute; the
loss of a major customer; changes in our tariff rates; changes in
throughput of third-party pipelines that connect to our
pipelines and terminals; changes in operating conditions and costs; changes in the level of
environmental remediation spending; potential equipment malfunction;
potential labor relations problems; the legislative or regulatory
environment; plant construction/repair delays; and political and economic
conditions,
including
the
impact
of
potential
terrorist
acts
and
international
hostilities.
These and other applicable risks and uncertainties are described
more fully in our Form 10-Q, filed
with the Securities and Exchange Commission in August 2010. We
undertake no obligation to update publicly any forward-looking
statements whether as a result of new information or future events.
2 |
 Q3 2010 Assessment
Increased total distribution to $1.17 ($4.68 annualized)
per unit, a 10 percent increase over the prior year’s
distribution
•
Represents the twenty-second consecutive
distribution increase
Distributable cash flow for the third quarter of 2010 was
$70 million compared to $54 million in the prior year
Completed acquisitions totaling $243 million
3 |
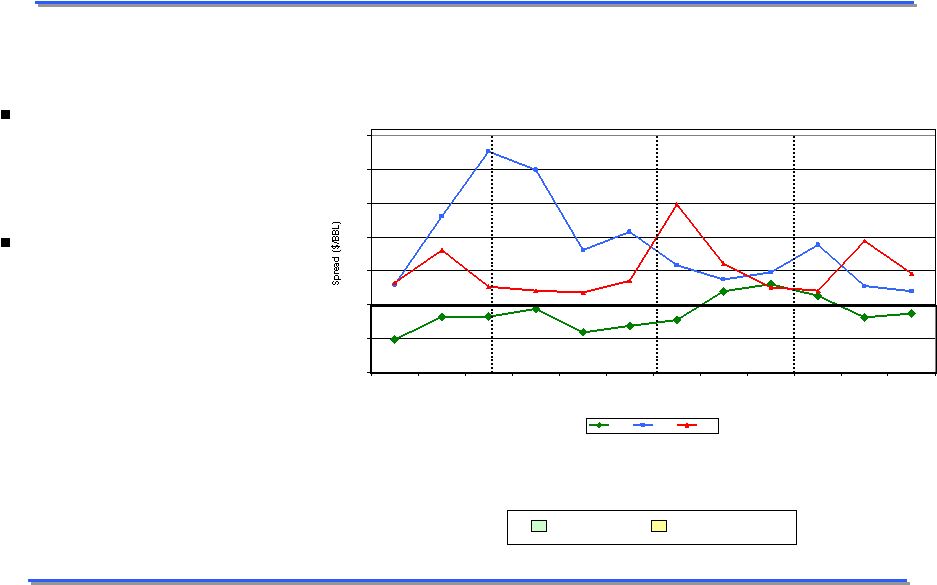  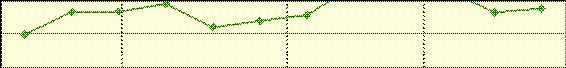   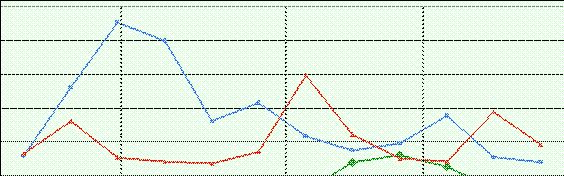  Crude Oil Contango
Widened contango market
structure provided strong
earnings in the third quarter
While the contango market
has come off from the very
strong early 3Q levels, we
do have a contango
investment at September 30
of approximately $215MM
to take advantage of fourth
quarter opportunities
4
Backwardation
Contango
WTI NYMEX Month 2 vs. Month 1
-2
-1
0
1
2
3
4
5
Jan
Feb
Mar
Apr
May
Jun
Jul
Aug
Sep
Oct
Nov
Dec
Month
2008
2009
2010 |
 YTD 2010 Operating Performance
Continued solid performance by our asset base supplemented by:
•
Crude contango market opportunities
•
Contribution from 2010 and 2009 organic growth projects
including: Expanded services at refined products terminals
Expansion program at Nederland facility
•
Contributions from recent acquisitions
Through the first three quarters of 2010, operating performance as
expected •
Distribution decisions exclude market related activities
•
Will continue to take advantage of market related opportunities when
available
5 |
 2010 Growth -
Acquisitions
Acquired
Butane
Blending
Business
–
Third
Quarter
•
Enhances terminal service offerings
•
Tremendous growth potential: actively working to increase installations
at key terminals and third-party locations
Acquired
Three
Additional
Joint
Venture
Interests
–
Third
Quarter
•
Joint venture assets are an excellent fit with Sunoco Logistics asset
base Acquired
Terminal
in
Bay
City,
Texas
–
Fourth
Quarter
•
110 thousand barrel terminal expands the lease crude gathering business
and provides an opportunity to continue our growth in southwest
refined products
6 |
 2010 Growth -
Organic
Agreement with TransCanada
•
Provide access to Nederland for their Keystone XL project
Project Mariner with MarkWest
•
Economical solution of transporting ethane from Marcellus Shale to
market •
Excellent growth potential for fee based income
Nederland Tank Expansion
•
Two additional tanks to bring capacity to 22 MMB
Investment in Biodiesel at 11 terminals
7 |
 Q3 2010 Financial Highlights
($ in millions, unaudited)
8
Three Months Ended
Nine Months Ended
September 30,
September 30,
2010
2009
2010
2009
Sales and other operating revenue
1,876.2
$
1,420.0
$
5,585.5
$
3,740.8
$
Other income
7.2
8.8
24.4
21.3
Total revenues
1,883.4
1,428.8
5,609.9
3,762.1
Cost of products sold and operating expenses
1,762.4
1,342.0
5,296.2
3,450.5
Depreciation and amortization
16.4
12.2
44.9
35.3
Selling, general and administrative expenses
15.6
14.7
51.8
47.6
Total costs and expenses
1,794.4
1,368.9
5,392.9
3,533.4
Operating income
89.0
59.9
217.0
228.7
Interest cost and debt expense
20.9
12.6
57.0
36.3
Capitalized interest
(1.2)
(1.2)
(3.2)
(3.6)
Gain on investments in affiliates
128.5
-
128.5
-
Income before provision for income taxes
197.8
$
48.5
$
291.7
$
196.0
$
Provision for income taxes
3.8
-
3.8
-
Net Income
194.0
$
48.5
$
287.9
$
196.0
$
Net income attributable to noncontrolling
interests
1.1
-
1.1
-
Net Income attributable to Sunoco Logistics
Partners L.P.
192.9
$
48.5
$
286.8
$
196.0
$ |
 Q3 2010 Financial Highlights
9
(amounts in millions, except unit and per unit amounts, unaudited)
Three Months Ended
Nine Months Ended
September 30,
September 30,
2010
2009
2010
2009
Calculation of Limited Partners' interest:
Net Income attributable to Sunoco Logistics
Partners L.P.
192.9
$
48.5
$
286.8
$
196.0
$
Less: General Partner's interest
(14.7)
(13.4)
(35.5)
(38.9)
Limited Partners' interest in Net Income
178.2
$
35.1
$
251.3
$
157.1
$
Net Income per Limited Partner unit:
Basic
5.60
$
1.13
$
8.03
$
5.22
$
Diluted
5.57
$
1.13
$
7.99
$
5.19
$
Weighted Average Limited Partners' units
outstanding (in thousands):
Basic
31,797
30,981
31,291
30,085
Diluted
31,955
31,190
31,463
30,288
|
 Q3 2010 Financial Highlights
10
Three Months Ended
Nine Months Ended
September 30,
September 30,
2010
2009
2010
2009
Refined Products Pipeline System
13.2
$
13.3
$
33.4
$
34.5
$
Terminal Facilities
23.6
20.7
74.0
63.1
Crude Oil Pipeline System
52.2
25.9
109.6
131.1
Total
89.0
$
59.9
$
217.0
$
228.7
$
Operating income ($ in millions,
unaudited) |
 Refined Products Pipeline System
($ in millions, unaudited)
11
Three Months Ended
Nine Months Ended
September 30,
September 30,
2010
2009
2010
2009
Financial Highlights
Sales and other operating revenue
29.7
$
32.0
$
90.2
$
94.6
$
Other income
5.5
3.9
11.4
9.2
Total revenues
35.2
35.9
101.6
103.8
Operating expenses
13.5
14.4
40.2
43.7
Depreciation and amortization
3.6
3.2
11.1
9.6
Selling, general and administrative expenses
4.9
5.0
16.9
16.0
Operating income
13.2
$
13.3
$
33.4
$
34.5
$
|
 Terminal Facilities
($ in millions, unaudited)
12
Three Months Ended
Nine Months Ended
September 30,
September 30,
2010
2009
2010
2009
Financial Highlights
Total Revenues
58.9
$
46.2
$
173.2
$
140.8
$
Cost of products sold and operating expenses
22.7
15.7
63.9
48.4
Depreciation and amortization
7.3
5.2
18.6
14.5
Selling, general and administrative expenses
5.4
4.6
16.8
14.8
Operating income
23.6
$
20.7
$
74.0
$
63.1
$
|
 Crude Oil Pipeline System
13
($ in millions, unaudited)
Three Months Ended
Nine Months Ended
September 30,
September 30,
2010
2009
2010
2009
Financial Highlights
Sales and other operating revenue
1,787.5
$
1,341.9
$
5,322.8
$
3,506.8
$
Other income
1.7
4.9
12.3
10.7
Total revenues
1,789.2
1,346.8
5,335.1
3,517.5
Cost of products sold and operating expenses
1,726.1
1,311.9
5,192.2
3,358.4
Depreciation and amortization
5.5
3.9
15.2
11.2
Selling, general and administrative expenses
5.4
5.1
18.1
16.8
Operating income
52.2
$
25.9
$
109.6
$
131.1
$ |
 Q3 2010 Operating Highlights
14
Three Months Ended
Nine Months Ended
September 30,
September 30,
2010
2009
2010
2009
Operating
highlights
(unaudited)
Refined Products Pipeline System:
Total
shipments
(barrel
miles
per
day)
(1)(2)
50,411,601
56,848,807
51,253,071
58,145,900
Revenue per barrel mile (cents)
0.641
0.612
0.645
0.596
Terminal Facilities:
Refined products terminals throughput (bpd)
505,465
465,206
483,966
462,969
Nederland terminal throughput (bpd)
780,313
559,874
730,551
619,297
Refinery terminals throughput (bpd)
459,174
609,020
475,897
597,191
Crude Oil Pipeline System:
Crude
oil
pipeline
throughput
(bpd)
(2)(3)
1,556,365
610,856
1,501,307
648,183
Crude oil purchases at wellhead (bpd)
187,953
176,643
187,779
183,047
Gross
margin
per
barrel
of
pipeline
throughput
(cents)
(3)(4)
46.4
46.4
41.5
77.6
Average crude oil price (per barrel)
76.21
$
68.29
$
77.65
$
57.13
$
(1)
(2)
(3)
(4)
Represents total average daily pipeline throughput multiplied by the
number of miles of pipeline through which each barrel has been shipped.
Excludes amounts attributable to equity ownership interests which are
not consolidated. Includes 602 thousand bpd from the
Partnership's consolidation of Mid-Valley Pipeline Company and West Texas Gulf Pipe Line Company from the acquisition date.
Represents total segment sales and other operating revenue minus cost
of products sold and operating expenses and depreciation and amortization divided by crude oil pipeline throughput. Gross
margin and throughput volumes for Mid-Valley Pipeline Company and
West Texas Gulf Pipe Line Company have been included from the acquisition date. |
 Q3 2010 Financial Highlights
15
($ in millions, unaudited)
Three Months Ended
Nine Months Ended
September 30,
September 30,
2010
2009
2010
2009
Capital Expenditure Data:
Maintenance capital expenditures
10.7
$
6.3
$
25.0
$
15.3
$
Expansion capital expenditures
269.2
82.1
331.1
143.5
Total
279.9
$
88.4
$
356.1
$
158.8
$
September 30,
December 31,
2010
2009
Balance Sheet Data (at period end):
Cash and cash equivalents
2.0
$
2.0
$
Total debt
(1)
1,347.8
868.4
Equity
Sunoco Logistics Partners L.P. Equity
957.5
861.6
Noncontrolling interests
78.1
-
1,035.6
$
861.6
$
(1)
Total debt includes the $100 million promissory note to Sunoco,
Inc. |
 Non-GAAP Financial Measures
($ in millions, unaudited)
16
Non-GAAP Financial Measures
(1) Management
of
the
Partnership
believes
EBITDA
and
distributable
cash
flow
information
enhances
an
investor's
understanding
of
a
business’
ability
to
generate cash for payment of distributions and other purposes.
EBITDA and distributable cash flow do not represent and should not be considered an
alternative to net income or cash flows from operating activities as
determined under United States generally accepted accounting principles (GAAP) and may
not be comparable to other similarly titled measures of other
businesses. Reconciliations of these measures to the comparable GAAP measure are provided in
the tables accompanying this release.
2010
2009
2010
2009
Add: Interest expense, net
19.7
11.4
53.8
32.7
Add: Depreciation and amortization
16.4
12.2
44.9
35.3
Add: Provision for income taxes
3.8
-
3.8
-
Less: Gain on investments in affiliates
(128.5)
-
(128.5)
-
EBITDA
104.3
72.1
260.8
264.0
Less: Interest expense, net
(19.7)
(11.4)
(53.8)
(32.7)
Less: Maintenance capital expenditures
(10.7)
(6.3)
(25.0)
(15.3)
Less: Provision for income taxes
(3.8)
-
(3.8)
-
Distributable cash flow
70.1
$
54.4
$
178.2
$
216.0
$
196.0
$
286.8
$
48.5
$
192.9
$
Net Income attributable to Sunoco
Logistics Partners L.P.
Three Months Ended
Nine Months Ended
September 30,
September 30, |
 Non-GAAP Financial Measures
($ in millions, unaudited)
17
Less: Gain on investments in affiliates
(128,451)
(128,451)
Adjusted Net Income attributable to Sunoco Logistics
Partners L.P.
64,403
$
158,384
$
Less: General Partner's interest
(12,148)
(32,903)
Limited Partners' interest in Net Income
52,255
$
125,481
$
Net Income per Limited Partner unit:
Basic
1.64
$
4.01
$
Diluted
1.64
$
3.99
$
Weighted Average Limited Partners' units outstanding:
Basic
31,797,082
31,291,262
Diluted
31,955,360
31,462,963
Nine Months Ended
Net Income attributable to Sunoco Logistics Partners L.P.
Adjusted Net Income Attributable to Sunoco Logistics Partners L.P.
2010
2010
September 30,
192,854
$
286,835
$
Three Months Ended
September 30, |