Attached files
| file | filename |
|---|---|
| 8-K - FORM 8-K - Expedia Group, Inc. | d8k.htm |
| EX-99.1 - PRESS RELEASE OF EXPEDIA, INC., DATED OCTOBER 28, 2010 - Expedia Group, Inc. | dex991.htm |
 Q310 Company Overview
Q3 2010
Company Overview
Exhibit 99.2 |
 2
Q310 Company Overview
Forward-Looking Statements
This
presentation
contains
"forward-looking
statements"
within
the
meaning
of
the
Private
Securities
Litigation
Reform Act of 1995, including statements about the future financial and operational
performance of the Company. These
statements
are
not
guarantees
of
future
performance.
These
forward-looking
statements
are
based
on
management’s
expectations
as
of
October
28,
2010,
and
assumptions
which
are
inherently
subject
to
uncertainties, risks and changes in circumstances that are difficult to predict.
The use of words such as “forecast,” “opportunity,”
"intends,”
“anticipates”
and “expects," among others, generally identifies forward-looking
statements. However,
these
words
are
not
the
exclusive
means
of
identifying
such
statements.
In
addition,
any
statements
that
refer
to
expectations,
projections
or
other
characterizations
of
future
events
or
circumstances
are
forward-looking
statements and may include statements relating to future revenues, expenses,
margins, profitability, net income, earnings per share and other measures of
results of operations and the prospects for future growth of Expedia,
Inc.’s business.
Actual results and the timing and outcome of events may differ materially from
those expressed or implied in the forward-looking statements for a
variety of reasons, including, among others: continued or prolonged adverse
economic conditions leading to decreased consumer and business spending; changes in
our relationships and contractual agreements with travel suppliers or global
distribution system partners; adverse changes in senior management; the rate
of growth of online travel; our inability to recognize the benefits of our investment in
technologies; changes in the competitive environment, the e-commerce industry
and broadband access and our ability to respond to such changes; declines or
disruptions in the travel industry (including those caused by adverse
weather, bankruptcies, health risks, war and/or terrorism); the rate of online
migration in the various geographies and markets in which Expedia, Inc.
operates, including Eastern Europe and Asia; fluctuations in foreign exchange
rates; risks related to our long term indebtedness, including the ability to access
funds as and when needed; changing laws, rules and regulations and legal
uncertainties relating to our business; Expedia, Inc.’s ability to
expand successfully in international markets; possible charges resulting from,
among other events, platform migration; failure to realize cost
efficiencies; the successful completion of any future corporate transactions or
acquisitions; the integration of current and acquired businesses; and other risks
detailed in Expedia, Inc.’s public filings with the SEC, including
Expedia, Inc.’s annual report on Form 10-K for the year ended December 31, 2009
and subsequent Forms 10-Q.
Except as required by law, Expedia, Inc. undertakes no obligation to update any
forward-looking or other statements in this presentation, whether as a
result of new information, future events or otherwise. Reconciliations of
non-GAAP measures included in this presentation to the most comparable GAAP measures are
included in Appendix B. |
 Q310 Company Overview
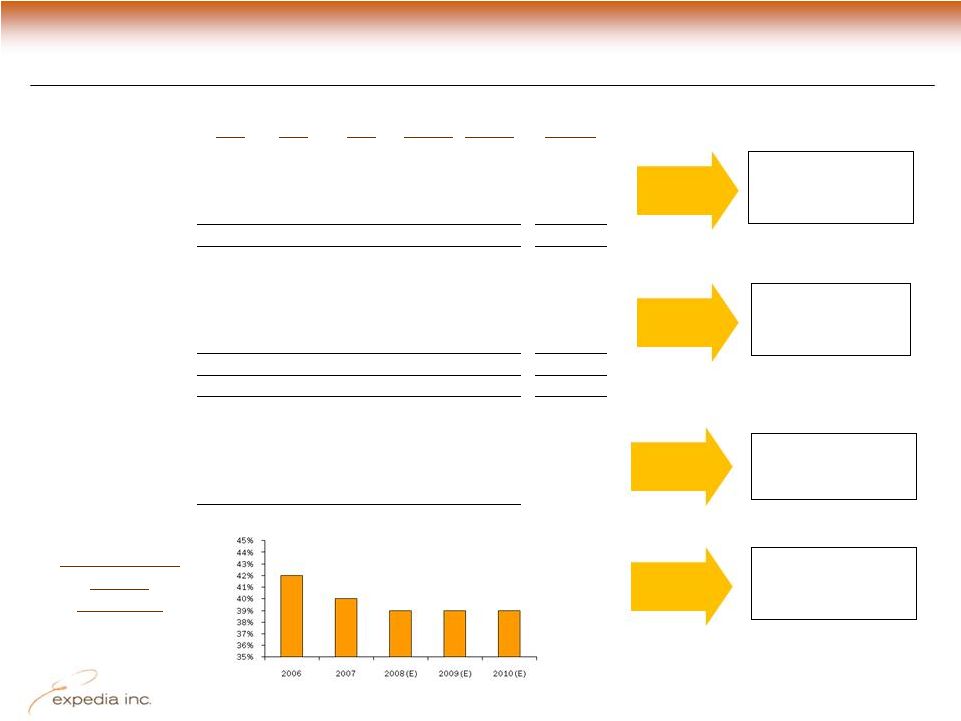
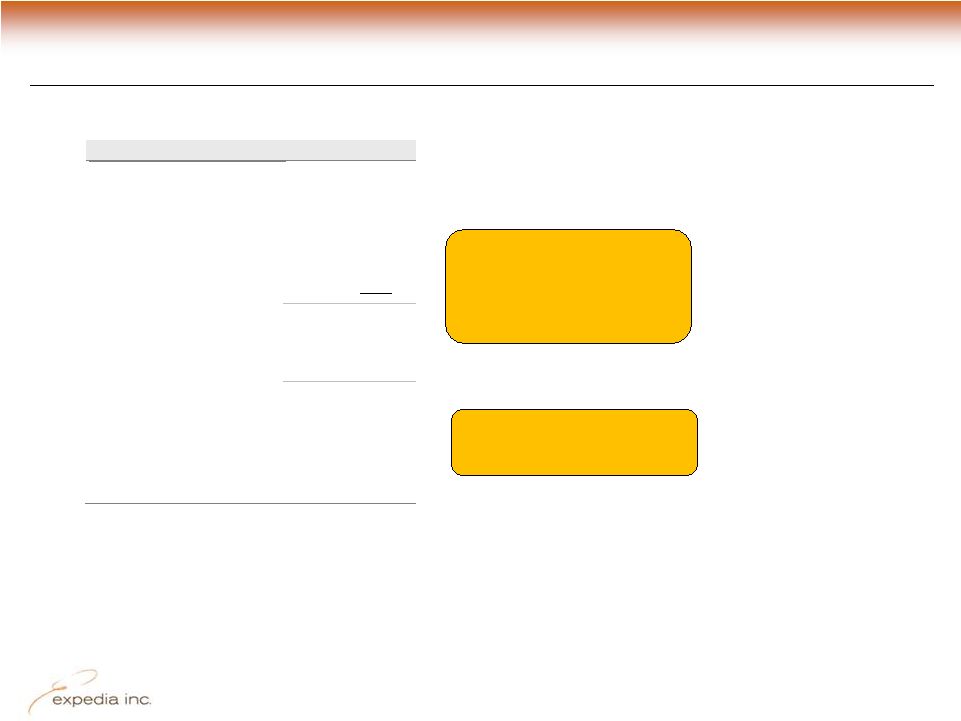
Global Opportunity
Sources:
U.S.
Online
Travel
Overview
8
Edition
Update:
2009
–
2010
(April
2009);
U.S.
Corporate
Travel
Distribution
4
Edition
(July
2009);
European
Online
Travel
Overview
5
Edition (October 2009); European figures assume Euro/USD exchange rate in each
period of
$1.40;
APAC
data
-
PhoCusWright
Asia
Pacific
Online
Travel
Overview
–
Third
Edition,
August 2009 & EyeForTravel
APAC Overview April 2007. APAC data excludes managed
travel.
Sizeable
markets
Higher growth
online
Penetration
tailwinds
OTA Share of
Online
Bookings
OTA share
stabilizing
CAGR
2006
2007
2008
2009 (E)
2010 (E)
‘06 –
‘10
Travel Market Size:
U.S.
251
264
271
241
236
-2%
Europe
320
337
334
300
299
-2%
APAC
238
244
215
202
212
-3%
3 Region Total
809
845
820
743
747
-2%
Online Bookings:
U.S.
123
138
137
135
139
3%
Europe
68
84
95
95
103
11%
APAC
21
26
31
36
44
20%
3 Region Online
212
248
263
266
286
8%
Europe & APAC
89
110
126
131
147
13%
Online Penetration:
U.S.
49%
52%
51%
56%
59%
Europe
21%
25%
28%
32%
34%
APAC
9%
11%
14%
18%
21%
3 Region Online Pen.
26%
29%
32%
36%
38%
Figures in $billions
3
th
th
th |
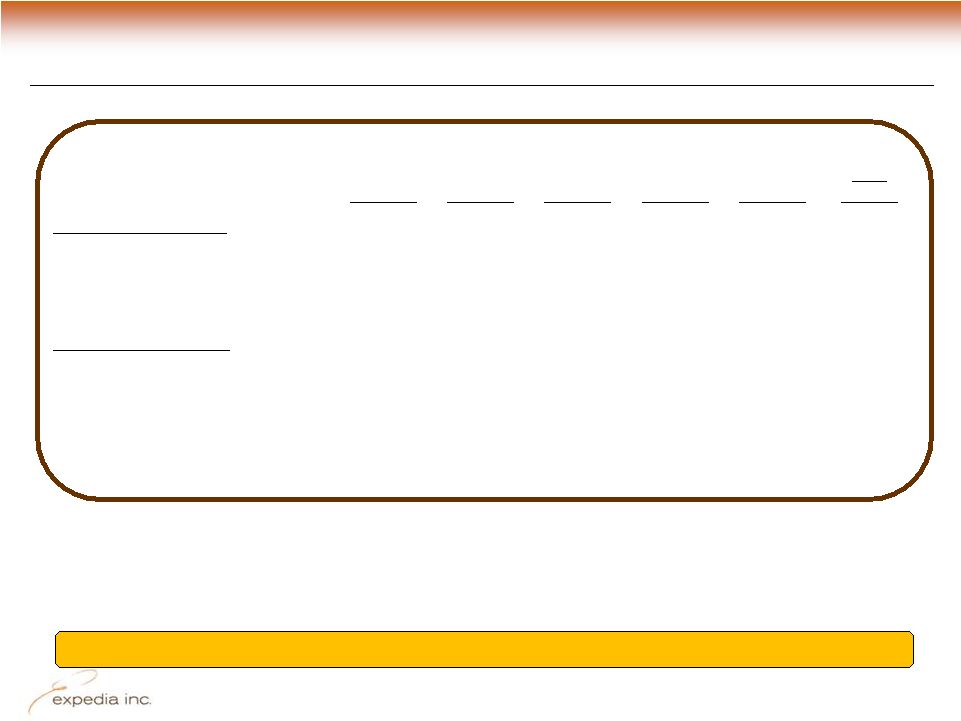
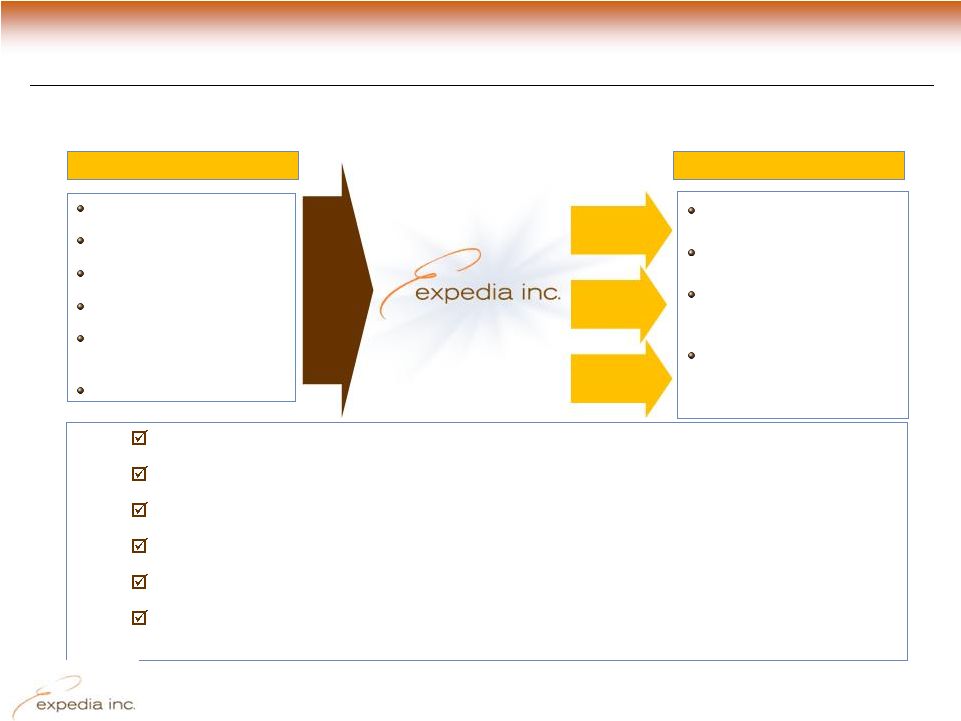 World’s Largest and Most Intelligent Travel Marketplace
Hotels
Airlines
Car rental companies
Cruise lines
Global distribution
system (GDS) partners
Advertisers
Leisure travelers
Corporate travelers
Travel service providers
(“white label”)
Offline retail travel
agents
Secure superior quality supply & maintain price competitiveness
Intelligently match supply & demand
Empower and inspire travelers to find and build the right trip
Enable suppliers to reach travelers in a unique & value-additive
way Aggressively expand our global presence & demand
footprint Achieve excellence in technology, people and processes to
make quality, consistency & efficiency the foundation of our
marketplace Suppliers
Customers
Technology
Travel info
Travel
products
4
Q310 Company Overview |
 5
Q310 Company Overview
Expedia -
the Travel Sector Leader
1
Sources:
comScore
MediaMetrix,
November,
2009
&
company
data;
2
See
Appendix B for reconciliation of non-GAAP to GAAP numbers. Adjusted
EBITDA is calculated as operating income plus depreciation,
restructuring charges, intangibles amortization, stock-based
compensation, any impairments, and certain legal reserves and
occupancy tax charges. Adj. EBITDA includes gains/(losses) from
revenue hedges. Global presence & portfolio of category leading
brands Premier
Brand
Portfolio
Leading value-based travel provider
#1
online
travel
community,
operating
in
North
America,
Europe & APAC
Key
Statistics
•
Traffic (September 2010 unique visitors):
74mm
•
TTM 9.30.10 number of transactions:
64mm
TTM 9.30.10
•Gross bookings:
$ 25.3b
•Revenue:
$ 3.2b
•OIBA
2
:
$819mm
•Adjusted EBITDA
2
$933mm
•
$7.7b market cap (October 15, 2010)
•
Member of S&P 500 & NASDAQ 100
stock indices
1
#1Online
Travel
Agency
(OTA)
globally,
with
presence
in
19 countries
Leading
hotel
specialist
globally,
with
over
70
localized sites |
 6
Q310 Company Overview
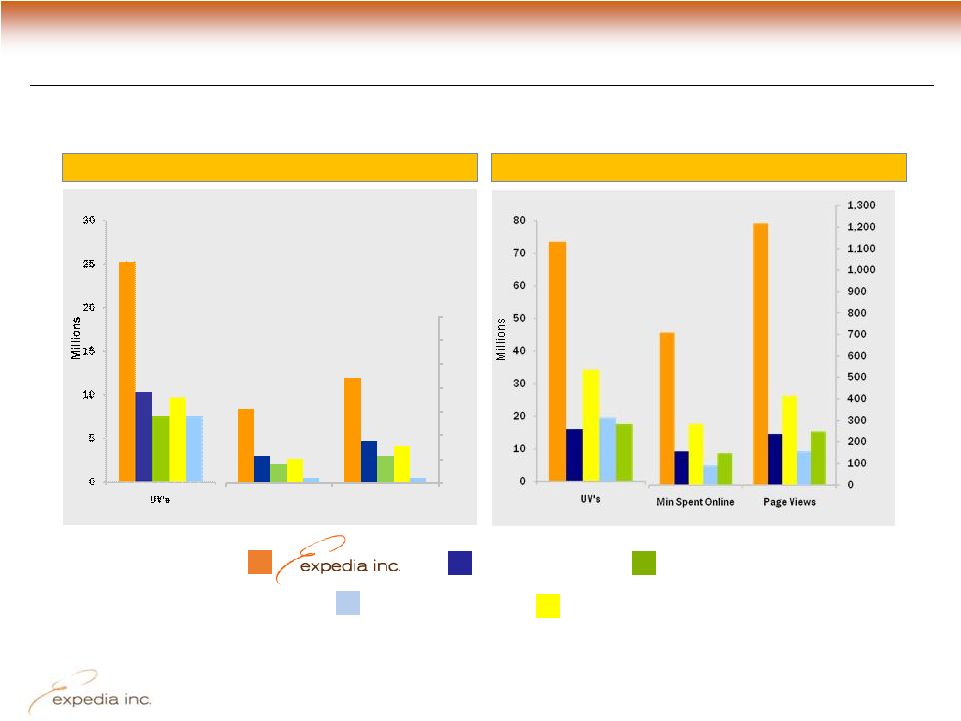
Largest Worldwide Audience
Source: comScore
MediaMetrix, September 2010
1
Denotes Expedia’s
percentage difference over next largest competitor
U.S.
Worldwide
+168%
+151%
+115%
+150%
+193%
+143%
Orbitz
Yahoo Travel
Priceline
Travelocity
0
100
200
300
400
500
600
700
Min Spent Online
Page Views
1
1
1
1
1
1 |
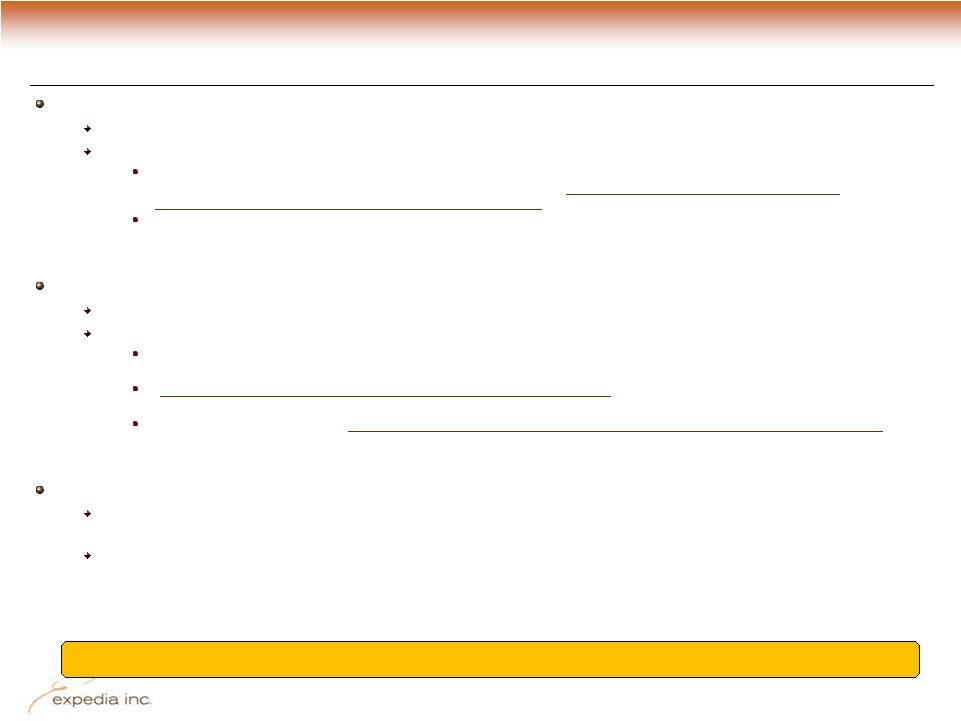
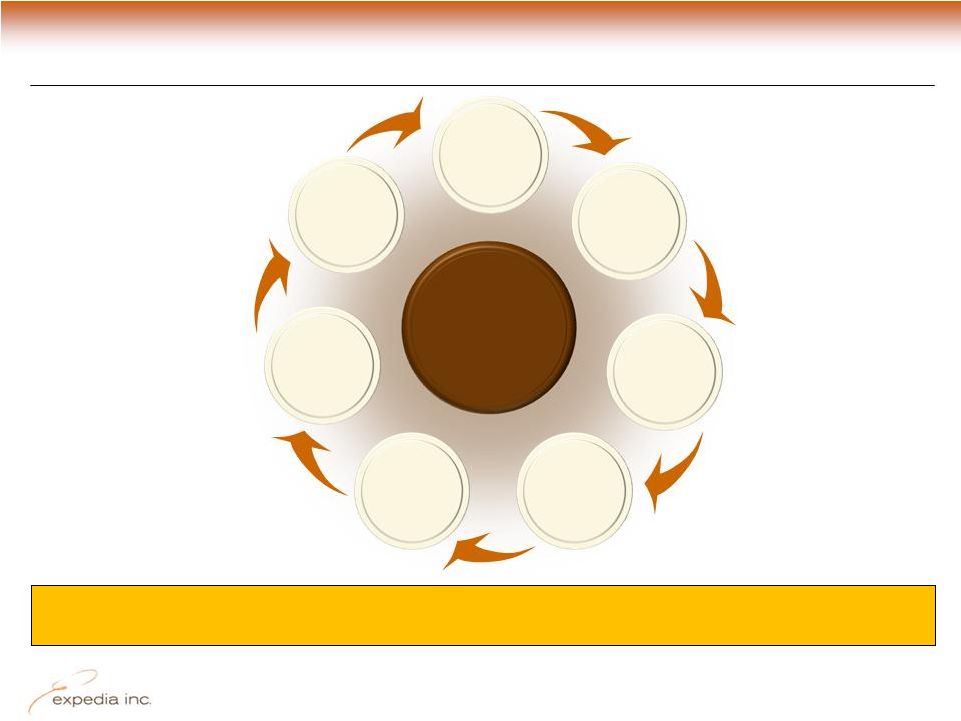 Expedia’s
Virtuous Cycle
Scale drives opportunity to enhance supplier, traveler &
advertiser value propositions, reward stakeholders
Growth/
Scale
Compelling
supplier &
advertising
channel
Better
supplier
economics
More
travelers
More ad
revenue
Improved
traveler
experience
User-
generated
content
Cash flow
to invest in
7
Q310 Company Overview |
 8
Q310 Company Overview
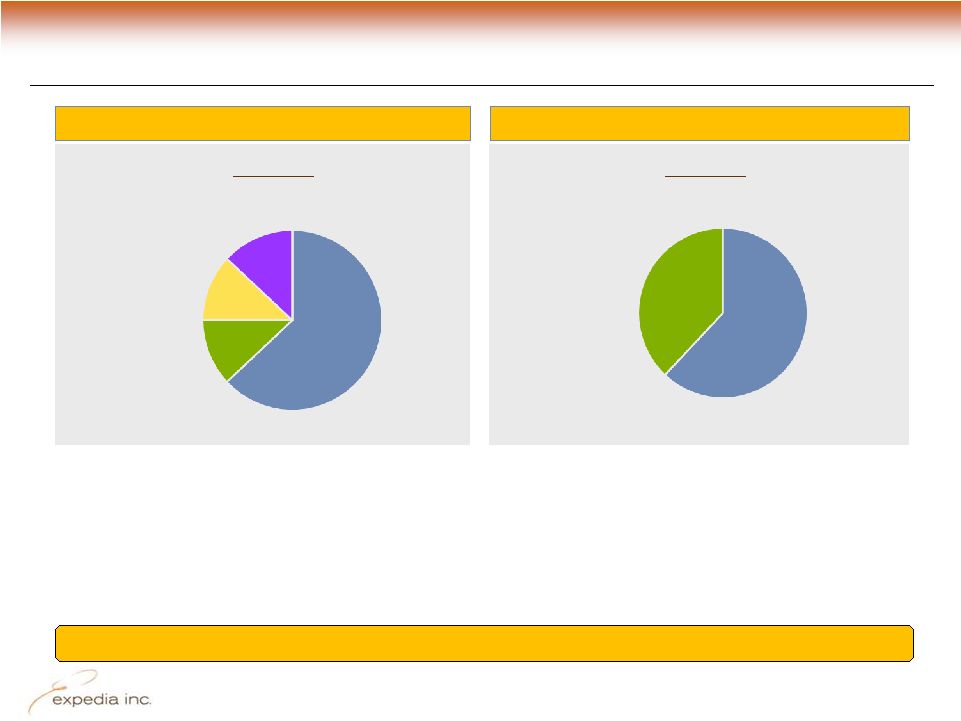
Revenue by Product & Geography
Product Categories (TTM 9.30.10)
Geographic Split (TTM 9.30.10)
Hotel
63%
Revenue
Air
12%
* Hotel & Advertising –
75% of revenue base and
key revenue / profitability drivers
* Europe & other international markets benefit
from earlier stage online penetration
* Significant international growth anticipated,
with a target of 50+% of total revenue from
international
Domestic
62%
Revenue
International
38%
Advertising
& Media
12%
Car, Cruise & Other
13%
Business mix shifting to hotel & advertising, increasingly global
Source: Company financial reports; some numbers may not add due to
rounding. |
 9
Q310 Company Overview
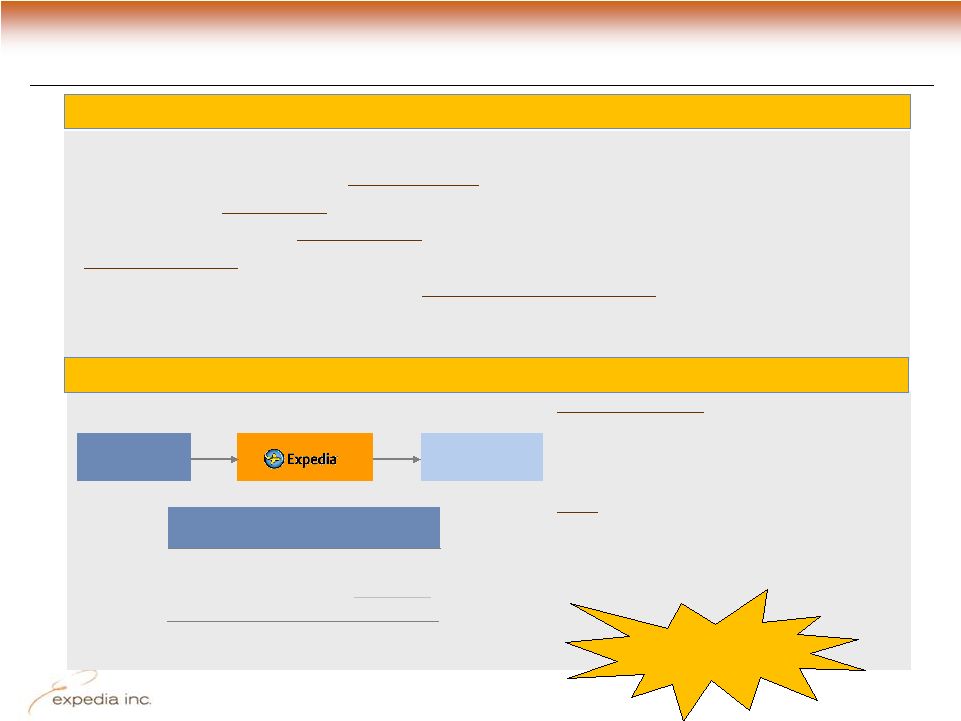
Product Category -
Hotel
Business Overview
Merchant Model / Illustrative Transaction
Hotels
(Supplier)
Travelers
Revenues to Expedia:
•Spread between the discounted rate provided
by suppliers and sales price paid by travelers
•Service fees from travelers
Other:
•Cash received on booking, revenue recognized
at stay
•Revenue margin higher than the agency model
•Merchant hotel
—Expedia
merchant
of
record
with
no
inventory
risk
—Expedia
receives
cash
upfront
from
travelers,
pays
hoteliers
several
weeks
later
—Some
control
over
pricing,
higher
margins
&
ability
to
package
with
other
products
—1
-
3
year
contracts
with
major
chain
lodging
properties
—Consultative
account
management
brings
industry
leading
intelligence
to
hoteliers
•
Agency
hotel
small
but
growing
in
importance
with
acquisition
of
Venere
&
launch
of
Expedia
Easy
Manage
Reduced E.com
service
fees beginning Apr-09
Sample Expedia Revenue:
$350 night stay at luxury hotel
Cost to Traveler
Cost to Expedia
$350
$280
Revenue
to
Expedia
1
$70
1
Includes service fee and spread |
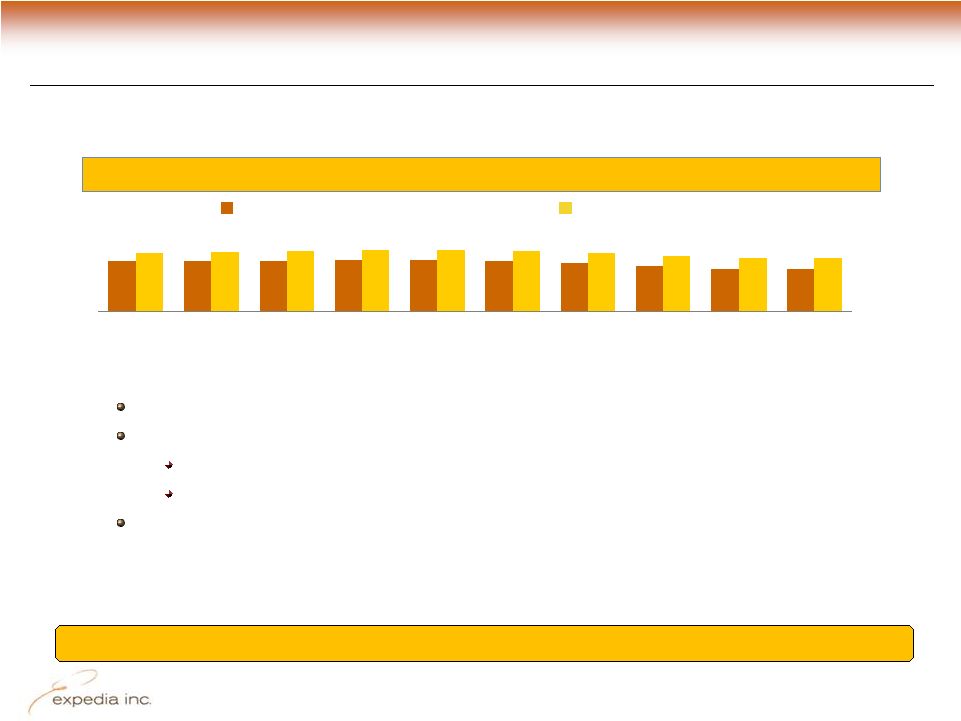
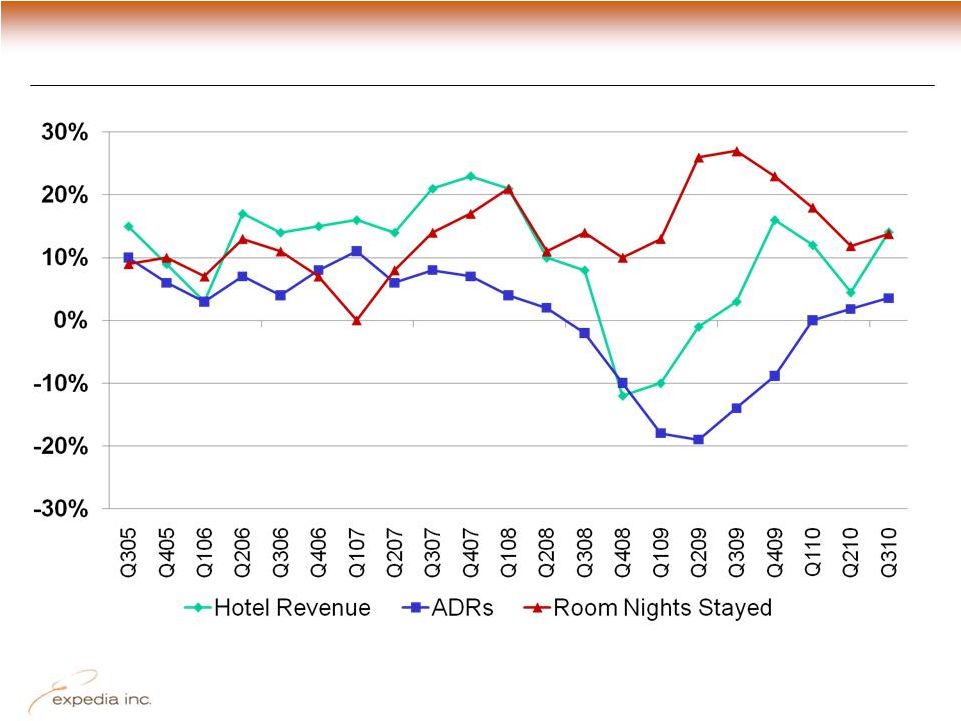 Trended Worldwide Hotel Growth Statistics (y/y)
10
Q310 Company Overview
Source: Company financial reports . 2005 – 2007 data is for merchant
hotel only; 2008 – 2010 data is for both agency and merchant hotel. |
 11
Q310 Company Overview
25.0
30.0
40.0
0.2
0.7
2.9
5.0
10.0
20.0
15.0
0
10
20
30
40
50
Travel supplier advertising on Expedia’s ww sites
Reviews with social networking
Search tool for fares
Travel blogs
European holiday reviews
Destination services, hotels & vacation rentals
Editorial info and deals
Cruise reviews & community
UGC seat maps and airline info
Guides and bargains
Vacation rental
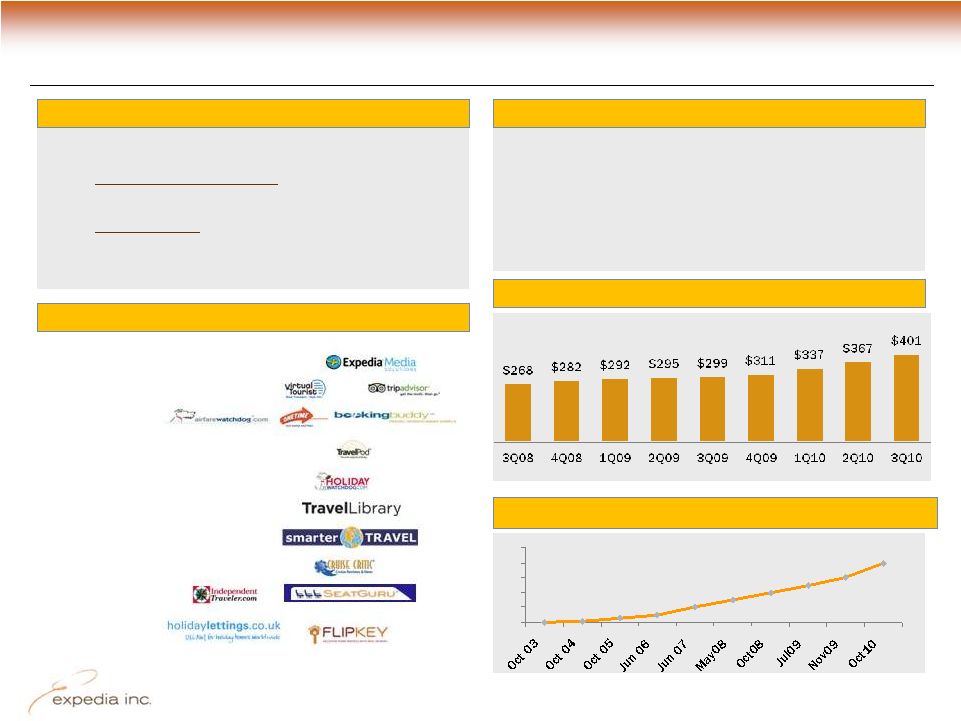
Product Category -
Advertising & Media
Ad & Media Brand Portfolio
Business Overview
•Two primary businesses –
•TripAdvisor
Media Network
(leading global collection
of user-generated content sites)
•Expedia Media (monetizing global Expedia, Hotels &
Hotwire sites beyond transactions)
•TTM revenue of $401mm, +34% y/y
TripAdvisor
TripAdvisor
Reviews & Opinions (mm)
Reviews & Opinions (mm)
•Offer advertisers targeted audiences
•CPC, CPM & subscription based ad models
•TripAdvisor
leverages industry-leading SEM & SEO
capabilities
•Robust user-generated content and selection draws in users
Growth
in
TTM
Net
Advertising
Revenues
1
1
Trailing twelve months; growth due in part to acquisitions
Revenue Drivers
Sources: Company reports
TripAdvisor
Reviews
and
Opinions
-
Robust
Growth |
 12
Q310 Company Overview
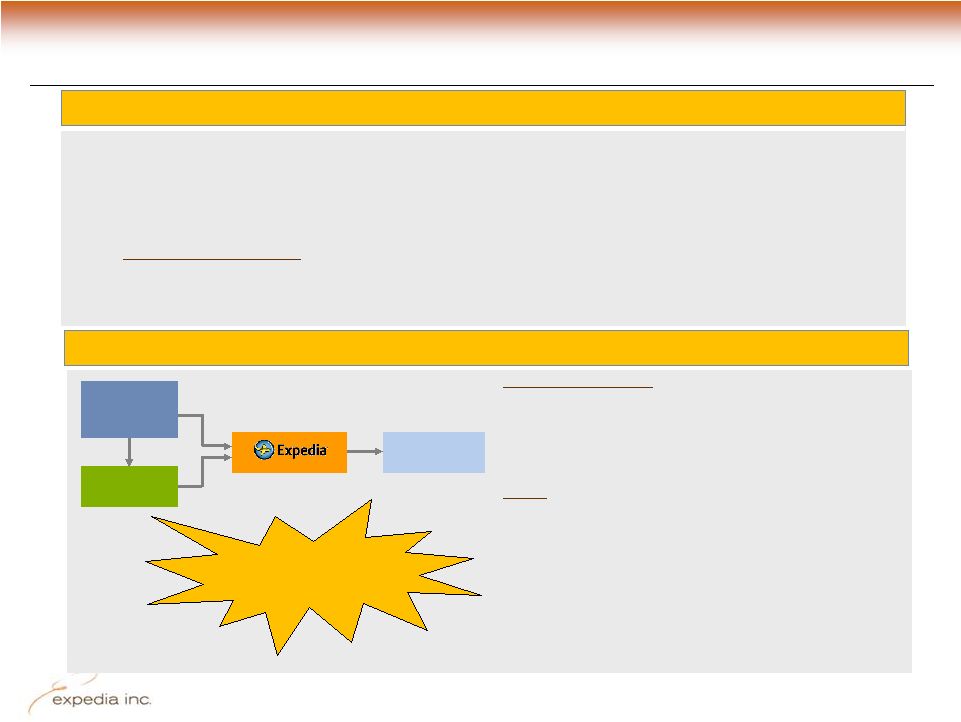
Product Category -
Air
•
Air revenue = 12% of Expedia’s
worldwide annual revenue (TTM)
-
~95% of airplane tickets sold over Expedia’s
online properties are agency transactions, in
which Expedia acts as an agent on behalf of a supplier and collects a
commission -
Customer pays supplier directly, Expedia collects its remuneration after
travel -
Lower
revenue
margin
business
vs.
hotel
transactions
•
OTAs
in U.S. eliminated most consumer booking fees for air tickets in spring
2009, resulting in reduced revenue per ticket while taking share from
offline & supplier direct Airlines
(Supplier)
GDS
Travelers
Revenue to Expedia:
•Largely unit / volume driven and includes:
•Portion of GDS fee
•Commissions & incentives from carriers
•Booking fees (some sites)
Other:
•Supplier is merchant of record
•Expedia bears no inventory risk
•Revenue recognized at booking, cash received
within weeks
•Agency model is used in other product categories,
including hotel
•Multi-GDS strategy
No online booking
fees on E.com
air tickets
Business Overview
Agency Model / Illustrative Transaction |
 13
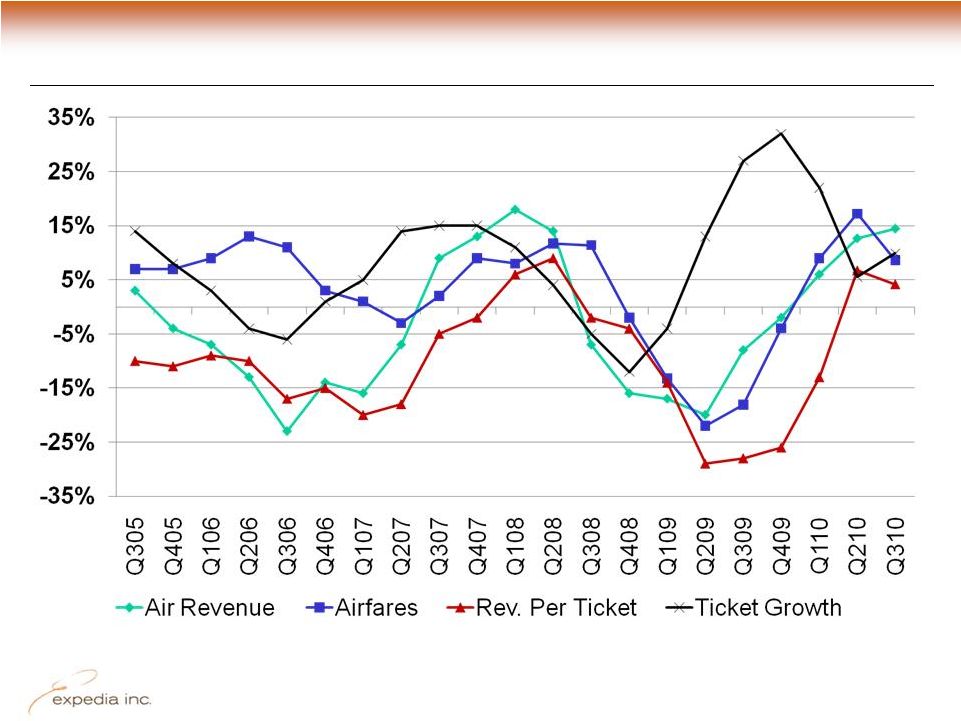
Q310 Company Overview
Trended Worldwide Air Growth Statistics (y/y)
Source: Company financial reports |
 14
Q310 Company Overview
12.5%
12.5%
12.5%
12.6%
12.6%
12.4%
12.1%
11.6%
11.3%
11.2%
13.6%
13.7%
13.8%
14.0%
14.1%
13.9%
13.6%
13.1%
12.8%
12.8%
2Q08
3Q08
4Q08
1Q09
2Q09
3Q09
4Q09
1Q10
2Q10
3Q10
Stable Supplier Relationships & Economics
Stable supplier margins indicate healthy supplier relationships
Recent reductions driven by traveler fee cuts & rising air ticket prices
Supplier margins largely stable driven by:
Long-term agreements with airlines and GDS providers
Better hotel relationships through PSG investment
Growth in advertising business helping offset fee cut impact
Excluding ad & media revenue
Including ad & media revenue
Source: Company financial reports
Trended Revenue Margin (TTM) |
 15
Q310 Company Overview
Q310 Results
Figures in $mm unless otherwise noted
Unit Growth
•
Q310 worldwide room night growth of 14%
•
Q310 worldwide air ticket growth of 10%
Q310
Q309
y/y
Transactions (mm)
18.1
15.9
14%
Gross Bookings
$6,892
$5,914
17%
Revenue
988
852
16%
Cost of Revenue
1
*
189
169
12%
Selling & Marketing
1
*
341
282
21%
Tech & Content
1
*
90
75
20%
General & Administrative
1
*
69
65
6%
Total Costs and Expenses
1
*
690
592
17%
OIBA
1
**
294
256
15%
OIBA Margin
1
30%
30%
(36bps)
Adjusted EBITDA
1
***
324
282
15%
Adj. EBITDA Margin
1
33%
33%
(29bps)
Free Cash Flow
1
(36)
(45)
21%
Source: Company financial reports
* Excludes stock-based compensation. ** OIBA includes realized
gain/(loss) from revenue hedges *** Adjusted EBITDA is
calculated as operating income plus depreciation, restructuring charges, intangibles
amortization, stock-based compensation, any impairments and certain legal
reserves and occupancy tax charges. Adj. EBITDA includes
realized gains/(losses) from revenue hedges. 1 See Appendix B for
reconciliation of non-GAAP to GAAP numbers.
|
 16
Q310 Company Overview
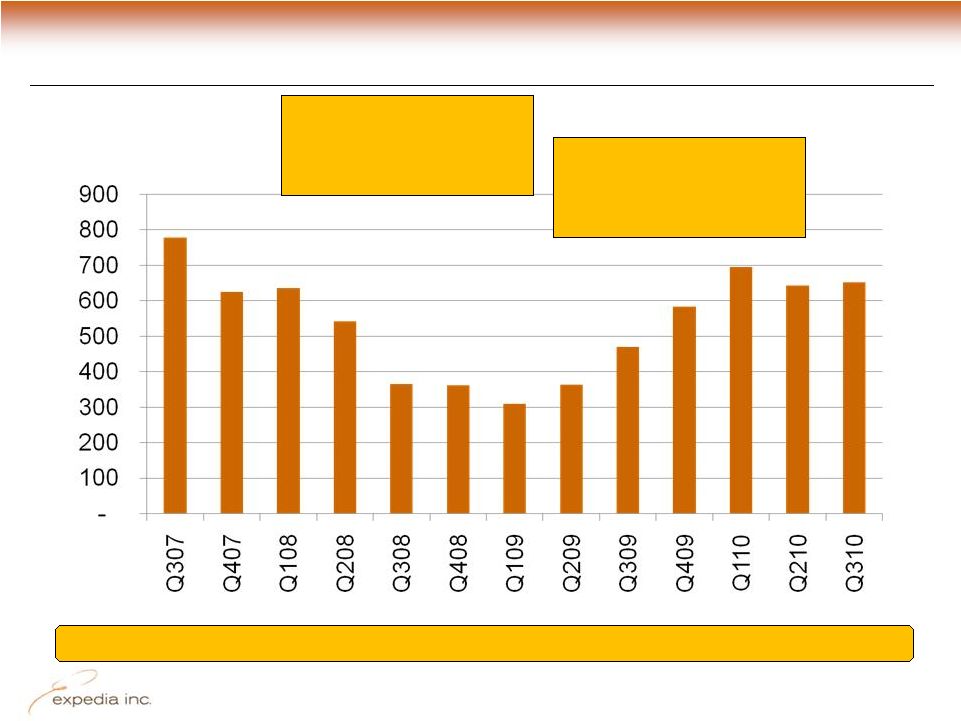
Trended Free Cash Flow (TTM)
$millions
‘08 cash flows down due
to taxes, slowing
merchant hotel & one-
time cap ex
Approximately $1.5B in free cash flow generated in past 3 years
‘09 cash flows improved
due to higher earnings,
merchant hotel recovery
& normalized cap ex
Source: Company financial reports |
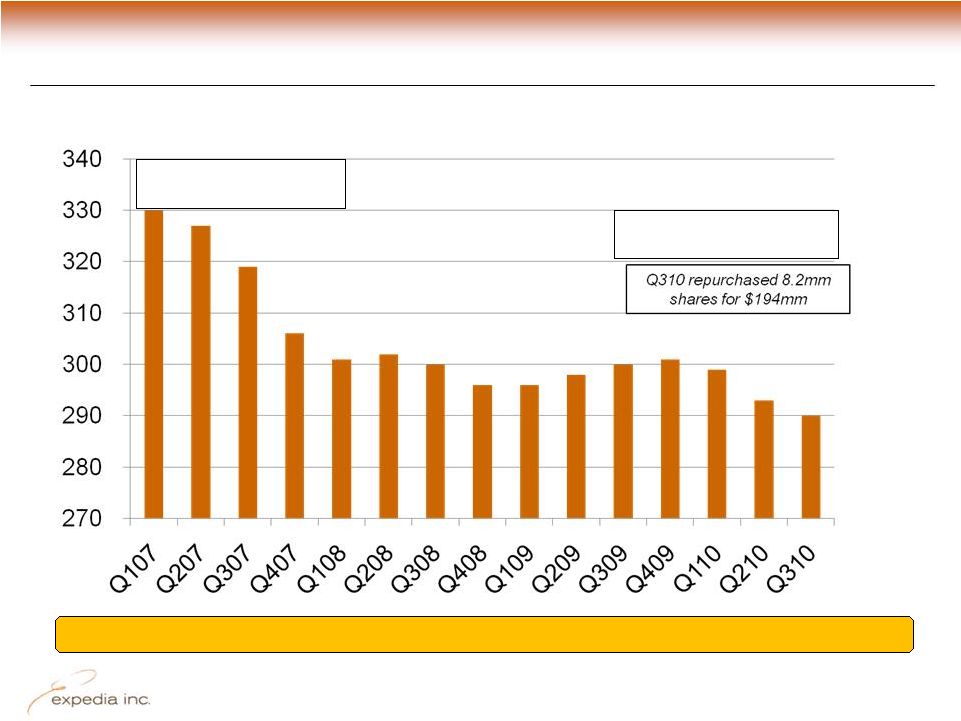 Efficiently Managing Dilution
12% reduction in share base since Q107
millions of adjusted diluted shares
2007 repurchased 55mm
shares for $1.4b
Q110 repurchased 8.4mm
shares for $188mm
17
Q310 Company Overview
Source: Company financial reports |
 18
Q310 Company Overview
Capitalization
Source: Company financial reports. Some numbers may not add due to
rounding. Modest leverage;
minimal net debt
3 debt issues with long-
term maturities
(2018 Notes have 2013
investor put)
9/30/10
Cash
and
Cash
Equivalents
$951
Revolving Credit Facility
2
--
5.950% Notes due 2020
750
7.456% Notes
due 2018
500
8.500%
Notes
due 2016
395
Total Debt
$1,645
Net Debt
694
Market Value of Equity
3
$7,708
Total Capitalization
$8,402
Adjusted
EBITDA
TTM
4
$933
Total
Debt
/
Adj.
EBITDA
4
1.8
Net
Debt
/
Adj.
EBITDA
4
0.7
1
Does not include restricted cash, short-term investments and corporate
bond investments that are included in long-term assets.
2
Total size of revolving credit facility closed in February 2010 is $750
million; available capacity reduced by $24mm in outstanding letters of credit as of September 30, 2010.
3
Based on 277mm outstanding shares & October 15, 2010 closing share
price of $27.82. 4
Adjusted EBITDA is calculated as operating income plus depreciation,
intangibles expense, restructuring charges, stock-based compensation, any impairments, certain legal reserves
and occupancy tax charges. Adjusted EBITDA includes any realized
gains/(losses) from revenue hedges. See Appendix B for reconciliation of non-GAAP to GAAP numbers
1 |
 19
Q310 Company Overview
12.31.05
12.31.06
12.31.07
12.31.08
12.31.09
TTM
9.30.10
Leverage Measures
Total Debt / TTM Adjusted EBITDA
1
0.3
0.8
1.5
2.0
1.0
1.8
Net Debt / TTM Adjusted EBITDA
1
N/A
N/A
0.6
1.1
0.3
0.7
Coverage Measures
TTM Adj. EBITDA / TTM Interest
Expense
1
N/A
37.5
13.8
10.8
10.3
10.5
TTM Free Cash Flow / TTM Int.
Expense
1
N/A
30.4
11.8
5.0
6.9
7.3
Trended Credit Metrics
Demonstrated strong credit metrics, consistent with investment grade rating
1
See Appendix B for reconciliation of non-GAAP to GAAP numbers
Source: Company financial reports |
 20
Q310 Company Overview
Rating Agency Snapshot
S&P (Analyst: Andy Liu)
Rating maintained at ‘BBB-’; Outlook Stable
August 30, 2010 Note:
“The
rating
is
based
on
the
expectation
that
Expedia
will
be
able
to
maintain
its
market
share
in
the
online
travel
market
and
adhere
to
its
intermediate
term
financial
risk
policy.
Expedia
is
the
market-leading
online
travel
agency
with
strong
brands
and
good
discretionary
cash
flow.”
“We are currently anticipating mid-single-digit increase in revenue
and EBITDA in 2010. We expect that higher marketing spending will likely
cause EBITDA margin to soften somewhat in 2010, but that EBITDA growth should
remain healthy.”
Moody’s (Analyst: Stephen Sohn)
Rating
Affirmed
at
Ba1
/
Outlook
raised
to
‘Positive’
from
‘Stable’
/
SGL-1
August 2, 2010 Credit Opinion:
“The rating is supported by the company’s leading position in the
consumer online travel agency market and strong credit profile, which
includes low leverage, high profitability, and strong cash flow generation.”
“Management
has
publicly
committed
to
conservative
financial
policies,
specifically
targeting
leverage
to
be
between 2 to 3 times (gross debt to EBITDA).”
“The
Positive
outlook
reflects
Expedia’s
continued
strong
operating
performance
through
the
economic
downturn,
our expectations that the travel industry is expected to see modest growth through
2011, and management’s commitment to more conservative financial
policies.” Fitch Rates Expedia, Inc.'s 'BBB-'; Outlook Stable
Issuer Default Rating (IDR) 'BBB-‘; Senior unsecured notes 'BBB-';
Senior unsecured bank credit facility 'BBB-’; Rating Outlook is
Stable. “Fitch
expects
Expedia
to
exhibit
modest
revenue
growth
and
stable
EBITDA
margins
in
2010.
Results
should
benefit
from
a
stabilization
of
industry
travel
trends
and
be
positively
impacted
by
continued
share
gains
at
Expedia
as
consumers increasingly utilize online travel agents (OTAs). Additionally, while
EBITDA margin pressure continues to exist
in
the
core
hotel
and
airline
travel
booking
business,
Expedia's
advertising
revenue
stream,
the
growth
of
which
has outpaced overall corporate revenue growth, carries substantially higher
margins and should add stability to current profitability
metrics.” Solid execution & adequate liquidity in a challenging
environment |
 21
Q310 Company Overview
Summary
•
Attractive macro tailwind as travel industry shifts online
•
World’s #1 online provider of travel-related services
—
Leading traffic, supply, scale, bookings, revenue & cash flows
—
Strong and complementary portfolio of brands and products
—
Critical partner to airlines, hotels and other travel suppliers
—
Diversified brands, business models and geographic reach
•
Compelling platforms for travel suppliers, travelers & advertisers
•
Strong business model, execution & credit metrics
—
Substantial free cash flow
1
(FY09: $584mm; TTM $651)
—
Modest leverage (1.8x)
—
Strong interest coverage (10.5x)
—
High operating margins and modest ongoing cap-ex (~5% revenue)
—
Roughly 60% variable / 40% fixed cost base
•
Proven management
1
See
Appendix B for reconciliation of non-GAAP to GAAP numbers
|
 22
Q310 Company Overview
Appendix A |
 23
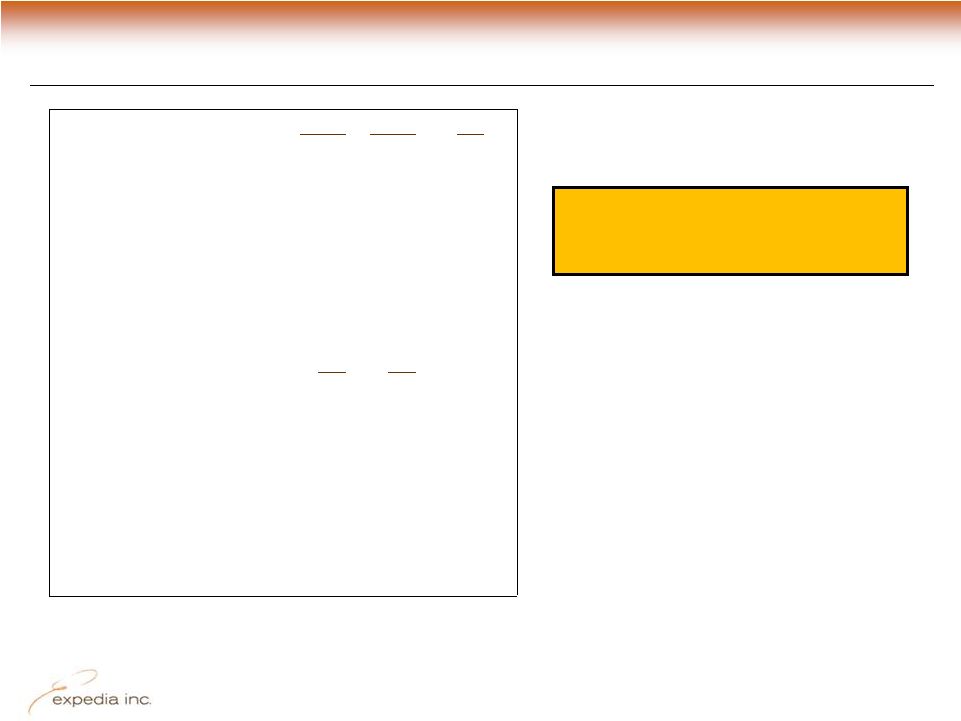
Q310 Company Overview
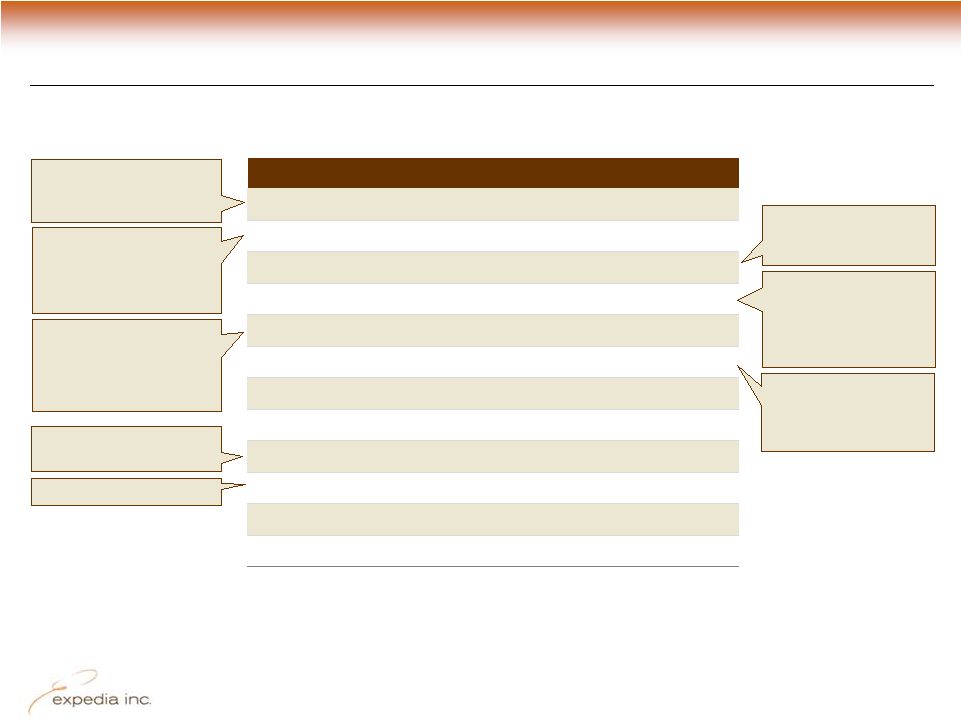
Business Model –
Income Statement (FY 2009)
Source: Company financial reports
1
Excludes stock-based compensation. See Appendix B for reconciliation of
non-GAAP with GAAP numbers. $ in millions
Gross bookings
$21,811
Revenue
2,955
Cost of revenue
1
605
Selling and marketing
1
1,015
General and administrative
1
259
Technology and content¹
304
“OIBA”
1
(includes $11mm hedge loss)
762
OIBA margin
1
26%
Stock-based compensation
62
Amortization of intangibles
38
Occupancy tax, legal reserves & restructuring
102
Operating income (GAAP)
571
Customer books travel product or
service; total retail value (incl
taxes
and fees) constitutes “Gross
Bookings.”
Expedia’s
portion of the gross
booking gets recorded as revenue
(inc. commissions, fees, etc.). Also
includes advertising & media
revenue. Revenue = 13.6% of ‘09
bookings.
(1) Personnel–related costs,
including executive leadership,
finance, legal, tax and HR
functions. (2) Fees for professional
services typically related to legal,
tax and accounting engagements.
Annual employee awards granted
each Q1; company switched to
options from RSUs
in 2009.
Amortization of M&A activity
•
Customer operations
•
Credit card & fraud expense
•
Data center & other costs
Consists of direct (74%)
advertising expenses (search
engine marketing & other online
advertising, TV, etc.) and
indirect, personnel-related costs
(26%), including our supplier
relationship function (PSG).
Principally relates to payroll and
related expenses, hardware &
software, licensing &
maintenance and software
development cost amortization.
(excludes $11mm hedge loss) |
 24
Q310 Company Overview
Growth
2005
2006
2007
2008
2009
2006
2007
2008
2009
Gross Bookings
$15,336
$16,882
$19,632
$21,269
$21,811
10%
16%
8%
3%
Revenue
2,119
2,238
2,665
2,937
2,955
6%
19%
10%
1%
Cost of Goods Sold
& Operating
Expenses *
1,492
1,639
1,996
2,239
2,183
10%
22%
12%
(3%)
OIBA***
627
599
670
698
762
(5%)
12%
4%
9%
OIBA Margin***
30%
27%
25%
24%
26%
(283bps)
(165bps)
(136bps)
201bps
Adj. EBITDA**
678
648
729
775
864
(4%)
13%
6%
12%
EBITDA Margin***
32%
29%
27%
26%
29%
(303bps)
(160bps)
(98bps)
287bps
Free Cash Flow
807
525
625
361
584
(35%)
19%
(42%)
62%
Trended Historical Results
•
Positive top-line growth
•
Despite difficult environment in 2009 were able to generate substantial OIBA
margins
•
$3.4B in cumulative OIBA & $2.9B in cumulative free cash flow
(Figures in $millions)
*
Excludes stock-based compensation. See reconciliation of non-GAAP measure in appendix B.
**
Adjusted EBITDA is calculated as operating income plus depreciation, intangibles expense,
restructuring charges, stock-based compensation, any impairments and certain legal reserves
and occupancy tax charges. Adjusted EBITDA includes any gains/(losses) from revenue hedges. See Appendix B for reconciliation of non-GAAP to GAAP numbers
*** See Appendix B for reconciliation of non-GAAP numbers. |
 25
Q310 Company Overview
Appendix B |
 26
Q310 Company Overview
Tabular Reconciliations For Non-GAAP Data
Operating Income Before Amortization
(figures in $000s)
12 Months
Ended
9 Months
Ended
3 Months
Ended
9 Months
Ended
3 Months
Ended
Sept 30,
2010
Sept 30,
2010
Sept 30,
2010
Sept 30,
2009
Sept 30,
2009
OIBA
$ 818,569
$ 655,666
$ 293,650
$ 598,629
$ 256,426
Amortization of intangible assets
(35,220)
(25,498)
(8,126)
(27,959)
(9,588)
Stock-based compensation
(61,558)
(46,564)
(13,021)
(46,667)
(14,519)
Restructuring charges
(5,571)
-
-
(28,597)
(13,781)
Occupancy tax assessments and legal reserves
6,553
-
-
(74,211)
-
Realized loss (gain) on revenue hedges
746
(936)
4,301
9,368
4,436
Operating income
723,519
582,668
276,804
430,563
222,974
Operating income margin
22%
23%
28%
19%
26%
Interest expense, net
(83,773)
(64,135)
(24,539)
(58,389)
(20,027)
Other, net
(16,867)
(12,272)
(13,657)
(30,769)
(4,749)
Provision for income taxes
(164,690)
(152,285) (60,584)
(141,995)
(80,385)
Net
income
attributable
to
noncontrolling
interests
(5,756)
(3,769)
(1,474)
(2,110)
(799)
Net income attributable to Expedia, Inc.
$ 452,433 $
350,207 $ 176,550 $
$ 117,014
197,300 |
 27
Q310 Company Overview
Tabular Reconciliations For Non-GAAP Data
Operating Income Before Amortization
(figures in $000s)
Year Ended
Dec. 31,
2005
Year Ended
Dec. 31,
2006
Year Ended
Dec. 31,
2007
Year Ended
Dec. 31,
2008
Year Ended
Dec. 31,
2009
OIBA
$ 627,441
$ 599,018
$ 669,487
$ 697,774
$ 761,532
OIBA margin
30%
27%
25%
24%
26%
Amortization of intangible assets
(126,067)
(110,766)
(77,569)
(69,436)
(37,681)
Amortization of non-cash distribution and
marketing
(12,597)
(9,638)
-
-
-
Stock-based compensation
(91,725)
(80,285)
(62,849)
(61,291)
(61,661)
Restructuring charges
-
-
-
-
(34,168)
Occupancy tax assessments and legal reserves
-
-
-
-
(67,658)
Impairment of goodwill
-
-
-
(2,762,100)
-
Impairment of intangible & other long-lived assets
-
(47,000)
-
(233,900)
-
Realized loss on revenue hedges
-
-
-
-
11,050
Operating income / (loss)
397,052
351,329
529,069
(2,428,953)
571,414
Operating income margin
19%
16%
20%
n/a
19%
Interest income (expense), net
48,673
14,799
(13,478)
(41,573)
(78,027)
Other, net
(8,428)
18,770
(18,607)
(44,178)
(35,364)
Write-off of long-term investment
(23,426)
Provision for income taxes
(185,977)
(139,451)
(203,114)
(5,966)
(154,400)
Net (income) loss attributable to noncontrolling
interests
836
(513)
1,994
2,907
(4,097)
Net income / (loss) attributable to Expedia, Inc.
$ 228,730
$ 244,934
$ 295,864
$(2,517,763)
$ 299,526
Source:
Company financial reports |
 28
Q310 Company Overview
Tabular Reconciliations For Non-GAAP Data
Costs & Expenses
(figures in $000s)
Year Ended
Dec. 31, 2005
Year Ended
Dec. 31, 2006
Year Ended
Dec. 31, 2007
Year Ended
Dec. 31, 2008
Year Ended
Dec. 31, 2009
Total costs and expenses*
$ 1,583,739
$ 1,718,853
$ 2,058,694
$ 2,300,530
$ 2,244,505
Less: stock-based compensation
(91,725)
(80,285)
(62,849)
(61,291)
(61,661)
Costs and expenses excluding stock-based
compensation
1,492,014
1,638,568
1,995,845
2,239,239
2,182,844
* Includes cost of revenue, selling and marketing, general and administrative and
technology and content expenses. Source:
Company financial reports
(figures in $000s)
Quarter Ended
Sept 30, 2009
Quarter Ended
Sept 30, 2010
Total costs and expenses*
$ 606,085
$ 702,930
Less: stock-based compensation
(14,519)
(13,021)
Costs and expenses excluding stock-based
compensation
591,566
689,909 |
 29
Q310 Company Overview
Tabular Reconciliations For Non-GAAP Data
Adjusted Earnings Before Interest, Taxes, Depreciation & Amortization
(figures in $000s)
Year Ended
Dec. 31,
2005
Year Ended
Dec. 31,
2006
Year Ended
Dec. 31,
2007
Year Ended
Dec. 31,
2008
Year Ended
Dec. 31,
2009
Adjusted EBITDA
677,886
647,797
729,013
774,574
864,314
Adjusted EBITDA margin
32%
29%
27%
26%
29%
Depreciation
(50,445)
(48,779)
(59,526)
(76,800)
(102,782)
OIBA
627,441
599,018
669,487
697,774
761,532
Source:
Company financial reports
(figures in $000s)
Qtr Ended
Sept 30,
2010
Qtr Ended
Sept 30,
2009
TTM
Sept 30,
2010
Adjusted EBITDA
324,325 282,337
932,615
Adjusted EBITDA margin
33%
33%
29%
Depreciation
(30,675)
(25,911)
(114,046)
OIBA
293,650
256,426
818,569 |
 30
Q310 Company Overview
Tabular Reconciliations For Non-GAAP Data
Costs & Expenses
12 Months
Ended
12 Months
Ended
3 Months
Ended
3 Months
Ended
(figures in $000s)
12.31.08
12.31.09
9.30.09
9.30.10
Cost of revenue
638,709
607,251
169,436
190,033
Less: stock-based compensation
(2,252)
(2,285)
(505)
(549)
Cost of revenue excluding stock-based
compensation
636,457
604,966
168,931
189,484
Selling and marketing
1,105,337
1,027,062
284,847
344,019
Less: stock-based compensation
(10,198)
(12,440)
(2,974)
(3,027)
Selling and marketing excluding stock-based
compensation
1,095,139
1,014,622
281,873
340,992
Technology and content
287,763
319,708
78,637
93,297
Less: stock-based compensation
(15,111)
(15,700)
(3,315)
(3,210)
Technology and content excluding stock-
based compensation
272,652
304,008
75,322
90,087
General and administrative
268,721
290,484
73,165
75,581
Less: stock-based compensation
(33,730)
(31,236)
(7,725)
(6,235)
General and administrative excluding stock-
based compensation
234,991
259,248
65,440
69,346
Source:
Company financial reports |
 31
Q310 Company Overview
Tabular Reconciliations For Non-GAAP Data
Free Cash Flow
(figures in $000s)
9
months
ended
Sep 30, 2010
3
months
ended
Sep 30, 2010
3
months
ended
Sep 30, 2009
Net cash provided by operating activities
937,717
820,332
4,384
(24,218)
Less: capital expenditures
(113,324)
(62,932)
(40,196)
(20,880)
Free cash flow
824,393
757,400
(35,812)
(45,098)
9
months
ended
Sep 30, 2010 |
 32
Q310 Company Overview
Tabular Reconciliations For Non-GAAP Data
Free Cash Flow
TTM = Trailing Twelve Month periods ended
(figures in $000s)
TTM 3.07
TTM 6.07
TTM 9.07
TTM 12.07
TTM 3.08
TTM 6.08
TTM 9.08
TTM 12.08
Net cash provided by operating
activities
703,569
831,140
859,228
712,069
737,792
660,510
514,242
520,688
Less: capital expenditures
(97,925)
(97,576)
(82,671)
(86,658)
(101,514)
(118,417)
(148,022)
(159,827)
Free cash flow
605,644
733,564
776,557
625,411
636,278
542,093
366,220
360,861
TTM 3.09
TTM 6.09
TTM 9.09
TTM 12.09
TTM 3.10
TTM 6.10
TTM 9.10
Net cash provided by operating
activities
458,913
494,184
573,491
676,004
793,527
764,787
793,389
Less: capital expenditures
(150,025)
(131,146)
(103,775)
(92,017)
(98,306)
(123,093)
(142,409)
Free cash flow
308,888
363,038
469,715
583,987
695,221
641,694
650,980
Source:
Company financial reports. Numbers may not add due to rounding.
|