Attached files
| file | filename |
|---|---|
| 8-K - FORM 8-K - CONCEPTUS INC | d8k.htm |
| EX-99.1 - PRESS RELEASE - CONCEPTUS INC | dex991.htm |
 Conceptus
Inc.
Quarterly Results
Third Quarter 2010
©
2010 Conceptus, Inc. All rights reserved.
October 28, 2010
Exhibit 99.2 |
 Safe
Harbor Except for the historical information contained herein, the matters
discussed in this presentation include forward-looking statements, the
accuracy of which is subject to risks and uncertainties. These
forward-looking statements include discussions regarding: projected net
sales, net income and earnings per share for the fourth quarter and full year 2010,
the expected impact of reduced physician office visits due to economic conditions,
currency exchange rates, growth in physician metrics and the French
government’s ruling on changes in insurance coverage on 2010 net
sales and GAAP diluted EPS, the effects of competitor product trialing, and
the use of non-GAAP financial measures.
These discussions and other forward-looking statements included herein may
differ significantly
from
actual
results.
Such
differences
may
be
based
upon
factors
such
as
changes in strategic planning decisions by management, re-allocation of
internal resources, changes in the impact of recessionary pressures,
decisions by insurance companies, scientific advances by third parties,
litigation risks, effect of regulations promulgated pursuant to the Health
Care Reform Act, and the introduction of competitive products, as well as
those factors set forth in the Company's most recent Annual Report on Form 10-K
and most recent Quarterly Report on Form 10-Q, and other filings with the
Securities and Exchange Commission. These forward-looking
statements speak only as to the date on which the statements were
made. We undertake no obligation to update or revise publicly any
forward-looking statements, whether as a result of new information, future events, or
otherwise.
-
2
- |
 Key Factors
Mark Sieczkarek
President and Chief Executive Officer
©
2010 Conceptus, Inc. All rights reserved. |
 -
4
-
Summary of Q3’10
Steps we have taken to
“control the controllable”
in the current
environment gained
some initial traction
Macro economic
headwinds continue to
cause considerable
unpredictability in our
business |
 -
5
-
Key Factors Remain
Macro Factor:
1.
Reduced physician office
visits due to economy
Macro Factor:
2. Currency fluctuations
Controllable Factor:
3. Physician metrics growth affected
by competitor trialing |
 -
6
-
Status of Key Factors: Office Visits
Q2’10 Factors
Q3’10 Impact
Future
Expectation
1. Reduced physician
office visits
Significantly
unfavorable
Remains unfavorable |
 -
7
-
Macro economic drivers continued to negatively impact
domestic general physician office visits in Q3’10
Economic Drivers
•
Continued unemployment at 9.6%
•
Involuntary part-time workers up
to 9.5 million, with few or no
benefits
•
Patients losing insurance
coverage (COBRA subsidies
ended) or switching to Medicaid
•
Patients opting for high-
deductible health insurance plans
and health savings accounts
Patients postponing
non-urgent procedures
= |
 -
8
-
Reduced Physician Office Visits
(1) IMS Data provided by Credit Suisse Healthcare Team
Domestic general physician office visits remained depressed
in Q3’10
(1)
. We expect this trend to continue. |
 -
9
-
Reduced OB/GYN Office Visits
(1) IMS Data provided by Credit Suisse Healthcare Team
Domestic OB/GYN office visits have declined significantly
during 2010
(1)
. We expect this trend to continue. |
 -
10
-
Status of Key Factors: Currency
Q2’10 Factors
Q3’10 Impact
Future
Expectation
1. Reduced physician
office visits
Significantly
unfavorable
Remains unfavorable
2. Currency
fluctuations
Slightly
favorable
Dollar remains
strong against euro |
 -
11
-
Currency: Dollar vs. Euro
Dollar was weaker to euro than expected in Q3’10
–
Modeled exchange rate for H2’10 of
$1.20
–
Actual exchange rate for Q3’10 was
$1.29
–
Variance resulted in slight benefit in Q3’10
80% to 90% of international sales are euro
denominated |
 -
12
-
Changes in French Reimbursement
The French government has reduced physician
reimbursement for hysteroscopic
occlusion
procedures for women under the age of 40,
effective October 1, 2010
Further cost-cutting measures by the Ministry of
Health are expected to affect reimbursements for
medical devices
We are working to reverse this decision, but
expect sales growth in France to be lower in the
near term |
 -
13
-
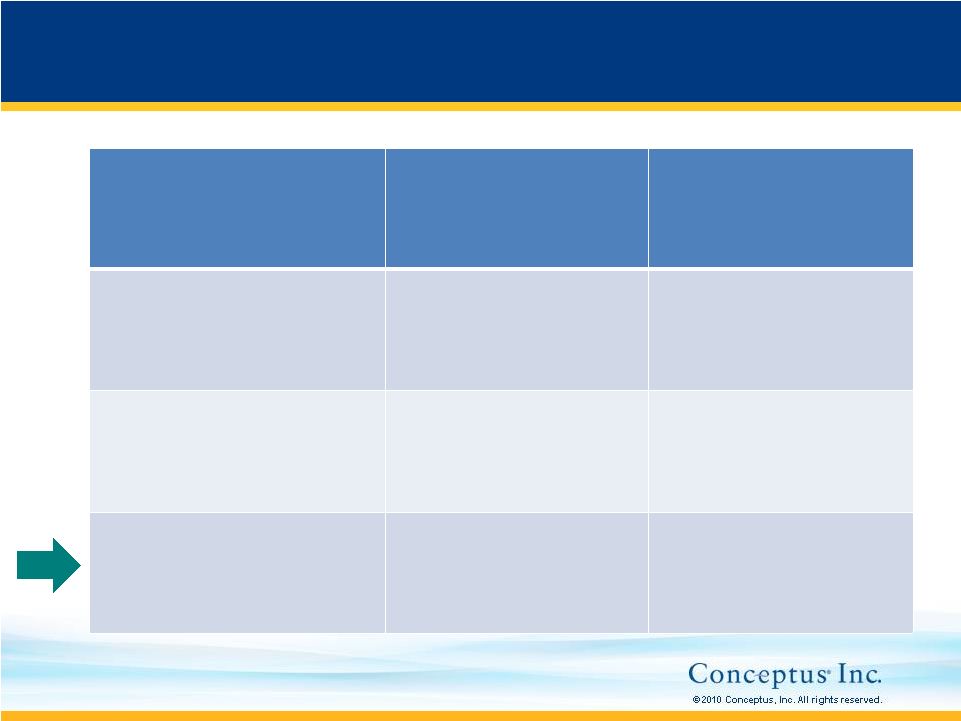
Status of Key Factors: Physician Metrics
Q2’10 Factors
Q3’10 Impact
Future
Expectations
1. Reduced physician
office visits
Significantly
unfavorable
Remains unfavorable
2. Currency
fluctuations
Slightly
favorable
Dollar remains
strong against euro
3. Physician metrics:
shortfall due to
competitor trialing
Moderately
unfavorable
Physician metric
growth improves |
 -
14
-
Physician Metrics –
Stabilizing in Q3
In Q2’10, significant resources were allocated to defend our
customer base as competitive trialing ramped, which resulted
in a temporary distraction from growing the market through
additional physician preceptorships, certifications and
transitions to office
Since physician metric growth is a key “controllable”
factor,
we aggressively increased the number of direct field sales
reps to re-energize growth
In Q3’10, physician metrics have initially stabilized
Focus remains on growing physician metrics |
 -
15
-
Our Priorities
Solution
Control the Controllable
Solution
Solution
Re-deploy assets
to energize
market growth:
“back-to-basics”
strategy
Accelerate growth
of physician
metrics including
new physician
adoption of
Essure
procedure
Implement leaner
cost structure
through
discretionary cuts |
 -
16
-
Back-to-Basics Solution
Increased direct sales territories to better align resources
Re-deployed existing sales personnel: ~160
sales personnel
in the field, with ~120
in direct sales
Improved ability to focus on both competitive defense and
physician metric growth
Direct sales reps’
transition is still in early stages
Expanded field sales coverage
We are one of the industry’s largest medical device
sales teams dedicated to OB/GYN physicians |
 Third Quarter 2010 Financials
Greg Lichtwardt
Executive Vice President, Operations and
Chief Financial Officer
©
2010 Conceptus, Inc. All rights reserved. |
 -
18
-
Q3’10 Snapshot
Net Sales
($mm)
Gross Margin
(%)
Diluted Non-
GAAP
(2)
EPS
Operating
Margin (%)
Q3’09
Q3’10
Q3’09
Q3’10
Q3’09
Q3’10
Q3’09
Q3’10
Q3’09
Q3’10
$0.29
(1)
$34.2
85.3%
(1)
80.6%
$33.9
23.4%
(1)
8.1%
$0.20
(1)
$0.03
$0.16
Diluted
GAAP EPS
Company guidance for Q3’10:
Net sales: $33mm to $34mm
GAAP EPS: $0.03 to $0.06
Non-GAAP EPS: $0.15 to $0.18
(1)
Includes
one-time
Ovion
acquisition
benefit
(2)
See GAAP to non-GAAP reconciliation in appendix |
 -
19
-
Worldwide Sales
Increasing Diversification through International Sales
The difference between dollar growth and international unit growth is primarily
due to average selling price reductions due to customer mix
Q3’10 Net Sales (in million $)
Q3’10 Units (in thousands):
$34.2
Q3’09
Q3’10
$28.0
(82%)
$33.9
$27.3
(81%)
28.1
Q3’09
Q3’10
20.3
(72%)
7.8
(28%)
30.1
19.9
(66%)
10.2
(34%)
Domestic
International
International units up 31% in Q3’10
$6.6
(19%)
$6.2
(18%) |
 -
20
-
U.S. Physician Metrics
Q3’10
Q2’10
Q1’09
Q4’09
Q3’09
Current Period Activity:
Physicians entering preceptorship
375
387
423
401
512
Physicians becoming certified
324
335
406
409
462
Physicians transitioning to office
185
163
243
464
342
Physician Base:
In preceptorship
3,537
3,486
3,434
3,417
3,425
Certified and in hospital
3,267
3,128
2,956
2,793
2,848
Certified and in office
5,313
5,128
4,965
4,722
4,258
TOTAL:
12,117
11,742
11,355
10,932
10,531 |
 -
21
-
Q3’10
Q3’09
Y/Y
Change
Q2’10
Q/Q
Change
Net Sales
$33.9
$34.2
(1.1 %)
$36.8
(8.0%)
Gross Profit Margin
80.6%
85.3%
(1)
nm
80.2%
nm
Operating Expenses
$24.6
$21.2
15.9%
$28.1
(12.7%)
Other Income / (Expense)
($1.6)
($1.6)
nm
($1.6)
nm
Tax Provision
$0.2
$0.2
nm
$0.1
100%
NEAT
$1.0
$6.2
(1)
(84.3%)
($0.3)
nm
GAAP EPS (basic
and diluted)
$0.03
$0.20
(1)
(85.0%)
($0.01)
nm
Non-GAAP EPS
(2)
(basic
and diluted)
$0.16
$0.29
(1)
(44.8%)
$0.11
45.5%
Q3’10 Results
In million $ except for EPS
(1)
Includes one-time Ovion
acquisition benefit
(2)
See GAAP to non-GAAP reconciliation in appendix |
 -
22
-
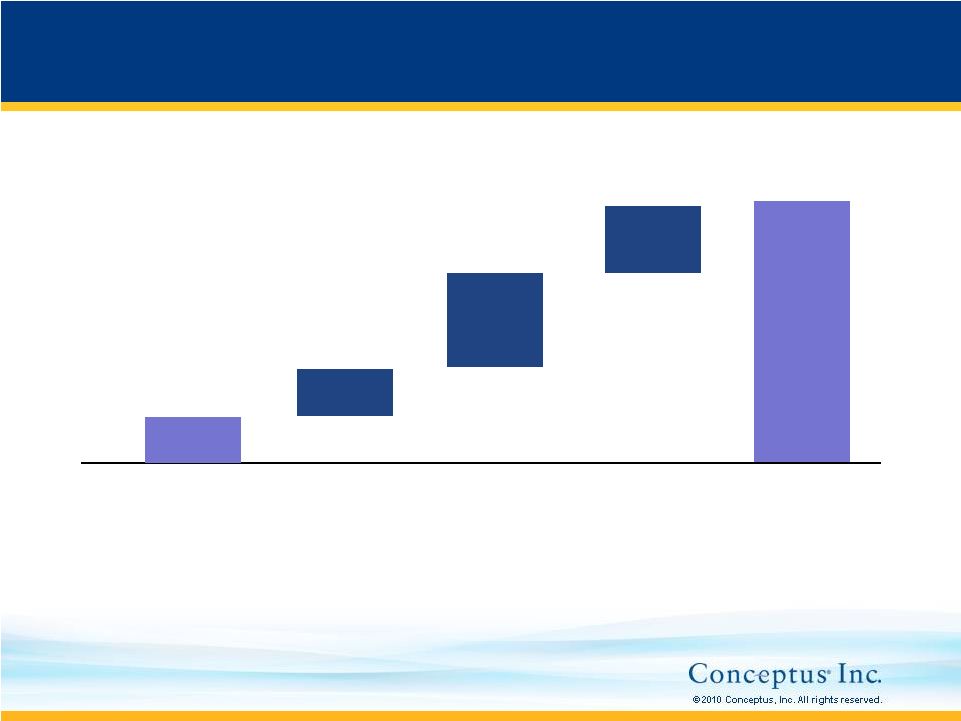
Q3’10 GAAP vs. Non-GAAP EPS
Non-GAAP
EPS
$0.16
Amortization
of intangibles
Stock-based
compensation
$0.03
$0.06
$0.04
Amortization of
non-cash items
for convertible
notes
$0.03
GAAP
EPS
See GAAP to non-GAAP reconciliation in appendix
$976
$810
$1,881
$1,231
$4,898
Actual amount
in $ thousands: |
 -
23
-
Balance Sheet
Cash & cash equivalents
Investments
and
put
option
(1)
A/R, inventories & other
current assets
PP&E
Intangible and other assets
Goodwill
Total assets
ASSETS
19.3
64.0
28.2
10.4
26.2
16.4
164.5
61.7
43.5
25.7
9.8
29.1
17.3
187.1
9/30/10
A/P & other accrued ST
liabilities
Line
of
credit
(2)
Other accrued LT liabilities
Notes payable
Total Equity
Total liabilities & equity
LIABILITIES &
EQUITY
12/31/09
18.1
29.2
2.4
76.5
60.9
187.1
9/30/10
12/31/09
16.1
0.0
2.3
79.8
66.3
164.5
$ millions
(1)
Put option for 12/31/09 only
(2)
Used proceeds from redemption of all outstanding
auction rate securities to pay down line of credit in full
|
 -
24
-
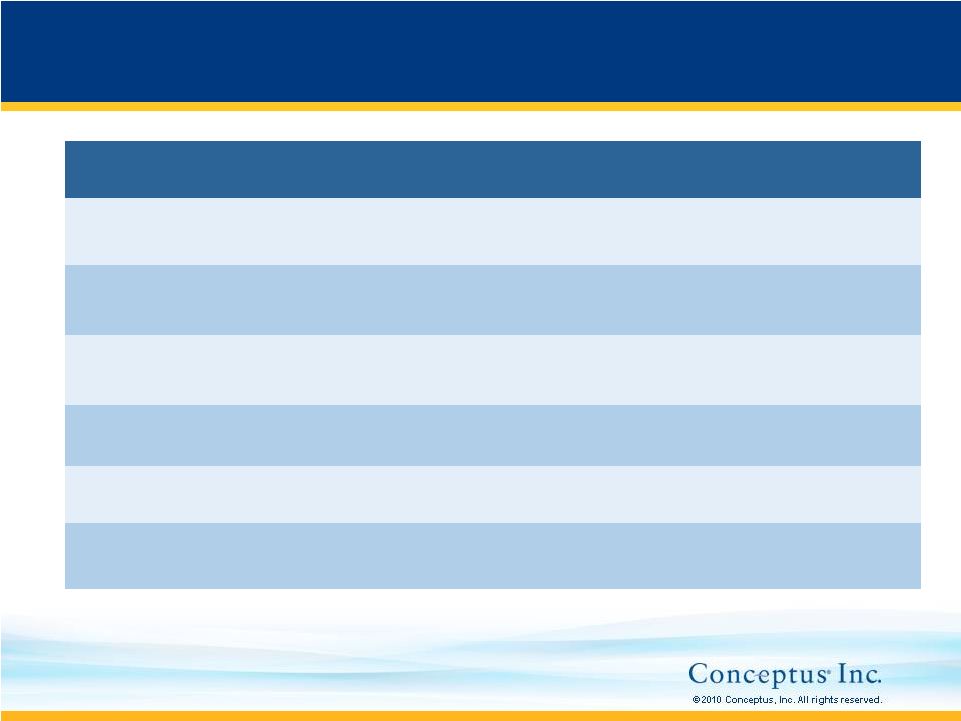
Guidance
Q4’10E
FY’10E
Q4’09A
FY’09A
Net Sales
$39 mm to
$41 mm
$143 mm to
$145 mm
$37.0
$131.4mm
Gross Profit
Margin
82.2%
81.1%
82.2%
81.7%
Operating
Expenses
$22.0mm
$102.5mm
$22.2mm
$92.7mm
Net Income
$8.3 mm to
$9.9 mm
$6.6 mm to
$8.3 mm
$6.6mm
$7.9mm
GAAP EPS
(diluted)
$0.26 to $0.31
$0.21 to $0.26
$0.21
$0.25
Non-GAAP
EPS
(1)
(diluted)
$0.39 to $0.44
$0.70 to $0.75
$0.33
$0.65
(1)
See GAAP to non-GAAP reconciliation in appendix |
 Competitive Environment &
Road to Standard of Care
Mark Sieczkarek
President and Chief Executive Officer
©
2010 Conceptus, Inc. All rights reserved. |
 -
26
-
Permanent birth control failures per 1,000 women at 3 years:
Essure: 1.6
(1)
Tubal ligation: 9.9
(2)
Vasectomy: 11.3
(3)
Competitor’s procedure: 16
(4)
………………...
.………
..........
...
(1)
Essure
Effectiveness Report (data 12/16/04) page 14
(2)
Peterson, H.B., et al. The risk of pregnancy after tubal sterilization: findings from the U.S.
Collaborative Review
of
Sterilization.
Am
J
Obstet
Gynecol.
1996
Apr;
174(4):
1161-8.
(3)
Jamieson DJ et al. For the U.S. Collaborative Review of Sterilization Working Group. The Risk of
Pregnancy After
Vasectomy.
Obstet
Gynecol.
2004;103:848-50.
848-50.
(4)
Competitor’s Instructions for Use, Rev 3.
Essure: Beats PBC Competition |
 -
27
-
Essure
Competitor’s product
Clinical
0 pregnancies reported
12 pregnancies reported
99.84% effective at 3 years
label claim or 1 in 625
98.4% effective at 3 years
label claim or 1 in 62
Commercial
667
pregnancies reported
against
465,000
procedures or 1 in 700
?
Essure: Long Term Efficacy Will Win
Data confirms Essure
as the superior product
Commercial observations of competitor’s product is resulting
in failures to occlude and pregnancies
(1)
(1) On October 1, 2010, Dr. M.Y. Bongers
et al. presented a research study on the competitor's product at the European
Society for Gynaecological Endoscopy (ESGE). The study resulted in an 89%
successful bilateral placement on 130 patients and a 7.4% failure to occlude, excluding the 3
patients that became pregnant. This study to date represents a 3-year
effectiveness rate of 2-in-75. |
 -
28
-
Essure: Latest Research
“Permanent birth control with Essure
device has demonstrated to be a safe method, with low
rate of complications, which its security persist(s) after 8 years follow up.
That means that Essure
method should be the reference method in what is to do with definitive
contraception. The devices have been placed in 25 known nickel
allergies (patients) without side effects.” Arjona
Berral,
JE
et
al.
Complications
associated
with
Essure
device:
analysis
after
4000
procedures.
October 2010. Gynecol
Surg.
7(S 1) S89
“Transabdominal
3D ultrasound is an interesting new alternative technique to confirm proper
placement of the Essure
microinserts. It’s an easy and reproductible
technique and could
replace the 3D transvaginal
ultrasound in many cases, especially if the conditions are
favorable.”
Bader,
G
et
al.
Localization
of
Essure
microinserts
using
3D
transabdominal
ultrasound
after
hysteroscopic
sterilization.
October
2010.
Gynecol
Surg.
7(S
1)
S74
“Essure
hysteroscopic
sterilization remains an excellent option in IUD carriers, as it shows no
significant differences in this small group when compared to standard non-IUD
women.” Nogueira
Martins,
N.
et
al.
Hysteroscopic
sterilization
in
IUD
carrier
-
department’s
experience.
October
2010. Gynecol
Surg.
7(S 1) S45
Sample highlights from abstracts presented at European Society
for Gynaecological
Endoscopy (ESGE) in October 2010
©
2010 Conceptus, Inc. All rights reserved. |
 -
29
-
Status of Competitive Trialing
7,000 total Essure
accounts
–
1,500 to
2,000 anticipated to trial
–
800 to
900 have trialed to date
Expect trialing to last
9 to
15 months if physician
utilization stays steady at 1 to 2 hysteroscopic
sterilization
procedures per month
Many mature trialing accounts have returned to Essure;
some
have
signed
agreements
indicating
Essure
exclusivity |
 -
30
-
Multi-Billion Dollar Market
Our current
addressable market
“Sweet Spot”
Our future market:
Essure: 30,000
Tubal ligations
(2)
:
643,000
Permanent birth control
procedures each year
673,000
In millions
Base of 38 million women
(1) 2006-08 CDC report, Data from the National Survey of Family Growth,
published May 2010
(2) Tubal sterilization trends in the United States, Chan and Westoff, published
June 2010; sourced 2006-08 CDC report
Market
based
on
intent
to
have
children
(1) |
 -
31
-
Road to Standard of Care
1992
Conceptus
founded
2001
2002
EU
approves
Essure
FDA approves
Essure
6,000
hysteroscopically
trained physicians
Minimal patient
awareness
2010
465,000 women
rely on Essure
15,000
hysteroscopically
trained physicians
30% patient
awareness
Hysteroscopic
tubal occlusion
14% of PBC
market (U.S.)
Goal: Essure
becomes
Standard of
Care for PBC
market
Increase utilization and tap into
addressable market of 9.3 million women
Increase number of hysteroscopically
trained physicians
Gain additional Medicaid support in 30+
states that lag reimbursement
Physicians routinely choose Essure
over competition
Expand into more international markets
Drive greater patient awareness
Develop next generations of Essure
Future
milestones: |
 Appendix
©
2010 Conceptus, Inc. All rights reserved. |
 -
33
-
Use of Non-GAAP Financial Measures
The Company has supplemented its GAAP results of operations with
a non-GAAP
measure of net income (loss) and has supplemented its GAAP guidance with a
non- GAAP measure of non-GAAP earnings per share. In each case,
the non-GAAP measure excludes stock-based compensation expense,
non-cash interest expense, amortization of intangible assets and
amortization of debt issuance costs. Management believes that these
non-GAAP financial measures provide useful supplemental information to
management and investors regarding the performance of the Company’s business
operations, facilitate a better comparison of results for current periods with
the Company’s previous operating results, and assist management in
analyzing future
trends, making strategic and business decisions and establishing
internal budgets and
forecasts. A reconciliation of non-GAAP net income (loss) to GAAP net income
(loss), and a reconciliation of the guidance of non-GAAP earnings per
share to GAAP earnings per share, in each case the most directly comparable
GAAP measure, are provided on slides 34 and 35 of this presentation.
There are limitations in using these non-GAAP financial measures because they are
not prepared in accordance with GAAP and may be different from non-GAAP
financial measures used by other companies. These non-GAAP financial
measures should not be considered in isolation or as a substitute for GAAP
financial measures. Investors and
potential investors should consider non-GAAP financial measures only in
conjunction with the Company’s consolidated financial statements prepared
in accordance with GAAP and the reconciliations of the non-GAAP financial
measures provided on slides 34 and 35 of this presentation.
|
 -
34
-
GAAP to Non-GAAP Reconciliation
2010
2009
2010
2009
Net income (loss), as reported
976
$
6,232
$
(1,665)
$
1,341
$
Adjustments to net income (loss):
Amortization of intangibles (a)
810
191
2,437
557
Stock-based compensation (b)
1,881
1,626
5,412
4,556
Amortization of non-cash interest expense (c)
1,115
1,054
3,298
3,118
Amortization of debt issuance costs (d)
116
116
348
349
Adjustments to net income (loss)
3,922
2,987
11,495
8,580
Non-GAAP net income
4,898
$
9,219
$
9,830
$
9,921
$
Income (loss) per share, as reported
Basic
0.03
$
0.20
$
(0.05)
$
0.04
$
Diluted
0.03
$
0.20
$
(0.05)
$
0.04
$
Non-GAAP earnings per share
Basic
0.16
$
0.30
$
0.32
$
0.33
$
Diluted
0.16
$
0.29
$
0.31
$
0.32
$
Weighted average common shares used in calculation
Basic
31,072
30,599
31,012
30,519
Diluted
31,413
31,503
31,759
31,116
(a) Consists of amortization of intangible assets, primarily licenses and customer
relationships (b) Consists of stock-based compensation in accordance with
ASC 718 (c) Consists of amortization of non-cash interest expense in
accordance with ASC 470-20 (d) Consists of amortization of debt issuance
costs Conceptus, Inc.
(Unaudited)
(In thousands, except per share amounts)
September 30,
Three Months Ended
Nine Months Ended
September 30,
Reconciliation of Reported Net Income (Loss) and Income (Loss) Per Share to
Non-GAAP Net Income (Loss) and Earnings Per Share |
 -
35
-
From
To
From
To
GAAP Guidance
0.26
$
0.31
$
0.21
$
0.26
$
Estimated Non-GAAP Guidance
Amortization of intangibles (a)
0.03
$
0.03
$
0.10
$
0.10
$
Stock-based compensation (b)
0.06
$
0.06
$
0.24
$
0.24
$
Amortization of non-cash items for convertible note (c)
0.04
$
0.04
$
0.15
$
0.15
$
Total Non-GAAP Adjustments
0.13
$
0.13
$
0.49
$
0.49
$
Non-GAAP Guidance
0.39
$
0.44
$
0.70
$
0.75
$
(a) Consists of amortization of intangible assets, primarily licenses and customer relationships
(b) Consists of stock-based compensation in accordance with ASC 718
(c) Consists of amortization of non-cash interest expense in accordance with ASC 470-20 and debt
issuance costs (Unaudited)
Three Months Ending
Twelve Months Ending
December 31, 2010
December 31, 2010
Conceptus, Inc.
To Projected GAAP EPS
Reconciliation of Forward-Looking Guidance For Non-GAAP Financial Measures
GAAP to Non-GAAP Reconciliation |
 Thank You
©
2010 Conceptus, Inc. All rights reserved.
CC-2551 27OCT10F |
