Attached files
| file | filename |
|---|---|
| EX-99.1 - EXHIBIT 99.1 - Noranda Aluminum Holding CORP | a6484817ex99_1.htm |
| 8-K - NORANDA ALUMINUM HOLDING CORP. 8-K - Noranda Aluminum Holding CORP | a6484817.htm |
Exhibit 99.2
Third Quarter Results
Conference Call Noranda Aluminum Holding Corp
October
27, 2010
10:00
AM Eastern / 9:00 AM Central
Forward-Looking Statements The following information contains, or may be deemed to contain, "forward-looking statements" (as defined in the U.S. Private Securities Litigation Reform Act of 1995). By their nature, forward-looking statements involve risks and uncertainties because they relate to events and depend on circumstances that may or may not occur in the future. The future results of the issuer may vary from the results expressed in, or implied by, the following forward looking statements, possibly to a material degree. For a discussion of some of the important factors that could cause the issuer's results to differ from those expressed in, or implied by, the following forward-looking statements, please refer to our filings with the SEC, including our annual report on Form 10-K.
Management Presenters Other Placeholder: Layle K. “Kip” Smith, President and Chief Executive Officer, Gail Lehman, General Counsel, Kyle Lorentzen, Chief Operating Officer, Robert Mahoney, Chief Financial Officer
Third Quarter Highlights
Other Placeholder: Noranda produced solid 3Q results… Reported $25.2
million net income ($0.45 per share, diluted), which includes $16.6
million ($0.29 per share) positive impact from hedge and debt repurchase
gains. Business units produced $38.9 million combined segment profit.
Adjusted EBITDA was $33.0 million. 3Q reflects a full quarter of
seasonal peak power rates. CORE contributed $19.1 million in cost
reduction and capital expenditure savings. Year-to-date CORE savings are
$57.7 million. Grew share of demand in billet, with 15% 3Q growth, and
33% YTD growth. Another quarter of outstanding performance in flat
rolled products segment, with $14.4 million of segment profit.
...despite
lower LME, seasonal peak power rates. Realized MWTP was $0.99 compared
to $1.04 in 2Q-10. Compared to 2Q-10, $0.77 integrated cash cost
reflected seasonal peak power rates, fuel adjustment charge, and lower
LME. Production and shipping timing differences in July caused 4%
decrease in primary aluminum shipments from 2Q-10. New Madrid achieved
record metal production in September.
Third Quarter Highlights
(cont’d) We strengthened our balance sheet and preserved liquidity…
Generated $31.0 million of operating cash flow; ending cash balances
totaled $33.0 million. No outstanding borrowing on senior revolving
credit facility; $215.2 million available capacity. Repurchased $20.6
million AcquisitionCo notes, reducing total debt to $533.1 million.
…while
addressing key projects Completed renegotiation of Gramercy labor
agreement. Announced capacity expansion projects in New Madrid and
Salisbury. Initiated dredging project at St. Ann bauxite mine.
Market Fundamentals We believe the medium and long-term supply and demand outlook for aluminum supports sustainable, higher LME prices: global demand driven by long-term and sustained economic growth, higher standards of living and increased demand from emerging markets, especially China and India. According to CRU estimates: US growth rates: 14% in 2010, 7% in 2011, 7% in 2012. Global growth rates:18% in 2010, 7% in 2011, 8% in 2012. China and India growth rates: 20% and 11% in 2010, 9% and 10% in 2011, 10% and 12% in 2012. substitution away from other metals CRU estimates aluminum will continue to gain close to 200,000 tonnes per year from copper in wire and heat transfer applications.
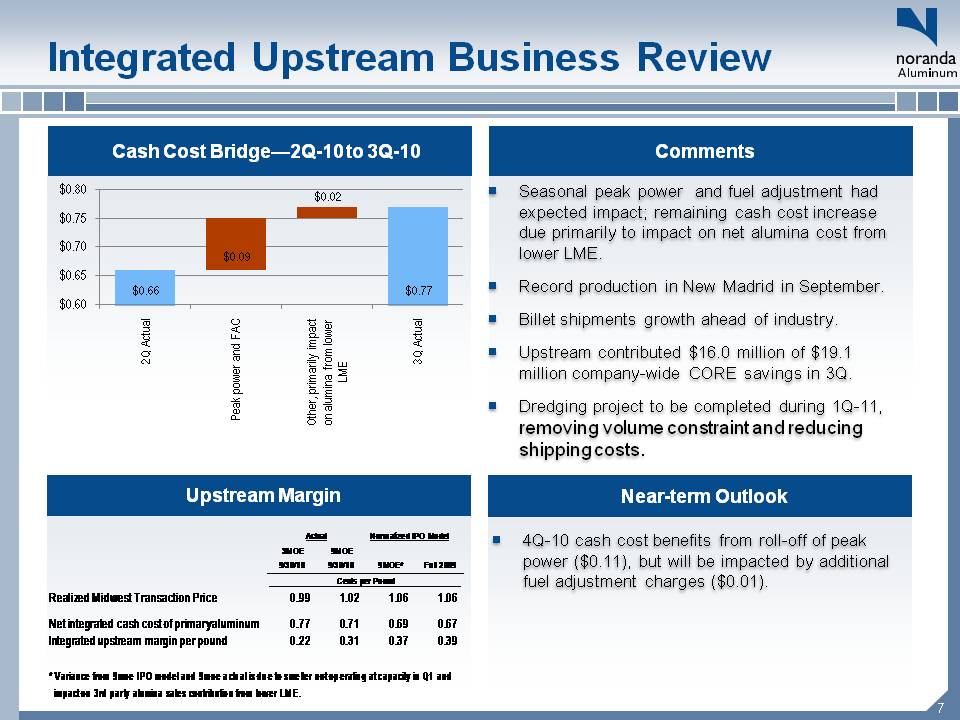
Integrated Upstream Business Review Cash Cost Bridge—2Q-10 to 3Q-10 Upstream Margin Seasonal peak power and fuel adjustment had expected impact; remaining cash cost increase due primarily to impact on net alumina cost from lower LME. Record production in New Madrid in September. Billet shipments growth ahead of industry. Upstream contributed $16.0 million of $19.1 million company-wide CORE savings in 3Q. Dredging project to be completed during 1Q-11, removing volume constraint and reducing shipping costs. Comments Near-term Outlook 4Q-10 cash cost benefits from roll-off of peak power ($0.11), but will be impacted by additional fuel adjustment charges ($0.01). * Variance from 9moe IPO model and 9moe actual is due to smelter not operating at capacity in Q1 and impact on 3rd party alumina sales contribution from lower LM E.
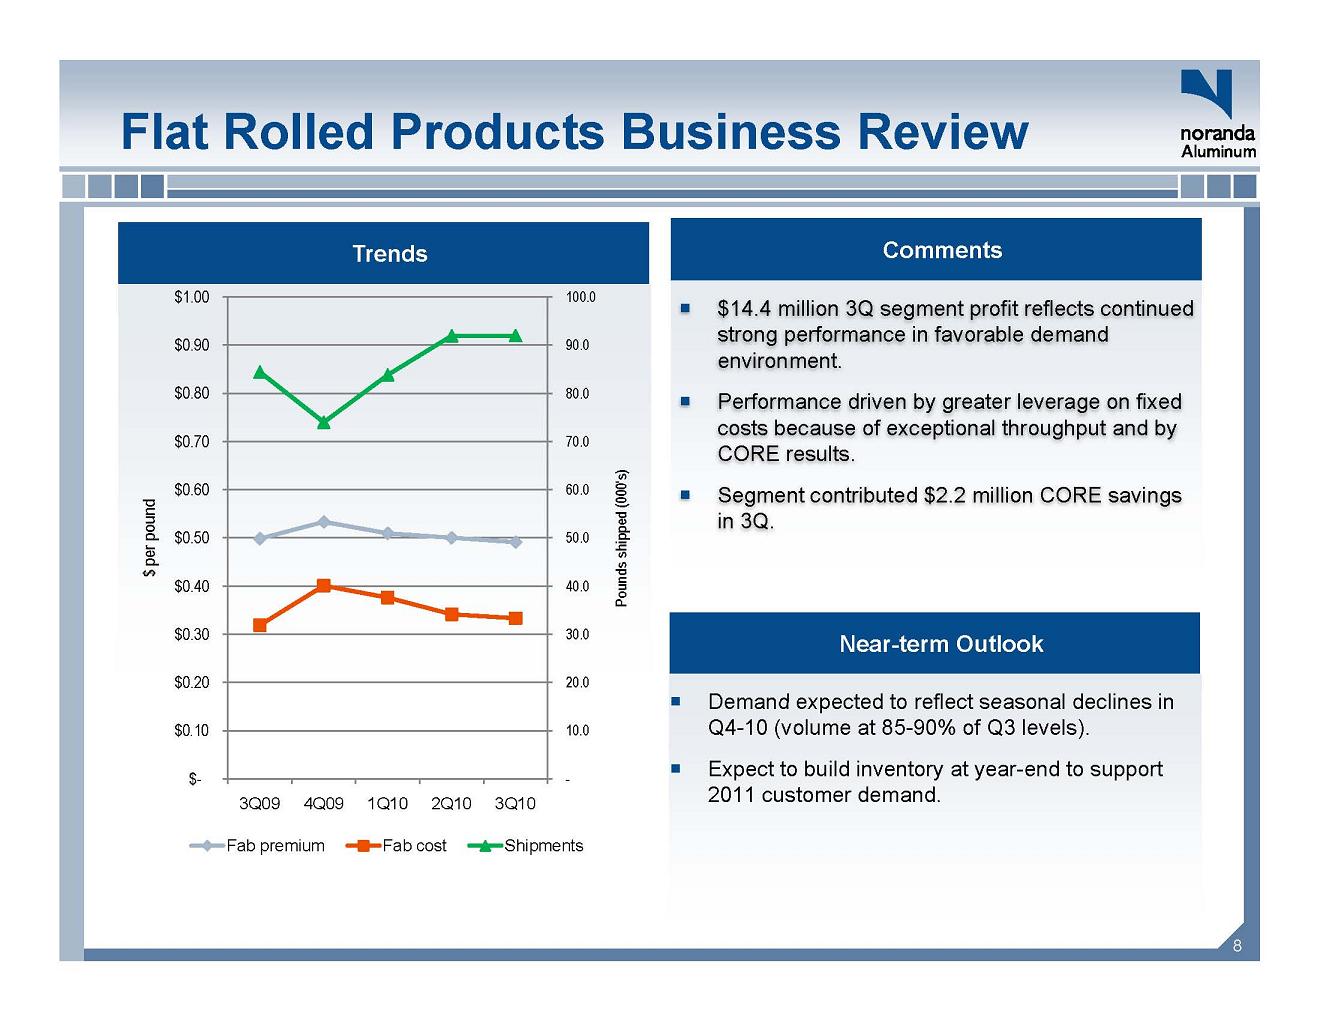
Flat Rolled Products Business Review Trends Comments .. $ 14.4 million 3Q segment profit reflects continued 100.0 $1.00 g p strong performance in favorable demand environment. .. Performance driven by greater leverage on fixed costs because of exceptional throughput and by CORE l 70.0 .80.0 90.0 $0.70 $0.80 $0.90 results. .. Segment contributed $2.2 million CORE savings in 3Q. 50.0 60.0 $0.50 $0.60 ds shipped (000's) $ per pound Near-term Outlook .. Demand expected to reflect in 20.0 30.0 40.0 $0.20 $0.30 $0.40 Pound seasonal declines Q4-10 (volume at 85-90% of Q3 levels). .. Expect to build inventory at year-end to support 2011 customer demand. - 10.0 $- $0.10 3Q09 4Q09 1Q10 2Q10 3Q10
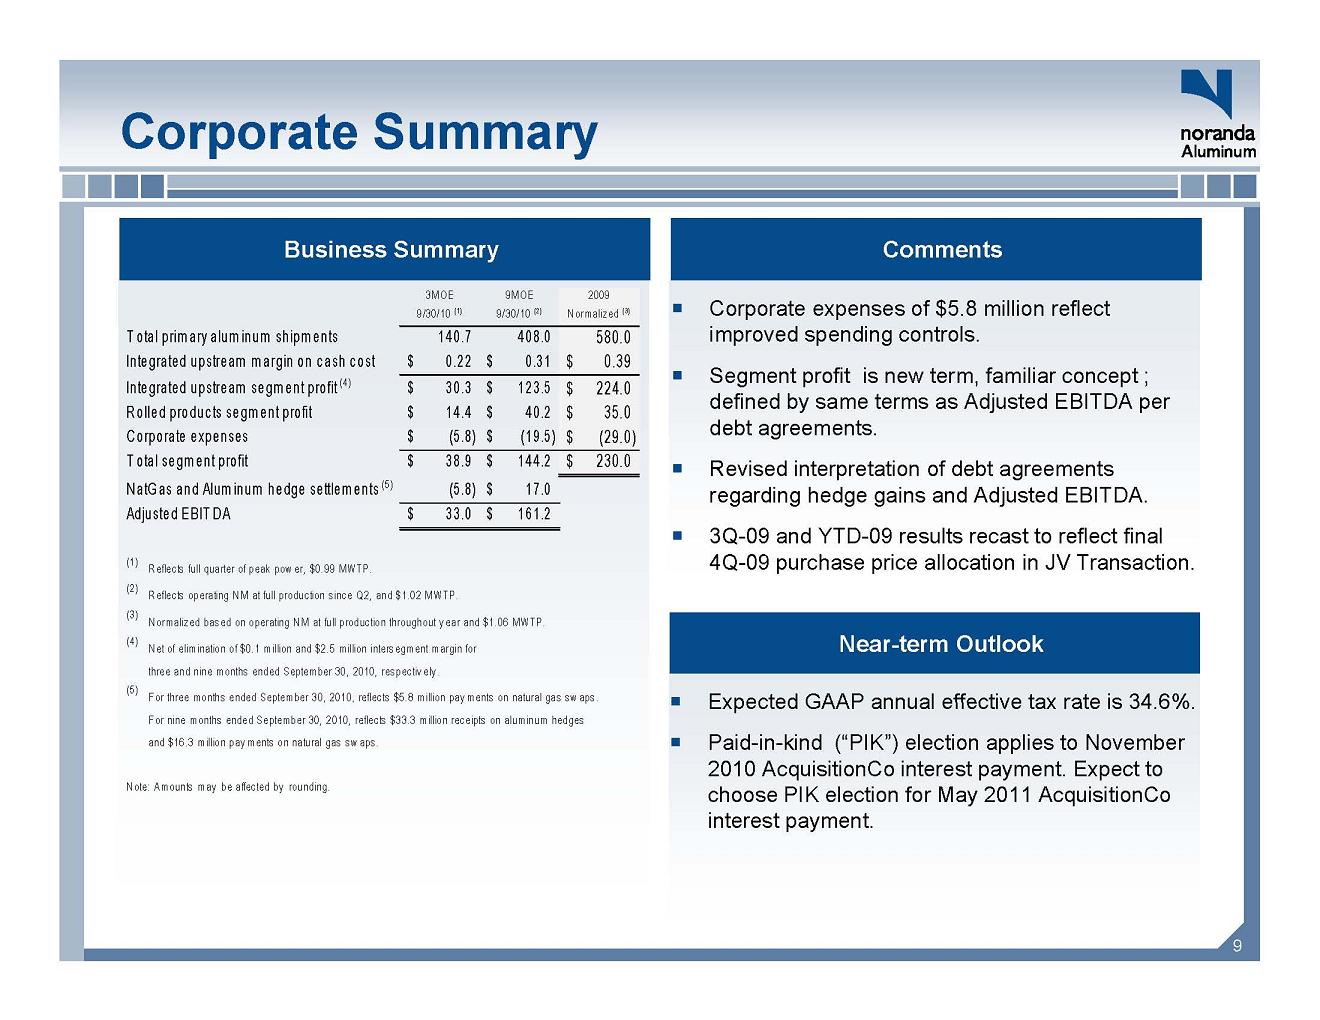
Corporate Summary Business Summary Comments .. Corporate expenses of $ 5.8 million reflect 3MOE 9/30/10 (1) 9MOE 9/30/10 (2) 2009 Normalized (3) p p improved spending controls. .. Segment profit is new term, familiar concept ; defined by same terms as Adjusted EBITDA per debt agreements. Total primary aluminum shipments 140.7 408.0 580.0 Integrated upstream margin on c ash c ost 0.22 $ 0.31 $ 0.39 $ Integrated upstream segment profit (4 ) 30.3 $ 123.5 $ 224.0 $ Rolled products segment profit 14.4 $ 40.2 $ 35.0 $ Corporate expenses (5.8) $ (19.5) $ ( 29.0) $ .. Revised interpretation of debt agreements regarding hedge gains and Adjusted EBITDA. .. 3Q-09 and YTD-09 results recast to reflect final 4Q-09 purchase price allocation in JV Transaction. ) Total segment profit 38.9 $ 144.2 $ 230.0 $ Nat Gas and Aluminum hedge settlements (5 ) (5.8) 17.0 $ Adjusted EBIT DA 33.0 $ 161.2 $ (1 ) Reflects full quarter of peak power, $0.99 MWTP. Near-term Outlook .. 34 6% q p p , (2 ) Reflects operating NM at full production since Q2, and $1.02 MWTP. (3 ) Normalized based on operating NM at full production throughout y ear and $1.06 MWTP. (4 ) N et of elimination of $0.1 million and $2.5 million intersegment margin for three and nine months ended September 30, 2010, respectively . (5 ) F or three months ended September 30, 2010, reflects $5.8 million payments on natural gas swaps. Expected GAAP annual effective tax rate is 34.6%. .. Paid-in-kind (“PIK”) election applies to November 2010 Acquisition Co interest payment. Expect to choose PIK election for May 2011 Acquisition Co interest payment. p py g p Fornine months ended September 30, 2010, reflects $33.3 million receipts on aluminum hedges and $16.3 million pay ments on natural gas swaps. Note: Amounts may be affected by rounding.
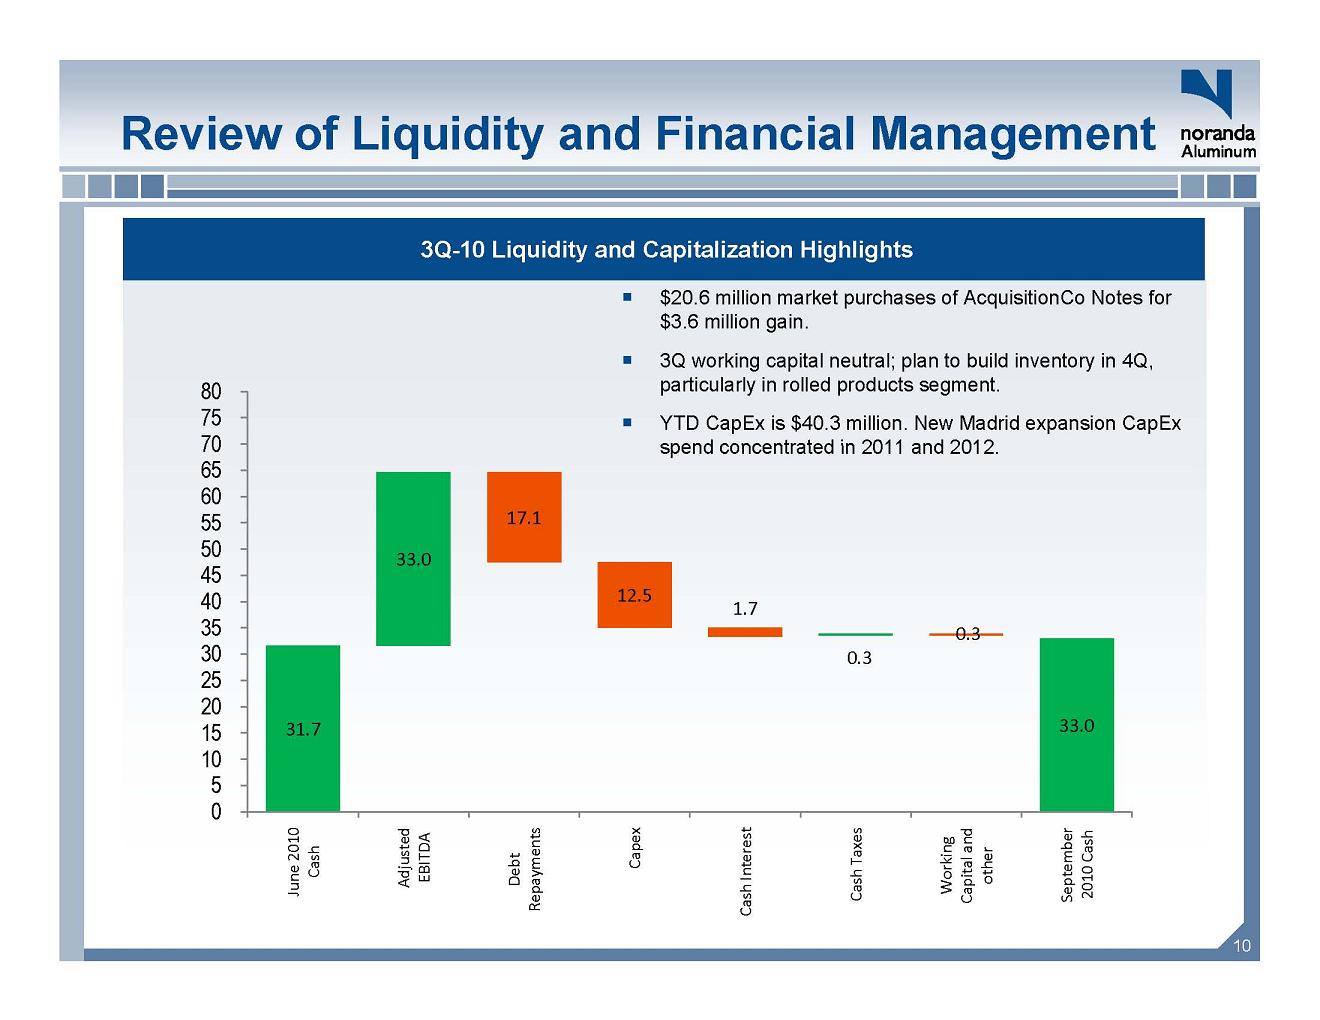
Review of Liquidity and Financial Management 3Q-10 Liquidity and Capitalization Highlights Other Placeholder: $20.6 million market purchases of AcquisitionCo Notes for $3.6 million gain. 3Q working capital neutral; plan to build inventory in 4Q, particularly in rolled products segment. YTD CapEx is $40.3 million. New Madrid expansion CapEx spend concentrated in 2011 and 2012. June 2010 Cash Adjusted EBITDA Debt Repayments Capex Cash Interest Cash Taxes Working Capital and other September 2010 Cash
Key Takeaways .. We generated solid results during the 3Q-10 by focusing on our six sustainable goals. g – Productivity—$19.1 million of CORE savings; record production in New Madrid. – Revenue growth—gained demand share in the billet product group; held gains in key flat rolled product groups; initiated key capital project in New Madrid and Jamaica. – Cash and financial management—continued to deleverage, repurchasing $20 6 debt 20.6 million of debt. – Process improvement—implemented process improvement, including continued expansion of our AX financial system with new procurement functionality – Employee engagement—negotiated new five year labor agreement in Gramercy – Environmental, health & safety—continued company-wide