Attached files
| file | filename |
|---|---|
| 8-K - FORM 8-K - JONES LANG LASALLE INC | d8k.htm |
| EX-99.1 - PRESS RELEASE - JONES LANG LASALLE INC | dex991.htm |
 Supplemental Information
Third Quarter
Earnings Call
2010
Exhibit 99.2 |
 Market & Financial Overview |
 London,
Washington DC
Paris,
Seoul
Hong Kong,
Shanghai
Beijing
Capital Value
growth slowing
Capital Value
growth
accelerating
Capital Value
bottoming out
Capital Value
falling
Americas
EMEA
Asia Pacific
Hong Kong
Detroit
Brussels,
Dallas
Shanghai
Capital Values
Q3 2009
Q3 2010
Capital Value
growth slowing
Capital Value
falling
Capital Value
growth
accelerating
Capital Value
bottoming out
Singapore, Toronto
As of Q3 2010
The
Jones
Lang
LaSalle
Property
Clocks
SM
Amsterdam, Milan, Sao Paulo,
Sydney
Berlin,
Mumbai,
New
York,
San
Francisco
Stockholm
Brussels, Moscow,
Paris,
Washington
DC
Amsterdam,
Milan,
Mumbai,
Sydney
Moscow,
New York,
Sao Paulo
Chicago, San Francisco,
Singapore,
Toronto
Beijing,
London,
Seoul
Berlin,
Philadelphia,
Stockholm,
Tokyo
Detroit, Philadelphia
Chicago, Dallas
Tokyo
3 |
 Paris,
Stockholm Rental growth
slowing
Rental growth
falling
Rental
growth
accelerating
Rents
bottoming
out
Americas
EMEA
Asia Pacific
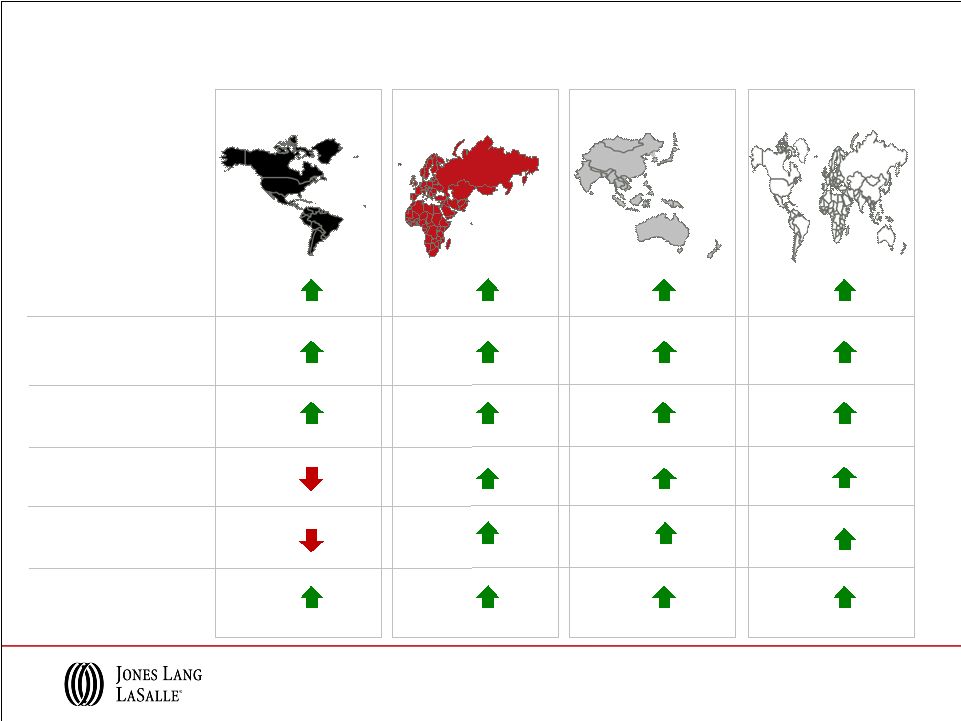
Leasing Market Fundamentals
Q3 2009
London, Sydney
Amsterdam, Berlin,
Dallas,
Milan,
San Francisco
Los Angeles, New York
Hong Kong,
Mumbai
Atlanta, Detroit, Seoul
Shanghai
Q3 2010
Beijing,
Hong Kong
London
,
Shanghai
Milan
Chicago,
Rome,
Seoul
Rental growth
slowing
Rental growth
falling
Rental
growth
accelerating
Rents
bottoming
out
Detroit
Los Angeles,
New York
As of Q3 2010
The
Jones
Lang
LaSalle
Property
Clocks
SM
Brussels
Amsterdam,
Atlanta,
Dallas
Berlin, Mumbai,
San Francisco,
Sydney, Tokyo
Moscow,
Singapore,
Washington DC
Chicago,
Rome
Stockholm,
Washington DC
Brussels,
Singapore
Beijing,
Paris
Moscow,
Tokyo
4 |
 Demonstrating Competitive Strength
5
Achieving Results on 2010 Priorities
•
Grow market share
–
Leasing
momentum
continues;
Q3
revenue
up
>
20%
in
local
currency
across
all
regions
–
Project & Development Services revenue up 25% in Q3
•
Improve operating income margins and maintain cost discipline
–
Adjusted operating income margin of 7.2% YTD, 4.3% in 2009
–
Compensation as a % of revenue is 65.4% YTD, 66.3% in 2009
–
Operating, administration and other as a % of revenue decreased 1.5% in Q3 and 1.0%
YTD •
Continue to build annuity revenue
–
Expand
corporate
outsourcing
leadership;
81
new
wins,
expansions
and
renewals
YTD
–
Property & Facility Management revenue up 10% in Q3 driven by 20% growth in
Americas •
LaSalle Investment Management: leverage global scale and market reputation
–
Strong pace of capital raised, $5.3 billion in net new capital commitments YTD
–
Well-positioned for emerging opportunities; $2.5 billion of investments made YTD,
$1.7 billion in Q3 •
Maintain strong financial position
–
Renewed bank credit facility, capacity increased to $1.1 billion; maturity extended to
September 2015 –
New pricing at LIBOR + 2.25% (all in ~ 2.50%)
–
Increased capacity provides strength, liquidity to meet current commitments and
capitalize on new opportunities |
 Q3 Selected Business Wins and Expansions
MULTI-
REGIONAL
Sony Electronics 6M sf
Citi 28M sf
Senate Square, Washington DC $78M
International Paper 18M sf
Royal Palm, South Beach FL $126M
BBVA Compass 6M sf
Dassault Systèmes, Waltham MA 320k sf
Ally Financial 5M sf
Verisign, Reston VA 221k sf
Sheraton Chicago Hotel $158M
Southern Union Company, Houston TX 193k sf
Stanley Black & Decker 8M sf
The Lutetia, Paris €145M
O'Parinor Shopping Centre, Paris €223M
Turkish Retail
Grand Buildings, London £173M
Liber/Linklaters/Episerver, Sweden 101k sf
Bicocca, Milan €62M
Australian Federal Police 430k sf
Courtyard by Marriott, Gold Coast Australia $46M
Tyco Electronics, Shanghai 127k sf
HiTi Digital, Taiwan 420k sf
Direct Factory Outlets, Australia $473M
King & Wood PRC Lawyers, Beijing 97k sf
Galaxy Department Store, Taipei $95M
MARG, Chennai 116k sf
IBIS Bencoolen, Singapore
Agriculture Bank of China 328M sf
6 |
 Third Quarter Financial Information |
 8
Q3 2010 Revenue Performance
Note: Equity losses of $5.0M and $2.0M in 2009 and 2010, respectively, are included in
segment results, however, are excluded from Consolidated totals.
Americas
EMEA
Asia Pacific
$238.8
$309.1
2009
2010
29%
$154.2
$169.3
2009
2010
18%
$136.4
$165.0
2009
2010
15%
$63.0
$60.9
2009
2010
3%
Consolidated
$595.3
$708.4
2009
2010
20%
($ in millions; % change in local currency )
LIM |
 Asia
Pacific 9
Q3 2010 Real Estate Services Revenue
Americas
EMEA
Leasing
Capital Markets &
Hotels
Property & Facility
Management
Project &
Development Services
Advisory, Consulting
& Other
Total RES
Operating Revenue
$152.6
$25.2
$62.6
$40.7
$28.0
$309.1
38%
127%
20%
16%
6%
29%
$47.8
$31.1
$32.6
$29.2
$28.6
$169.3
42%
11%
6%
20%
8%
18%
$35.2
$18.3
$75.6
$19.2
$16.7
$165.0
21%
13%
5%
69%
8%
15%
$235.6
$74.6
$170.8
$89.1
$73.3
$643.4
36%
34%
10%
25%
22%
Total RES
Revenue
2%
($ in millions; % change in local currency over Q3 2009)
Note: Segment and Consolidated Real Estate Services (“RES”) operating
revenue exclude Equity earnings (losses). |
 10
YTD 2010 Revenue Performance
Note: Equity losses of $56.2M and $10.9M in 2009 and 2010, respectively, are included
in segment results, however, are excluded from Consolidated totals.
($ in millions; % change in local currency
)
Americas
EMEA
Asia Pacific
$686.9
$833.1
2009
2010
21%
$417.9
$491.4
2009
2010
21%
$360.5
$455.3
2009
2010
17%
$178.7
$144.1
2009
2010
21%
Consolidated
$1,665.6
$1,969.4
2009
2010
17%
LIM |
 Asia
Pacific 11
YTD 2010 Real Estate Services Revenue
($ in millions; % change in local currency over YTD 2009)
Americas
EMEA
Leasing
Capital Markets &
Hotels
Property & Facility
Management
Project &
Development Services
Advisory, Consulting
& Other
Total RES
Operating Revenue
$410.2
$49.0
$182.7
$110.8
$80.1
$832.8
27%
97%
24%
4%
1%
21%
$133.4
$89.3
$102.3
$82.8
$83.6
$491.4
34%
34%
13%
16%
5%
20%
$97.1
$52.3
$214.4
$44.7
$46.8
$455.3
32%
55%
3%
33%
7%
16%
$640.7
$190.6
$499.4
$238.3
$210.5
$1,779.5
29%
52%
12%
8%
3%
19%
Total RES
Revenue
Note: Segment and Consolidated Real Estate Services (“RES”) operating
revenue exclude Equity earnings (losses). |
 Separate
Account Management
(Firm’s co-investment =
$17.0M)
•
$19.0 billion of assets
under management
(16% increase from 2009)
(1)
AUM data reported on a one quarter lag
Fund Management
(Firm’s co-investment =
$160.0M)
•
$14.1 billion of assets
under management
(13% decline from 2009)
Public Securities
(Firm’s co-investment =
$0.1M)
•
$7.1 billion of assets
under management
(42% increase over 2009)
Q3 2010 Statistics
(1)
Q3 2010
YTD 2010
New Separate Accounts Mandates
$500
$4,200
Net New Equity for Funds and Public Securities
500
1,100
Net New Capital Commitments
$1,000
$5,300
Total AUM
$40.2 billion
Operating Revenue
LaSalle Investment Management
Premier global investment manager
1%
5%
Capital Raising Summary
($ in millions; % change in local currency )
12 |
 Solid Cash Flows and Balance Sheet Position
•
Strong cash from earnings growth
•
Paid first deferred Staubach obligation
of
$76
million
(2)
•
Renewed and extended credit facility
-
Capacity increased to $1.1 billion,
previously $840 million
-
Maturity extended to September 2015
•
Investment grade ratings affirmed:
Standard & Poor’s:
BBB-
(Outlook: Stable)
Moody’s Investor Services:
Baa2
(Outlook: Stable)
YTD 2010 Highlights
Cash Flows
Q3 2010
YTD
Q3 2009
YTD
Cash from Earnings
$192
$135
Working Capital
(84)
(91)
Cash from Operations
$108
$44
Primary Uses
Capital Expenses
(1)
(23)
(31)
Acquisitions & Deferred Payment Obligations
(113)
(15)
Co-Investment
(25)
(26)
Dividends
(4)
(4)
Net Cash Outflows
($165)
($76)
Net Share Activity & Other Financing
(27)
192
Net Debt (Borrowings) / Repayments
($84)
$160
Balance Sheet
Q3 2010
Q3 2009
Cash
$72
$57
Short Term Borrowings
29
57
Credit Facilities
253
292
Net Bank Debt
$210
$292
Deferred Business Obligations
299
392
Total Net Debt
$509
$684
(1)
YTD Capital Expenditures for 2010 and 2009 net of tenant improvement allowances
received were $22 million and $25 million, respectively (2)
$78 million due less $2 million deferred in accordance with the merger agreement
13
($ in millions; % change in local currency ) |
 Appendix |
 15
Q3 2010 Adjusted EBITDA
*
Performance
Americas
EMEA
Asia Pacific
LIM
$38.9
$46.0
2009
2010
$1.4
$7.4
2009
2010
$10.4
$11.0
2009
2010
$14.5
$15.6
2009
2010
Consolidated
$66.2
$78.7
2009
2010
*
Refer
to
slide
18
for
Reconciliation
of
GAAP
Net
Income
(Loss)
to
EBITDA
and
adjusted
EBITDA
for
the
three
months
ended
September
30,
2010,
and
2009,
for
details
relative
to
these
adjusted
EBITDA
calculations.
Segment
adjusted
EBITDA
is
calculated
by
adding
the
segment’s
Depreciation
and
amortization
and
non-cash
co-investment
charges
to
its
reported
Operating
income
(loss),
which
excludes
Restructuring
charges.
Consolidated
adjusted
EBITDA
is
the
sum
of
the
adjusted
EBITDA
of
the
four
segments
less
net
income
attributable
to
non-controlling
interests
and
dividends
on
unvested
common
stock.
($ in millions) |
 16
YTD 2010 Adjusted EBITDA
*
Performance
Americas
EMEA
Asia Pacific
$81.6
$105.2
2009
2010
($9.4)
$12.7
2009
2010
$15.4
$33.7
2009
2010
$42.6
$39.5
2009
2010
Consolidated
$126.4
$193.7
2009
2010
*
Refer
to
slide
18
for
Reconciliation
of
GAAP
Net
Income
(Loss)
to
EBITDA
and
adjusted
EBITDA
for
the
nine
months
ended
September
30,
2010,
and
2009,
for
details
relative
to
these
adjusted
EBITDA
calculations.
Segment
adjusted
EBITDA
is
calculated
by
adding
the
segment’s
Depreciation
and
amortization
and
non-cash
co-investment
charges
to
its
reported
Operating
income
(loss),
which
excludes
Restructuring
charges.
Consolidated
adjusted
EBITDA
is
the
sum
of
the
adjusted
EBITDA
of
the
four
segments
less
net
income
attributable
to
non-controlling
interests
and
dividends
on
unvested
common
stock.
($ in millions)
LIM |
 17
($ in millions)
Reconciliation of GAAP Net Income (Loss) to
Adjusted Net Income
Note:
Basic
shares
outstanding
are
used
in
the
calculation
of
GAAP
EPS
for
the
nine
months
ending
September
30,
2009,
as
the
use
of
dilutive
shares
outstanding
would
cause
that
EPS
calculation
to
be
anti-dilutive.
2010
2009
2010
2009
GAAP net income (loss)
37.1
$
19.8
$
69.1
$
(56.1)
$
Shares (in 000's)
44,089
43,300
44,064
37,432
GAAP earnings (loss) per share
0.84
$
0.46
$
1.57
$
(1.50)
$
GAAP net income (loss)
37.1
$
19.8
$
69.1
$
(56.1)
$
Restructuring, net of tax
0.3
3.6
4.2
31.1
Non-cash co-investment charges, net of tax
0.7
3.2
7.4
40.4
Adjusted net income
38.1
$
26.6
$
80.7
$
15.4
$
Shares (in 000's)
44,089
43,300
44,064
38,880
Adjusted earnings per share
0.86
$
0.61
$
1.83
$
0.40
$
Three Months Ended
September 30,
Nine Months Ended
September 30, |
 18
($ in millions)
Reconciliation of GAAP Net Income (Loss) to
EBITDA and Adjusted EBITDA
2010
2009
2010
2009
Net income (loss)
37.1
$
19.8
$
69.1
$
(56.1)
$
Interest expense, net of interest income
11.5
16.3
35.7
43.6
Provision (benefit) for income taxes
11.1
3.5
20.8
(9.8)
Depreciation and amortization
17.7
18.7
53.0
64.6
EBITDA
77.4
$
58.3
$
178.6
$
42.3
$
Non-cash co-investment charges
0.9
3.7
9.6
47.5
Restructuring
0.4
4.2
5.5
36.6
Adjusted EBITDA
78.7
$
66.2
$
193.7
$
126.4
$
Three Months Ended
September 30,
September 30,
Nine Months Ended |