Attached files
| file | filename |
|---|---|
| 8-K - FORM 8-K - EXELON GENERATION CO LLC | d8k.htm |
| EX-99.1 - PRESS RELEASE AND EARNINGS RELEASE ATTACHMENTS - EXELON GENERATION CO LLC | dex991.htm |
 Earnings Conference Call
3
rd
Quarter
2010
October 22, 2010
Exhibit 99.2 |
 2
Forward-Looking Statements
This presentation includes forward-looking statements within the meaning of the
Private Securities Litigation Reform Act of 1995, that are subject to risks
and uncertainties. The factors that could cause actual results to differ
materially from these forward-looking statements include those discussed
herein as well as those discussed in (1) Exelon’s 2009 Annual Report on Form
10-K in (a) ITEM 1A. Risk Factors, (b) ITEM 7. Management’s
Discussion and Analysis of Financial Condition and Results of Operations and
(c) ITEM 8. Financial Statements and Supplementary Data: Note 18; (2) Exelon’s
Third Quarter 2010 Quarterly Report on Form 10-Q (to be filed on October 22,
2010) in (a) Part II, Other
Information,
ITEM
1A.
Risk
Factors,
(b)
Part
1,
Financial
Information,
ITEM
2.
Management’s
Discussion and Analysis of Financial Condition and Results of Operations and (c)
Part I , Financial Information,
ITEM
1.
Financial
Statements:
Note
13
and
(3)
other
factors
discussed
in
filings
with
the
Securities and Exchange Commission (SEC) by Exelon Corporation, Commonwealth Edison
Company, PECO Energy Company and Exelon Generation Company, LLC (Companies).
Readers are cautioned not to place undue reliance on these
forward-looking statements, which apply only as of the date of this
presentation. None of the Companies undertakes any obligation to publicly release
any revision to its forward-looking statements to reflect events or
circumstances after the date of this presentation.
This presentation includes references to adjusted (non-GAAP) operating earnings
and non-GAAP cash flows that exclude the impact of certain factors. We
believe that these adjusted operating earnings and cash flows are
representative of the underlying operational results of the Companies.
Please refer to the appendix to this presentation for a reconciliation of adjusted
(non-GAAP) operating earnings
to
GAAP
earnings.
Please
refer
to
the
footnotes
of
the
following
slides
for
a
reconciliation
of
non-GAAP cash flows to GAAP cash flows. |
 3
1997
1998
1999
2000
2001
2002
2003
2004
2005
2006
2007
2008
2009
2010
YTD
10-year Anniversary
107%
76%
2%
EXC
UTY
S&P 500
(1)
Total Shareholder Return is the total return after reinvesting all dividends back
into the security at the closing price on the day following the relevant ex-dividend date.
Includes
stock
price
appreciation
with
dividend
reinvestment.
Excludes
taxes
and
fees.
Data
as
of
10/20/10.
(2) Chart represents dividends per share paid by Exelon for 2001 and expected
dividend for 2010, which is subject to Board approval. Improvement in ComEd
& PECO operating & financial performance
Improved reliability records
Reasonable regulated returns
Hedging strategy creates incremental value
Consistently strong earnings and cash flow
through various economic and commodity
market cycles
$0.85
$2.10
2001
2010
Note:
Chart
above
shows
capacity
factor
for
ComEd
nuclear
plants
in
1997
and
1998
and
Exelon for 1999 and beyond. 2010 capacity factor represents YTD performance.
66%
89%
92.7% -
94.5%
49%
Total
Shareholder
Return
(1)
since
Merger
Nuclear Capacity Factor Improvement
Dividend Growth
(2)
Operational & Financial Excellence |
 4
2010 Operating Earnings Guidance
2010 Revised
Guidance
2010 Prior
Guidance
$0.45 -
$0.55
$2.80 -
$2.95
$3.80 -
$4.10
(1)
ComEd
PECO
Exelon
Generation
ComEd
PECO
Exelon
Generation
Holdco
Holdco
Exelon
$0.60 -
$0.70
Exelon
$3.95 -
$4.10
(1)
$0.65 -
$0.70
$0.50 -
$0.55
$2.90 -
$3.00
(1) Refer
to
Earnings
Release
Attachments
for
additional
details
and
to
the
Appendix
for
a
reconciliation
of
adjusted
(non-GAAP)
operating
EPS
to
GAAP
EPS.
Key Drivers of FY Guidance
+
Generation margins driven by
favorable market conditions and
higher nuclear volume
+
Favorable YTD weather at ComEd
and PECO
Narrowed
2010
operating
earnings
guidance
to
$3.95-$4.10/share
(1) |
 5
2017/
2018
2016/
2017
2015/
2016
2014/
2015
PJM RPM Auctions
Delivery Year
2010
2011
2012
2013
2014
2015
2016
2017
2018
EPA Regulations –
Market Implications
Leading up to 2012 Compliance
Air
Pollutants
Criteria
Pollutants
Greenhouse
Gases
Coal
Combustion
Waste
Develop 316(b)
Regulations
Compliance with 316(b) regulations
Develop and Implement New
Steam Effluent Guidelines
for Wastewater
Compliance with Federal Steam Effluent
Guidelines
Compliance with Federal CCW Regulations
Compliance with Federal GHG Reporting Rule
PSD/BACT and Title V Applies to GHG Emissions from New and Modified Sources
Develop GHG Cap and Trade
Legislation or EPA GHG
Regulations Under CAA
Compliance with GHG Cap
and Trade Legislation or EPA
GHG
Regs
Under CAA
Compliance with MACT
HAP ICR
Develop Coal
and Oil MACT
Develop Clean Air
Transport Rule
(CATR)
Compliance with Transport Rule I
Compliance with Transport Rule II
Develop Revised NAAQS
(Ozone, PM2.5, SO2, NO2)
and finalize Transport Rule II
Develop Coal
Combustion Waste
Rule
Cooling
Water
Hazardous
Pre-Compliance Period
Pre-Compliance Period
Pre-Compliance Period
Notes: Reliability Pricing Model (RPM) auctions take place annually in May.
For definition of the EPA regulations referred to on this slide, please see the EPA’s Terms of
Environment (http://www.epa.gov/OCEPAterms/). |
 6
$1.76
$0.85
$0.88
$0.96
$1.26
$1.60
$1.60
$2.03
$2.10
$2.10
2001
2002
2003
2004
2005
2006
2007
2008
2009
2010E
Strong, stable dividend remains a key
component of shareholder value return
Note: CAGR= Compound Annual Growth Rate. Chart represents dividends per share paid
by Exelon for 2001-2009 and expected dividend for 2010, which is subject
to Board approval.
(1)
Dividend yield as of October 20, 2010. Competitive Integrated Yield average
includes AYE, CEG, EIX, ETR, FE, NEE, PPL, and PEG. Regulated Integrated
Yield average includes AEP, AEE, D, DTE, DUK, PCG, PGN, SO, WEC, and
XEL. (2)
2001 dividend excludes $0.065 per share pro-rata dividend related to the
Unicom-PECO merger. Exelon offers one of the highest yields among its
peers Dividend Yield
(1)
Exelon: 4.7%
Competitive Integrateds: 4.2%
Regulated Integrateds: 4.6%
Historical CAGR (2001-2010) ~10%
(2) |
 7
Key Financial Messages
Operating results for 3Q10
•
Operating earnings of $1.11/share
(1)
•
95.4% nuclear capacity factor
Disciplined hedging program
•
Adds value to the portfolio while protecting the balance sheet and cash
flows Regulatory Update
•
Settlements reached in PECO electric and gas distribution rate cases,
awaiting Pennsylvania Public Utility Commission (PAPUC) approval
•
ComEd rate case in progress, filed for rehearing of Appellate Court ruling
(1) Refer to Earnings Release Attachments for additional details
and to the Appendix for a reconciliation of adjusted (non-GAAP) operating EPS to GAAP EPS. |
 8
Operating EPS
(1) Refer to Earnings Release Attachments for additional details and to the
Appendix for a reconciliation of adjusted (non-GAAP) operating EPS to GAAP EPS. $0.76
$0.14
$0.75
$0.19
$0.07
$0.18
2009
2010
$2.50
$0.42
$2.10
$0.51
$0.55
$0.38
2009
2010
HoldCo/Other
ExGen
PECO
ComEd
$1.14
$1.27
GAAP EPS
Year-to-Date (YTD)
(1)
$3.10
$3.19
$3.21
$3.08
$1.11
$0.96
Strong performance at the utilities drove quarter over quarter earnings higher; 3Q10
earnings exceeded guidance of $1.00-$1.10/share
3
rd
Quarter (3Q)
(1) |
 9
Exelon Generation
Operating EPS Contribution
2010
2009
Key Drivers –
3Q10 vs. 3Q09
(1)
Lower energy prices under the PECO
PPA, offset at PECO: $(0.09)
Higher nuclear fuel costs: $(0.03)
Higher depreciation expense: $(0.02)
Favorable RPM capacity pricing: $0.06
Lower income tax expense due to higher
allowed manufacturing deduction: $0.05
(1) Refer to the Earnings Release Attachments for additional details and to the
Appendix for a reconciliation of adjusted (non-GAAP) operating EPS to GAAP EPS.
(2) Outage days exclude Salem.
19
36
Refueling
19
21
Non-refueling
3Q10
3Q09
Outage Days
(2)
3Q
YTD
$0.76
$2.50
$0.75
$2.10
Note: PPA = Power Purchase Agreement |
 10
Key Drivers –
3Q10 vs. 3Q09
(1)
Weather: $0.06
Reversal of 1Q09 IL tax ruling: $0.05
Uncollectible rider: $0.02
Increased storm costs: $(0.01)
ComEd Operating EPS Contribution
(1) Refer to the Earnings Release Attachments for additional details and to the
Appendix for a reconciliation of adjusted (non-GAAP) operating EPS to GAAP EPS.
2010
2009
3Q
YTD
$0.07
$0.38
3Q10
Actual
Normal
% Change
Heating
Degree-Days
70
110
(36.4)%
Cooling
Degree-Days
854
624
36.9%
$0.18
$0.55 |
 11
PECO Operating EPS Contribution
Key Drivers –
3Q10 vs. 3Q09
(1)
Increased CTC revenue resulting
in lower energy prices paid to
Generation under the PPA, offset
at Generation: $0.09
Weather: $0.05
Higher O&M, primarily bad debt
due to increased revenue: $(0.02)
CTC amortization $(0.06)
2010
2009
(1) Refer to the Earnings Release Attachments for additional details and to the
Appendix for a reconciliation of adjusted (non-GAAP) operating EPS to GAAP EPS. 3Q
YTD
$0.14
$0.42
3Q10
$0.19
$0.51
Actual
Normal
% Change
Heating Degree-Days 0
36
n/a Cooling Degree-Days 1,212
939
29.1% |
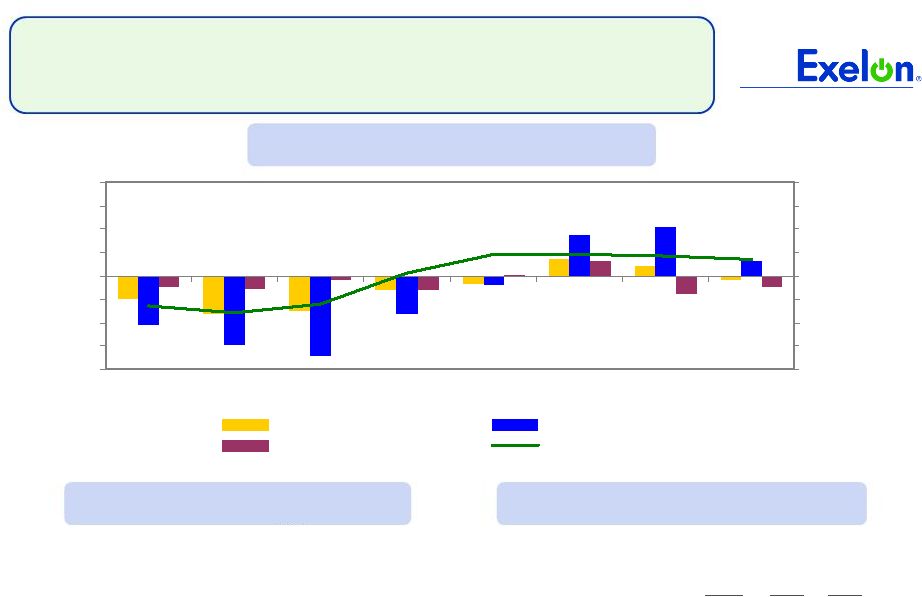 12
-10.0%
-7.5%
-5.0%
-2.5%
0.0%
2.5%
5.0%
7.5%
10.0%
1Q09
2Q09
3Q09
4Q09
1Q10
2Q10
3Q10
4Q10E
-10.0%
-7.5%
-5.0%
-2.5%
0.0%
2.5%
5.0%
7.5%
10.0%
All Customer Classes
Large C&I
Residential
Gross Metro Product
ComEd Load Trends
Note: C&I = Commercial & Industrial
Chicago
Unemployment rate
(1)
10.0%
2010 annualized growth in
gross metro product
(2)
2.1%
7/10 Home price index
(3)
(1.7)%
(1) Source: Illinois Dept. of Employment Security (August 2010)
(2)
Source: Global Insight (September 2010)
(3)
Source: S&P Case-Shiller Index
(4)
Not adjusted for leap year effect
2009
(4)
3Q10 2010E
Average Customer Growth
(0.4)%
0.3% 0.3%
Average Use-Per-Customer
(1.0)%
(2.3)%
(0.8)%
Total Residential
(1.4)%
(2.0)% (0.5)%
Small C&I
(2.2)%
0.8% (0.6)%
Large C&I
(6.7)%
5.2% 2.5%
All Customer Classes
(3.3)%
1.1% 0.4%
Weather-Normalized
Load
Year-over-Year
Key Economic Indicators
Weather-Normalized Load
(4) |
 13
PECO Load Trends
Philadelphia
Unemployment rate
(1)
9.2%
2010 annualized growth in
gross domestic/metro product
(2)
0.8%
Note: C&I = Commercial & Industrial
Key Economic Indicators
Weather-Normalized Load
2009
(3)
3Q10 2010E
Average Customer Growth
(0.2)%
0.4%
0.2%
Average Use-Per-Customer
(2.1)%
2.1%
0.9%
Total Residential
(2.3)%
2.5% 1.1%
Small C&I
(2.7)%
0.1% (1.6)%
Large C&I
(3.0)%
(1.0)% 0.3%
All Customer Classes
(2.6)%
0.5% 0.2%
(1) Source: U.S Dept. of Labor Preliminary data (August 2010)
(2)
Source: Moody’s Economy.com August 2010
(3)
Not adjusted for leap year effect
-10.0%
-7.5%
-5.0%
-2.5%
0.0%
2.5%
5.0%
7.5%
10.0%
1Q09
2Q09
3Q09
4Q09
1Q10
2Q10
3Q10
4Q10E
-10.0%
-7.5%
-5.0%
-2.5%
0.0%
2.5%
5.0%
7.5%
10.0%
All Customer Classes
Large C&I
Residential
Gross Metro Product
Weather-Normalized
Load
Year-over-Year
(3) |
 14
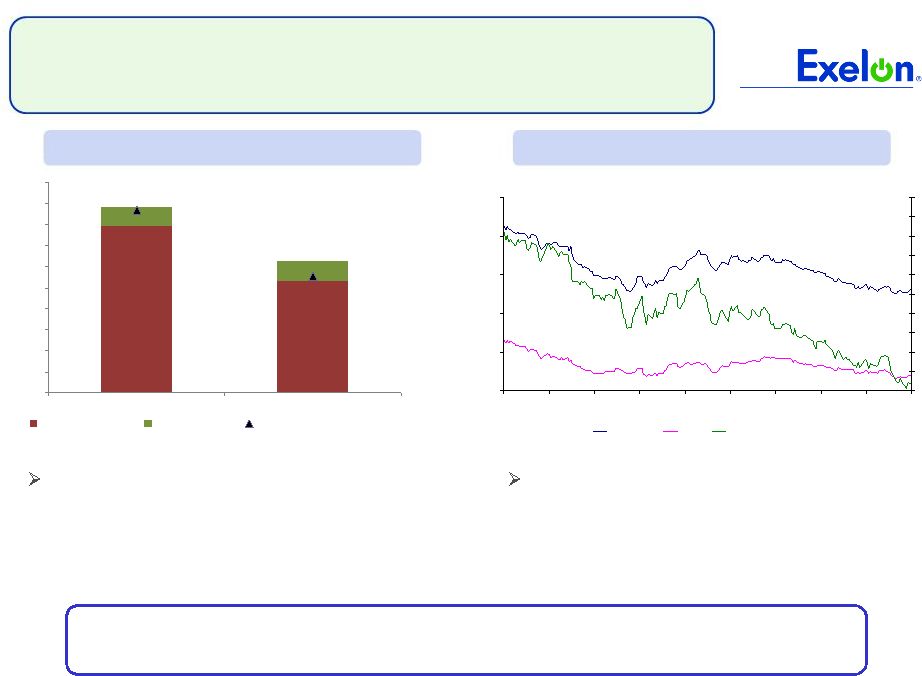
0%
10%
20%
30%
40%
50%
60%
70%
80%
90%
100%
2011
2012
Underlying
Options
Q3 2010 Ratable
Exelon Generation Hedging Program
14
2012 hedging levels currently above
ratable
•
Increased
rate
of
2012
sales
in
2
Quarter
of
2010 to capture higher prices in Mid-Atlantic
•
Participation in long-term procurements
Normal practice is to hedge commodity risk
on a ratable basis over three years
•
Maintain flexibility from quarter to quarter
•
Use of gas and power options to capture potential
upside while providing downside price protection
Note: % values represent amount above ratable plan
1%
8%
Exelon’s ratable hedging program provides flexibility to time sales based
on fundamental view of the market
(1) Data as of end of 3Q 2010
30.00
35.00
40.00
45.00
50.00
55.00
1/4/10
2/3/10
3/5/10
4/4/10
5/4/10
6/3/10
7/3/10
8/2/10
9/1/10
5.00
5.20
5.40
5.60
5.80
6.00
6.20
6.40
6.60
6.80
7.00
PJMW Hub
NiHub
Henry Hub Nat Gas
2012 Historic Power & Gas Prices
Current
Hedge
Level
vs.
Ratable
Plan
(1)
nd |
 15
2010 Projected Sources and Uses of Cash
(1)
Excludes counterparty collateral activity.
(2)
Cash Flow from Operations primarily includes net cash flows provided by operating
activities and net cash flows used in investing activities other than capital expenditures and John Deere
Acquisition. Cash Flow from Operations for PECO and Exelon includes $550
million for competitive transition charges. (3)
Assumes 2010 dividend of $2.10/share. Dividends are subject to declaration by
the Board of Directors. (4)
Represents new business and smart grid/smart meter investment.
(5)
Excludes ComEd’s $191 million of tax-exempt bonds that are backed by
letters of credit (LOCs). Excludes PECO’s $225 million Accounts Receivable (A/R) Agreement with Bank of Tokyo.
PECO’s A/R Agreement was extended in accordance with its terms on September 7,
2010. (6)
Excludes ComEd’s tax-exempt bonds. PECO’s planned debt retirement of
$400 million represents the final retirement of the PECO Energy Transition Trust. ExGen retirements reflect the
repurchase of $212M in tax exempt bonds previously backed by letters of credit.
ExGen retains the ability to reissue the tax-exempt bonds at a future date or refinance with taxable bonds.
(7)
“Other”
includes PECO Parent Receivable, proceeds from options and expected changes in
short-term debt. (8) Includes cash flow activity from Holding
Company, eliminations, and other corporate entities. ($ millions)
Exelon
(8)
Beginning Cash Balance
(1)
$1,050
Cash Flow from Operations
(1)(2)
1,125
1,100
2,425
4,725
CapEx
(excluding Nuclear Fuel, Nuclear
Uprates
and Solar Project, Utility Growth
CapEx)
(725)
(400)
(800)
(1,940)
Nuclear Fuel
n/a
n/a
(850)
(850)
Dividend
(3)
(1,400)
Nuclear Uprates
and Solar Project
n/a
n/a
(275)
(275)
Utility Growth CapEx
(4)
(200)
(100)
n/a
(300)
John Deere Renewables
Acquisition
n/a
n/a
(860)
(860)
Net Financing (excluding Dividend):
Planned Debt Issuances
(5)
500
--
900
1,400
Planned Debt Retirements
(6)
(225)
(400)
(200)
(1,225)
Other
(7)
(75)
150
50
(25)
Ending Cash Balance
(1)
$300 |
  16
Exelon Generation Hedging Disclosures
(as of September 30, 2010) |
 17
17
Important Information
The following slides are intended to provide additional information regarding the hedging
program at Exelon Generation and to serve as an aid for the purposes of modeling Exelon
Generation’s gross margin (operating revenues less purchased power and fuel expense). The
information on the following slides is not intended to represent earnings guidance or a
forecast of future events. In fact, many of the factors that ultimately will determine Exelon
Generation’s actual gross margin are based upon highly variable market factors outside of
our control. The information on the following slides is as of September 30, 2010. We
update this information on a quarterly basis.
Certain information on the following slides is based upon an internal simulation model that
incorporates assumptions regarding future market conditions, including power and
commodity prices, heat rates, and demand conditions, in addition to operating performance
and dispatch characteristics of our generating fleet. Our simulation model and the
assumptions therein are subject to change. For example, actual market conditions and the
dispatch profile of our generation fleet in future periods will likely differ – and may differ
significantly – from the assumptions underlying the simulation results included in the
slides. In addition, the forward-looking information included in the following slides
will likely change over time due to continued refinement of our simulation model and changes in
our views on future market conditions. |
 18
18
Portfolio Management Objective
Align Hedging Activities with Financial Commitments
Power Team utilizes several product types
and channels to market
•
Wholesale and retail sales
•
Block products
•
Load-following products
and load auctions
•
Put/call options
Exelon’s hedging program is designed to
protect the long-term value of our
generating fleet and maintain an
investment-grade balance sheet
•
Hedge enough commodity risk to meet future cash
requirements if prices drop
•
Consider: financing policy (credit rating objectives,
capital structure, liquidity); spending (capital and
O&M); shareholder value return policy
Consider market, credit, operational risk
Approach to managing volatility
•
Increase hedging as delivery approaches
•
Have enough supply to meet peak load
•
Purchase fossil fuels as power is sold
•
Choose hedging products based on generation
portfolio –
sell what we own
•
Heat rate options
•
Fuel products
•
Capacity
•
Renewable credits
% Hedged
High End of Profit
Low End of Profit
Open Generation
with LT Contracts
Portfolio
Optimization
Portfolio
Management
Portfolio Management Over Time |
 19
19
Percentage of Expected
Generation Hedged
•
How many equivalent MW have been
hedged at forward market prices; all hedge
products used are converted to an
equivalent average MW volume
•
Takes ALL
hedges into account whether
they are power sales or financial products
Equivalent MWs Sold
Expected Generation
=
Our normal practice is to hedge commodity risk on a ratable basis
over the three years leading to the spot market
•
Carry operational length into spot market to manage forced outage and
load-following risks
•
By
using
the
appropriate
product
mix,
expected
generation
hedged
approaches
the
mid-90s percentile as the delivery period approaches
•
Participation in larger procurement events, such as utility auctions, and some
flexibility in the timing of hedging may mean the hedge program is not
strictly ratable from quarter to quarter
Exelon Generation Hedging Program |
 20
20
2010
2011
2012
Estimated
Open
Gross
Margin
($
millions)
(1)(2)
$5,650
$4,800
$4,700
Open gross margin assumes all expected generation is
sold at the Reference Prices listed below
Reference Prices
(1)
Henry Hub Natural Gas ($/MMBtu)
NI-Hub ATC Energy Price ($/MWh)
PJM-W ATC Energy Price ($/MWh)
ERCOT
North
ATC
Spark
Spread
($/MWh)
(3)
$4.42
$32.84
$44.41
$1.77
$4.44
$29.92
$41.07
$(0.37)
$5.07
$31.89
$43.10
$0.31
Exelon Generation Open Gross Margin and
Reference Prices
(1)
Based on September 30, 2010 market conditions.
(2)
Gross margin is defined as operating revenues less fuel expense and purchased power
expense, excluding the impact of decommissioning and other incidental revenues. Open
gross margin is estimated based upon an internal model that is developed by
dispatching our expected generation to current market power and fossil fuel prices. Open gross margin
assumes
there
is
no
hedging
in
place
other
than
fixed
assumptions
for
capacity
cleared
in
the
RPM
auctions
and
uranium
costs
for
nuclear
power
plants.
Open
gross
margin
contains assumptions for other gross margin line items such as various ISO bill and
ancillary revenues and costs and PPA capacity revenues and payments. The estimation of open
gross margin incorporates management discretion and modeling assumptions that are
subject to change. (3)
ERCOT North ATC spark spread using Houston Ship Channel Gas, 7,200 heat rate, $2.50
variable O&M. |
 21
21
2010
2011
2012
Expected Generation
(GWh)
(1)
166,800
163,400
162,700
Midwest
99,500
99,100
96,900
Mid-Atlantic
58,500
56,500
57,100
South
8,800
7,800
8,700
Percentage of Expected Generation Hedged
(2)
97-100%
87-90%
62-65%
Midwest
97-100
86-89
61-64
Mid-Atlantic
97-100
93-96
66-69
South
97-100
62-65
49-52
Effective Realized Energy Price
($/MWh)
(3)
Midwest
$46.00
$44.00
$43.50
Mid-Atlantic
$37.00
$57.50
$50.50
ERCOT North ATC Spark Spread
$0.50
$(1.00)
$(4.50)
Generation Profile
(1)
Expected generation represents the amount of energy estimated to be generated or purchased through
owned or contracted for capacity. Expected generation is based upon a simulated dispatch
model that makes assumptions regarding future market conditions, which are calibrated to market quotes for power, fuel, load following products and
options. Expected generation assumes 10 refueling outages in 2010 and 11 refueling outages in
2011 and 2012 at Exelon-operated nuclear plants and Salem. Expected generation
assumes capacity factors of 94.0%, 93.3% and 93.1% in 2010, 2011 and 2012 at Exelon-operated nuclear plants. These estimates of expected generation in 2011
and 2012 do not represent guidance or a forecast of future results as Exelon has not completed its
planning or optimization processes for those years. (2)
Percent of expected generation hedged is the amount of equivalent sales divided by the expected
generation. Includes all hedging products, such as wholesale and retail sales of power,
options, and swaps. Uses expected value on options. Reflects decision to permanently retire Cromby Station and Eddystone Units 1&2 as of May 31, 2011.
Current RMR discussions do not impact metrics presented in the hedging disclosure.
(3)
Effective realized energy price is representative of an all-in hedged price, on a per MWh basis,
at which expected generation has been hedged. It is developed by considering the energy
revenues and costs associated with our hedges and by considering the fossil fuel that has been purchased to lock in margin. It excludes uranium costs
and RPM capacity revenue, but includes the mark-to-market value of capacity contracted at
prices other than RPM clearing prices including our load obligations. It can be compared
with the reference prices used to calculate open gross margin in order to determine the mark-to-market value of Exelon Generation's energy hedges. |
 22
22
Gross Margin Sensitivities with Existing Hedges ($ millions)
(1)
Henry Hub Natural Gas
+ $1/MMBtu
-
$1/MMBtu
NI-Hub ATC Energy Price
+$5/MWH
-$5/MWH
PJM-W ATC Energy Price
+$5/MWH
-$5/MWH
Nuclear Capacity Factor
+1% / -1%
2010
$10
$(5)
$5
$ -
$-
$ -
+/-
$10
2011
$30
$(15)
$60
$(50)
$20
$(15)
+/-
$40
2012
$225
$(175)
$205
$(195)
$120
$(115)
+/-
$40
Exelon Generation Gross Margin Sensitivities
(with Existing Hedges)
(1)
Based on September 30, 2010 market conditions and hedged position. Gas price
sensitivities are based on an assumed gas-power relationship derived from an
internal
model
that
is
updated
periodically.
Power
prices
sensitivities
are
derived
by
adjusting
the
power
price
assumption
while
keeping
all
other
prices
inputs
constant. Due to correlation of the various assumptions, the hedged gross margin
impact calculated by aggregating individual sensitivities may not be equal to the
hedged gross margin impact calculated when correlations between the various
assumptions are also considered. |
 23
23
95% case
5% case
$6,550
$6,450
$5,100
$7,200
$6,600
$6,400
Exelon Generation Gross Margin Upside / Risk
(with Existing Hedges)
$3,000
$4,000
$5,000
$6,000
$7,000
$8,000
$9,000
2010
2011
2012
(1)
Represents an approximate range of expected gross margin, taking into account hedges in place, between
the 5th and 95th percent confidence levels assuming all unhedged supply is sold into the spot
market. Approximate gross margin ranges are based upon an internal simulation model and are subject to change based upon market inputs,
future transactions and potential modeling changes. These ranges of approximate gross margin in 2011
and 2012 do not represent earnings guidance or a forecast of future results as Exelon has not
completed its planning or optimization processes for those years. The price distributions that generate this range are calibrated to market quotes for
power, fuel, load following products and options as of September 30, 2010.
|
 24
24
Midwest
Mid-Atlantic
ERCOT
Step 1
Start
with
fleetwide
open
gross
margin
$5.65 billion
Step 2
Determine the mark-to-market value
of energy hedges
99,500GWh * 98% *
($46.00/MWh-$32.84/MWh)
= $1.28 billion
58,500GWh * 98% *
($37.00/MWh-$44.41/MWh)
= $(0.42 billion)
8,800GWh * 98% *
($0.50/MWh-$1.77/MWh)
= $(0.01) billion
Step 3
Estimate hedged gross margin
by
adding open gross margin to mark-to-
market value of energy hedges
Open gross
margin: $5.65 billion
MTM value of energy
hedges: $1.28billion + $(0.42billion) + $(0.01) billion
Estimated hedged gross margin:
$6.50 billion
Illustrative Example
of Modeling Exelon Generation 2010 Gross Margin
(with Existing Hedges) |
 25
25
25
20
25
30
35
40
45
50
10/09
11/09
12/09
1/10
2/10
3/10
4/10
5/10
6/10
7/10
8/10
9/10
10/10
50
55
60
65
70
75
80
85
90
10/09
11/09
12/09
1/10
2/10
3/10
4/10
5/10
6/10
7/10
8/10
9/10
10/10
35
40
45
50
55
60
65
70
75
10/09
11/09
12/09
1/10
2/10
3/10
4/10
5/10
6/10
7/10
8/10
9/10
10/10
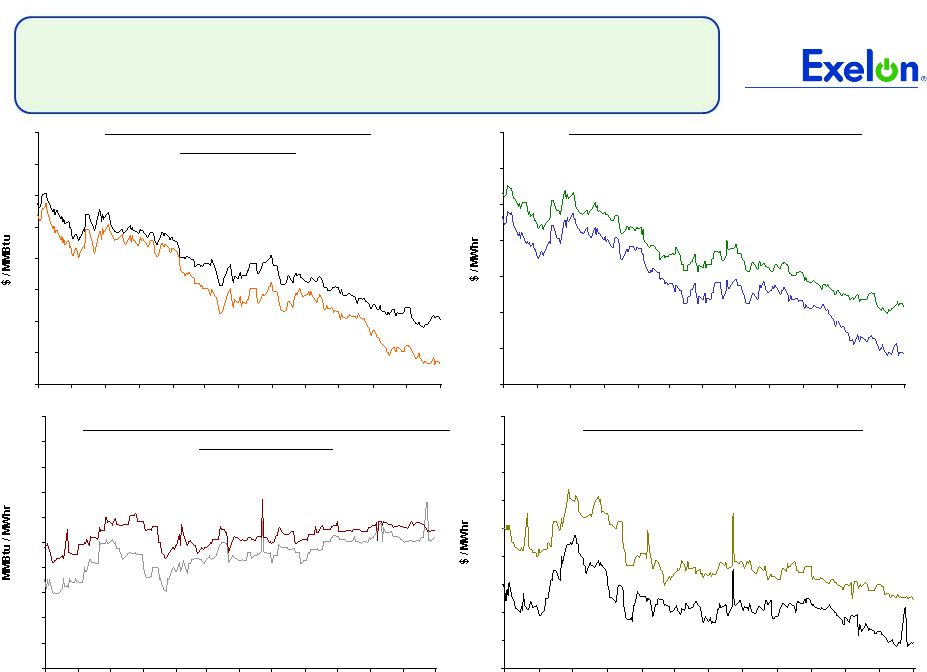
Market Price Snapshot
Forward NYMEX Natural Gas
PJM-West and Ni-Hub On-Peak Forward Prices
PJM-West and Ni-Hub Wrap Forward Prices
2011
$5.64
2012 $5.99
Rolling
12
months,
as
of
October
13 ,
2010.
Source:
OTC
quotes
and
electronic
trading
system.
Quotes
are
daily.
Forward NYMEX Coal
2011
$67.34
2012
$74.56
2011 Ni-Hub $41.12
2012 Ni-Hub
$42.79
2012 PJM-West $55.71
2011 PJM-West
$54.17
2011 Ni-Hub
$24.83
2012 Ni-Hub
$26.30
2012 PJM-West
$39.78
2011 PJM-West
$38.50
4.0
4.5
5.0
5.5
6.0
6.5
7.0
7.5
8.0
10/09
11/09
12/09
1/10
2/10
3/10
4/10
5/10
6/10
7/10
8/10
9/10
10/10
th |
 26
26
26
4.5
5.5
6.5
7.5
8.5
9.5
10.5
11.5
12.5
13.5
10/09
11/09
12/09
1/10
2/10
3/10
4/10
5/10
6/10
7/10
8/10
9/10
10/10
8.0
8.2
8.4
8.6
8.8
9.0
9.2
9.4
9.6
9.8
10.0
10/09
11/09
12/09
1/10
2/10
3/10
4/10
5/10
6/10
7/10
8/10
9/10
10/10
35
40
45
50
55
60
65
70
10/09
11/09
12/09
1/10
2/10
3/10
4/10
5/10
6/10
7/10
8/10
9/10
10/10
4.0
4.5
5.0
5.5
6.0
6.5
7.0
7.5
8.0
10/09
11/09
12/09
1/10
2/10
3/10
4/10
5/10
6/10
7/10
8/10
9/10
10/10
Market Price Snapshot
2012
9.06
2011
8.90
2011
$49.19
2012
$43.26
2011
$5.53
2012
$5.87
Houston Ship Channel Natural Gas
Forward Prices
ERCOT North On-Peak Forward Prices
ERCOT North On-Peak v. Houston Ship Channel
Implied Heat Rate
2011
$7.29
2012
$8.87
ERCOT North On Peak Spark Spread
Assumes a 7.2 Heat Rate, $1.50 O&M, and $.15 adder
Rolling
12
months,
as
of
October
13 ,
2010.
Source:
OTC
quotes
and
electronic
trading
system.
Quotes
are
daily.
th |
  27
Appendix |
 28
ComEd Delivery Service
Rate Case Filing Summary
$396
$45
Other adjustments
(5)
$22
Bad debt costs (resets base level of bad debt to 2009 test year)
$55
Pension and Post-retirement health care expenses
(4)
$95
Capital Structure
(3)
: ROE –
11.50% /
Common Equity –
47.33% / ROR –
8.99%
$179
(2)
Rate Base: $7,717 million
(1)
Requested Revenue
Increase
($ in millions)
Primary drivers of rate request are new plant investment, pension/retiree
health care and cost of capital
(1)
Filed
June
30,
2010
based
on
2009
test
year,
including
pro
forma
capital
additions
through
June
2011,
and
certain
other
2010
pro
forma adjustments. Updating the depreciation and deferred tax reserves to June
2011 would reduce rate base by an estimated $667 million and would reduce
the revenue requirement by approximately $85 million. (2)
Includes increased depreciation expense.
(3)
Requested capital structure does not include goodwill; ICC docket 07-0566
allowed 10.3% ROE, 45.04% equity ratio and 8.36% ROR. ROE includes 0.40%
adder for energy efficiency incentive. (4)
Reflects 2010 expense levels, compared to 2007 expense levels allowed in last rate
case. (5)
Includes reductions to O&M and taxes other than income, offset by wage
increases, normalization of storm costs and the Illinois Electric
Distribution
Tax,
other
O&M
increases
and
decreases
in
load.
(6)
Net of Other Revenues.
Note: ROE = Return on Equity, ROR = Return on Rate Base, ICC = Illinois
Commerce Commission. ICC Docket No. 10-0467
Total ($2,337 million revenue requirement)
(6) |
 29
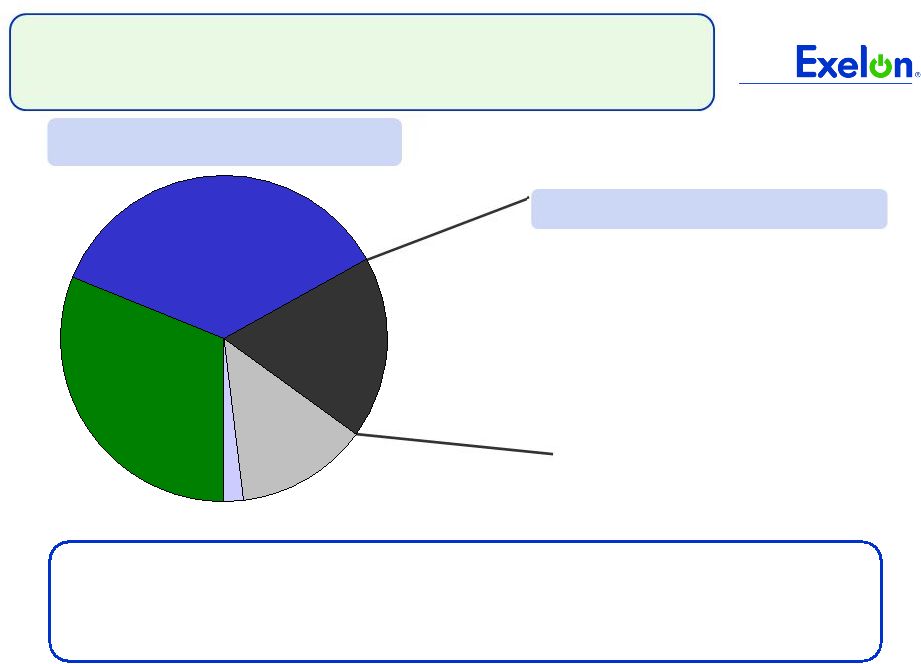
ComEd Customer Usage Breakdown
Other
2%
Residential
31%
Small C&I
36%
380 Large
C&I
18%
Other Large
C&I
13%
3%
Leisure & Hospitality
9%
Trade, Transportation & Utilities
11%
Finance, Professional &
Business Services
12%
Health & Educational Services
13%
Government
52%
Manufacturing
Customer Usage by Revenue Class
Top
380
Customer
Usage
by
Segment
Limited survey of select Large C&I customers has indicated an increase in
production via longer production runs and additional shifts due to improved
economic conditions for manufacturing-based customers, especially in the
steel and transportation sectors, along with data center expansions.
|
 30
PECO –
Electric & Gas Distribution
Rate Case Settlements
Joint settlement filed with the PAPUC on August 31, 2010 for both electric and gas
rate cases
Settlements are subject to administrative law judges review and PAPUC approval by
mid-December 2010
$20 million
$225 million
Revenue Requirement Increase in
settlement
(1)
R-2010-2161592
R-2010-2161575
Docket #
~7%
Electric
~4%
2011 Distribution Price Increase as %
of Overall Customer Bill for Residential
customers
Gas
Rate Case Details
New rates scheduled to go into effect on January 1, 2011
(1) Settlements are on an overall revenue requirement basis, meaning no details are provided for
allowed ROE, rate base or capital structure. Note: Electric and gas rate case filings available on PAPUC website (www.puc.state.pa.us) or www.peco.com/know. |
 31
PECO Procurement
(1)
See PECO Procurement website (http://www.pecoprocurement.com) for additional
details regarding PECO’s procurement plan and RFP results. (2)
Wholesale prices. No Small/Medium Commercial products were procured in the
June 2009 RFP. (3)
For Large C&I customers who previously opted to participate in the 2011
fixed-priced full requirements product. (4)
Large Hourly price includes ancillary services and supplier-provided AEPS cost.
Large Commercial and Industrial
Large
Fixed
May
’10
RFP
-
average
price
of
$77.55/MWh
(2)(3)
Large
Hourly
Sept
‘10
RFP
-
average
price
of
$4.83/MWh
(4)
Medium Commercial
Sept
’09
/
May
’10
RFP
aggregate
result
$77.89/MWh
(2)
Sept
‘10
RFP
average
price
of
$70.36/MWh
(2)
Residential
June
’09
RFP
average
price
of
$88.61/MWh
(2)
Sept
’09
RFP
average
price
of
$79.96/MWh
(2)
May
‘10
RFP
average
price
of
$69.38/MWh
(2)
Sept
’10
RFP
average
price
of
$66.83/MWh
(2)
Small Commercial
Sept
’09
/
May
’10
RFP
aggregate
result
$77.65/MWh
(2)
Sept
‘10
RFP
average
price
of
$70.82/MWh
(2)
85% full requirements
15% full requirements
spot
Medium Commercial
(peak demand >100
kW but <= 500 kW)
Fixed-priced full
requirements
(3)
Hourly full requirements
Large Commercial &
Industrial (peak
demand >500 kW)
90% full requirements
10% full requirements
spot
75% full requirements
20% block energy
5% energy only spot
Products
Small Commercial
(peak demand <100
kW)
Residential
Customer Class
2011 Supply Procured
2011 supply procured, two auctions per year moving forward
PECO Procurement Plan
(1) |
 32
5.03
6.26
5.84
0.69
0.51
2.57
8.40
PECO Electric Residential Rate
Increases 2010 to 2011
January 1, 2011
January 1, 2010
Total = 14.7¢
Unit Rates (¢/kWh)
Proposed Total Bill
Increase ~5.1 %
Total = 15.4¢
AEPS
~0.7%
Smart Meter
~0.6%
Default Service surcharge
mechanism
~(2.9)% Transmission and
Distribution ~7% Transmission
surcharge
mechanism
~1.2%
Distribution Rate
Case ~5.5%
Energy / Capacity
Competitive Transition
Charge
Transmission
Distribution
0.47
Energy Efficiency
Surcharge
Breakdown of 2010 to 2011
~5.1% Increase (On Total Bill)
Notes:
•
Rates effective January 1, 2010 include Act 129 Energy Efficiency surcharge of
2%. •
Represents
average
of
all
residential
rates
including
the
effect
of
discounted
rates
provided
to
low
income
customers.
0.29 |
 33
PA Gross Receipts Tax (5.90%)
Distribution Losses (7.35%)
Full Requirements Cost
PJM Whub ATC Forward Energy Price
Estimated Build-Up of PECO Average
Residential Full Requirements Price
$76.50/MWh
$23.75 -
$26.25
$41.50 -
$42.50
Full Requirements Costs ($/MWh)
Average Full
Requirements
Retail Sales Price
(1)
Load Shape &
Ancillary Services
$5.75 -
$6.25
Capacity
$11.50 -
$12.00
Transmission &
Congestion
$3.50 -
$4.50
Renewable
Energy
Credits
$0.25
Migration,
Volumetric
Risk & Other
$2.75 -
$3.25
~$5.00
~$4.50
(1)
As provided by Exelon Generation.
(2)
On October 14, 2010 the Independent Evaluator (NERA) announced a
wholesale winning bid of $66.83/MWh for PECO’s Fall 2010 RFP Residential
Price. (1)
As provided by Exelon Generation.
(2)
On October 14, 2010 the Independent Evaluator (NERA) announced a
wholesale winning bid of $66.83/MWh for PECO’s Fall 2010 RFP Residential
Price. Average
Wholesale
Energy Price
$66.83
(2) |
 34
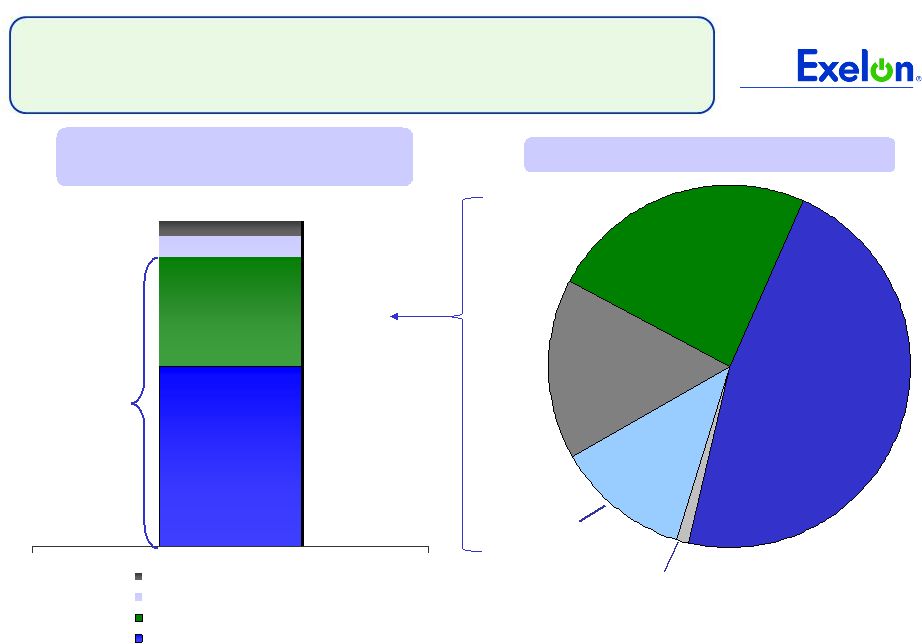
PECO Customer Usage Breakdown
Other
3%
Other Large
C&I
24%
150 Large
C&I
17%
Small C&I
22%
Residential
34%
7%
Other
13%
Transportation, Communication &
Utilities
18%
Health & Educational Services
18%
Manufacturing
22%
Petroleum
2%
Retail Trade
9%
Finance, Insurance & Real Estate
12%
Pharmaceuticals
Customer Usage by Revenue Class
Top 150 Customer Usage by Segment
PECO’s load is relatively diversified by customer class and industry
|
 35
ComEd and PECO Accounts Receivable
ComEd A/R
(1)
3Q08
3Q09
3Q10
PECO A/R
(1)
% of AR
$789M
$714M
$769M
(1) Accounts receivable amounts include unbilled receivables and are
gross of allowance for uncollectible accounts at ComEd and PECO and include, for PECO, pledged and
long-term receivables.
>60 days
31-60 days
0-30 days
Note: Data contained on this slide is rounded.
3Q08
3Q09
3Q10
$789M
$889M
$710M |
 36
Sufficient Liquidity
--
--
--
--
Outstanding Facility Draws
(430)
(226)
(1)
(196)
Outstanding Letters of Credit
$7,365
$4,834
$574
$1,000
Aggregate Bank Commitments
(1)
6,935
4,608
573
804
Available
Capacity
Under
Facilities
(2)
--
--
--
--
Outstanding Commercial Paper
$6,935
$4,608
$573
$804
Available Capacity Less Outstanding
Commercial Paper
Exelon
(3)
($ millions)
Exelon bank facilities are largely untapped
(1) Excludes previous commitment from Lehman Brothers Bank and commitments
from Exelon’s Community and Minority Bank Credit Facility. (2)
Available Capacity Under Facilities represents the unused bank commitments under the borrower’s credit agreements net of outstanding letters of credit and facility draws. The
amount of commercial paper outstanding does not reduce the available capacity under
the credit agreements. (3) Includes other corporate entities.
Available Capacity Under Bank Facilities as of October 14, 2010
|
 37
Projected 2010 Key Credit Measures
14.2x
9.5x
FFO / Interest
Generation /
Corp:
62%
35%
FFO / Debt
54%
69%
Rating Agency Debt Ratio
BBB
A-
A-
BBB-
S&P Credit
Ratings
(3)
BBB+
A
BBB+
BBB+
Fitch Credit
Ratings
(3)
A3
A1
Baa1
Baa1
Moody’s Credit
Ratings
(3)
2.0x
2.4x
FFO / Interest
ComEd:
7%
(4)
8%
(4)
FFO / Debt
43%
52%
Rating Agency Debt Ratio
4.6x
5.1x
FFO / Interest
PECO:
25%
23%
FFO / Debt
47%
50%
Rating Agency Debt Ratio
31%
48%
Rating Agency Debt Ratio
85%
43%
FFO / Debt
21.3x
11.7x
FFO / Interest
Generation:
48%
32%
6.2x
Without PPA &
Pension / OPEB
(2)
59%
Rating Agency Debt Ratio
23%
FFO / Debt
5.9x
FFO / Interest
Exelon
Consolidated:
With PPA & Pension /
OPEB
(1)
Notes:
Exelon
and
PECO
metrics
exclude
securitization
debt.
See
following
slide
for
FFO
(Funds
from
Operations)/Interest,
FFO/Debt
and
Adjusted
Book
Debt
Ratio
reconciliations
to
GAAP.
(1)
FFO/Debt
metrics
include
the
following
standard
adjustments:
debt
equivalents
for
PV
of
Operating
Leases,
PPAs,
unfunded
Pension
and
OPEB
obligations
(after-tax)
and
other
minor
debt equivalents.
(2)
Excludes items listed in note (1) above.
(3)
Current senior unsecured ratings for Exelon and Exelon Generation and senior
secured ratings for ComEd and PECO as of October 22, 2010. (4)
Reflects impacts of preliminary agreement with IRS to settle involuntary conversion
and CTC positions ($420M). Expected to return to target levels in 2011. For additional information see
“Other
Income
Tax
Matters”
under
Footnote
10
of
the
Q3
2010
Form
10-Q. |
 38
FFO Calculation and Ratios
+ Other
Non-Cash
items
(1)
-
AFUDC/Cap. Interest
-
Decommissioning activity
+/-
Change in Working Capital
FFO Calculation
= FFO
-
PECO Transition Bond Principal Paydown
Net Cash Flows provided by Operating Activities
Net Interest Expense
Adjusted Interest
FFO + Adjusted Interest
= Adjusted Interest
+ Interest on Present Value (PV) of Operating Leases
+ Interest on imputed debt related to PV of Purchased Power Agreements
(PPA)
+ AFUDC & Capitalized interest
-
PECO Transition Bond Interest Expense
FFO Interest Coverage
FFO
= Adjusted Debt
+ Off-balance
sheet
debt
equivalents
(2)
-
PECO Transition Bond Principal Balance
+ STD
+ LTD
Debt:
Adjusted Debt
(3)
FFO Debt Coverage
Rating Agency Capitalization
Rating Agency Debt
Total Adjusted Capitalization
Adjusted Book Debt
= Total Rating Agency Capitalization
+ Off-balance
sheet
debt
equivalents
(2)
Total Adjusted Capitalization
= Rating Agency Debt
+ Off-balance
sheet
debt
equivalents
(2)
Adjusted Book Debt
= Total Adjusted Capitalization
+ Adjusted Book Debt
+ Preferred Securities of Subsidiaries
+ Total Shareholders' Equity
Capitalization:
= Adjusted Book Debt
-
Transition Bond Principal Balance
+ STD
+ LTD
Debt:
Debt to Total Cap
(1)
Reflects depreciation adjustment for PPAs and operating leases and pension/OPEB
contribution normalization. (2)
Metrics
are
calculated
in
presentation
unadjusted
and
adjusted
for
debt
equivalents
for
PV
of
Operating
Leases,
PPAs,
unfunded
Pension
and
OPEB
obligations
(after-tax)
and other minor debt equivalents.
(3)
Uses current year-end adjusted debt balance. |
 39
3Q GAAP EPS Reconciliation
(0.02)
-
-
-
(0.02)
2007 Illinois electric rate settlement
(0.09)
(0.04)
-
-
(0.05)
Costs associated with early debt retirements
0.05
-
-
-
0.05
Nuclear decommissioning obligation reduction
(0.01)
(0.01)
-
-
-
NRG acquisition costs
0.13
-
-
-
0.13
Unrealized gains related to nuclear decommissioning trust funds
0.12
-
-
-
0.12
Mark-to-market adjustments from economic hedging activities
$1.14
$(0.06)
$0.14
$0.07
$0.99
3Q09 GAAP Earnings (Loss) Per Share
$0.96
$(0.01)
$0.14
$0.07
$0.76
2009 Adjusted (non-GAAP) Operating Earnings (Loss) Per Share
Exelon
Other
PECO
ComEd
ExGen
Three Months Ended September 30, 2009
(0.05)
-
-
-
(0.05)
Emissions impairment
(0.02)
-
-
-
(0.02)
Retirements of fossil generation units / plant retirements
0.00
-
-
-
0.00
2007 Illinois electric rate settlement
$1.27
$(0.01)
$0.19
$0.18
$0.91
3Q10 GAAP Earnings (Loss) Per Share
$1.11
$(0.01)
$0.19
$0.18
$0.75
2010 Adjusted (non-GAAP) Operating Earnings (Loss) Per Share
0.14
-
-
-
0.14
Mark-to-market adjustments from economic hedging activities
0.09
-
-
-
0.09
Unrealized gains related to nuclear decommissioning trust funds
Exelon
Other
PECO
ComEd
ExGen
Three Months Ended September 30, 2010
NOTE: All amounts shown are per Exelon share and represent contributions to
Exelon's EPS. Amounts may not add due to rounding. |
 40
YTD GAAP EPS Reconciliation
NOTE: All amounts shown are per Exelon share and represent contributions to
Exelon's EPS. Amounts may not add due to rounding. (0.10)
(0.01)
(0.03)
(0.16)
0.10
Non-cash remeasurement of income tax uncertainties
(0.10)
(0.02)
(0.02)
(0.02)
(0.04)
Non-cash
charge
resulting
from
health
care
legislation
(0.05)
-
-
-
(0.05)
Emissions impairment
0.25
-
-
-
0.25
Mark-to-market adjustments from economic hedging activities
(0.05)
-
-
-
(0.05)
Retirement of fossil generating units
$3.08
$(0.09)
$0.46
$0.37
$2.34
YTD 2010 GAAP Earnings (Loss) Per Share
$3.10
$(0.06)
$0.51
$0.55
$2.10
2010 Adjusted (non-GAAP) Operating Earnings (Loss) Per Share
(0.01)
-
-
-
(0.01)
2007 Illinois electric rate settlement
0.04
-
-
-
0.04
Unrealized gains related to nuclear decommissioning trust funds
Exelon
Other
PECO
ComEd
ExGen
Nine Months Ended September 30, 2010
(0.08)
-
-
-
(0.08)
2007 Illinois electric rate settlement
(0.09)
(0.04)
-
-
(0.05)
Costs associated with early debt retirements
(0.20)
-
-
-
(0.20)
Impairment of certain generating assets
(0.03)
-
-
(0.02)
(0.01)
2009 severance charges
0.05
-
-
-
0.05
Nuclear decommissioning obligation reduction
(0.03)
(0.03)
-
-
-
NRG acquisition costs
0.18
-
-
-
0.18
Unrealized gains related to nuclear decommissioning trust funds
0.12
-
-
-
0.12
Mark-to-market adjustments from economic hedging activities
0.10
(0.02)
-
0.06
0.06
Non-cash remeasurement of income tax uncertainties and reassessment of state
deferred income taxes
$3.21
$(0.19)
$0.42
$0.42
$2.57
YTD 2009 GAAP Earnings (Loss) Per Share
$3.19
$(0.10)
$0.42
$0.38
$2.50
2009 Adjusted (non-GAAP) Operating Earnings (Loss) Per Share
Exelon
Other
PECO
ComEd
ExGen
Nine Months Ended September 30, 2009 |
 41
2010 Earnings Outlook
Exelon’s 2010 adjusted (non-GAAP) operating earnings outlook excludes the
earnings effects of the following:
•
Mark-to-market adjustments from economic hedging activities
•
Unrealized gains and losses from nuclear decommissioning trust fund investments to
the extent not offset by contractual accounting as described in the notes
to the consolidated financial statements •
Significant impairments of assets, including goodwill
•
Costs
associated
with
the
2007
Illinois
electric
rate
settlement
agreement
•
Costs associated with ComEd’s 2007 settlement with the City of Chicago
•
Costs associated with the retirement of fossil generating units
•
Non-cash charge resulting from passage of Federal health care
legislation •
Non-cash remeasurement of income tax uncertainties
•
External costs associated with Exelon’s proposed acquisition of John Deere
Renewables •
Impairment of certain emission allowances
•
Other unusual items
•
Significant future changes to GAAP
Operating
earnings
guidance
assumes
normal
weather
for
remainder
of
the
year
Operating O&M target excludes the following items:
•
Exelon Generation: Decommissioning accretion expense
•
ComEd
& PECO: Impact of regulatory riders |