Attached files
| file | filename |
|---|---|
| 8-K - WESTERN ALLIANCE BANCORPORATION 8-K - WESTERN ALLIANCE BANCORPORATION | a6477110.htm |
| EX-99.1 - EXHIBIT 99.1 - WESTERN ALLIANCE BANCORPORATION | a6477110ex99-1.htm |
Exhibit 99.2
Robert Sarver
Chairman & CEO
Ken Vecchione
President & COO
Dale Gibbons
Executive Vice President & CFO (Gp:) 3rd Quarter 2010 Earnings Conference Call (Gp:) Western Alliance Bancorporation (NYSE: WAL) (Gp:) October 22, 2010
Forward-Looking Information This presentation contains forward-looking statements that relate to expectations, beliefs, projections, future plans and strategies, anticipated events or trends and similar expressions concerning matters that are not historical facts. The forward-looking statements contained herein reflect our current views about future events and financial performance and are subject to risks, uncertainties, assumptions and changes in circumstances that may cause our actual results to differ significantly from historical results and those expressed in any forward-looking statement. Some factors that could cause actual results to differ materially from historical or expected results include: factors listed in the Company’s annual report on Form 10-K as filed with the Securities and Exchange Commission; changes in general economic conditions, either nationally or locally in the areas in which we conduct or will conduct our business; inflation, interest rate, market and monetary fluctuations; increases in competitive pressures among financial institutions and businesses offering similar products and services; higher defaults on our loan portfolio than we expect; changes in management’s estimate of the adequacy of the allowance for loan losses; legislative or regulatory changes or changes in accounting principles, policies or guidelines; supervisory actions by regulatory agencies which may limit our ability to pursue certain growth opportunities; management’s estimates and projections of interest rates and interest rate policy; the execution of our business plan; and other factors affecting the financial services industry generally or the banking industry in particular. We do not intend and disclaim any duty or obligation to update or revise any industry information or forward-looking statements set forth in this presentation to reflect new information, future events or otherwise. pg 2
Achieving Strategic Initiatives Focus on Core Banking Operations: Plans underway to consolidate bank charters from five to three by the end of Q4-2010. Sale of Premier Trust closed September 1st, realized gain of $0.6 million. Reduce Non-Performing Assets: Continued improvement in non-performing, classified, watch and delinquent loans during Q3-2010, partially offset by increase in repossessed assets and restructured loans. Increase Market Share: Q3-2010 loan growth of $44 million; deposit growth of $98 million. Market share increased in all regions between June 30, 2009 and June 30, 2010.* Opened two new California banking offices: downtown Los Angeles and Los Altos. Strengthen Risk Management: Implemented new corporate-wide ERM Program. New director with significant banking experience joined WAL Board – Dr. Sung Won Sohn. pg 3
Charter Consolidation WAL has submitted applications to merge the following affiliate banks: Alta Alliance Bank into Torrey Pines Bank, First Independent Bank of Nevada into Alliance Bank of Arizona. Execution of this plan will reduce the number of bank charters from five to three which will mitigate our risk profile and improve our operating efficiency, Combined pro forma metrics will significantly improve. Over $2.0 million in expense savings to begin 30 days after FDIC approval. Senior bank staff will spend less time with organizational issues, shifting focus to business development. Each institution’s capital exceeds levels required by current regulatory standards and proposed Basel III revisions. WAL will continue to maintain strong local presence and management, as we distinguish our business model from larger competitors. 3rd Qtr 2010 Financial Highlights o Increased p re-tax, pre-credit income* by $1.9 million or 8.3% to $24.6 million from Q2-10: – Fifth consecutive quarterly increase. Net interest income up $2.0 million or 3.5% over Q2-2010 to $59.5 million – Net Interest Margin increased to 4.32% from 4.16% in Q2-2010. Net income of $2.0 million, including: – $23.0 million provision for loan and lease losses, – $4.9 million net write-down of repossessed and other assets, – $5.3 million net gain from sale of securities. Four banks showing a year-to-date profit: – Four banks profitable for two consecutive quarters; three banks profitable for three consecutive quarters. pg 4
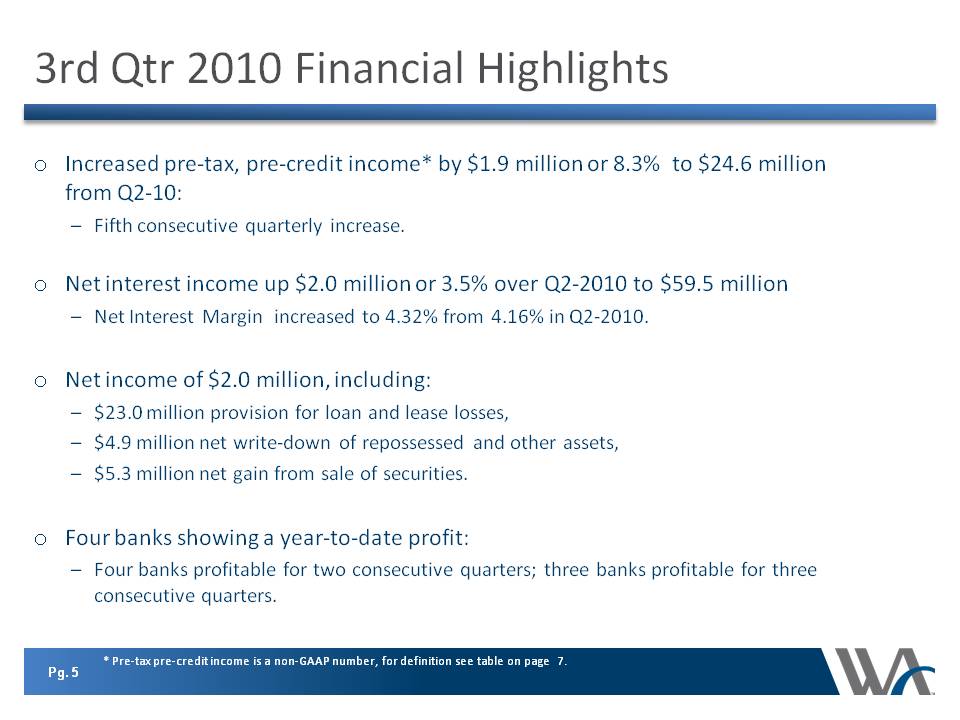
3rd Qtr 2010 Financial Highlights Increased pre-tax, pre-credit income* by $1.9 million or 8.3% to $24.6 million from Q2-10:
Fifth consecutive quarterly increase. Net interest income up $2.0 million or 3.5% over Q2-2010 to $59.5 million Net Interest Margin increased to 4.32% from 4.16% in Q2-2010.
Net income of $2.0 million, including: $23.0 million provision for loan and lease losses, $4.9 million net write-down of repossessed and other assets, $5.3 million net gain from sale of securities.
Four banks showing a year-to-date profit: Four banks profitable for two consecutive quarters; three banks profitable for three consecutive quarters.
pg 5 * Pre-tax pre-credit income is a non-GAAP number, for definition see table on page 7.
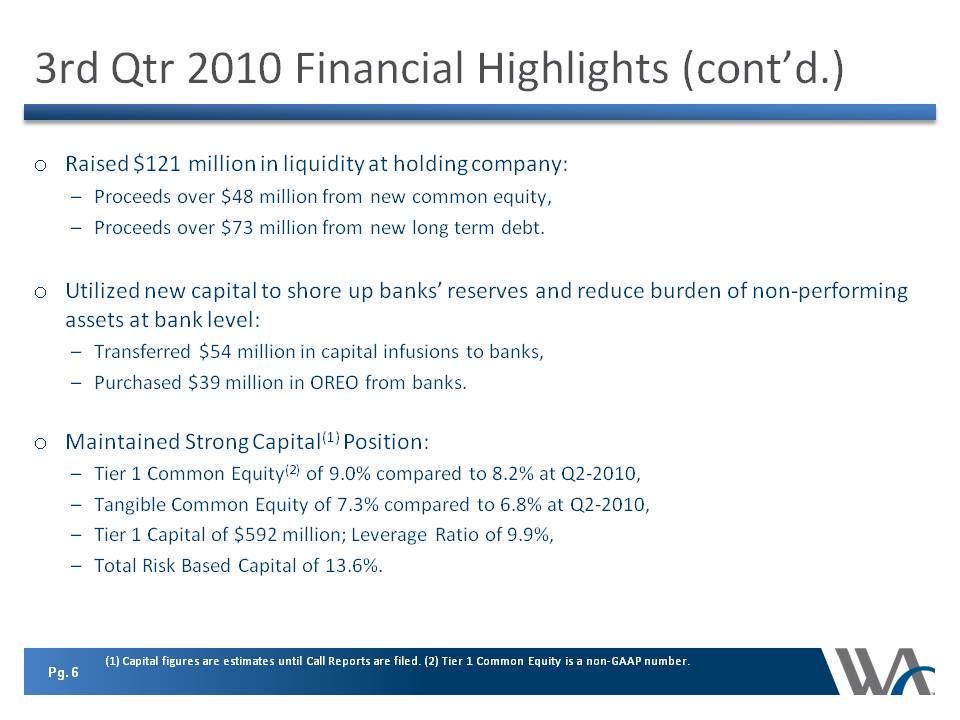
3rd Qtr 2010 Financial Highlights (cont’d.) Other Placeholder: Raised $121 million in liquidity at holding company: Proceeds over $48 million from new common equity, Proceeds over $73 million from new long term debt. Utilized new capital to shore up banks’ reserves and reduce burden of non-performing assets at bank level: Transferred $54 million in capital infusions to banks,Purchased $39 million in OREO from banks. Maintained Strong Capital(1) Position: Tier 1 Common Equity(2) of 9.0% compared to 8.2% at Q2-2010, Tangible Common Equity of 7.3% compared to 6.8% at Q2-2010, Tier 1 Capital of $592 million; Leverage Ratio of 9.9%, Total Risk Based Capital of 13.6%.
pg. 6 (1) Capital figures are estimates until Call Reports are filed. (2) Tier 1 Common Equity is a non-GAAP number.
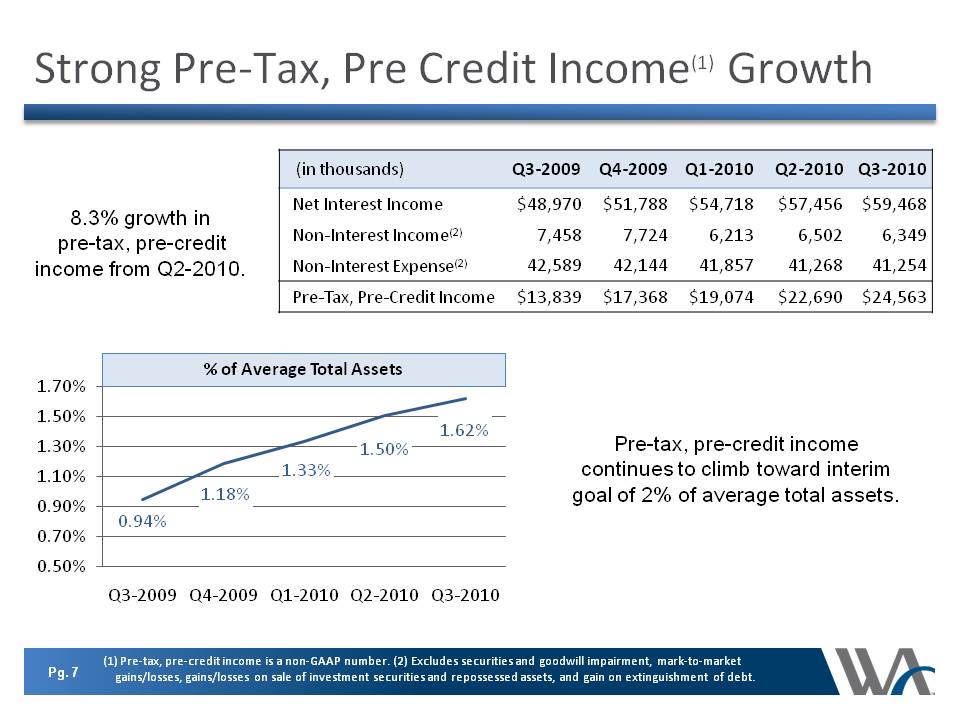
Strong Pre-Tax, Pre Credit Income(1) Growth Pre-tax, pre-credit income continues to climb toward interim goal of 2% of average total assets.% of Average Total Assets 8.3% growth in pre-tax, pre-credit income from Q2-2010. (in thousands) Q3-2009 Q4-2009 Q1-2010 Q2-2010 Q3-2010 Net Interest Income Non-Interest Income(2) Non-Interest Expense(2) $48,970 7,458 42,589 $51,788 7,724 42,144 $54,718 6,213 41,857 $57,456 6,502 41,268 $59,468 6,349 41,254 Pre-Tax, Pre-Credit Income $13,839 $17,368 $19,074 $22,690 $24,563 1.70% 1.50% 1.30% 1.10% 0.90% 0.70% 0.50% % of Average Total Assets Pre-tax, pre-credit income continues to climb toward interim goal of 2% of average total assets. 0.94% Q3-2009 Q4-2009 Q1-2010 Q2-2010 Q3-2010
pg. 7 (1) Pre-tax, pre-credit income is a non-GAAP number. (2) Excludes securities and goodwill impairment, mark-to-market gains/loses, gains/losses on sale of investment securities and repossessed assets, and gain on extinguishment of debt.
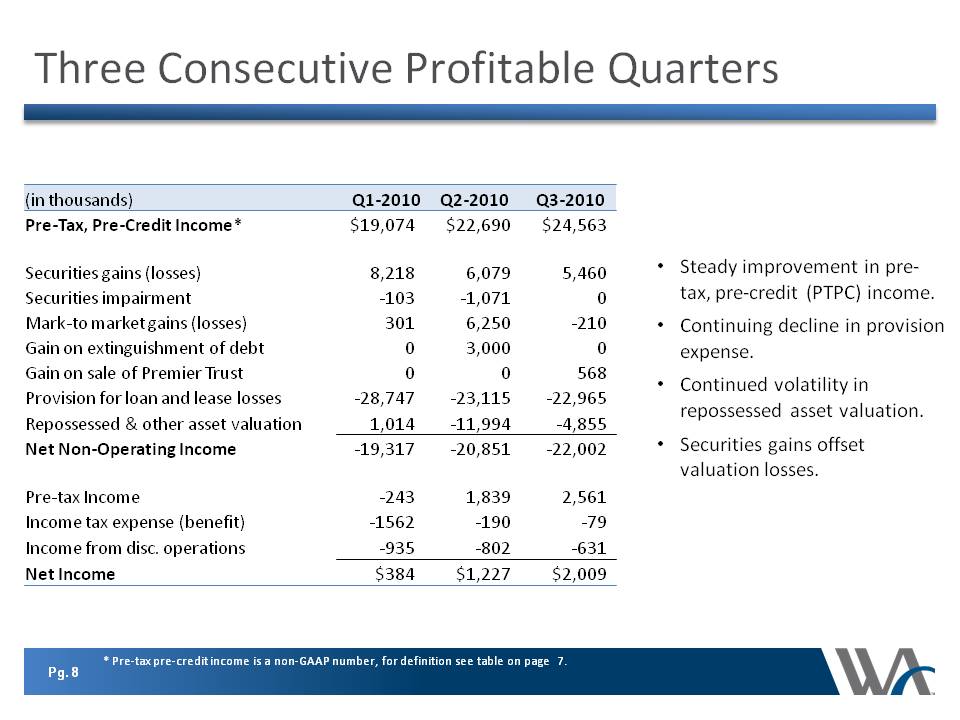
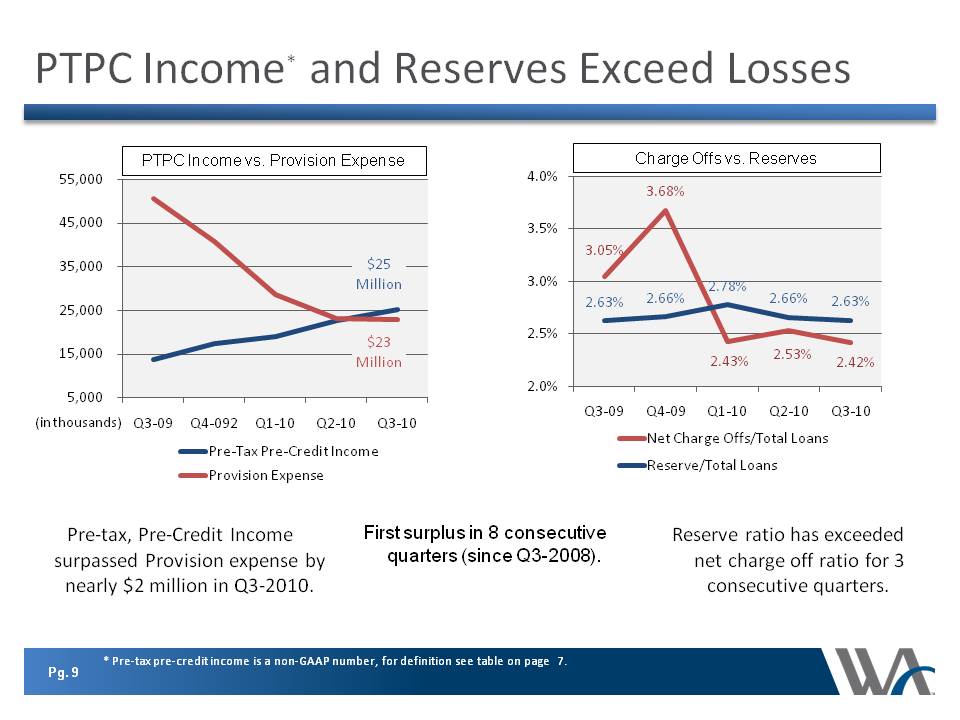
Three Consecutive Profitable Quarters Steady improvement in pre-tax, pre-credit (PTPC) income. Continuing decline in provision expense. Continued volatility in repossessed asset valuation. Securities gains offset valuation losses. (in thousands) Q1-2010 Q2-2010 Q3-2010 Pre-Tax, Pre-Credit Income* $19,074 $22,690 $24,563 Securities gains (losses) 8,218 6,079 5,460 Securities impairment -103 -1,071 0 Mark-to market gains (losses) 301 6,250 -210 Gain on extinguishment of debt 0 3,000 0 Gain on sale of Premier Trust 0 0 568 Provision for loan and lease losses -28,747 -23,115 22,965 Repossessed & other asset valuation 1,014 -11,994 -4,855 Net Non-Operating Income -19,317 -20,851 -22,002 Pre-tax Income -243 1,839 2,561 Income tax expense (benefit) -1562 -190 -79 Income from disc. Operations -935 -802 -631 Net Income $384 $1,227 $2,009 * P re-tax pre-cred it income is a non-GAAP number, for definition see table on page 7. PTPC Income* and Reserves Exceed Losses Charge Offs vs. Reserves 2.78% 2.63% 2.66% 2.66% 2.63% 2.43% 2.53% 2.42% Q3-09 Q4-09 Q1-10 Q2-10 Q3-10 Net Charge Offs/Total Loans Reserve/Total Loans Pre-tax, Pre-Credit Income First surplus in 8 consecutive Reserve ratio has exceeded surpassed Provision expense by quarters (since Q3-2008). net charge off ratio for 3 nearly $2 million in Q3-2010. consecutive quarters.
pg. 8 * Pre-tax pre-creidt income is a non-GAAP number, for definition see table on page 7.
PTPC Income* and Reserves Exceed Losses
PTPC Income vs. Provision Expense
55,000 45,000 35,000 25,000 15,000 5,000 $25 Million $23 Million
(in thousands) Q3-09 Q4-09 Q1-10 Q2-10 Q3-10 Pre-Tax Pre-Credit Income Provision Expense
Charge Offs vs. Reserves
2.78%
2.63% 2.66% 2.66% 2.63%
2.43% 2.53% 2.42%
Q3-09 Q4-09 Q1-10 Q2-10 Q3-10 Net Charge Offs/Total Loans Reserve/Total Loans
Pre-tax, Pre-Credit Income surpassed Provision expense by nearly $2 million in Q3-2010.
First surplus in 8 consecutive quarters (since Q3-2008).
Reserve ratio has exceeded net charge off ratio for 3 consecutive quarters.
pg. 9 * Pre-tax pre-credit income is a non-GAAP number, for definition see
table on page 7.
Net Interest Margin Rising
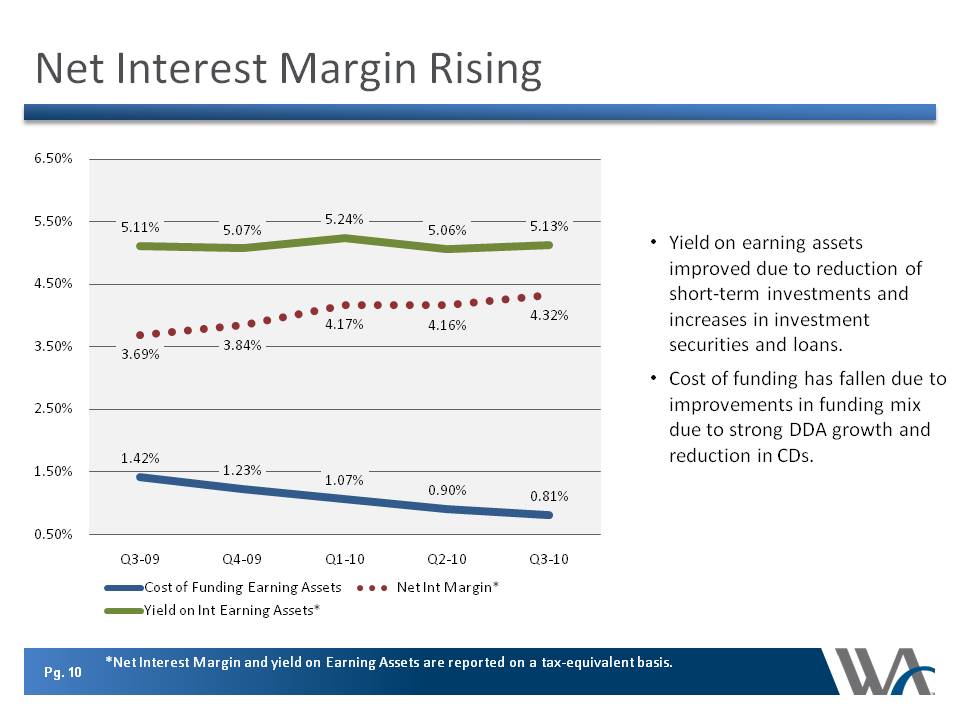
6.50% 5.50%5.11% 5.07% 5.24% 5.06% 5.13% 4.50% 3.50% 3.69% 3.84% 4.17% 4.16% 4.32% 2.50% 1.50% 1.42% 1.23% 1.07% 0.90% 0.81%0.50% Q3-09 Q4-09 Q1-10 Q2-10 Q3-10
Cost of Funding Earning Assets Net Int Margin* Yield on Int Earning Assets* Yield on earning assets improved due to reduction of short-term investments and increases in investment securities and loans. Cost of funding has fallen due to improvements in funding mix due to strong DDA growth and reduction in CDs.
pg. 10 * Net Interest Mawrgin and yield on Earning Assets are reported on a tax-equivalent basis.
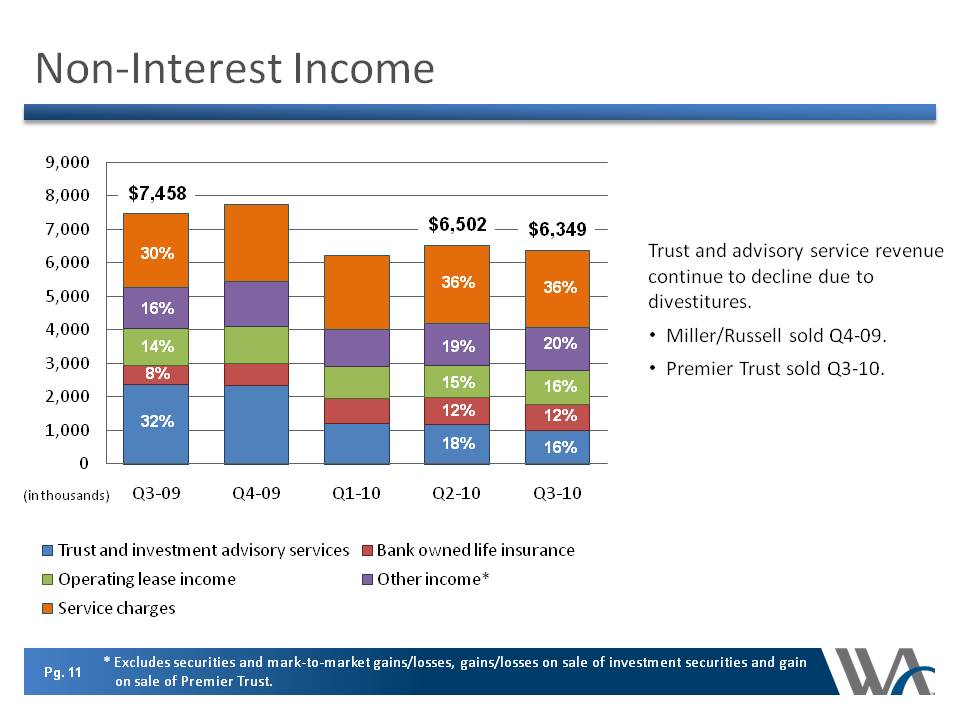
Non-Interest Income Trust and advisory service revenue continue to decline due to divestitures. Miller/Russell sold Q4-09.Premier Trust sold Q3-10.
9,000 8,000 7,000 6,000 5,000 4,000 3,000 2,000 1,000 0 $6,502 36% 15% 18% 19% 12% $7,458 30% 14% 32% 16% 8% (in thousands) 36% 16% 16% 20% 12% $6,349
(in thousands) Q3-09 Q4-09 Q1-10 Q2-10 Q3-10 Trust and investment advisory services Bank owned life insurance Operating lease income Other income*
Service charges Pg. 11 * Excludes securities and mark-to-market gains/losses, gains/losses on sale of investment securities and gain on sale of Premier Trust.
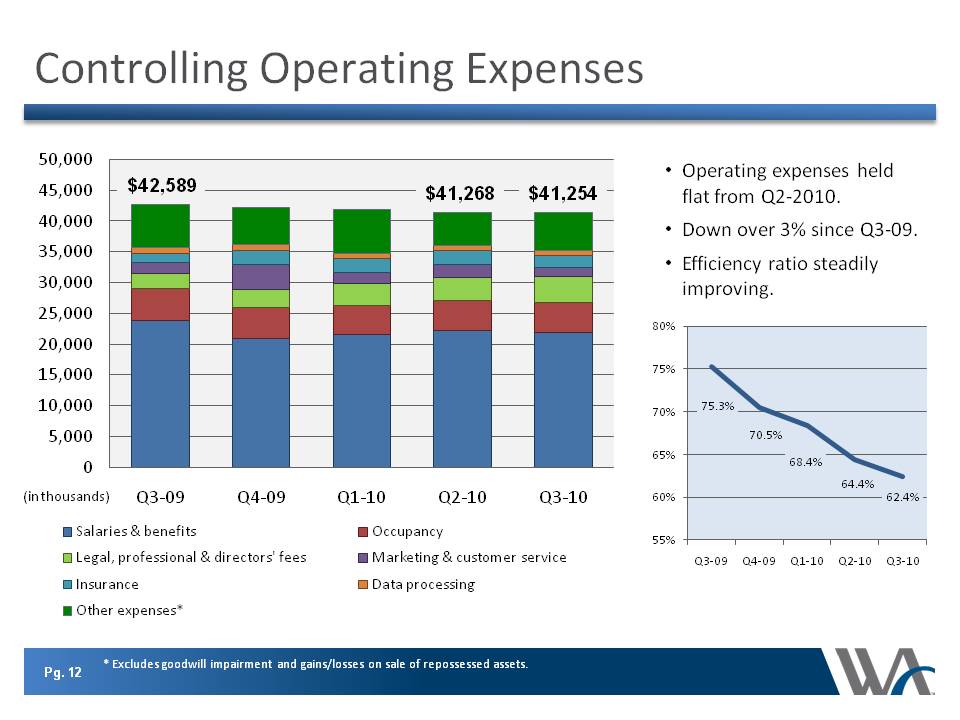
Controlling Operating Expenses 50,000 45,000 40,000 35,000 30,000 25,000 20,000 15,000 10,000 5,000 0 $42,589 (in thousands) $41,254 $41,268
Q3-09 Q4-09 Q1-10 Q2-10 Q3-10 Operating expenses held flat from Q2-2010. Down over 3% since Q3-09. Efficiency ratio steadily improving. 80% 75% 70% 65% 60% 55% 75.3% 70.5% 68.4% 4.4% 62.4% Q3-09 Q4-09 Q1-10 Q2-10 Q3-10 Salaries & benefits Occupancy Legal, professional & directors’ fees Marketing & customer service Insurance Data profcessing Other expenses*
Pg. 12 * Excludes goodwill impairment and gains/losses on sale of repossessed assets.
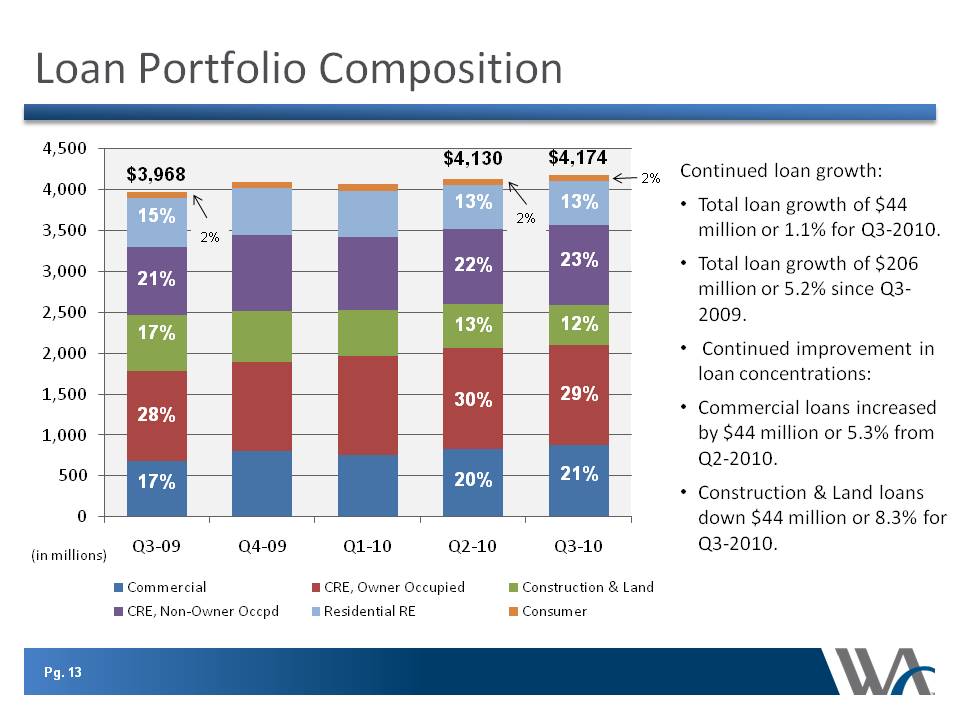
Loan Portfolio Composition (in millions) 4,500 4,000 3,500 3,000 2,500 2,000 1,500 1,000 500 0 (in millions) Q3-09 Q4-09 Q1-10 Q2-10 Q3-10 Commercial CRE, Owner Occupied Construction & Land CRE, Non-Owner Occpd Residential RE Consumer $3,968 « 2% 28% 21% 17% 17% 15% 2% 2% $4,130 « 2% 30% 22% 20% 13% 13% $4,174 « 2% 29% 23% 21% 12% 13%
Continued loan growth: Total loan growth of $44 million or 1.1% for Q3-2010. Total loan growth of $206 million or 5.2% since Q3-2009. Continued improvement in loan concentrations:
Commercial loans increased by $44 million or 5.3% from Q2-2010. Construction & Land loans down $44 million or 8.3% for Q3-2010. pg. 13
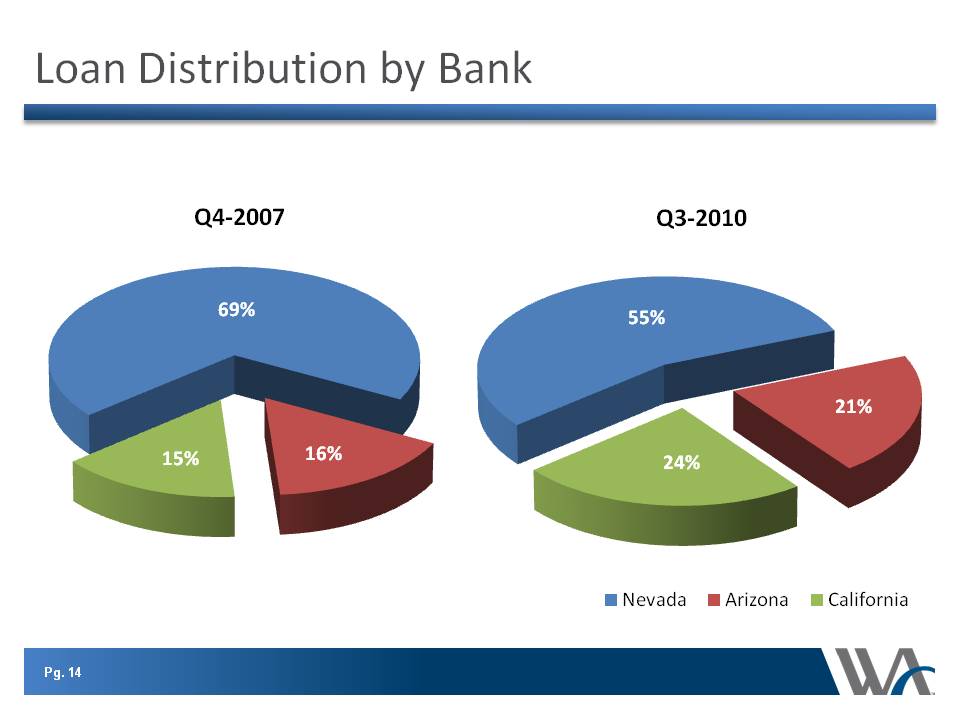
Loan Distribution by Bank
Q4-2007
15% 69% 16%
Q3-2010
24% 55% 21%
Nevada
Arizona
California
Pg. 14
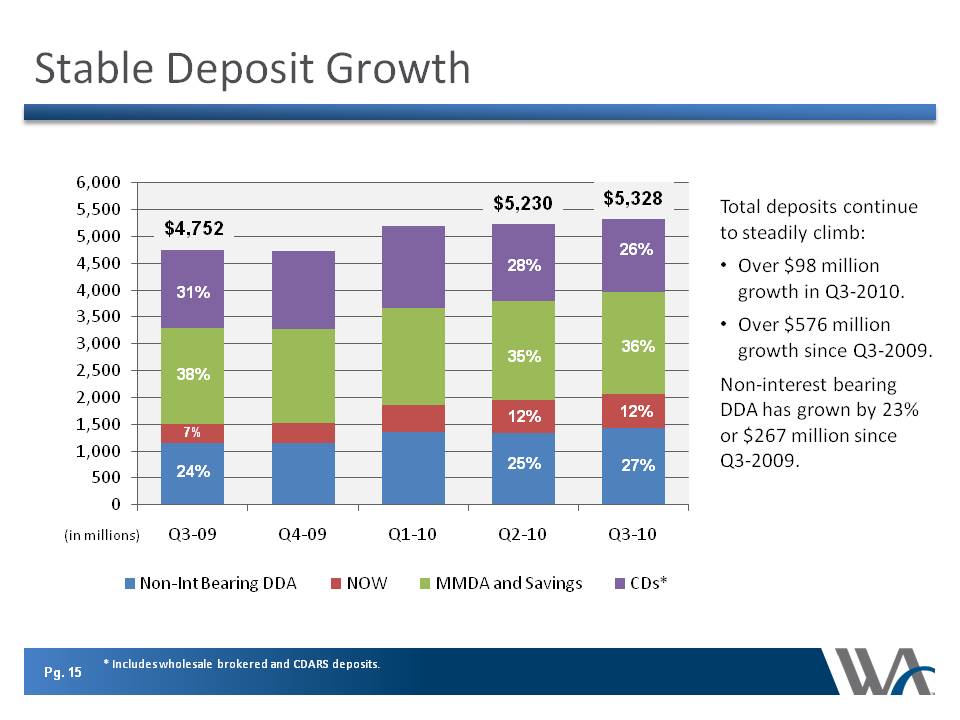
Stable Deposit Growth 6,000 5,500 5,000 4,500 4,000 3,500 3,000 2,500 2,000 1,500 1,000 500 0 $4,752 31% 38% 7% 24% $5,230 28% 35% 12% 25% $5,328 36% 26% 12% 27% (in millions) Q3-09 Q4-09 Q1-10 Q2-10 Q3-10 Non-Int Bearing DDA NOW MMDA and Savings CDs* Total deposits continue to steadily climb: Over $98 million growth in Q3-2010.
Over $576 million growth since Q3-2009. Non-interest bearing DDA has grown by 23% or $267 million since Q3-2009. Pg. 15 * Includes wholesale brokered and CDARS deposits.
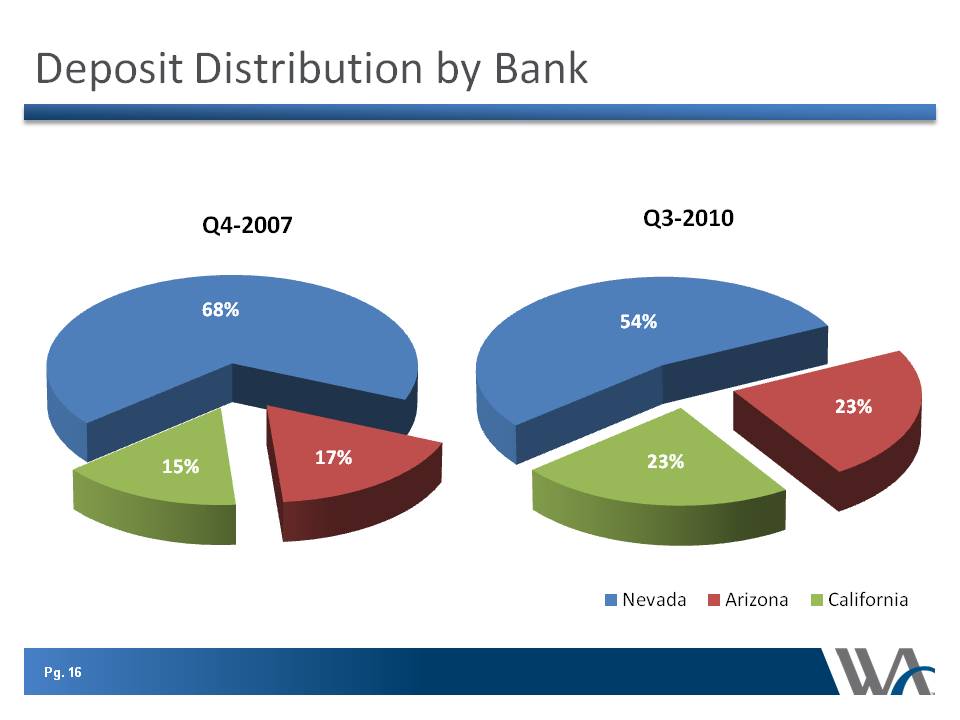
Deposit Distribution by Bank Q4-2007 15% 68% 17% Q3-2010 23% 54% 23% Nevada Arizona California
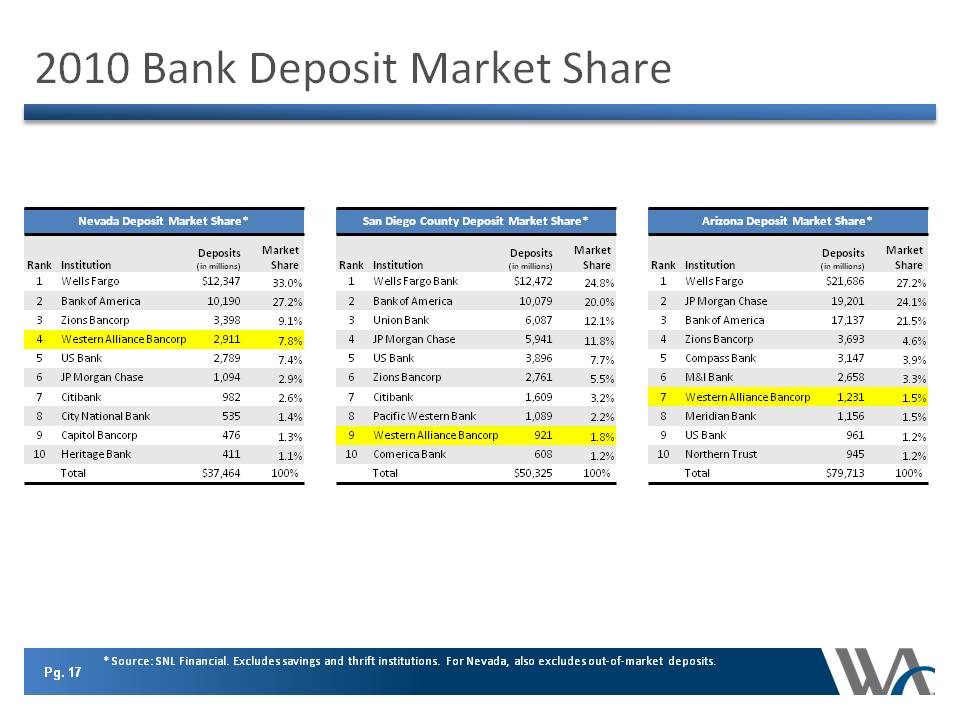
Nevada Deposit Market Share* Rank Institution Deposits (in millions) Market Share 1 Wells Fargo $12,34733.0% 2 Bank of America 10,190 27.2% 3 Zions Bancorp 3,3989.1%
4 Western Alliance Bancorp 2,911 7.8% 5 US Bank 2,789 7.4% 6 JP Morgan Chase 1,094 2.9% 7 Citibank 982 2.6% 8 City National Bank 535 1.4% 9 Capitol Bancorp 476 1.3%
10 Heritage Bank 411 1.1% Total $37,464 100% San Diego County Deposit Market Share* Rank Institution Deposits (in millions) Market Share1 Wells Fargo Bank $12,47224.8%
2 Bank of America 10,079 20.0%3 Union Bank 6,08712.1%4 JP Morgan Chase 5,94111.8%5 US Bank 3,8967.7%6 Zions Bancorp2,761 5.5%7 Citibank 1,609 3.2%
8 Pacific Western Bank1,0892.2% 9 Western Alliance Bancorp 921 1.8% 10 Comerica Bank6081.2% Total$50,325100% Arizona Deposit Market Share* Rank Institution Deposits (in millions)Market Share 1 Wells Fargo$21,68627.2%2 JP Morgan Chase19,20124.1% 3 Bank of America 17,13721.5% 4 Zions Bancorp3,6934.6% 5 Compass Bank3,1473.9% 6 M&I Bank2,6583.3% 7 Western Alliance Bancorp1,2311.5% 8 Meridian Bank1,1561.5% 9 US Bank9611.2% 10 Northern Trust9451.2% Total $79,713 100%
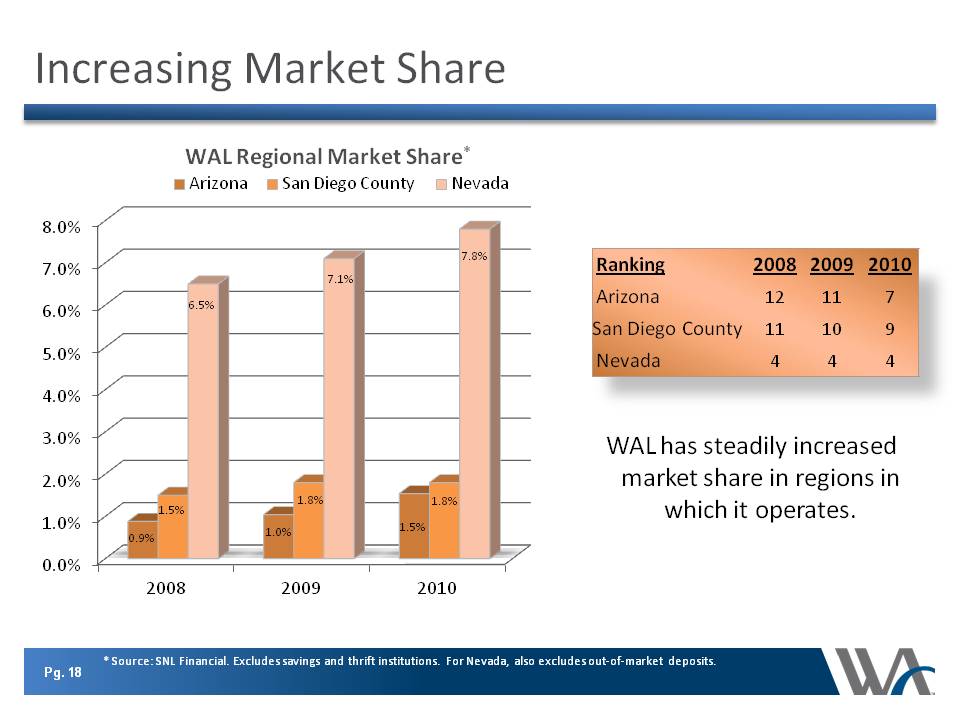
Increasing Market Share WAL Regional Market Share* Arizona San Diego County Nevada 8.0% 7.0% 6.0% 5.0% 4.0% 3.0% 2.0% 1.0% 0.0% 2008 0.9% 1.5% 6.5% 2009 1.0% 1.8% 7.1%
2010 1.5% 1.8% 7.8% Ranking 2008 20092010 Arizona12117 San Diego County 11109 Nevada 4 4 4WAL has steadily increased market share in regions in which it operates.
Pg. 18 * Source: SNL Financial. Excludes savings and thrift institutions. For Nevada, also excludes out-of-market deposits.
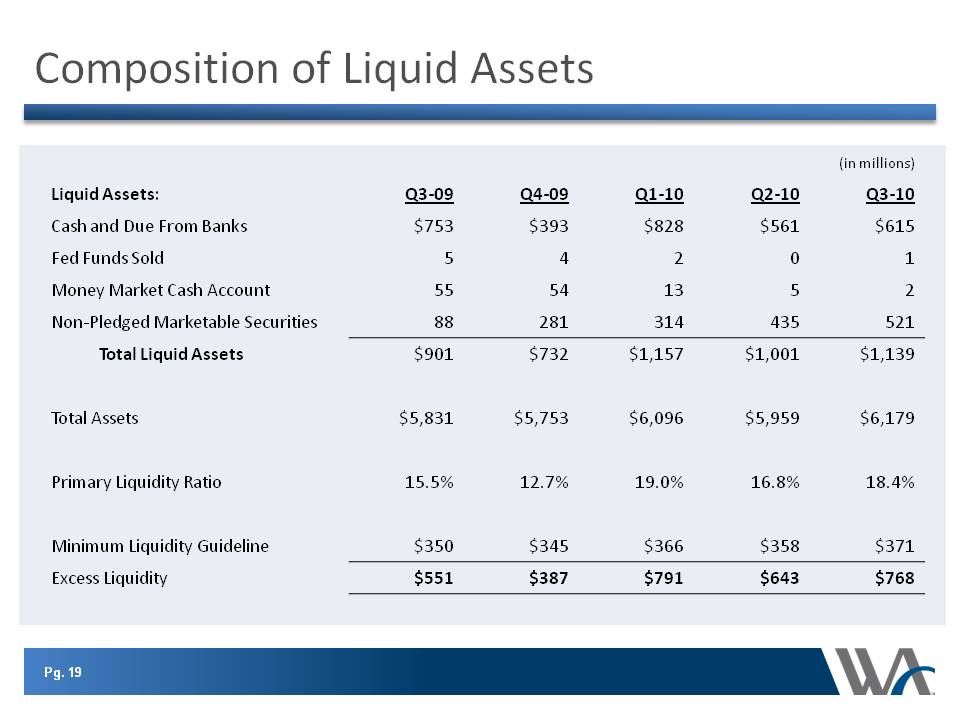
Composition of Liquid Assets (in millions) Liquid Assets: Q3-09 Q4-09 Q1-10 Q2-10 Q3-10
Cash and Due From Banks $753 $393 $828 $561 615 Fed Funds Sold 5 4 2 0 1 Money Market Cash Account 55 54 13 5 2
Non-Pledged Marketable Securities 88 281 314 435 521 Total Liquid Assets $901 $732 $1,157 $1,001 $1,139
Total Assets $5,831 $5,753 $6,096 $5,959 $6,179 Primary Liquidity Ratio 15.5% 12.7% 19.0% 16.8% 18.4%
Minimum Liquidity Guideline $350 $345 $366 $358 $371 Excess Liquidity $551 $387 $791 $643 $768
Pg. 19
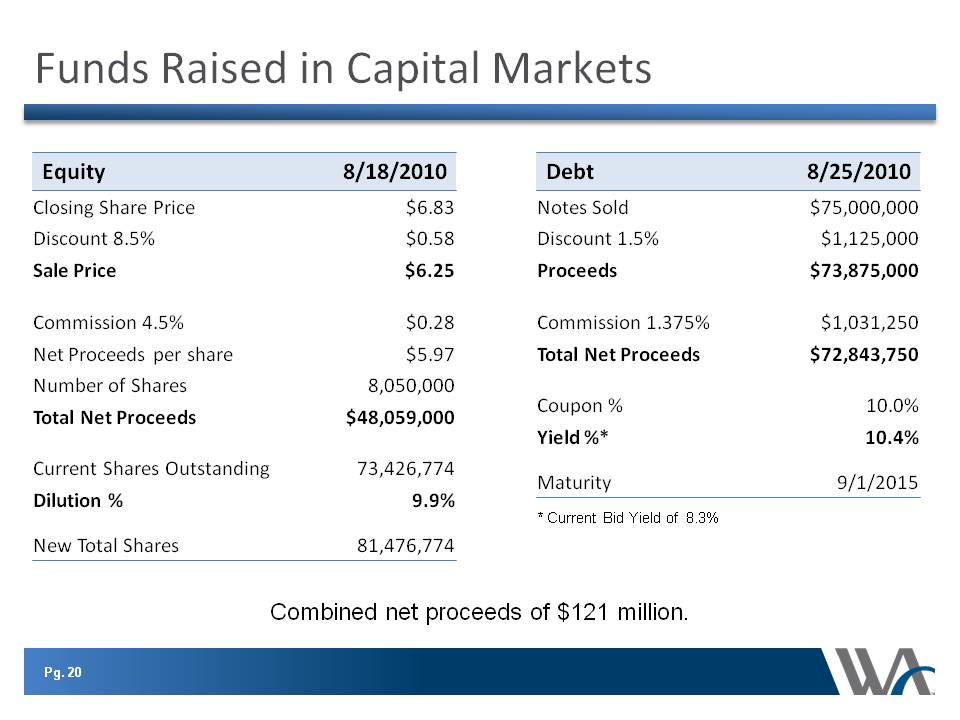
Funds Raised in Capital Markets
Equity 8/18/2010 Closing Share Price $6.83 Discount 8.5% $0.58 Sale Price $6.25 Commission 4.5% $0.28 Net Proceeds per share $5.97 Number of Shares 8,050,000 Total Net Proceeds $48,059,000 Current Shares Outstanding 73,426,774 Dilution % 9.9% New Total Shares 81,476,774 Debt 8/25/2010 Notes Sold $75,000,000 Discount 1.5% $1,125,000 Proceeds $73,875,000 Commission 1.375% $1,031,250 Total Net Proceeds $72,843,750 Coupon % 10.0% Yield %* 10.4% Maturity 9/1/2015 * Current Bid Yield of 8.3% Combined net proceeds of $121 million. Pg. 20
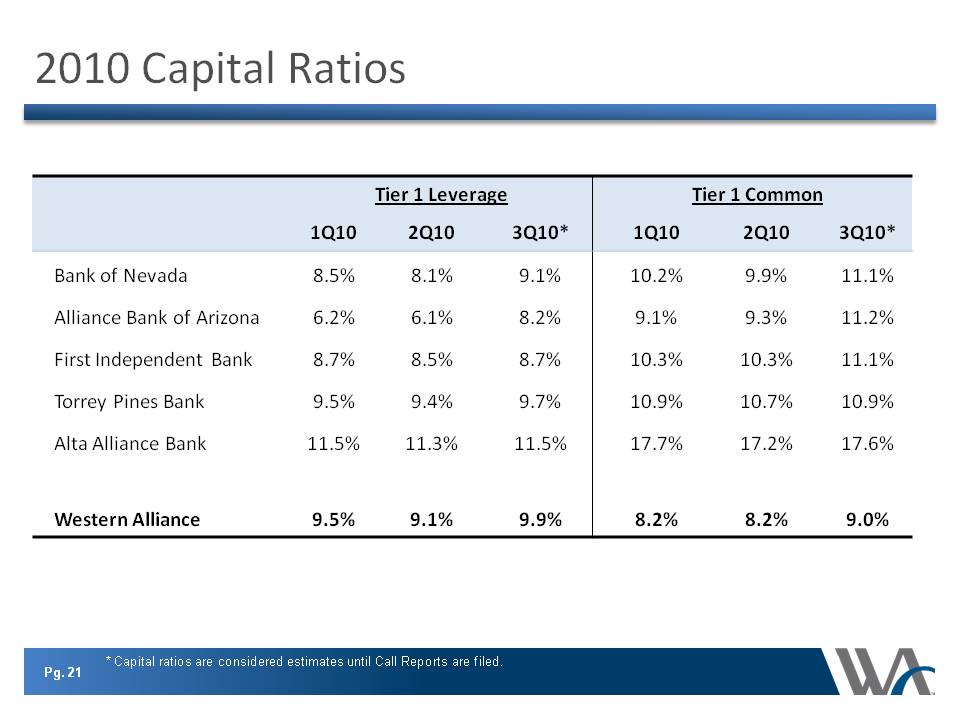
2010 Capital Ratios
Tier 1 Leverage Tier 1 Common 1Q10 2Q10 3Q10* 1Q10 2Q10 3Q10* Bank of Nevada 8.5% 8.1% 9.1% 10.2% 9.9% 11.1% Alliance Bank of Arizona 6.2% 6.1% 8.2% 9.1% 9.3% 11.2% First Independent Bank 8.7% 8.5% 8.7% 10.3% 10.3% 11.1% Torrey Pines Bank 9.5% 9.4% 9.7% 10.9% 10.7% 10.9% Alta Alliance Bank 11.5% 11.3% 11.5% 17.7% 17.2% 17.6% Western Alliance 9.5% 9.1% 9.9% 8.2% 8.2% 9.0%
Pg. 21 * Capital ratios are considered estimates until Call Reports are filed.
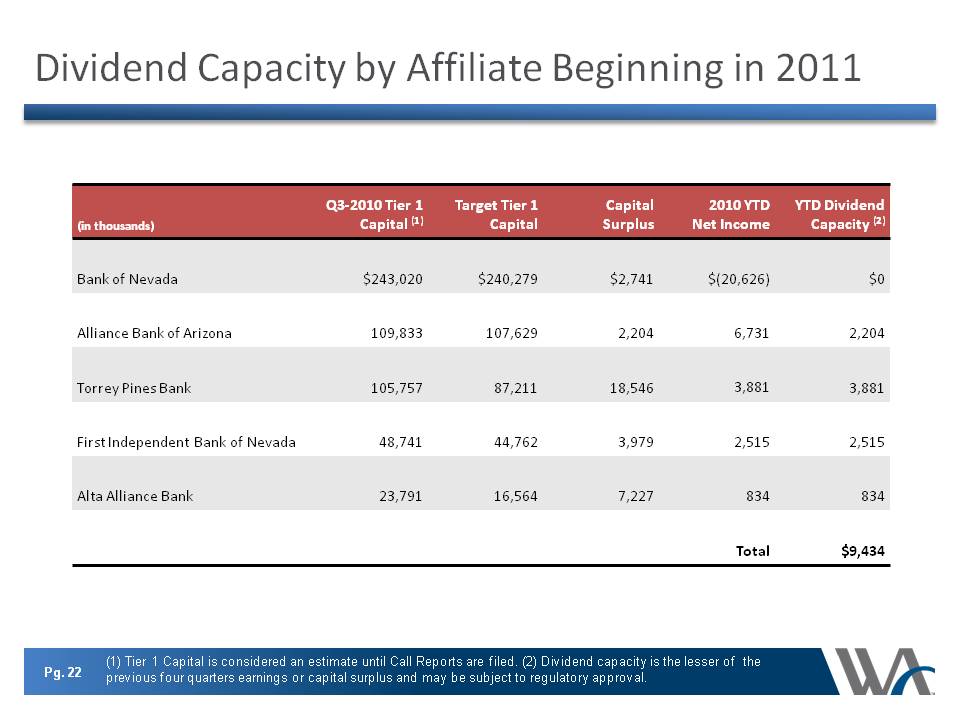
Dividend Capacity by Affiliate Beginning in 2011 (in thousands) Q3-2010 Tier 1 Capital (1) Target Tier 1 Capital Capital Surplus 2010 YTD Net Income YTD Dividend Capacity (2)
(in Bank of Nevada $243,020 $240,279 $2,741 $(20,626) $0 Alliance Bank of Arizona 109,833 107,629 2,204 6,731 2,204 Torrey Pines Bank 105,757 87,211 18,546 3,881 3,881 First Independent Bank of Nevada 48,741 44,762 3,979 2,515 2,515 Alta Alliance Bank 23,791 16,564 7,227 834 834 Total $9,434 Pg. 22 (1) Tier 1 Capital is considered an estimate until Call Reports are filed. (2) Dividend capacity is the lesser of the previous four quarters earnings or capital surplus and may be subject to regulatory approval.
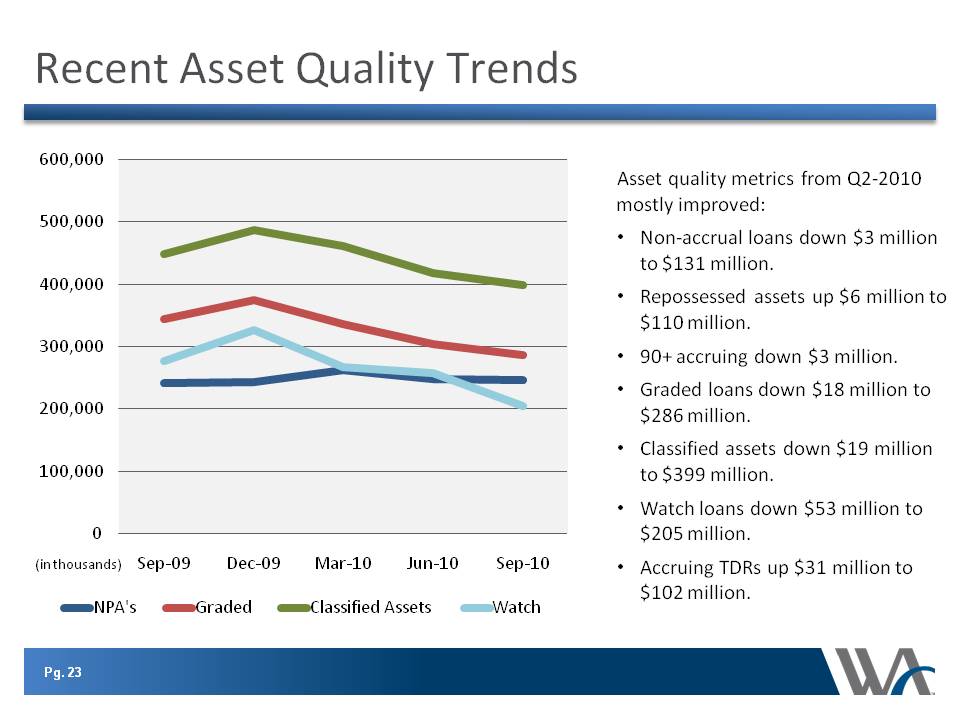
Recent Asset Quality Trends 600,000 500,000 400,000 300,000 200,000 100,000 0 (in thousands) Sep-09 Dec-09 Mar-10 Jun-10 Sep-10 NPA's Graded Classified Assets Watch
Asset quality metrics from Q2-2010 mostly improved: • Non-accrual loans down $3 million to $131 million. • Repossessed assets up $6 million to $110 million.
• 90+ accruing down $3 million. • Graded loans down $18 million to $286 million. • Classified assets down $19 million to $399 million. • Watch loans down $53 million to $205 million.
• Accruing TDRs up $31 million to $102 million. Pg. 23
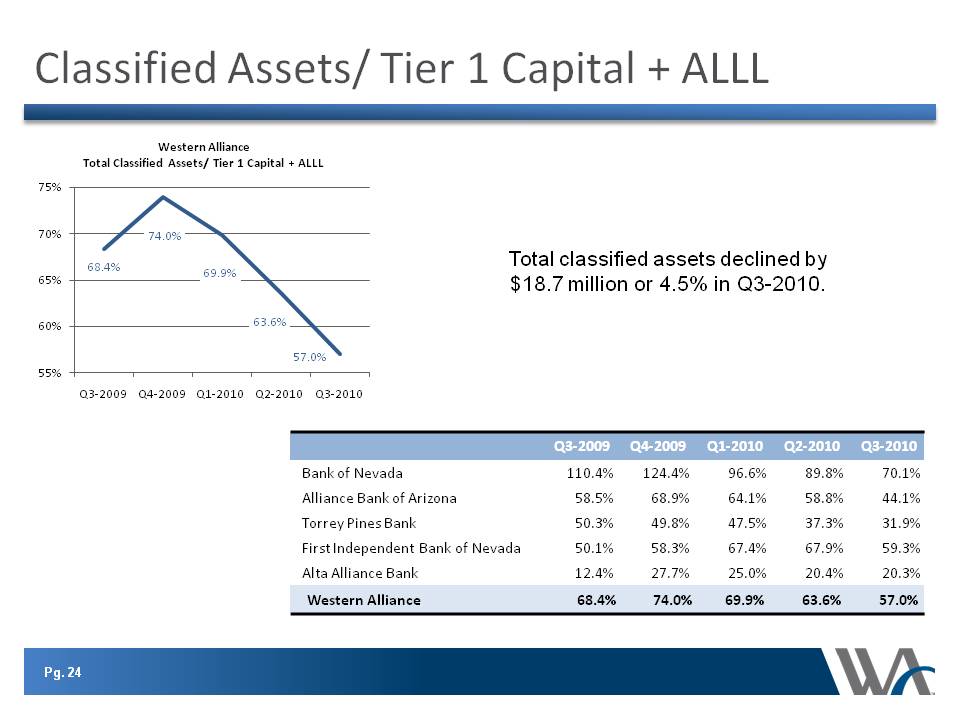
Classified Assets/ Tier 1 Capital + ALLL Western Alliance Total Classified Assets/ Tier 1 Capital + ALLL 75% 70% 65% 60% 55% 68.4% 74.0% 69.9% 63.6% 57.0% Total classified assets declined by $18.7 million or 4.5% in Q3-2010. Q3-2009 Q4-2009 Q1-2010 Q2-2010 Q3-2010Q3-2009Q4-2009Q1-2010Q2-2010Q3-2010 Bank of Nevada110.4%124.4%96.6%89.8%70.1%Alliance Bank of Arizona58.5%68.9%64.1%58.8%44.1%Torrey Pines Bank50.3%49.8%47.5%37.3%31.9%First Independent Bank of Nevada50.1%58.3%67.4%67.9%59.3%Alta Alliance Bank12.4%27.7%25.0%20.4%20.3%Western Alliance68.4%74.0%69.9%63.6%57.0%
Pg.24
Strategic Outlook
Focus on core banking operations Reduce non-performing assets Increase market share Strengthen risk management
Pg. 25