Attached files
| file | filename |
|---|---|
| 8-K - FORM 8-K - TAYLOR CAPITAL GROUP INC | d8k.htm |
 Exhibit 99.1 |
 2
Forward-Looking Statement
Forward-Looking Statements. Certain statements made throughout this document
that are not historical facts may contain forward-looking statements
regarding the Company’s future plans, objectives and future performance. Any
statements about our expectations, beliefs, plans, predictions, forecasts,
objectives, assumptions or future events or performance are not historical
facts and may be forward-looking. These statements are often, but not always,
made through the use of words or phrases such as “anticipate,”
“believes,”
“can,”
“could,”
“may,”
“predicts,”
“potential,”
“should,”
“will,”
“estimate,”
“plans,”
“projects,”
“continuing,”
“targeting,”
“ongoing,”
“expects,
“contemplates”, “intends”
and similar words or phrases. These statements are predictions and involve
estimates, known and unknown risks, assumptions and uncertainties that could
cause actual results to differ materially from those expressed or implied by
such forward-looking statements. All forward-looking statements are necessarily only
estimates of future results, and there can be no assurance that actual results will
not differ materially from expectations, and, therefore, you are cautioned
not to place undue reliance on any such statements. Any forward- looking
statements are qualified in their entirety by reference to the risk factors and other information discussed
throughout the private placement memorandum.
Data. The market data, information and opinions that are contained herein
have been compiled or arrived at by us from third party sources. Information
with respect to other financial institutions has been drawn from publicly
available sources. We have not independently verified any the data obtained
from these sources, and we cannot assure you of the accuracy or completeness
of the data. All information is subject to change without notice. This
presentation is for the assistance of recipients only, but is not to be
relied upon as authoritative and is not to be substituted for the exercise of one's own judgment. We accept
no responsibility for any use of this information. |
 3
Agenda
Summary and Questions & Answers
Results of Operations and Balance Sheet Highlights: Randy
Conte, CFO and COO
Third Quarter 2010 Highlights: Progress on ‘Fix and Grow’
Strategy: Mark Hoppe, President and CEO |
 |
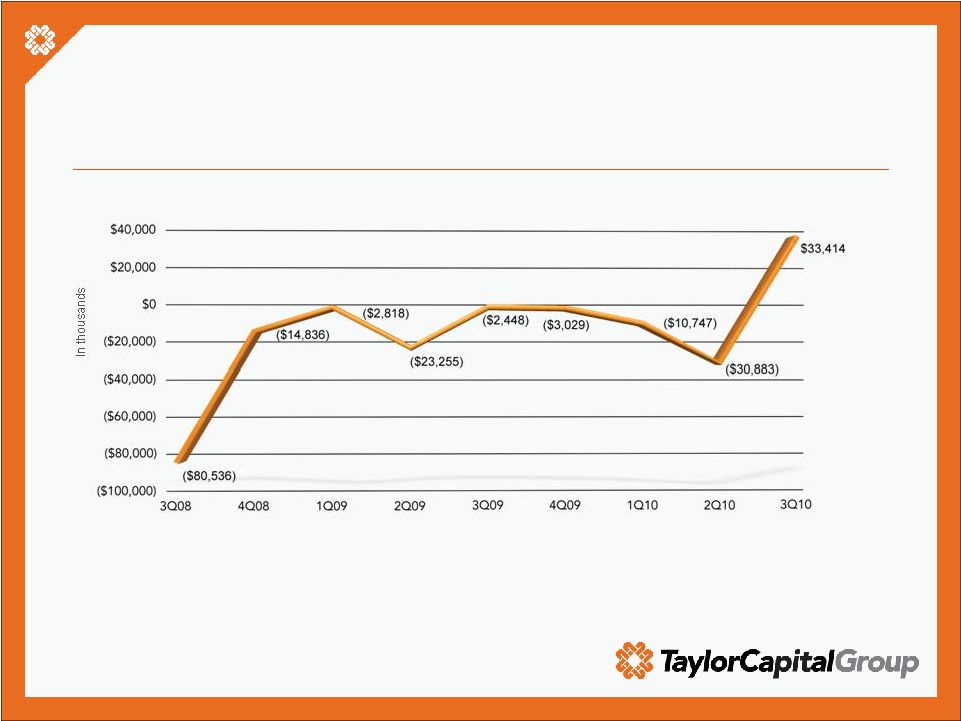 Taylor
Capital Group posted net income of $33.4 million in 3Q 2010
»
Results due to:
•
Securities
gains
of
$32.8
million:
minimized
prepayment
risk
and
interest
rate
sensitivity
•
Income before income taxes excluding gains on the sale of investment securities
was $931,000
Net Income (Loss)
5 |
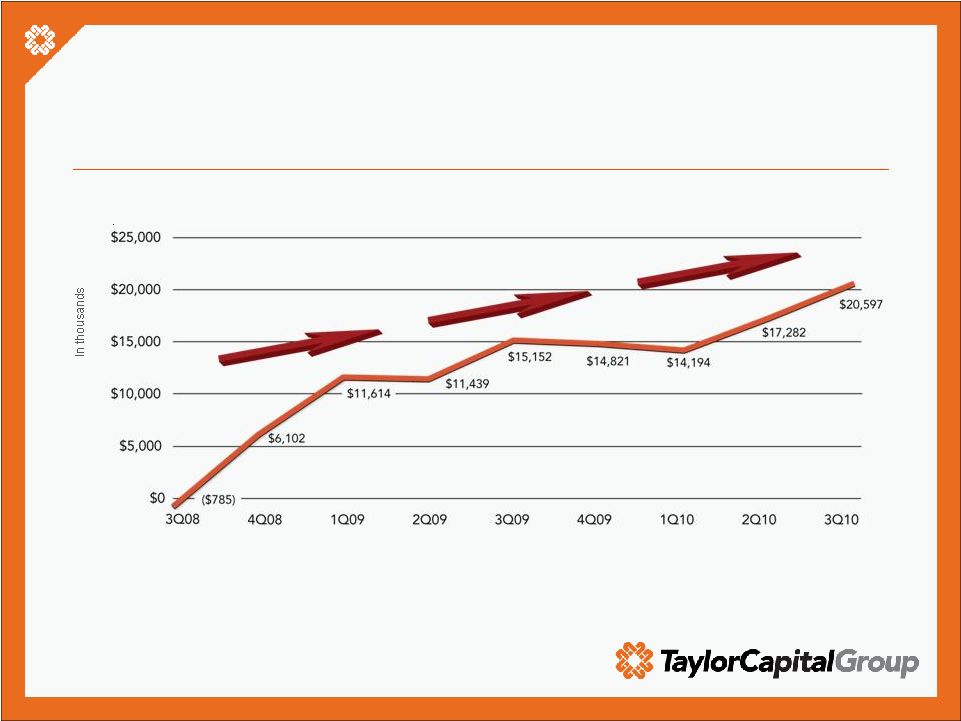 Pre-tax, pre-provision earnings from core
operations increased 19.2% in Q3 2010
Pre-tax, Pre-provision Earnings from Core Operations*
6
*For a reconciliation to GAAP measures of pre-tax, pre-provision earnings
from core operations, please see page 23 of this presentation.
|
 Grow: key
business lines driving earnings power and diversification of revenue
•
For 2010, through 3Q, added 67 new relationships
•
Commitments as of 3Q 2010 are $2.1 billion and fundings are
$1.5 billion
7
Cole Taylor
Bank
Commercial
Banking
•
For 2010, through 3Q, added 26 new relationships
•
As of September 30, 2010, commitments are $653.6 million and
fundings are $317.6 million
•
Total loan fees collected through 3Q 2010 are $5.1 million
Cole Taylor
Business
Capital
•
Generated revenues of $6.3 million in 3Q 2010
•
Originated $242.2 million in mortgages in 3Q 2010
•
Hired 119 FTEs through
September 30, 2010
•
Qualified in 17 states, with retail offices in 5 of those states
Cole Taylor
Mortgage |
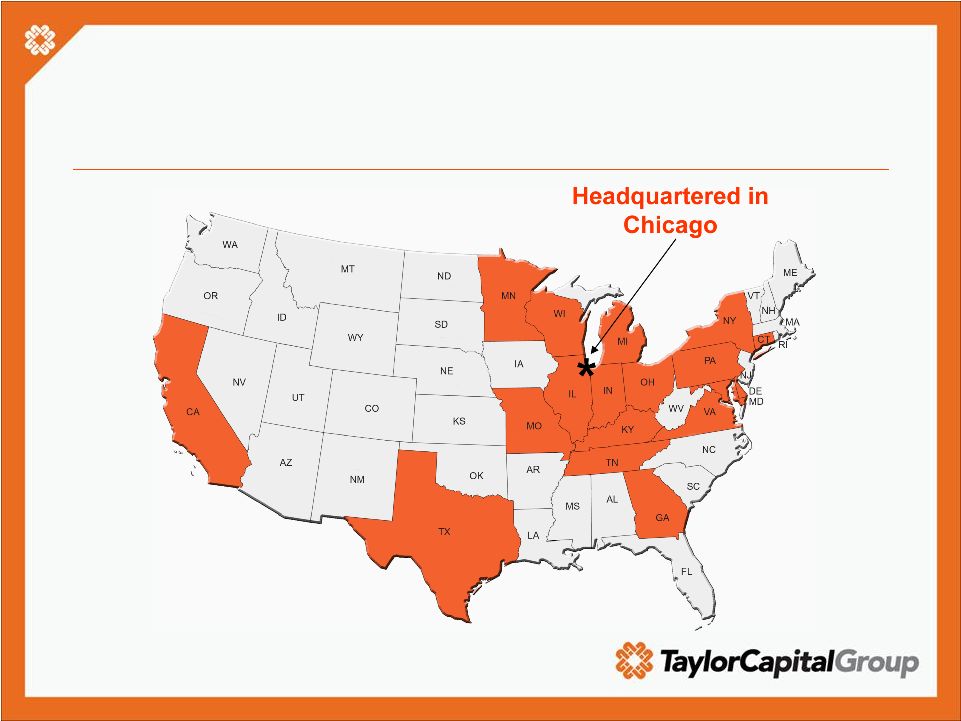 Through
Cole
Taylor
Business
Capital
and
Cole
Taylor
Mortgage,
the
Bank
operates
in
18
states
8 |
 Fix:
Priority
continues
to
be
nonperforming
loan
reduction while pursuing best economic
outcome; credit dynamics remain challenging
9 |
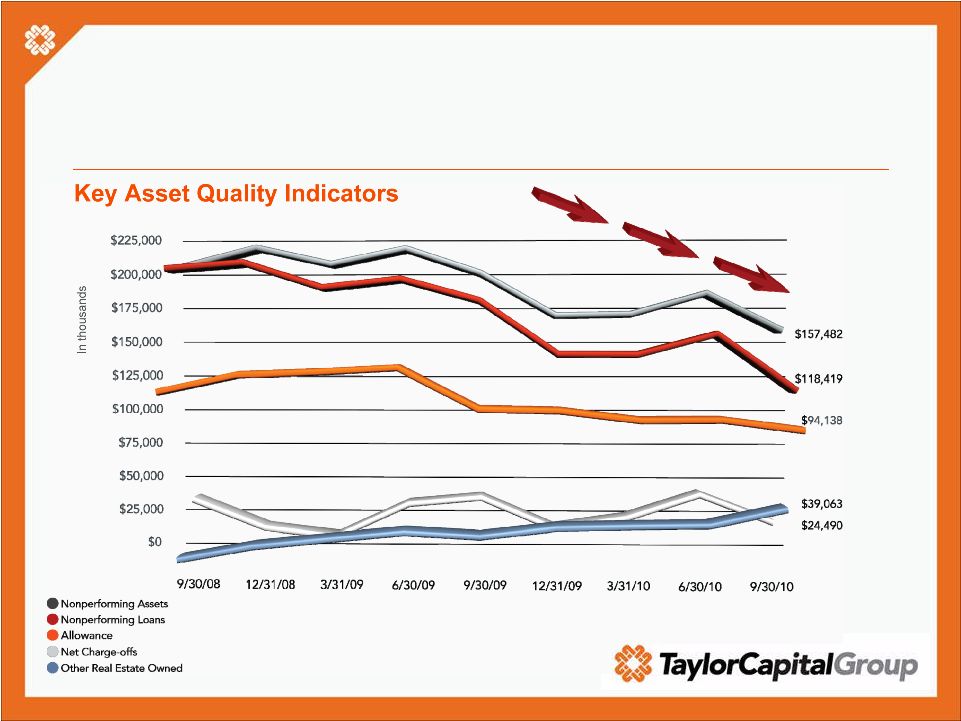
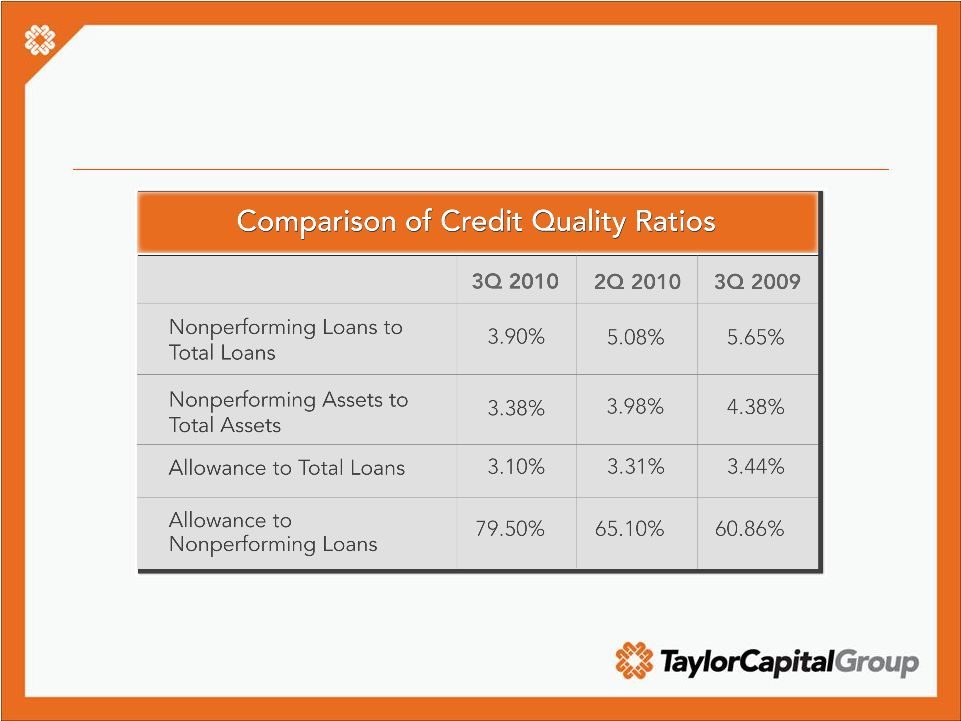 Solid
improvement in credit quality, compared to 2Q 2010 and 3Q 2009
10 |
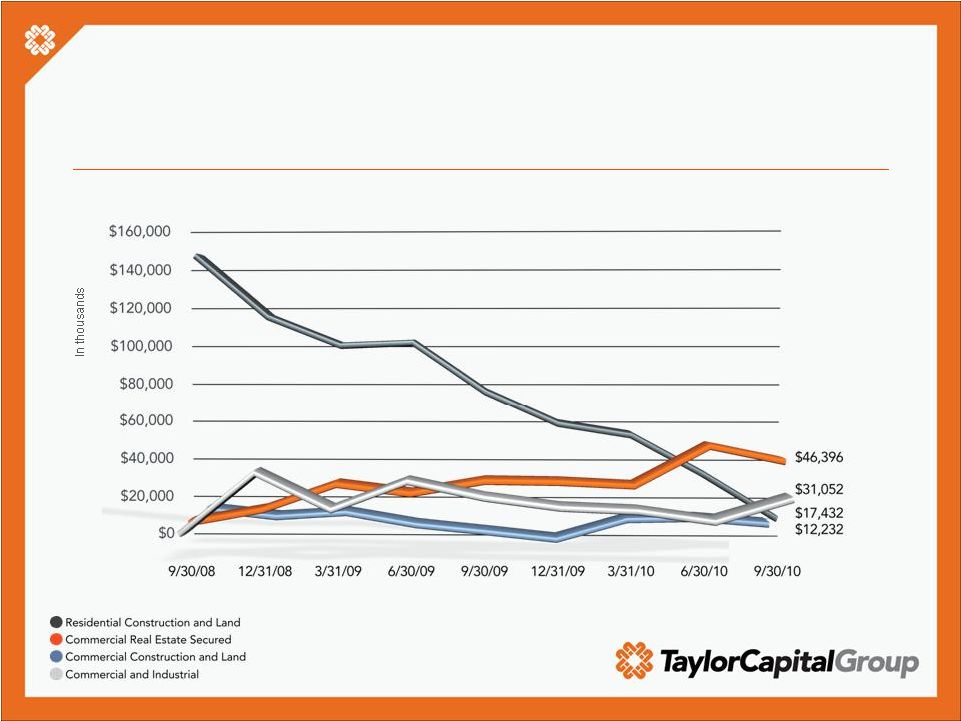 Significant nonaccrual reduction in residential
construction and land; other portfolios stable
11
Nonaccrual Loans by Category |
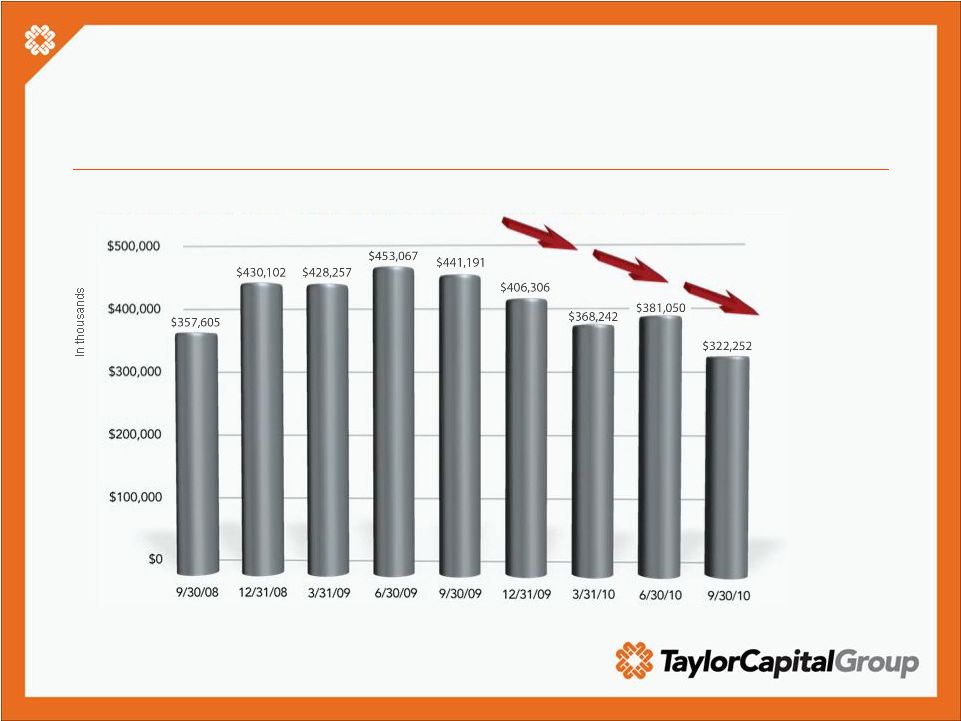 Commercial
watch list* down more than $130MM from peak at 6/30/2009
*Commercial watch list of all criticized and classified loans (includes special
mention, substandard, and nonaccrual loans) in commercial & industrial,
commercial real estate, residential land and construction and commercial
land and construction federal collateral codes. Excludes consumer
loans. 12
Commercial Watch List of Criticized and Classified Loans*
|
 |
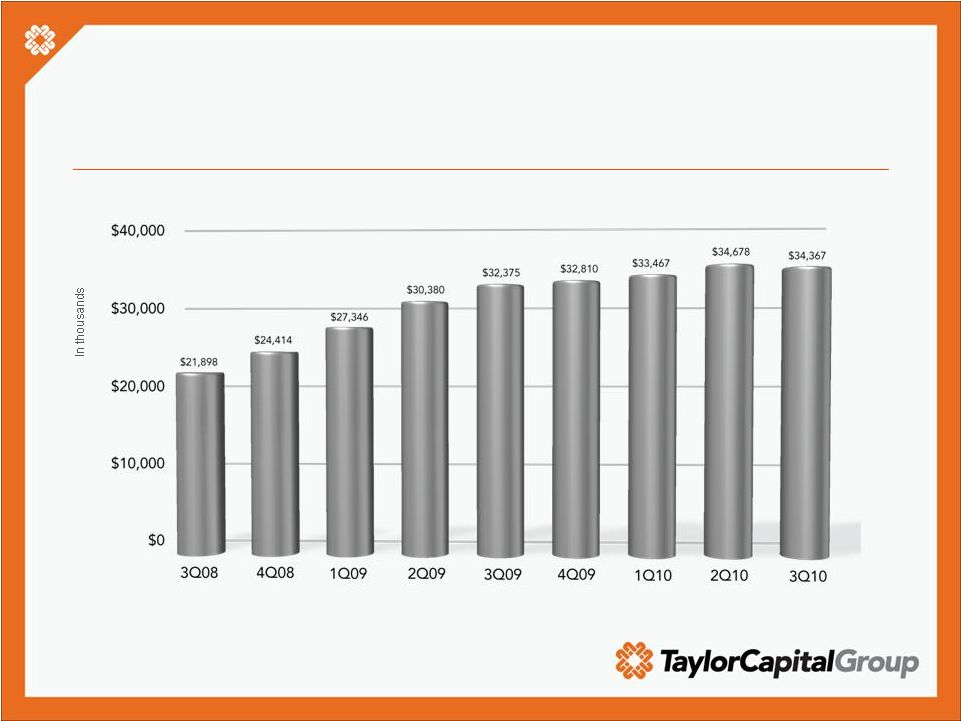 Net
interest income down slightly due to the sale of investment securities
Net Interest Income
14 |
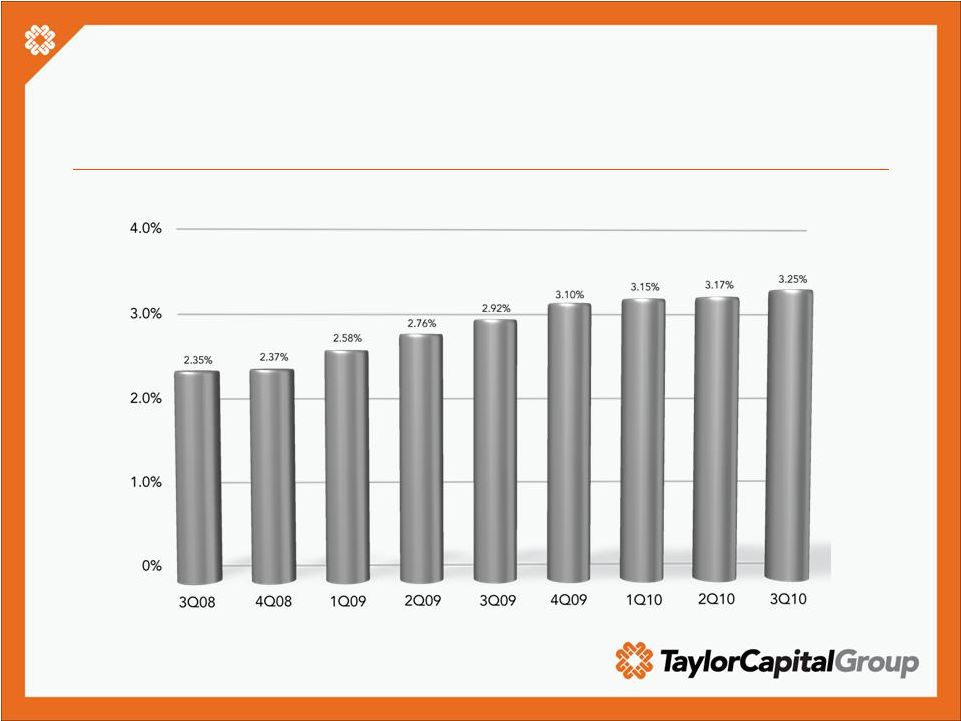 Net
interest margin increased 8 bps over 2Q 2010; up 90 bps from low at 3Q 2008
15
Net Interest Margin (Tax Equivalent)*
*Adjustment reflects tax-exempt interest income on an equivalent
before-tax basis assuming a tax rate of 35%. |
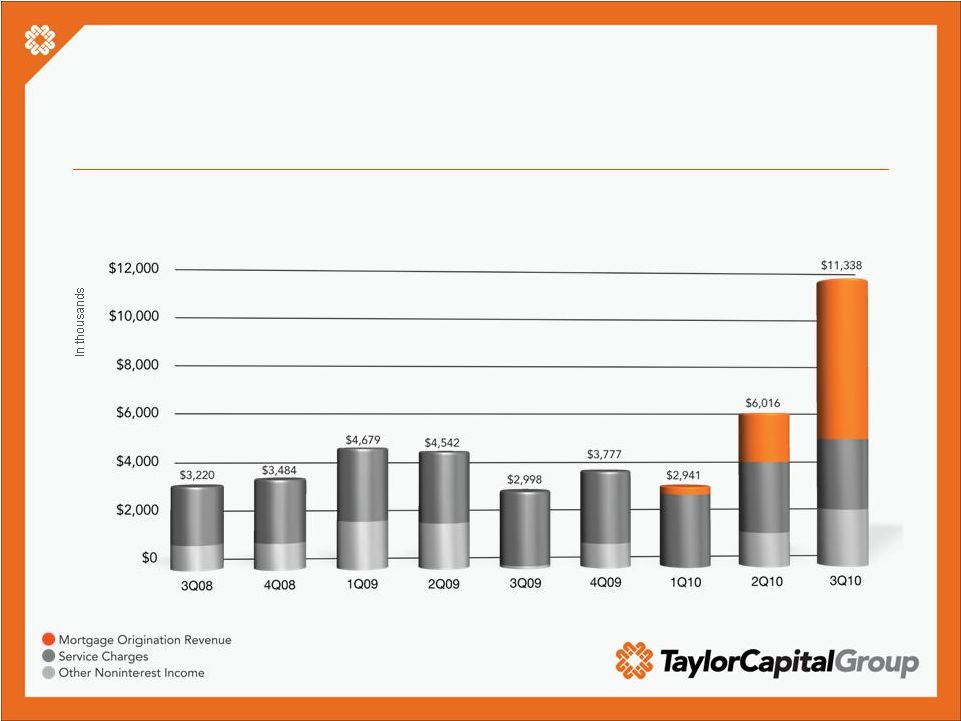 Noninterest Income Excluding Gains or Losses on the Sale
of Investment Securities
16
Noninterest income excluding securities gains
up largely due to mortgage origination revenue |
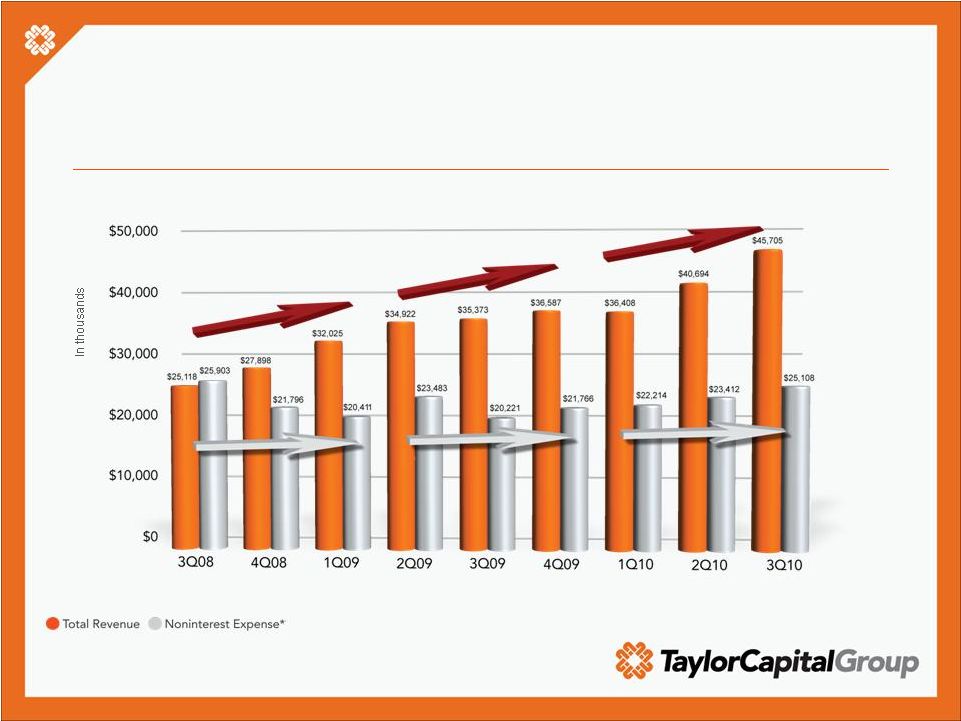 Core
earnings strengthened through business line growth and tight expense control
17
*For a reconciliation of revenue to GAAP measures, please see
page 23 of this presentation; Noninterest expense quoted above is
normalized for NPA expense.
Total Revenue* and Noninterest Expense Trends |
 |
 Most
significant change in the balance sheet was sale of investment securities
»
Sold approximately $700 million of investment securities, largely
mortgage backed securities, in the third quarter of 2010
•
Total investment portfolio reduced $257.8 million as of 9/30/10
»
Minimized prepayment risk that threatened unrealized gains
»
Augmented Tier 1 capital by realizing the gains
»
Other assets and other liabilities increased due to the timing of
investment securities sale and purchase transactions, respectively
19 |
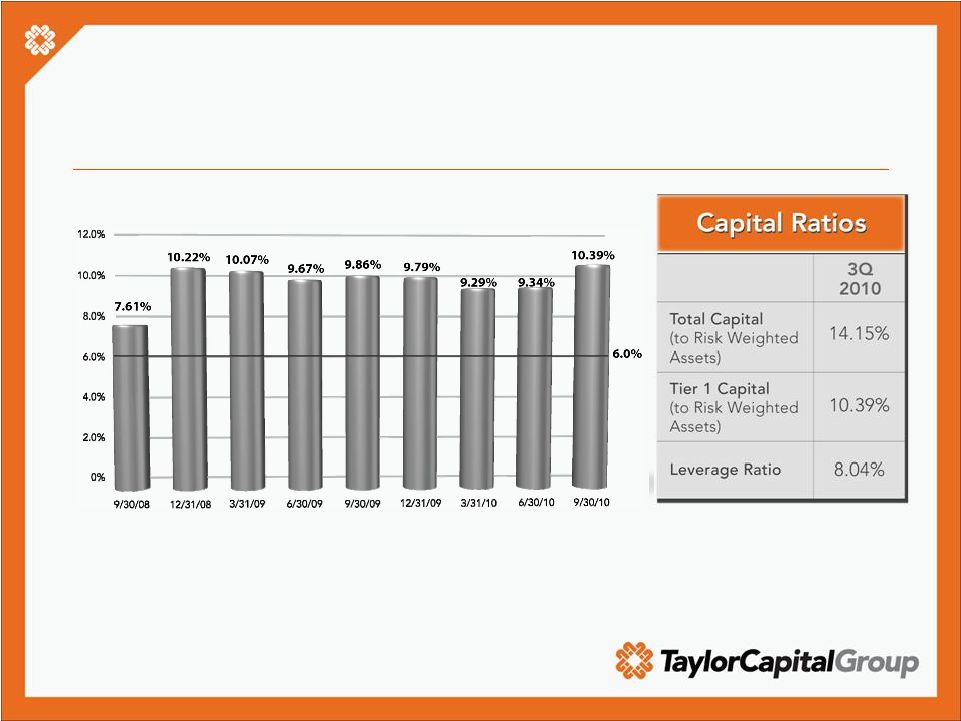 Tier
1 Total Risk Based Capital Ratio Trends 20
Capital ratios remain above regulatory
definition for ‘well-capitalized’ banks |
 |
 Net income
of $33.4 million; core earning and asset quality continuing to show
improvement »
Net income for 3Q 2010 was $33.4 million, compared to 2Q 2010 net
loss of $30.9 million; results due to:
•
$32.8 million of securities gains undertaken to minimize prepayment risk
•
Increased pre-tax, pre-provision income over 2Q 2010
•
Reduced provision and NPA expense over 2Q 2010
»
Solid improvement in the earnings power of the core business:
•
19.2% increase in pre-tax, pre-provision earnings from core operations
quarter over quarter
•
Income before income taxes excluding securities gains was $931,000
»
Asset quality improved
•
Priority remains nonperforming loan reduction while pursuing best economic
outcome
•
Residential
construction
and
land
–
most
challenged
portfolio
down
18.6%
from 2Q 2010 to 3Q 2010
22 |
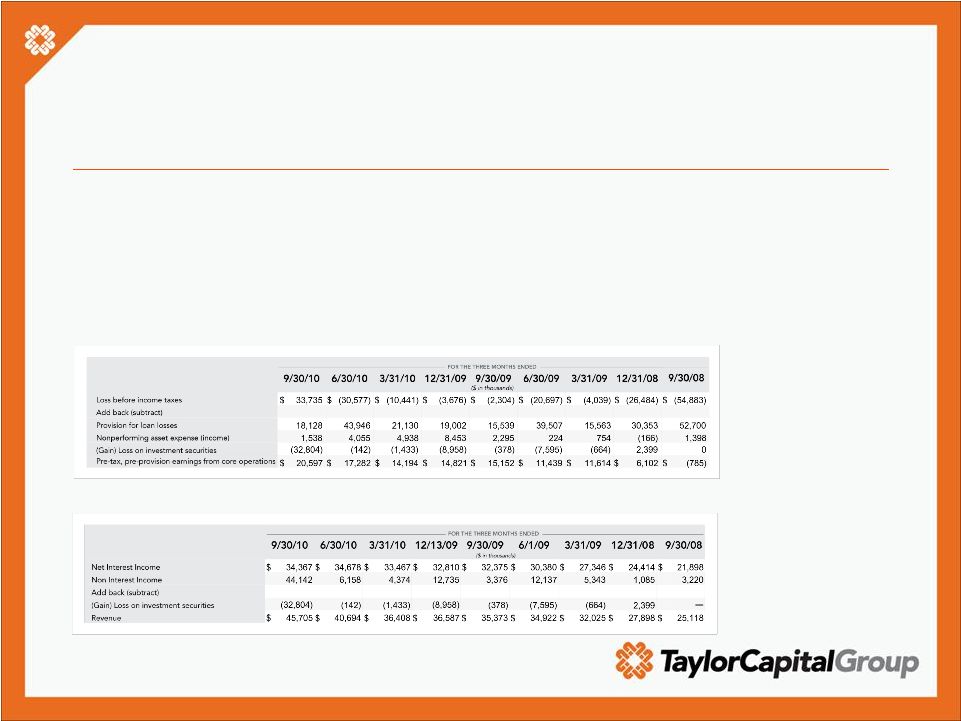 23
Non-GAAP Measures
of Performance
The Company's accounting and reporting policies conform to U.S. generally accepted accounting
principles ("GAAP") and general practice within the banking industry. Management uses
certain non-GAAP financial measures to evaluate the Company’s financial performance and
has provided the non-GAAP measure of pre-tax, pre-provision earnings from core operations and the non-GAAP measure of
revenue. For the non-GAAP financial measure of pre-tax, pre-provision earnings from core
operations, the provision of loan losses, nonperforming asset expense and certain
non-recurring items, such as gains and losses on investment securities, are excluded from the
determination of operating results. The non-GAAP measure of revenue is calculated as the sum
of net interest income and noninterest income less securities gains and losses. Management
believes that these measures are useful because they provide a more comparable basis for
evaluating financial performance from core operations period to period. Schedules reconciling
earnings in accordance with GAAP to the non-GAAP measurement of pre-tax, pre-provision earnings from core
operations and revenue are provided below. |