Attached files
| file | filename |
|---|---|
| 8-K - FORM 8-K - OCCIDENTAL PETROLEUM CORP /DE/ | form8k-20101019.htm |
| EX-99.2 - EXHIBIT 99.2 - OCCIDENTAL PETROLEUM CORP /DE/ | ex99_2-20101019.htm |
| EX-99.5 - EXHIBIT 99.5 - OCCIDENTAL PETROLEUM CORP /DE/ | ex99_5-20101019.htm |
| EX-99.1 - EXHIBIT 99.1 - OCCIDENTAL PETROLEUM CORP /DE/ | ex99_1-20101019.htm |
| EX-99.3 - EXHIBIT 99.3 - OCCIDENTAL PETROLEUM CORP /DE/ | ex99_3-20101019.htm |
EXHIBIT 99.4
Occidental Petroleum Corporation
Third Quarter 2010 Earnings Conference Call
October 19, 2010
Third Quarter 2010 Earnings Conference Call
October 19, 2010
1

2
Third Quarter 2010 Earnings - Highlights
Third Quarter 2010 Earnings - Highlights
• Core Results - $1.2 Billion vs. $929 Million in 3Q09
– Core EPS $1.47 (diluted) vs. $1.14 in 3Q09.
• Net Income - $1.2 Billion vs. $927 Million in 3Q09
– EPS $1.46 (diluted) vs. $1.14 in 3Q09.
2
3
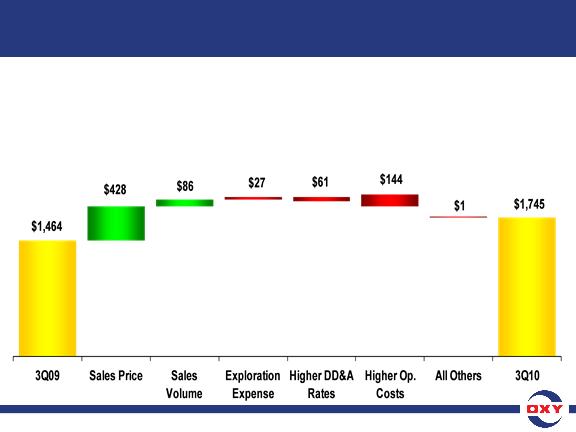
($ in millions)
• Core Results for 3Q10 of $1.745 B vs. $1.464 B in 3Q09
– Improvement in 2010 driven mostly by higher commodity prices with additional contributions
from higher volumes. Partially offsetting these gains were higher DD&A rates and higher
operating expenses, partly resulting from fully expensing CO2 costs in 2010.
from higher volumes. Partially offsetting these gains were higher DD&A rates and higher
operating expenses, partly resulting from fully expensing CO2 costs in 2010.
Third Quarter 2010 Earnings - Oil & Gas
Segment Variance Analysis - 3Q10 vs. 3Q09
Segment Variance Analysis - 3Q10 vs. 3Q09
3

4
3Q10 3Q09
Reported Segment Earnings ($ mm) $1,745 $1,464
WTI Oil Price ($/bbl) $76.20 $68.30
NYMEX Gas Price ($/mcf) $4.53 $3.60
Oxy’s Realized Prices
Worldwide Oil ($/bbl) $70.71 $62.79
US Natural Gas ($/mcf) $4.20 $3.04
Third Quarter 2010 Earnings - Oil & Gas Segment
4

5
Third Quarter 2010 Earnings - Oil & Gas Segment
3Q10 3Q09
Oil and Gas Production Volumes (mboe/d) 751 705
Oil and Gas Sales Volumes (mboe/d) 749 702
– Year-over-year increases of over 6.5%.
• Most of the year-over-year production increases came from the
Middle East / North Africa region, with smaller increases in Argentina
and the US.
Middle East / North Africa region, with smaller increases in Argentina
and the US.
• Sales volume differs from the production volumes above due mainly
to the timing of a lifting in Argentina.
to the timing of a lifting in Argentina.
• Exploration expense was $83 million in 3Q10.
5

6
Third Quarter 2010 Earnings - Oil & Gas
Segment - Cash Production Costs and Taxes
Segment - Cash Production Costs and Taxes
Third Quarter 2010 Earnings - Oil & Gas
Segment - Cash Production Costs and Taxes
Segment - Cash Production Costs and Taxes
• Oil and gas cash production costs, excluding production
and property taxes, were $10.25 per boe for YTD 2010.
and property taxes, were $10.25 per boe for YTD 2010.
– Full-year 2009 costs were $9.37 a boe.
– The nine-month increase reflects $0.35 a barrel higher CO2 costs,
due to our decision to expense 100% of injected CO2 beginning
in 2010, and higher field support operations, workovers and
maintenance costs.
due to our decision to expense 100% of injected CO2 beginning
in 2010, and higher field support operations, workovers and
maintenance costs.
– The higher domestic workover activity is mostly in the Permian.
• Taxes - other than on income were $1.76 per boe for the
first nine months of 2010 compared to $1.60 per boe for
all of 2009. These costs, which are sensitive to product
prices, reflect the effect of higher crude oil and gas prices
in 2010.
first nine months of 2010 compared to $1.60 per boe for
all of 2009. These costs, which are sensitive to product
prices, reflect the effect of higher crude oil and gas prices
in 2010.
6

7
($ in millions)
*Lower feedstock costs
• Core Results for 3Q10 of $189 mm vs. $108 mm in 2Q10
– Results reflect improvement from 2Q10 in both volumes and margins across most product
lines. Export markets have improved more rapidly than domestic markets due in part to the
favorable feedstock costs in North America versus Europe and Asia.
lines. Export markets have improved more rapidly than domestic markets due in part to the
favorable feedstock costs in North America versus Europe and Asia.
Third Quarter 2010 Earnings - Chemical
Segment Variance Analysis - 3Q10 vs. 2Q10
Segment Variance Analysis - 3Q10 vs. 2Q10
7
8
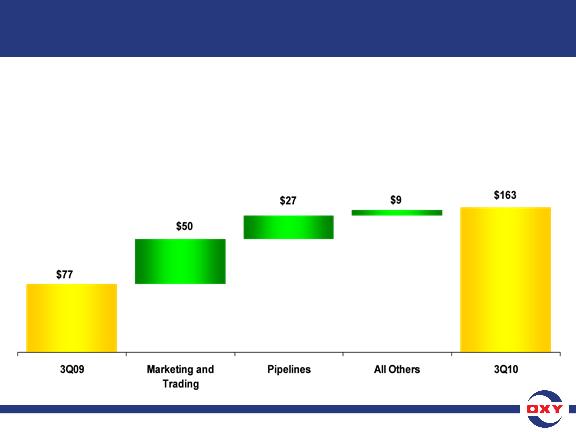
($ in millions)
• Core Results for 3Q10 of $163 mm vs. $77 mm in 3Q09
– The increase in earnings was mainly due to trading and marketing income and higher
margins in the pipeline businesses.
margins in the pipeline businesses.
Third Quarter 2010 Earnings - Midstream
Segment Variance Analysis - 3Q10 vs. 3Q09
Segment Variance Analysis - 3Q10 vs. 3Q09
8

9
Third Quarter 2010 Earnings -
Nine Months Results & Capital Spending
Nine Months Results & Capital Spending
Third Quarter 2010 Earnings -
Nine Months Results & Capital Spending
Nine Months Results & Capital Spending
YTD2010 YTD2009
• Net Income ($ mm) $3,318 $1,977
• EPS (diluted) $4.07 $2.43
• Core Income ($ mm) $3,336 $2,025
• EPS (diluted) $4.09 $2.48
• Capital spending for 3Q10 was about $1.1 billion and $2.8 billion for
YTD 2010.
YTD 2010.
– Year to-date capital expenditures by segment were 82% in Oil and Gas, 13% in
Midstream with the remainder in Chemicals.
Midstream with the remainder in Chemicals.
– Our total year capital is expected to be about $4.4 billion.
– The capital spending rate will increase in 4Q10 largely in our domestic operations
and in Iraq.
and in Iraq.
9

10
Third Quarter 2010 Earnings -
Shares Outstanding and Debt
Shares Outstanding and Debt
Shares Outstanding (mm) YTD10 9/30/10
Weighted Average Basic 812.4
Weighted Average Diluted 813.8
Basic Shares Outstanding 812.6
Diluted Shares Outstanding 814.0
9/30/10 12/31/09
Debt/Capital 7% 9%
10
11
Cash Flow
From
Operations
$6,600
From
Operations
$6,600
Beginning
Cash $1,200
12/31/09
Cash $1,200
12/31/09
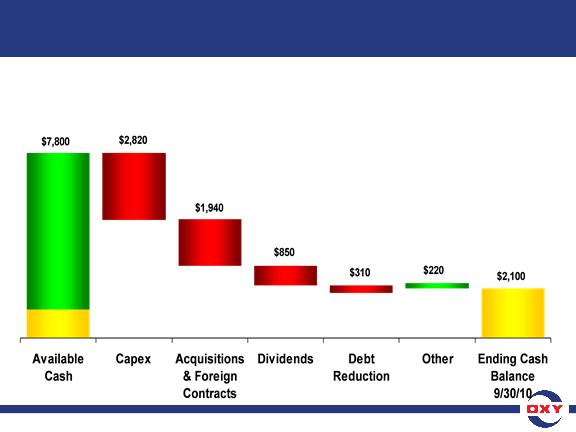
($ in millions)
– 2010 YTD free cash flow after capex and dividends but before
acquisition activity and debt retirements was about $3.1 billion.
acquisition activity and debt retirements was about $3.1 billion.
Third Quarter 2010 Earnings - Cash Flow 2010 YTD
11

12
Third Quarter 2010 Earnings - Acquisitions
Third Quarter 2010 Earnings - Acquisitions
• Our acquisition costs in 3Q10 were $1.1 billion and we expect to
spend about $300 million in the first part of 4Q10.
spend about $300 million in the first part of 4Q10.
– Through these acquisitions we expect to add about 10 mboe/d average
production in 4Q10.
production in 4Q10.
– These acquisitions have a run rate of about 12 mboe/d.
– Of this production about a third will be liquids and the balance will be gas.
– Over the medium-term, we expect these acquisitions to add at least 25
mboe/d of production.
mboe/d of production.
– This increase will come largely from oil production.
• In addition to these acquisitions, we expect to add an additional
380,000 acres to our California acreage position and interests in
100,000 acres in other producing areas.
380,000 acres to our California acreage position and interests in
100,000 acres in other producing areas.
– Our California acreage will now reach approximately 1.6 million acres, an
overwhelming portion of which consists of mineral interests.
overwhelming portion of which consists of mineral interests.
• We don't contemplate any more sizeable acquisitions of acreage
in California.
in California.
12

13
Third Quarter 2010 Earnings - Rig Activity
Third Quarter 2010 Earnings - Rig Activity
• Drilling rigs
– At the beginning of 2010 we were running 11 development rigs in
California and 5 rigs in the Permian.
California and 5 rigs in the Permian.
– We are currently running 16 drilling rigs in California and 9 in the
Permian and expect our year-end exit rate rig count to reach 19 rigs in
California and 14 in the Permian.
Permian and expect our year-end exit rate rig count to reach 19 rigs in
California and 14 in the Permian.
– Next year, we anticipate working 21 rigs in California and 15 rigs in the
Permian.
Permian.
– In the current environment, we are cautious about natural gas drilling
and may reevaluate our 2011 US natural gas drilling program.
and may reevaluate our 2011 US natural gas drilling program.
13

14
Third Quarter 2010 Earnings - Rig Activity
Third Quarter 2010 Earnings - Rig Activity
• Workover rigs
– In the Permian, we are currently running 94 workover rigs, compared
with the 57 rigs we had at the beginning of the year.
with the 57 rigs we had at the beginning of the year.
– We currently expect to be operating 110 rigs at the end of 2010.
– A portion of workover expenditures are expensed as opposed to being
capitalized depending on their nature.
capitalized depending on their nature.
– Our operating costs have recently increased due to higher workover
activity to $10.94 per boe in 3Q10 and further increases are expected in
4Q10.
activity to $10.94 per boe in 3Q10 and further increases are expected in
4Q10.
14

15
Third Quarter 2010 Earnings -
Oil and Gas Production - 4Q10 Outlook
Oil and Gas Production - 4Q10 Outlook
• We expect oil and gas production and sales volumes to be
in the range of 760 to 770 mboe/d at 3Q10 average oil
prices.
in the range of 760 to 770 mboe/d at 3Q10 average oil
prices.
– Volume increases in 4Q10 are expected to come from California,
Oman's Mukhaizna field and the acquisitions.
Oman's Mukhaizna field and the acquisitions.
– An increase in oil prices of $5.00 per barrel from 3Q10 levels would
result in about 4 mb/d lower production due to the impact of higher
prices affecting our production sharing and similar contracts.
result in about 4 mb/d lower production due to the impact of higher
prices affecting our production sharing and similar contracts.
• Based on the development plan at the Zubair field in Iraq,
we believe we should have a small amount of production
in 4Q10.
we believe we should have a small amount of production
in 4Q10.
– We do not expect to report any sales from Iraq until 1Q11.
– The field development plan is on track for us to meet next year's
production targets.
production targets.
15

16
Third Quarter 2010 Earnings - 4Q10 Outlook
• Commodity Price Sensitivity - Earnings
– At current market prices, a $1.00 per barrel change in oil prices impacts oil
and gas quarterly earnings before income taxes by about $39 mm;
and gas quarterly earnings before income taxes by about $39 mm;
– A swing of $0.50 per mm BTU in domestic gas prices has a $27 mm impact
on quarterly pretax income; the current NYMEX gas price is around $3.90
p/mcf.
on quarterly pretax income; the current NYMEX gas price is around $3.90
p/mcf.
• We expect 4Q10 exploration expense to be about $110 mm
for seismic and drilling for our exploration programs.
for seismic and drilling for our exploration programs.
16

17
Third Quarter 2010 Earnings - 4Q10 Outlook
Third Quarter 2010 Earnings - 4Q10 Outlook
• The Chemical segment is expected to provide earnings
for 4Q10 of $100 to $120 million.
for 4Q10 of $100 to $120 million.
– The fourth quarter is usually the weakest quarter for the
business.
business.
– We expect that continued margin improvements will be offset by
the typical seasonal slowdown in the housing, construction,
bleach and fertilizer markets.
the typical seasonal slowdown in the housing, construction,
bleach and fertilizer markets.
• We expect our combined worldwide tax rate in 4Q10 to
be about 41 percent.
be about 41 percent.
17

18
Third Quarter 2010 Earnings - Century Plant
Third Quarter 2010 Earnings - Century Plant
• The Century Plant has just started operations and will be
providing additional CO2 to support growth in our
Permian operations.
providing additional CO2 to support growth in our
Permian operations.
– We expect that the plant will yield about 180 mmcf/d of CO2 next
year to support our Permian EOR operations.
year to support our Permian EOR operations.
– We are in the process of contracting additional CO2 from other
sources and will use penalty payments due from the operator for
under production to support these activities.
sources and will use penalty payments due from the operator for
under production to support these activities.
– We expect to have sufficient CO2 to meet the needs of our
previously disclosed expansion of flooding activities.
previously disclosed expansion of flooding activities.
18

19
Third Quarter 2010 Earnings - California Update
Third Quarter 2010 Earnings - California Update
• Exploration Activity:
– During the first nine months of 2010, we drilled 7 conventional
exploration and extension wells in California.
exploration and extension wells in California.
– Of these, 5 were outside of the Kern County Discovery area.
– Two of these wells are currently being tested.
– We also drilled 12 unconventional exploration wells in the first nine
months of 2010, of which 3 were successful and 5 are being tested.
months of 2010, of which 3 were successful and 5 are being tested.
– In 4Q10, we expect to drill 10 exploration wells of which 2 will be
conventional and the remaining 8 wells will be non-conventional.
conventional and the remaining 8 wells will be non-conventional.
– Our 4Q10 exploration program will target smaller prospects until permits
are obtained for larger ones.
are obtained for larger ones.
• Exploitation Activity:
– We have drilled 13 conventional exploitation wells in the Kern County
Discovery area and 15 unconventional exploitation wells in California in
the first nine months.
Discovery area and 15 unconventional exploitation wells in California in
the first nine months.
– Due to delays in permitting, we've reduced our exploitation plans for the
second half of the year by about 10 wells.
second half of the year by about 10 wells.
19

20
Third Quarter 2010 Earnings - California Update
Third Quarter 2010 Earnings - California Update
• We are continuing to have problems with our gas processing
and gathering infrastructure at Elk Hills.
and gathering infrastructure at Elk Hills.
• As a result, we expect our gas and related NGL production to
be about flat in 4Q10.
be about flat in 4Q10.
• We have ordered and commenced construction of the first
new processing plant and will order the second plant shortly.
new processing plant and will order the second plant shortly.
• Once complete, the new processing plants will increase
productive capacity, improve yields, enhance netbacks and
lower operating costs.
productive capacity, improve yields, enhance netbacks and
lower operating costs.
• We are also actively working to optimize and debottleneck our
existing facilities to improve performance.
existing facilities to improve performance.
• In addition, we are shifting our drilling to oil wells, which we
expect will result in higher oil production in 4Q10.
expect will result in higher oil production in 4Q10.
20

21
21