Attached files
| file | filename |
|---|---|
| 8-K - FORM 8-K - METLIFE INC | y87056e8vk.htm |
Exhibit 99.1
| John Rosenthal Senior Managing Director Investments |
| Safe Harbor Statement These materials may contain or incorporate by reference information that includes or is based upon forward-looking statements within the meaning of the Private Securities Litigation Reform Act of 1995. Forward-looking statements give expectations or forecasts of future events. These statements can be identified by the fact that they do not relate strictly to historical or current facts. They use words such as "anticipate," "estimate," "expect," "project," "intend," "plan," "believe" and other words and terms of similar meaning in connection with a discussion of future operating or financial performance. In particular, these include statements relating to future actions, prospective services or products, future performance or results of current and anticipated services or products, sales efforts, expenses, the outcome of contingencies such as legal proceedings, trends in operations and financial results. Any or all forward-looking statements may turn out to be wrong. They can be affected by inaccurate assumptions or by known or unknown risks and uncertainties. Many such factors will be important in determining MetLife's actual future results. These statements are based on current expectations and the current economic environment. They involve a number of risks and uncertainties that are difficult to predict. These statements are not guarantees of future performance. Actual results could differ materially from those expressed or implied in the forward-looking statements. Risks, uncertainties, and other factors that might cause such differences include the risks, uncertainties and other factors identified in MetLife, Inc.'s filings with the U.S. Securities and Exchange Commission (the "SEC"). These factors include: (1) any delay or failure to complete the acquisition of American Life Insurance Company ("ALICO"), a subsidiary of ALICO Holdings LLC ("ALICO Holdings"), and Delaware American Life Insurance Company ("DelAm") (collectively, the "Acquisition"); (2) the imposition of onerous conditions following the Acquisition; (3) difficulties in integrating the business acquired in the Acquisition (the "Alico Business"); (4) uncertainty with respect to the outcome of the closing agreement entered into between ALICO and the United States Internal Revenue Service in connection with the Acquisition; (5) uncertainty with respect to the making of elections under Section 338 of the U.S. Internal Revenue Code of 1986, as amended, and any benefits therefrom; (6) an inability to manage the growth of the Alico Business; (7) a write down of the goodwill established in connection with the Acquisition; (8) exchange rate fluctuations; (9) an inability to predict the financial impact of the Acquisition on MetLife's business and financial results; (10) events relating to American International Group, Inc. that could adversely affect the Alico Business or MetLife; (11) the dilutive impact on MetLife, Inc.'s stockholders resulting from the issuance of equity securities to ALICO Holdings in connection with the Acquisition; (12) a decrease in MetLife, Inc.'s stock price as a result of ALICO Holdings' ability to sell its equity securities; (13) the conditional payment obligation of approximately $300 million to ALICO Holdings if the conversion of the Series B Contingent Convertible Junior Participating Non-Cumulative Perpetual Preferred Stock issued to ALICO Holdings in connection with the Acquisition into MetLife, Inc.'s common stock is not approved; (14) change of control provisions in the Alico Business' agreements; (15) effects of guarantees within certain of ALICO's variable life and annuity products; (16) regulatory action in the financial services industry affecting the combined business; (17) financial instability in Europe and possible write downs of sovereign debt of European nations; (18) difficult conditions in the global capital markets; (19) increased volatility and disruption of the capital and credit markets, which may affect MetLife's ability to seek financing or access its credit facilities; (20) uncertainty about the effectiveness of the U.S. government's programs to stabilize the financial system, the imposition of fees relating thereto, or the promulgation of additional regulations; (21) impact of comprehensive financial services regulation reform on MetLife; (22) exposure to financial and capital market risk; (23) changes in general economic conditions, including the performance of financial markets and interest rates, which may affect MetLife's ability to raise capital, generate fee income and market-related revenue and finance statutory reserve requirements and may require MetLife to pledge collateral or make payments related to declines in value of specified assets; (24) potential liquidity and other risks resulting from MetLife's participation in a securities lending program and other transactions; (25) investment losses and defaults, and changes to investment valuations; (26) impairments of goodwill and realized losses or market value impairments to illiquid assets; (27) defaults on MetLife's mortgage loans; (28) the impairment of other financial institutions; (29) MetLife's ability to address unforeseen liabilities, asset impairments or rating actions arising from any future acquisitions, including the Acquisition, and to successfully integrate acquired businesses with minimal disruption; (30) economic, political, currency and other risks relating to MetLife's international operations; (31) MetLife, Inc.'s primary reliance, as a holding company, on dividends from its subsidiaries to meet debt payment obligations and the applicable regulatory restrictions on the ability of the subsidiaries to pay such dividends; (32) downgrades in MetLife, Inc.'s and its affiliates' claims paying ability, financial strength or credit ratings; (33) ineffectiveness of risk management policies and procedures; (34) availability and effectiveness of reinsurance or indemnification arrangements, as well as default or failure of counterparties to perform; (35) discrepancies between actual claims experience and assumptions used in setting prices for MetLife's products and establishing the liabilities for MetLife's obligations for future policy benefits and claims; (36) catastrophe losses; (37) heightened competition, including with respect to pricing, entry of new competitors, consolidation of distributors, the development of new products by new and existing competitors, distribution of amounts available under U.S. government programs, and for personnel; (38) unanticipated changes in industry trends; (39) changes in accounting standards, practices and/or policies; (40) changes in assumptions related to deferred policy acquisition costs ("DAC"), deferred sales inducements ("DSI"), value of business acquired ("VOBA") or goodwill; (41) increased expenses relating to pension and postretirement benefit plans, as well as health care and other employee benefits; (42) exposure to losses related to variable annuity guarantee benefits, including from significant and sustained downturns or extreme volatility in equity markets, reduced interest rates, unanticipated policyholder behavior, mortality or longevity, and the adjustment for nonperformance risk; (43) deterioration in the experience of the "closed block" established in connection with the reorganization of Metropolitan Life Insurance Company; (44) adverse results or other consequences from litigation, arbitration or regulatory investigations; (45) discrepancies between actual experience and assumptions used in establishing liabilities related to other contingencies or obligations; (46) regulatory, legislative or tax changes relating to MetLife's insurance, banking, international, or other operations that may affect the cost of, or demand for, MetLife's products or services, impair its ability to attract and retain talented and experienced management and other employees, or increase the cost or administrative burdens of providing benefits to employees; (47) the effects of business disruption or economic contraction due to terrorism, other hostilities, or natural catastrophes; (48) the effectiveness of MetLife's programs and practices in avoiding giving its associates incentives to take excessive risks; (49) other risks and uncertainties described from time to time in MetLife, Inc.'s filings with the SEC; and (50) any of the foregoing factors as they relate to the Alico Business and its operations. MetLife, Inc. does not undertake any obligation to publicly correct or update any forward-looking statement if MetLife, Inc. later becomes aware that such statement is not likely to be achieved. Please consult any further disclosures MetLife, Inc. makes on related subjects in reports to the SEC. |
| Explanatory Note on Non-GAAP Financial Information Managed Assets (as defined below) is a financial measure based on methodologies other than GAAP. MetLife, Inc. utilizes "Managed Assets" to describe assets in its investment portfolio which are actively managed and available-for-sale. MetLife, Inc. believes the use of Managed Assets enhances the understanding and comparability of its investment portfolio by excluding assets such as policy loans, other invested assets, mortgages held-for-sale, and mortgage loans held by consolidated securitization entities, as substantially all of those assets are not actively managed in MetLife, Inc.'s investment portfolio. Trading securities are also excluded, as these securities are not classified as available-for-sale. Mortgage loans and certain real estate investments have also been adjusted from carrying value to estimated fair value. Additional information about MetLife's investments is available in MetLife, Inc.'s Quarterly Financial Supplement, which may be accessed through MetLife's Investor Relations Web page at http://investor.metlife.com and MetLife's Quarterly Report on Form 10-Q. Non-GAAP measures, such as Managed Assets, should not be viewed as substitutes for the most directly comparable GAAP measures. |
| Well Positioned Post-Crisis Identified weaknesses in certain asset sectors early and took action Repositioned portfolio for recession beginning in 2007 Sold Real Estate at the top of the market |
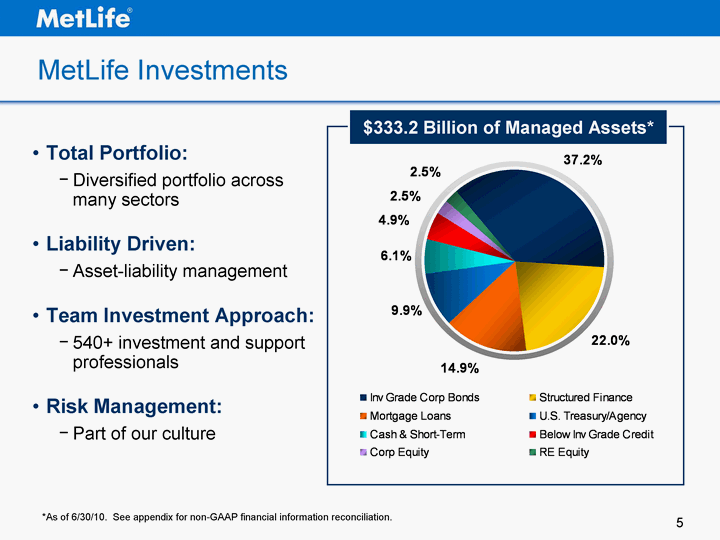
| MetLife Investments Total Portfolio: Diversified portfolio across many sectors Liability Driven: Asset-liability management Team Investment Approach: 540+ investment and support professionals Risk Management: Part of our culture $333.2 Billion of Managed Assets* Inv Grade Corp Bonds Structured Finance Mortgage Loans U.S. Treasury/Agency Cash & Short-Term Below Inv Grade Credit Corp Equity RE Equity East 37.2 22 14.9 9.9 6.1 4.9 2.5 2.5 *As of 6/30/10. See appendix for non-GAAP financial information reconciliation. |
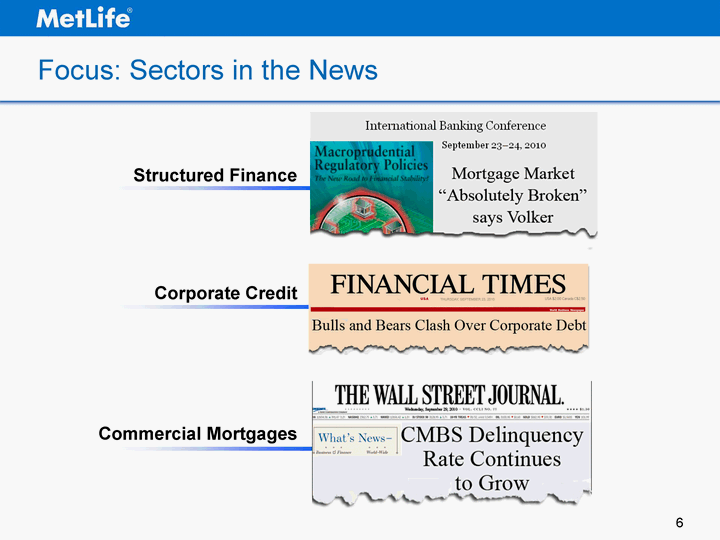
| Focus: Sectors in the News Commercial Mortgages Corporate Credit Structured Finance |
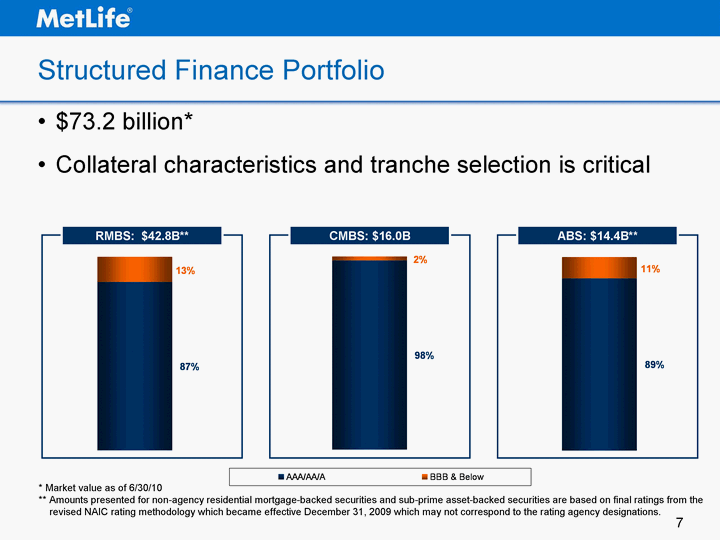
| AAA/AA/A BBB & Below column 0.89 0.11 AAA/AA/A BBB& Below column 0.98 0.02 AAA/AA/A BBB & Below column 0.87 0.13 Structured Finance Portfolio $73.2 billion* Collateral characteristics and tranche selection is critical CMBS: $16.0B ABS: $14.4B** RMBS: $42.8B** * Market value as of 6/30/10 ** Amounts presented for non-agency residential mortgage-backed securities and sub-prime asset-backed securities are based on final ratings from the revised NAIC rating methodology which became effective December 31, 2009 which may not correspond to the rating agency designations. AAA/AA/A BBB & Below |
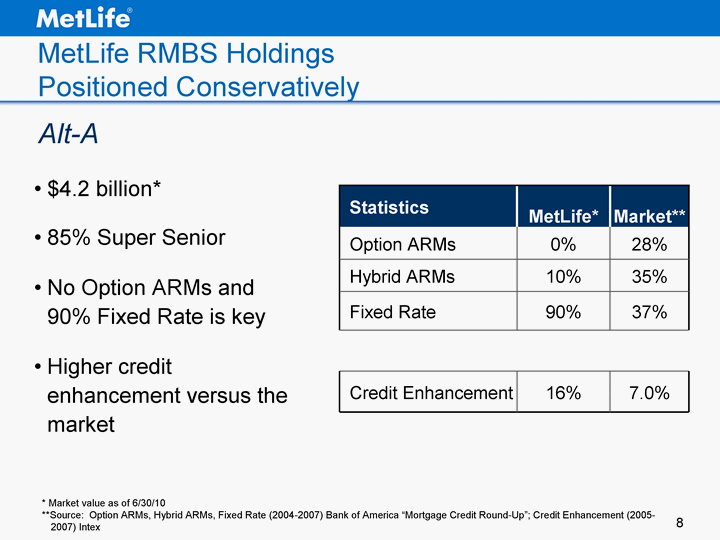
| MetLife RMBS Holdings Positioned Conservatively $4.2 billion* 85% Super Senior No Option ARMs and 90% Fixed Rate is key Higher credit enhancement versus the market Alt-A * Market value as of 6/30/10 **Source: Option ARMs, Hybrid ARMs, Fixed Rate (2004-2007) Bank of America "Mortgage Credit Round-Up"; Credit Enhancement (2005- 2007) Intex Statistics MetLife* Market** Option ARMs 0% 28% Hybrid ARMs 10% 35% Fixed Rate 90% 37% Credit Enhancement 16% 7.0% |
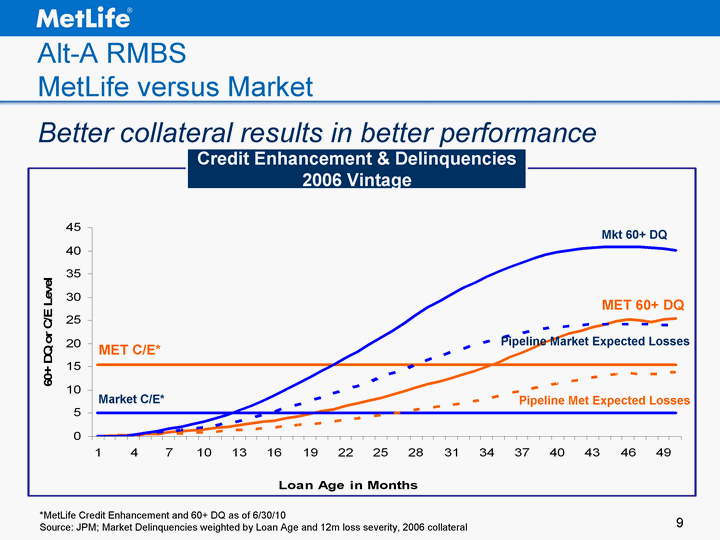
| Alt-A RMBS MetLife versus Market Better collateral results in better performance *MetLife Credit Enhancement and 60+ DQ as of 6/30/10 Source: JPM; Market Delinquencies weighted by Loan Age and 12m loss severity, 2006 collateral Credit Enhancement & Delinquencies 2006 Vintage MET C/E* Market C/E* MET 60+ DQ Mkt 60+ DQ Pipeline Met Expected Losses Pipeline Market Expected Losses |
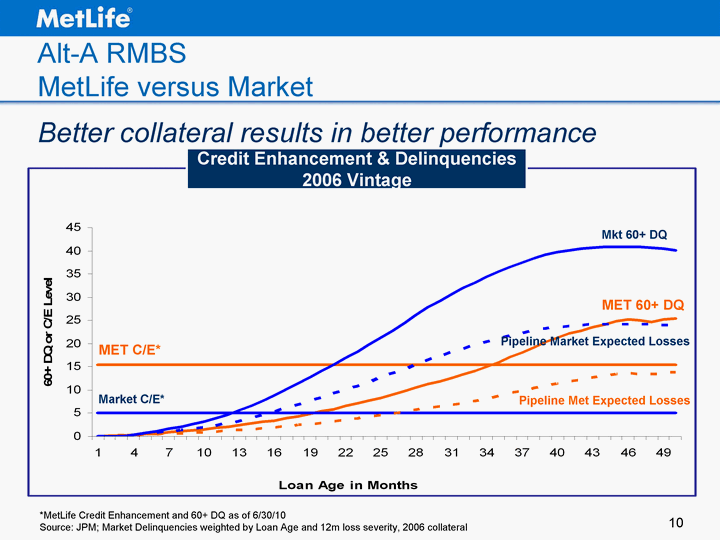
| Alt-A RMBS MetLife versus Market Better collateral results in better performance *MetLife Credit Enhancement and 60+ DQ as of 6/30/10 Source: JPM; Market Delinquencies weighted by Loan Age and 12m loss severity, 2006 collateral Credit Enhancement & Delinquencies 2006 Vintage MET C/E* Market C/E* MET 60+ DQ Mkt 60+ DQ Pipeline Met Expected Losses Pipeline Market Expected Losses |
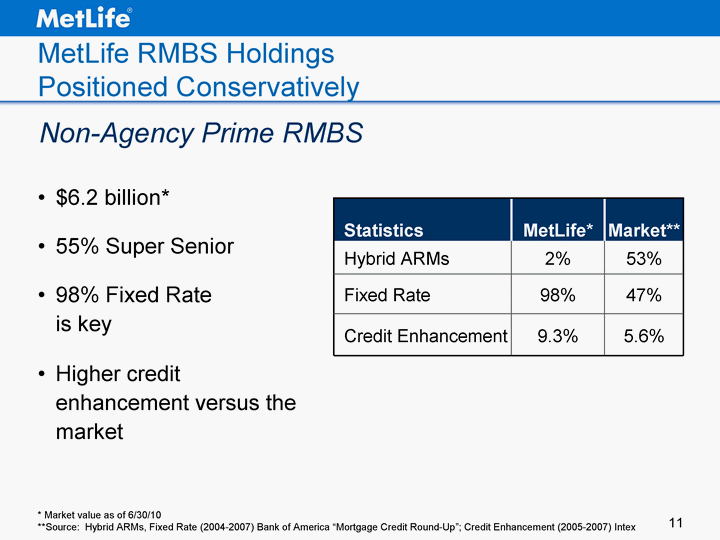
| MetLife RMBS Holdings Positioned Conservatively $6.2 billion* 55% Super Senior 98% Fixed Rate is key Higher credit enhancement versus the market * Market value as of 6/30/10 **Source: Hybrid ARMs, Fixed Rate (2004-2007) Bank of America "Mortgage Credit Round-Up"; Credit Enhancement (2005-2007) Intex Statistics MetLife* Market** Hybrid ARMs 2% 53% Fixed Rate 98% 47% Credit Enhancement 9.3% 5.6% Non-Agency Prime RMBS |
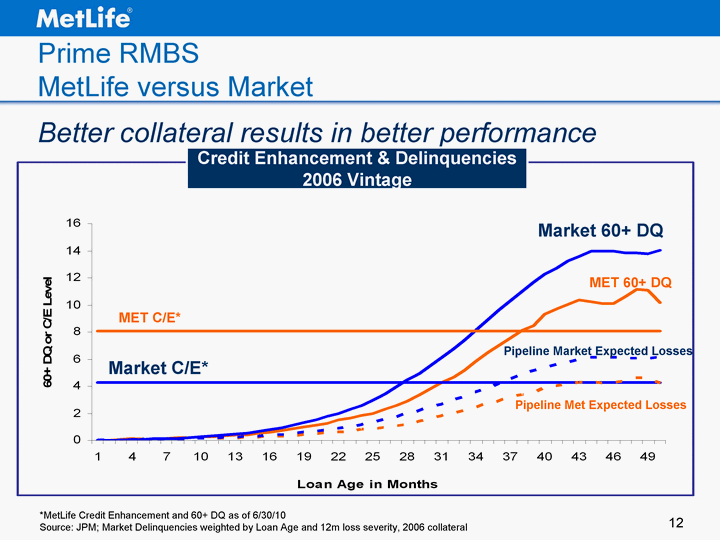
| Prime RMBS MetLife versus Market Better collateral results in better performance *MetLife Credit Enhancement and 60+ DQ as of 6/30/10 Source: JPM; Market Delinquencies weighted by Loan Age and 12m loss severity, 2006 collateral Credit Enhancement & Delinquencies 2006 Vintage MET C/E* Market C/E* MET 60+ DQ Market 60+ DQ Pipeline Met Expected Losses Pipeline Market Expected Losses |
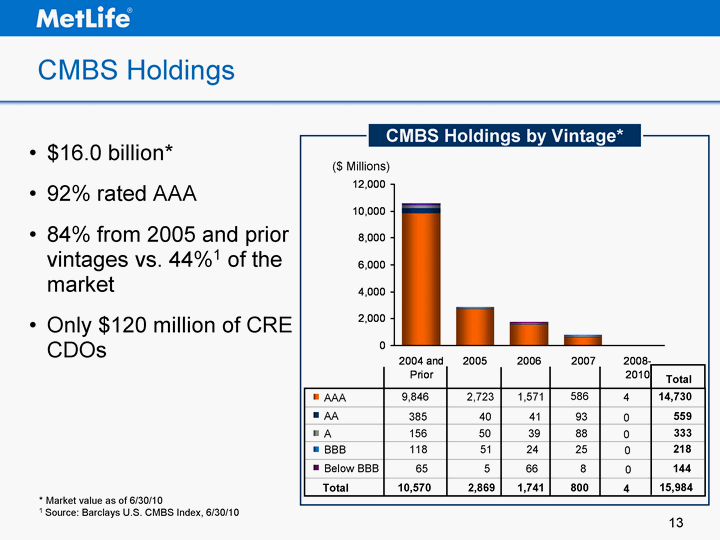
| CMBS Holdings CMBS Holdings by Vintage* Below BBB 65 5 66 8 BBB 118 51 24 25 A 156 50 39 88 AA 385 40 41 93 AAA 9,846 2,723 1,571 586 144 218 333 559 14,730 Total Total 10,570 2,869 1,741 800 15,984 2004 and Prior 2005 2006 2007 2008-2010 AAA 9846 2723 1571 586 AA 385 40 41 93 A 156 50 39 88 BBB 118 51 24 25 Below BBB 65 5 66 8 ($ Millions) $16.0 billion* 92% rated AAA 84% from 2005 and prior vintages vs. 44%1 of the market Only $120 million of CRE CDOs * Market value as of 6/30/10 1 Source: Barclays U.S. CMBS Index, 6/30/10 0 0 0 0 4 4 |

| CMBS MetLife versus Market Better collateral results in better performance *MetLife 60+ DQ as of 6/30/10 Source: JPM; Market Delinquencies weighted by Loan Age and 12m loss severity, 2006 collateral Credit Delinquencies 10/10/2009 11/9/2009 12/9/2009 1/10/2010 2/10/2010 3/10/2010 4/10/2010 5/10/2010 6/10/2010 7/10/2010 8/10/2010 9/10/2010 Mkt 0.0406 0.0457 0.0513 0.0557 0.0594 0.0616 0.0675 0.0649 0.073 0.0786 0.0806 0.0837 Met 0.0357 0.0404 0.0454 0.0486 0.0512 0.0512 0.0544 0.054 0.0574 0.053 0.0594 0.0621 North 45.9 46.9 45 43.9 MET 60+DQ Market 60+ DQ 60+DQ |
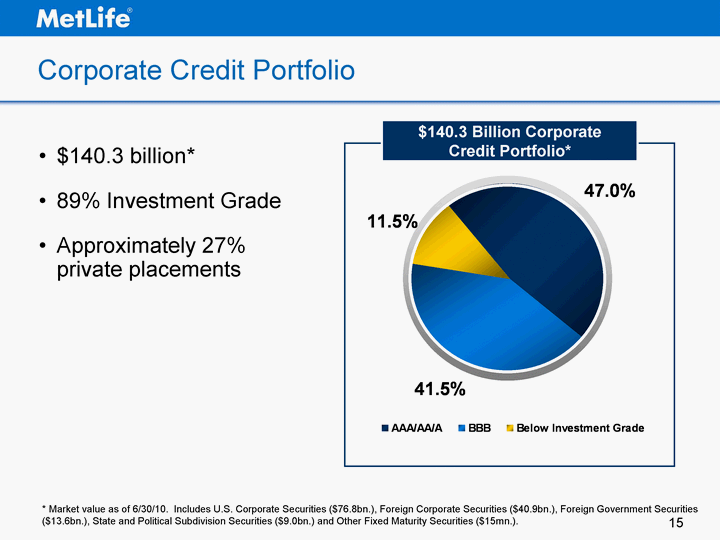
| Corporate Credit Portfolio AAA/AA/A BBB Below Investment Grade East 0.47 0.415 0.115 $140.3 Billion Corporate Credit Portfolio* $140.3 billion* 89% Investment Grade Approximately 27% private placements * Market value as of 6/30/10. Includes U.S. Corporate Securities ($76.8bn.), Foreign Corporate Securities ($40.9bn.), Foreign Government Securities ($13.6bn.), State and Political Subdivision Securities ($9.0bn.) and Other Fixed Maturity Securities ($15mn.). |
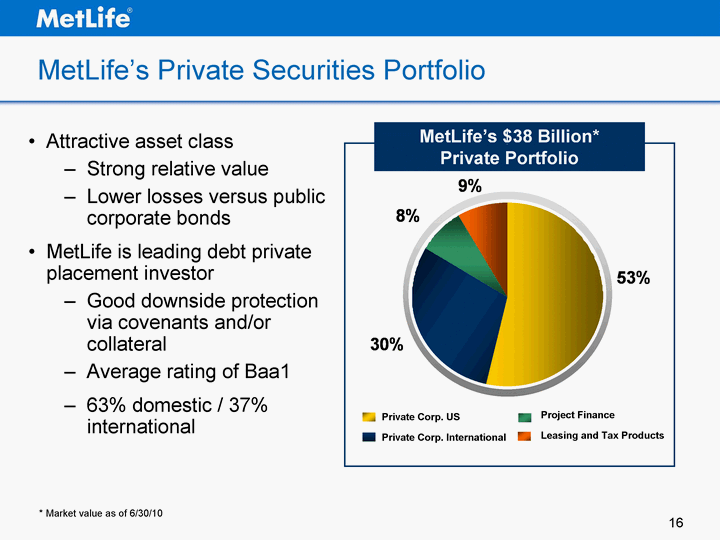
| Adequately Positioned Private Corp. US 21 Private Corp. Non-US 11.5 Project Finance 3 Leasing and Tax Products 3.4 MetLife's Private Securities Portfolio Attractive asset class Strong relative value Lower losses versus public corporate bonds MetLife is leading debt private placement investor Good downside protection via covenants and/or collateral Average rating of Baa1 63% domestic / 37% international Private Corp. US Private Corp. International MetLife's $38 Billion* Private Portfolio Project Finance Leasing and Tax Products * Market value as of 6/30/10 |
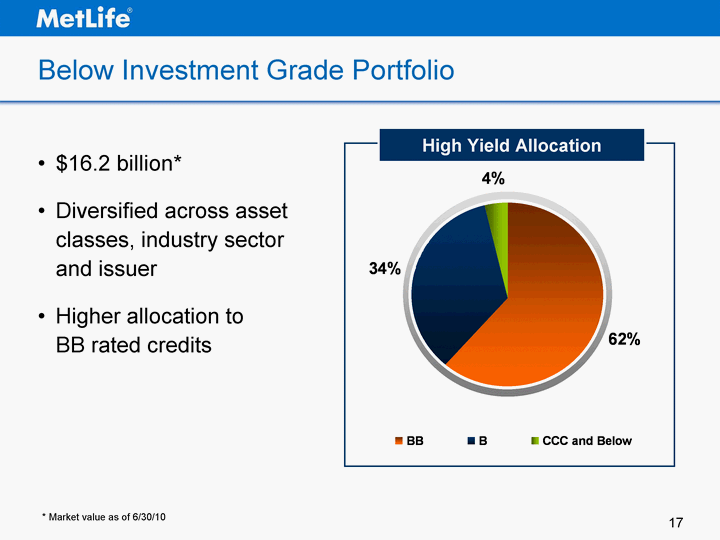
| Below Investment Grade Portfolio $16.2 billion* Diversified across asset classes, industry sector and issuer Higher allocation to BB rated credits * Market value as of 6/30/10 BB B CCC and Below Other East 0.62 0.34 0.04 145 High Yield Allocation |
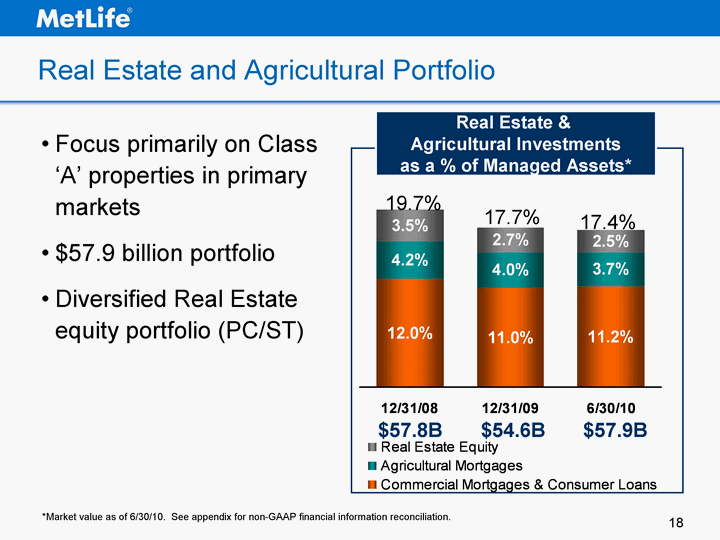
| Real Estate and Agricultural Portfolio 12/31/2008 12/31/2009 6/30/2010 Commercial Mortgages & Consumer Loans 0.12 0.11 0.112 Agricultural Mortgages 0.042 0.0395 0.037 Real Estate Equity 0.035 0.027 0.0249 Real Estate & Agricultural Investments as a % of Managed Assets* $57.8B $57.9B 17.4% 19.7% Focus primarily on Class 'A' properties in primary markets $57.9 billion portfolio Diversified Real Estate equity portfolio (PC/ST) 17.7% $54.6B *Market value as of 6/30/10. See appendix for non-GAAP financial information reconciliation. |
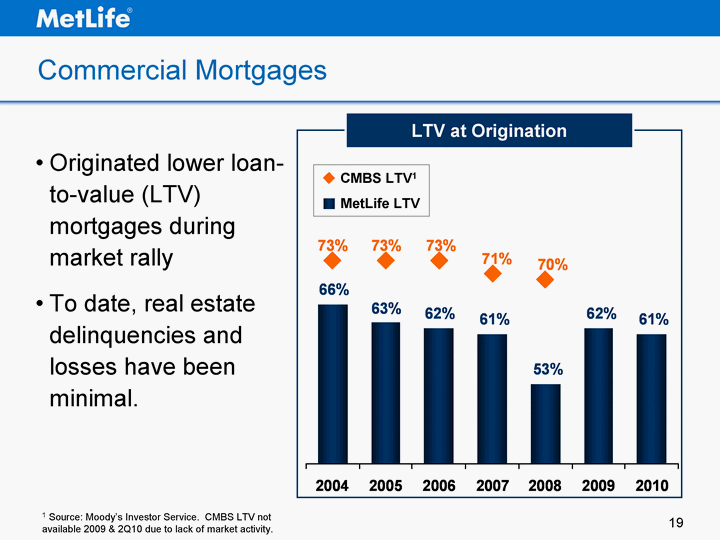
| Commercial Mortgages Originated lower loan- to-value (LTV) mortgages during market rally To date, real estate delinquencies and losses have been minimal. LTV at Origination 2001 2002 2003 2004 2005 2006 2007 2008 2009 2010 MetLife LTV 0.69 0.69 0.65 0.66 0.63 0.62 0.61 0.53 0.62 0.61 Moodys LTV 0.72 0.73 0.73 0.73 0.71 0.699 CMBS LTV1 MetLife LTV 1 Source: Moody's Investor Service. CMBS LTV not available 2009 & 2Q10 due to lack of market activity. |
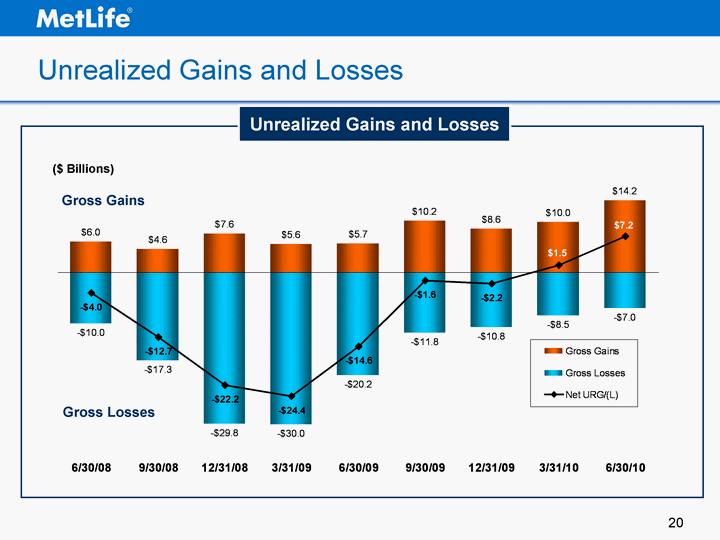
| Unrealized Gains and Losses URL 6/30/2008 9/30/2008 12/31/2008 3/31/2009 6/30/2009 9/30/2009 12/31/2009 3/31/2010 6/30/2010 Loss -10017 -17315 -29799 -29959 -20234 -11838 -10761 -8499 Gross Gains 6021 4570 7608 5594 5669 10228 8591 9965 14212 Net URG/(L) -3996 -12745 -22191 -24365 -14565 -1610 -2170 1466 7200 Loss -10017 -17315 -29799 -29959 -20234 -11838 -10761 -8499 Gross Losses -10017 -17315 -29799 -29959 -20234 -11838 -10761 -8499 -6956 Equity -746 -638 -978 -1202 -721 -398 -275 -247 ($ Billions) Gross Gains Gross Losses Unrealized Gains and Losses |
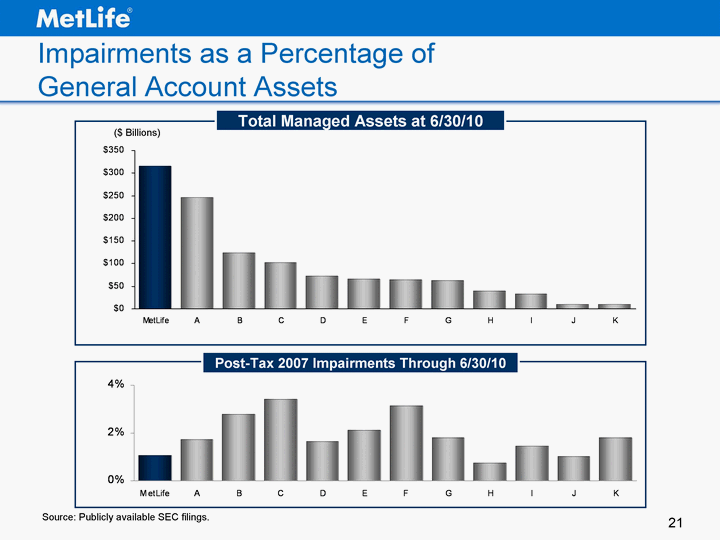
| Impairments as a Percentage of General Account Assets Source: Publicly available SEC filings. ($ Billions) Total Managed Assets at 6/30/10 Post-Tax 2007 Impairments Through 6/30/10 |
| Positioned to Win Broad capabilities / deep expertise Proven track record Risk management culture Dedicated General Account focus |
| Appendix |

| 24 Reconciliation of Total Investments to Managed Assets Managed Assets (as defined below) is a financial measure based on methodologies other than GAAP. MetLife, Inc. utilizes "Managed Assets" to describe assets in its investment portfolio which are actively managed and available-for-sale. MetLife, Inc. believes the use of Managed Assets enhances the understanding and comparability of its investment portfolio by excluding assets such as policy loans, other invested assets, mortgages held-for-sale, and mortgage loans held by consolidated securitization entities, as substantially all of those assets are not actively managed in MetLife, Inc.'s investment portfolio. Trading securities are also excluded, as these securities are not classified as available-for-sale. Mortgage loans and certain real estate investments have also been adjusted from carrying value to estimated fair value. A reconciliation of Managed Assets to Total Investments is included above. Additional information about MetLife's investments is available in MetLife, Inc.'s Quarterly Financial Supplement, which may be accessed through MetLife's Investor Relations Web page at http://investor.metlife.com and MetLife's Quarterly Report on Form 10-Q. Non-GAAP measures, such as Managed Assets, should not be viewed as substitutes for the most directly comparable GAAP measures. |

| Questions ? |
