Attached files
| file | filename |
|---|---|
| 8-K - CURRENT REPORT - OMNOVA SOLUTIONS INC | d8k.htm |
 Deutsche Bank’s 2010 Leveraged Finance Conference
October 6-7, 2010
Exhibit 99 |
 2
Forward-Looking Statements
Cautionary
Cautionary
Non-GAAP Financial Measures
•
This presentation and the accompanying oral remarks include “forward-looking statements”
as defined by federal securities laws. These statements, as well as any verbal statements
by the Company in connection with this presentation, are intended to qualify for the protections afforded forward-looking statements
under the Private Securities Litigation Reform Act of 1995. Forward-looking statements reflect
management’s current expectation, judgment, belief, assumption, estimate or forecast about
future events, circumstances or results and may address business conditions and prospects, strategy, capital structure, sales, profits,
earnings, markets, products, technology, operations, customers, raw materials, financial condition, and
accounting policies, among other matters. Words such as, but not limited to,
“will,” “may,” “should,” “projects,” “forecasts,” “seeks,” “believes,” “expects,” “anticipates,” “estimates,” “intends,” “plans,”
“targets,” “optimistic,” “likely,” “would,”
“could,” and similar expressions or phrases identify forward-looking statements.
•
All forward-looking statements involve risks and uncertainties. Many risks and uncertainties
are inherent in business generally and the markets in which the Company operates. Other
risks and uncertainties are more specific to the Company’s businesses, including businesses that the Company acquires. The
occurrence of such risks and uncertainties and the impact is often not predictable or within the
Company’s control. Any such occurrence could adversely affect the Company’s
results and, in some cases, such effect could be material.
•
All statements and data in this presentation and the accompanying oral remarks on a “pro
forma,” “post-acquisition” or “combined” basis assume that the
Company’s proposed acquisition of Eliokem is successfully completed on the proposed terms. Results
of operations for Eliokem for the last twelve months ended August 31, 2010, as well as the pro
forma results for the same period, have been derived from unaudited information provided by Eliokem. These results
are currently being reviewed by their independent auditor and therefore could change, perhaps
materially. •
All written and verbal forward-looking statements attributable to the Company or any person acting
on the Company’s behalf are expressly qualified in their entirety by the risk factors and
any cautionary statements contain herein. Any forward-looking statement speaks only as of the date on which such statement is
made, and the Company undertakes no obligation, and specifically declines any obligation, other than
that imposed by law to publicly update or revise any forward-looking statements whether as a
result of new information, future events or otherwise.
•
Risk factors and uncertainties that may cause actual results to differ materially from expected results
include, among others: the Company’s ability to successfully complete the acquisition of
Eliokem; the Company’s ability to successfully integrate Eliokem into its operations; the Company’s ability to achieve
fully the strategic and financial objectives related to the proposed acquisition of Eliokem, including
the acquisition being accretive to the Company’s earnings; and unexpected costs or
liabilities that may arise from the acquisition ownership, or operation of Eliokem; economic trends affecting the economy in general
and/or the Company’s end use markets; prices and availability of raw materials including styrene,
butadiene, vinyl acetate monomer, polyvinyl chloride, acrylics and textiles; ability to increase
pricing to offset raw material cost increases; product substitution and/or demand destruction due to product technology,
performance or cost disadvantages; loss of a significant customer; customer and/or competitor
consolidation; customer bankruptcy; ability to successfully develop and commercialize new
products; a decrease in demand for domestically manufactured products due to increased foreign competition and off-shoring of
production; ability to successfully implement productivity enhancement and cost reduction initiatives;
unexpected full or partial suspension of plant operations; the Company’s strategic alliance,
joint venture and acquisition activities; loss or damage due to acts of war or terrorism, natural disasters, accidents, including
fires, floods, explosions and releases of hazardous substances; stock price volatility; governmental
legislative and regulatory changes, including changes impacting environmental compliance, pension
plans, products and raw materials; compliance with extensive environmental, health and safety laws and
regulations; rapid inflation in health care costs and assumptions used in determining health care cost
estimates; risks associated with foreign operations including political unrest and fluctuations
in exchange rates of foreign currencies; prolonged work stoppage resulting from labor disputes with unionized
workforce; meeting required pension plan funding obligations; infringement or loss of the Company’s
intellectual property; litigation and claims against the Company related to products, services,
contracts, employment, environmental, safety, intellectual property and other matters arising out of the Company’s
business and adverse litigation judgments or settlements; absence of or inadequacy of insurance coverage
for litigation, judgments, settlements or other losses; availability of financing to fund
operations at anticipated rates and terms; and loan covenant default arising from substantial debt and leverage and the inability
to service that debt, including increases in applicable short-term borrowing rates.
This presentation includes EBITDA, Adjusted EBITDA and Net Debt which are non-GAAP financial
measures as defined by the Securities and Exchange
Commission. |
 3
OMNOVA management
OMNOVA management
Kevin M. McMullen
Chairman, Chief Executive Officer and President
Michael E. Hicks
Senior Vice President and Chief Financial Officer
James C. LeMay
Senior Vice President, Business Development, General Counsel
Chester W. Fox
Vice President, Treasurer |
 4
OMNOVA overview |
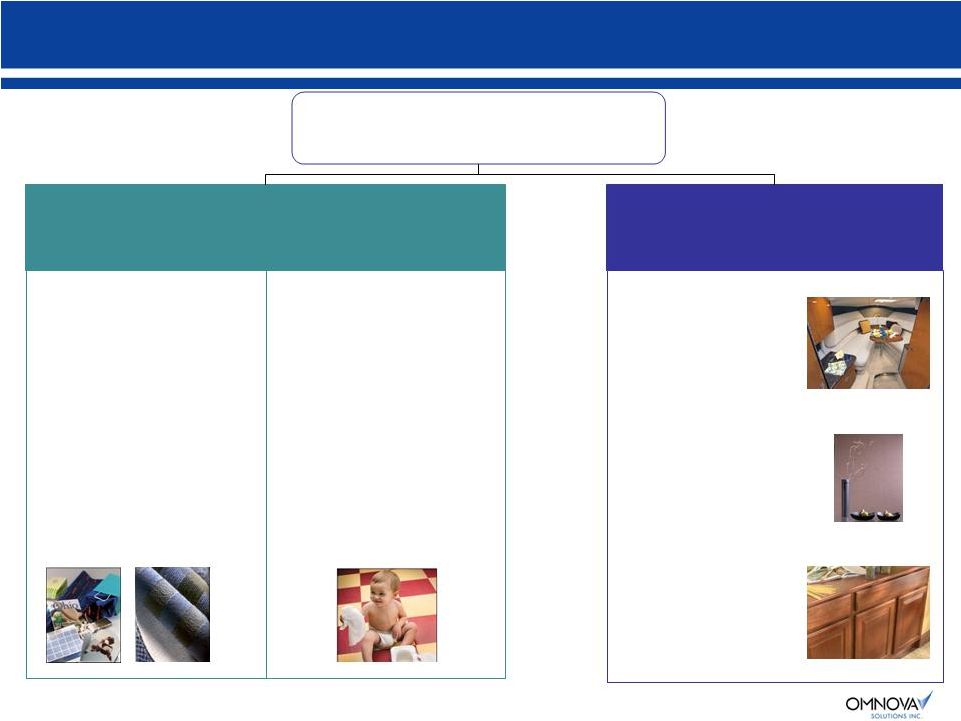 OMNOVA
at a glance OMNOVA at a glance
LTM Sales
$827
LTM Adj. EBITDA*
$78
EBITDA Margin
9%
Decorative Products
Performance Chemicals
LTM Sales
$507
LTM Adj. EBITDA*
$71
EBITDA Margin
14%
($ Millions)
Paper and Carpet Chemicals
Specialty Chemicals
LTM Sales: $319
LTM Sales: $188
Products:
•
Styrene Butadiene / Styrene
Butadiene acrylonitrile
(SB/SBA)
End markets
•
Magazines, brochures
•
Catalogs
•
Packaging, paperboard
•
Labels, specialty papers
•
Residential and commercial
carpet backing
Products:
•
SB and SBA
•
Acrylics and vinyl acetate
End markets
•
Nonwovens-consumable
and durable
•
Construction
•
Tapes and release
•
Floor polish
•
Textiles
•
Oil/gas drilling
Coated
Fabrics
Products
•
Vinyl and urethane fabrics
•
Performance fabrics
End market
•
Transportation
•
Marine
•
Health Care
Laminates & Films
Products
•
Vinyl, paper and acrylic
laminates
•
Performance films
End market
•
Kitchen & bath cabinets
•
RV/manufactured housing
•
Furniture & furnishings
Commercial Wallcovering
Products
•
Vinyl wallcoverings
•
Dry erasable surfaces
•
Customized wall murals
End market
•
Corporate
•
Hospitality
•
Health Care
LTM Sales
$320
LTM Adj. EBITDA*
$19
EBITDA Margin
6%
LTM: Last Twelve Months Through August 31, 2010
* Adjusted EBITDA -
see Appendices 1, 2, and 3
5 |
 6
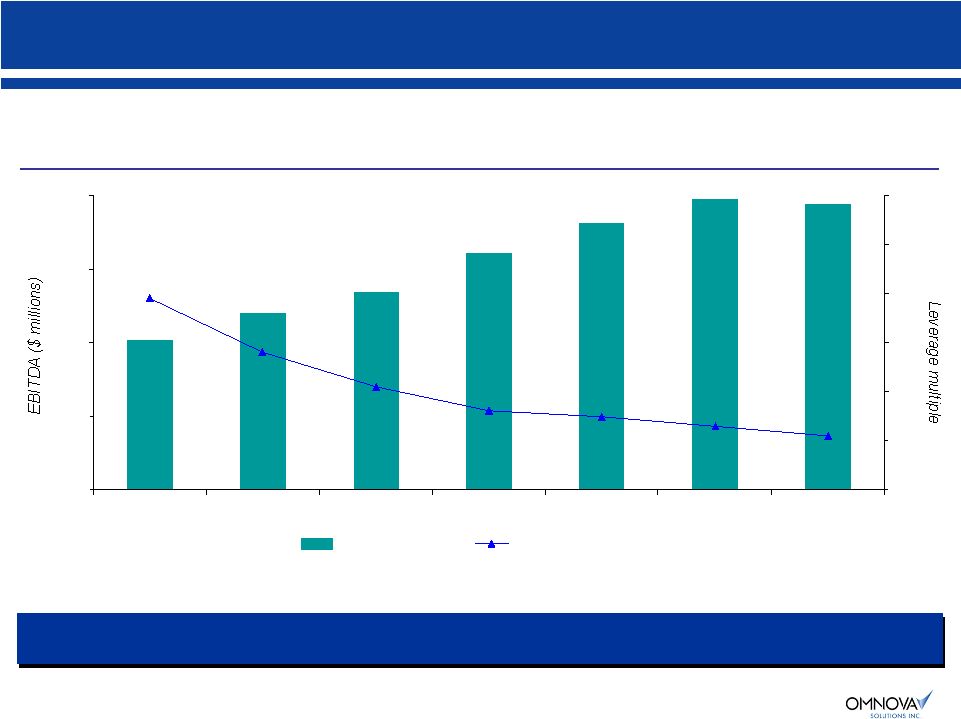
Fundamental business improvements drive strong earnings and
deleveraging
Fundamental business improvements drive strong earnings and
deleveraging
Strongest balance sheet since spin-off in 1999
Strongest balance sheet since spin-off in 1999
OMNOVA Solutions –
Adjusted EBITDA* and Leverage
$41
$54
$64
$72
$79
$78
$48
1.3x
1.1x
2.1x
2.8x
3.9x
1.5x
1.6x
$0
$20
$40
$60
$80
Q1 09
Q2 09
Q3 09
Q4 09
Q1 10
Q2 10
Q3 10
0.0x
1.0x
2.0x
3.0x
4.0x
5.0x
6.0x
LTM Adj. EBITDA*
Net debt / LTM Adj. EBITDA
*
LTM: Last Twelve Months Through August 31, 2010
* Adjusted EBITDA and Net Debt - see Appendix 4 |
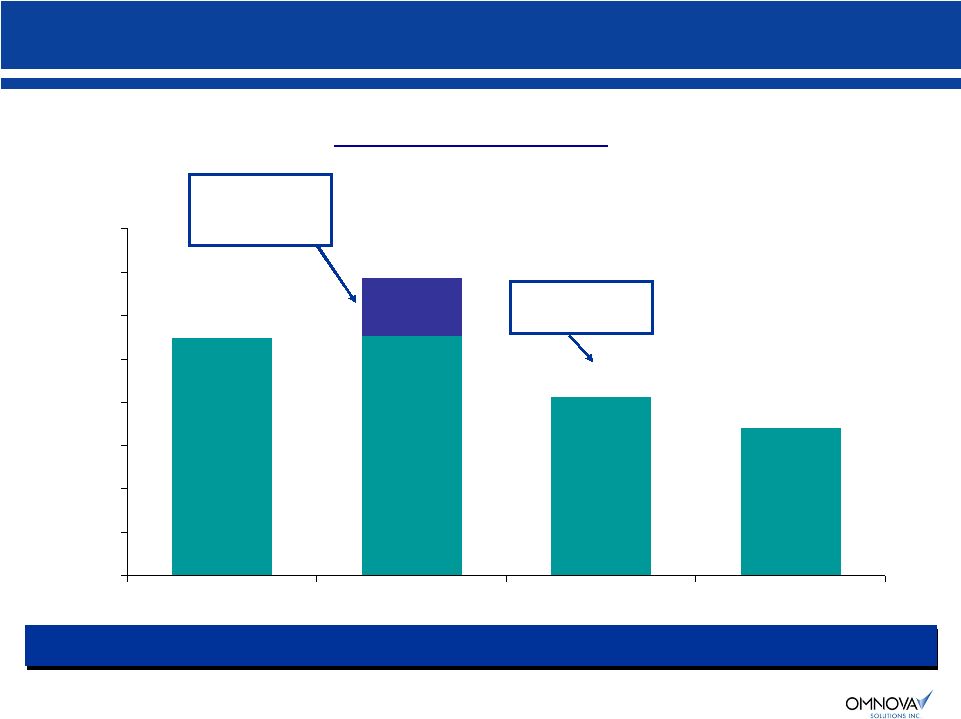 7
$33
$0
$25
$50
$75
$100
$125
$150
$175
$200
2007
2008
2009
2010 3Q
Net Debt Outstanding*
Significant Debt Reduction Along With Strong Earnings Improvement
Significant Debt Reduction Along With Strong Earnings Improvement
* Reconciliation
of
Total
Debt
to
Net
Debt
-
see
Appendix 4
$137
$171
$103
$33M
Asian Ops
Purchase
Net Debt / Net Income
Net Debt / Net Income
$85
-$68M in
2009
($ Millions)
$138 |
 8
Fundamental, structural change in the OMNOVA business model
Fundamental, structural change in the OMNOVA business model
Business model changes, productivity and new products driving record financial
success Business model changes, productivity and new products driving record
financial success •
Introduced extensive, industry-leading new products with adjacent
market penetration
•
Rapid industry consolidation
–
6 Competitor chemical plants closed in 2008 . . . major competitor sold
–
Exit
of
7
decorative
product
competitors
over
last
5
years
.
.
.
more
likely
•
Implemented index pricing in Performance Chemicals
–
Significant margin improvement
–
Reduced earnings volatility
–
Successful in recent recessionary environment
•
Executed successful Asian Decorative Products turnaround
–
Purchased JV interest in 2008
–
New management
•
Productivity / cost reductions —
lowest cost structure since 1999 spin-
off and NOL’s
provide significant leverage for cash generation
–
$24+
million
cost
savings
in
2009
alone
including
$17
million
of
fixed
costs
–
$132 million of NOL’s
from prior goodwill write-down |
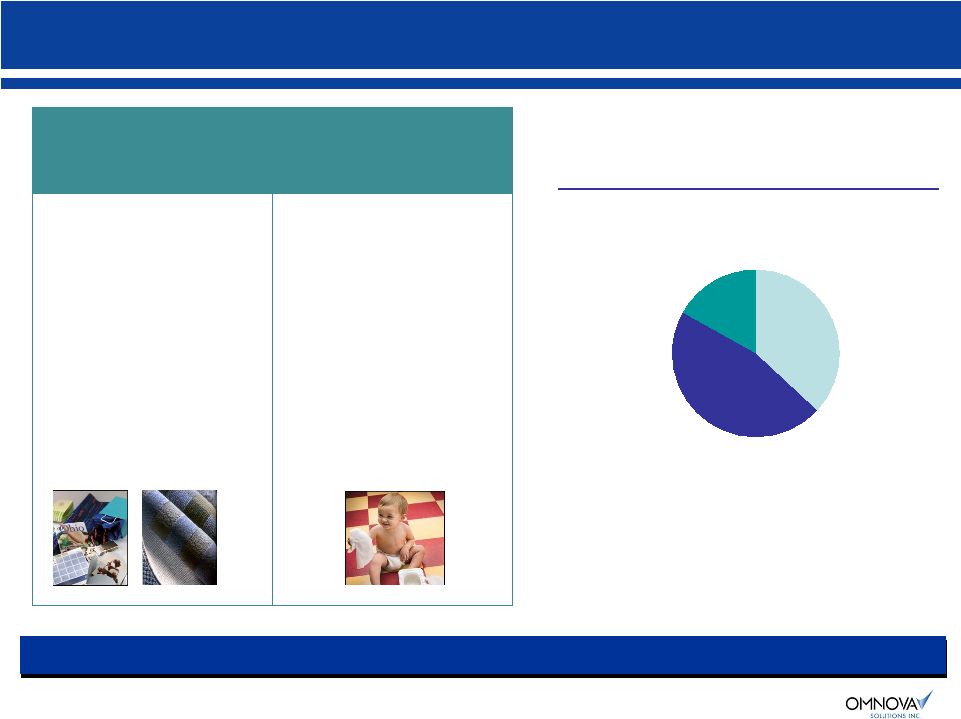 9
Performance Chemicals –
segment overview
Performance Chemicals –
segment overview
Paper
Chemicals
46%
Carpet
Chemicals
17%
Specialty
Chemicals
37%
Performance Chemicals sales breakdown
A specialty chemicals business focused on technical service and innovation
A specialty chemicals business focused on technical service and innovation
Performance Chemicals
LTM Sales
$507
LTM Adj. EBITDA*
$71
EBITDA Margin
14%
Paper and Carpet Chemicals
Specialty Chemicals
LTM Sales: $319
LTM Sales: $188
Products:
•
Styrene Butadiene / Styrene
Butadiene acrylonitrile
(SB/SBA)
End markets
•
Magazines, brochures
•
Catalogs
•
Packaging, paperboard
•
Labels, specialty papers
•
Residential and commercial
carpet backing
Products:
•
SB and SBA
•
Acrylics and vinyl acetate
End markets
•
Nonwovens-consumable
and durable
•
Construction
•
Tapes and release
•
Floor polish
•
Textiles
•
Oil/gas drilling
($ Millions)
LTM: Last Twelve Months Through August 31, 2010
* Adjusted EBITDA - see Appendix 2 |
 10
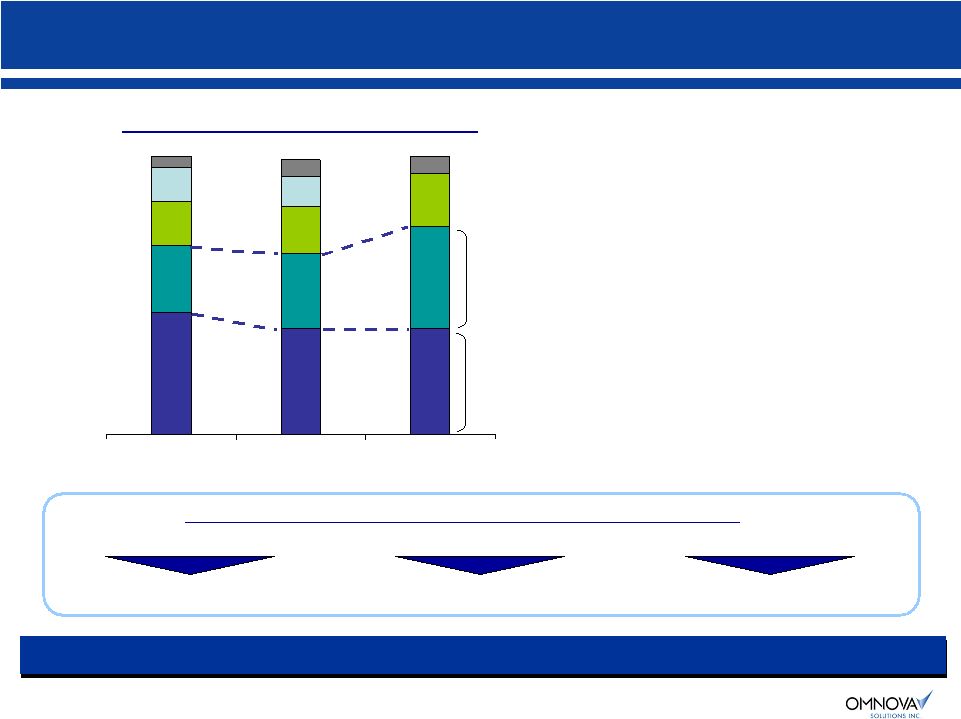
Leading SB latex producer in disciplined N. American industry
Leading SB latex producer in disciplined N. American industry
OMNOVA
BASF
Reichhold
2002
2005
2010
SB Latex N. American Volumes
’02-’10
OMNOVA
+13 pts.
Others
Dow/
Styron
Source: OMNOVA
~ 30%
of
North
American
Capacity
Shut
Down
in
2008
Dow-Reichhold
Exit
Dow / Styron Closures
Lubrizol Exit
Closed 2 Plants
Closed 1 Plant
4 Plants (3 in N.A.)
Dow / Styron
recently
sold to
Bain Capital
4%
12%
16%
24%
44%
Differentiated
product
•
Highly customizable with high
switching cost
•
Low risk of Asian imports due to high
shipping cost
•
60-70% contracted with raw material
price escalations
•
OMNOVA manufacturing strategically
located to serve core markets
OMNOVA growing leadership position in consolidating SB latex industry
OMNOVA growing leadership position in consolidating SB latex industry
|
 11
0.0
0.2
0.4
0.6
0.8
1.0
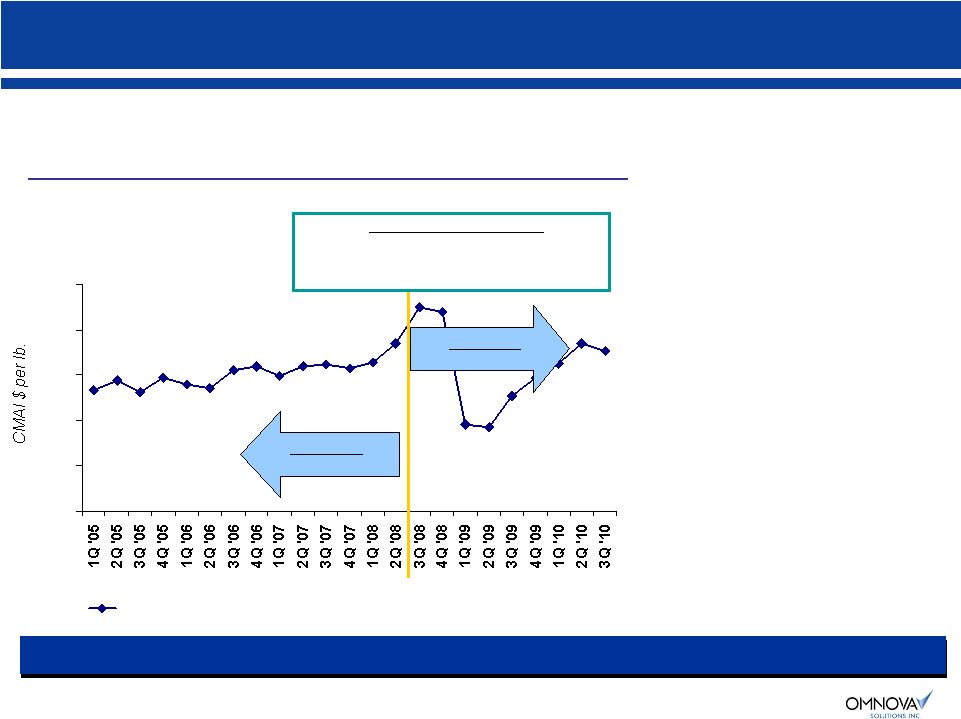
Styrene/Butadiene Weighted Avg Cost Per Lb. of Latex
Sustainable improvement in margins despite raw material volatility
Sustainable improvement in margins despite raw material volatility
Quarterly Costs 2005 -
2010
•
Styrene and butadiene make up
most of Performance Chemicals’
costs
•
Raw material swings can be
volatile
•
3Q 2008: Renegotiated index
pricing created better match to
styrene and butadiene purchases
•
Robust business model –
strong
margins despite:
-
3Q 2008: Highest raw
material costs ever
-
2Q 2009: Lowest raw
materials in 5 years
-
2009: Lowest volumes since
1999
•
Since 3Q 2008, significantly
improved profitability (level and
consistency)
-
$15 million EBITDA / quarter
average
-
13% EBITDA margin average
$10M Avg
EBITDA* Per Qtr
8% Avg
Margin
$15M Avg
EBITDA* Per Qtr
13% Avg
Margin
Business Model Improvements
•
Renegotiated index pricing
•
Productivity actions
•
Enhanced new product development capabilities
Margins greatly improved since June 2008
Margins greatly improved since June 2008
* EBITDA -
see Appendix 5 |
 12
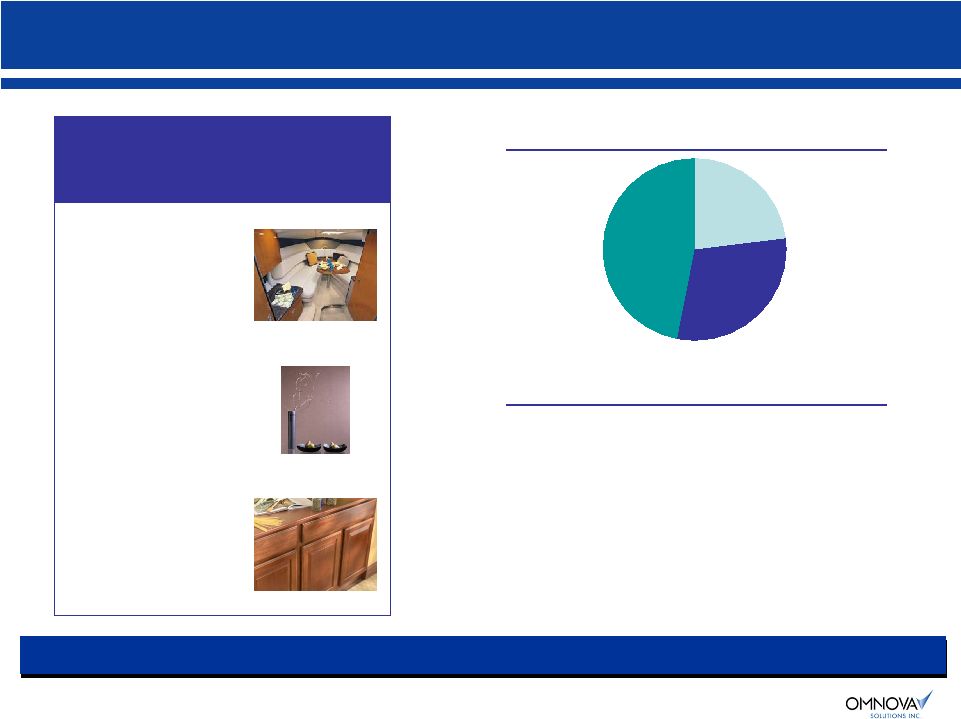
Decorative Products –
segment overview
Decorative Products –
segment overview
Decorative Products sales breakdown
Commerical
Wallcoverings
23%
Coated
Fabrics
47%
Laminates
and Films
30%
Decorative Products
Coated
Fabrics
Products
•
Vinyl and urethane fabrics
•
Performance fabrics
End market
•
Transportation
•
Marine
•
Health Care
Laminates & Films
Products
•
Vinyl, paper and acrylic
laminates
•
Performance films
End market
•
Kitchen & bath cabinets
•
RV/manufactured housing
•
Furniture & furnishings
Commercial Wallcovering
Products
•
Vinyl wallcoverings
•
Dry erasable surfaces
•
Customized wall murals
End market
•
Corporate
•
Hospitality
•
Health Care
LTM Sales
$320
LTM Adj. EBITDA*
$19
EBITDA Margin
6%
A broad-based functional and decorative surfaces business
A broad-based functional and decorative surfaces business
Strategy
•
Profitably serve global customers with
strategically located assets
•
Leveraged scale in a highly fragmented
but consolidating industry
-
Several recent competitor exits
•
New product introductions for existing
and adjacent markets to expand portfolio
•
Gain share from domestic only
competitors
•
Reduce operating costs
($ Millions)
LTM: Last Twelve Months Through August 31, 2010
* Adjusted EBITDA - see Appendix 3
|
 13
Eliokem acquisition |
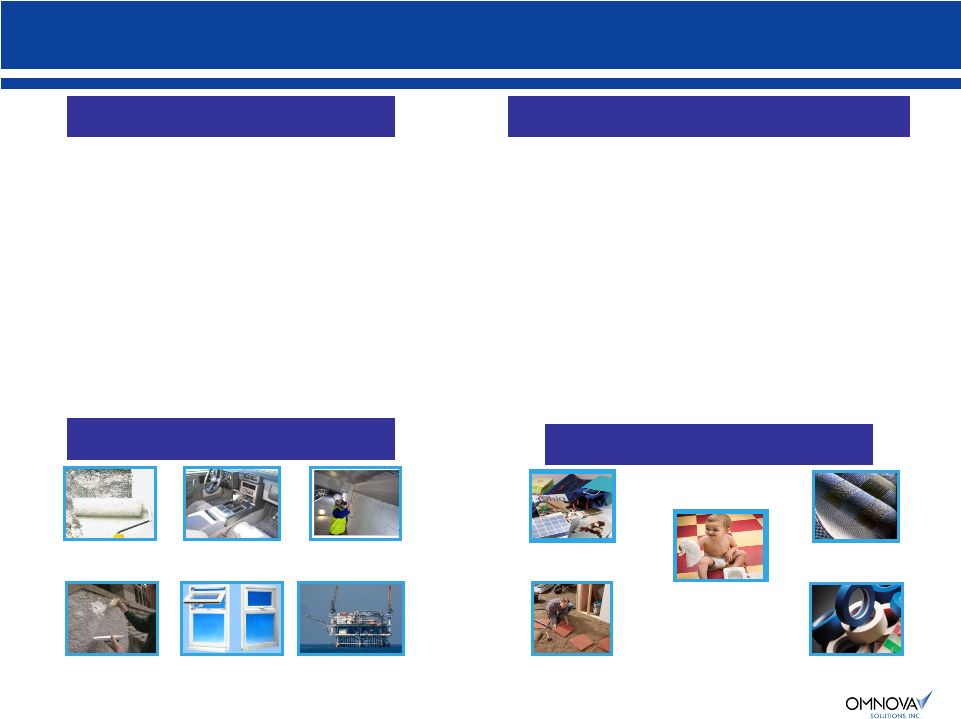 14
Eliokem
Introduction
Eliokem
Introduction
OMNOVA Performance Chemicals
Eliokem
Products
Exterior Masonry
Paint
Intumescent
(Fire
Resistant)
Paint
Stain Blocking
Primers
Oil and Gas
Drilling
ABS Stabilization
Eliokem
•
Strong U.S. presence and growing global position
•
Focused on emulsion polymerization chemistry
•
#1 and #2 market leading positions in targeted segments
•
Strong customer relationships with deep application expertise
•
U.S. manufacturing plus exports and regional tolling alliances
in Europe and Asia
•
~440 employees worldwide
•
Segment headquarters in Fairlawn, Ohio
•
Regional sales teams (direct and distributor) supporting sales
to 60 countries
•
$507 in LTM revenues and $71M in LTM Adj. EBITDA*
Paper
Personal Hygiene;
Floor Care
Carpet
Construction
Tape
•
Global niche specialty chemicals company owned by AXA
Private Equity (formerly Goodyear Specialty Chemical)
•
Focused on emulsion polymerization chemistry
•
#1 and #2 market leading positions in targeted segments
•
Strong customer relationships with deep application expertise
•
Manufacturing footprint in China, India, France and USA
•
~630 employees worldwide
•
Headquarters in Villejust, France
•
Regional sales teams supported by 85 distributors and agents
in 90 countries
•
$277M in LTM revenues and $51M in LTM Adj. EBITDA*
OMNOVA Products
Elastomeric
Modification
LTM: Last Twelve Months Through August 31, 2010
* Adjusted EBITDA - see Appendices 2 and 6
|
 15
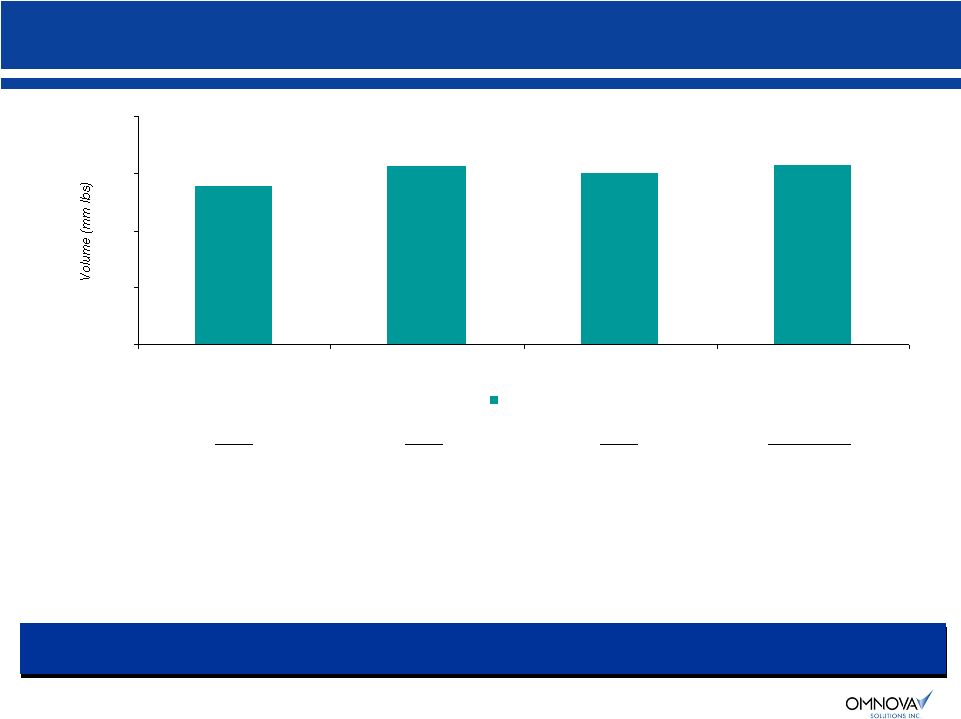
Eliokem
–
resilient performance with upside potential
Eliokem
–
resilient performance with upside potential
2007A
2008A
2009A
LTM (8/31/10)
Volume (mm lbs)
138.8
156.7
150.3
156.8
Sales ($ mm)
$228.1
$289.5
$ 229.5
$276.5
Sales growth
--
26.9%
(20.7%)
--
Adj. EBITDA* ($ mm)
$28.4
$34.5
$35.1
$51.0
EBITDA margin
12.5%
11.9%
15.3%
18.4%
Additional upside from recently completed new Caojing, China plant
(Capacity: 7KT, 15.4 mm lbs), new coatings production line in France
Additional upside from recently completed new Caojing, China plant
(Capacity: 7KT, 15.4 mm lbs), new coatings production line in France
LTM: Last Twelve Months Through August 31, 2010
* Adjusted EBITDA - see Appendix 6
138.8
156.7
150.3
156.8
0
50
100
150
200
2007
2008
2009
LTM (8/31)
Volume |
 16
Acquisition Strategic Rationale
Acquisition Strategic Rationale
1.
Globalization: Manufacturing and sales in China, India and France
•
Enhanced growth opportunities for OMNOVA specialty chemical products in
Europe and in higher growth markets in Asia
•
Grow existing ~ $45 million chemical export/toll business in Asia / Europe
2.
Growth: Entry into higher growth products / markets; core market
expansion
•
Coatings; Oil Field Chemicals
•
Key processes and factors for success similar to OMNOVA’s base business
3.
Diversification: Diversification of OMNOVA product offering
•
Less dependent on single chemistry
4.
Cost Synergy: Significant sourcing and supply chain, manufacturing,
overhead and SG&A cost savings opportunities by leveraging an
integrated global team
Outstanding Strategic Fit
Outstanding Strategic Fit |
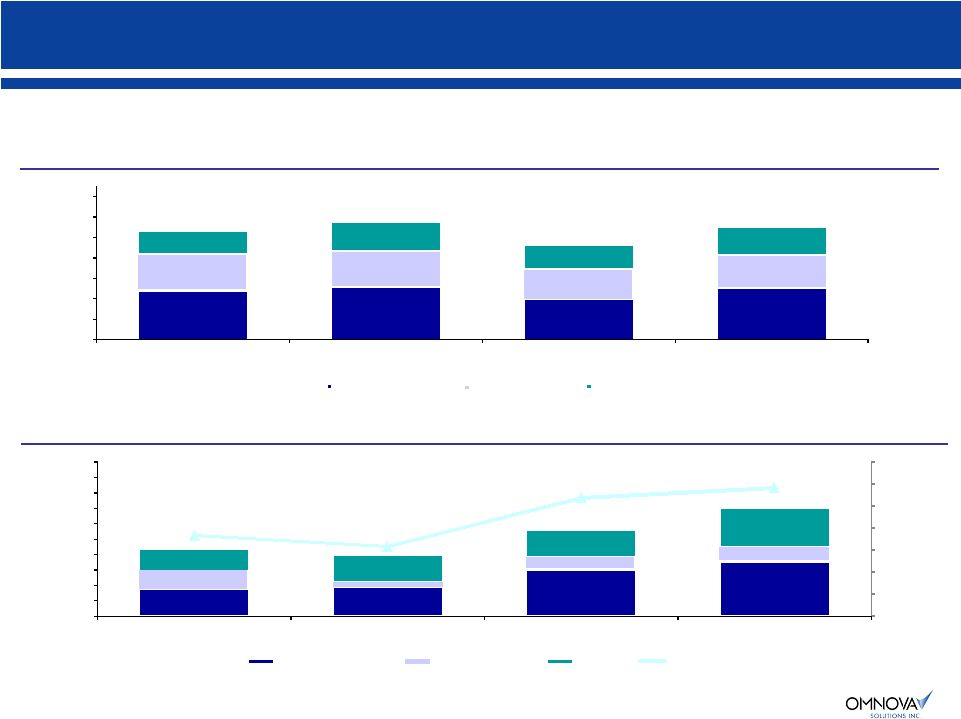 17
Pro forma historical annual financials
Pro forma historical annual financials
Annual historical revenue
Annual historical Adjusted EBITDA*
LTM: Last Twelve Months Through August 31, 2010
* Adjusted EBITDA - see Appendices 1, 2, 3, and 6; Total Adjusted EBITDA includes OMNOVA Corporate
Expense of $8.9M, $5.6M, $12.2M, and $11.9M for 2007, 2008, 2009, and 2010 LTM,
respectively. $475.3
$521.7
$396.7
$507.4
$364.6
$228.1
$289.5
$229.5
$276.5
$1,068.0
$1,159.0
$925.9
$1,103.5
$0
$200
$400
$600
$800
$1,000
$1,200
$1,400
2007
2008
2009
LTM 8/31/10
Performance Chemicals
Decorative Products
Eliokem
$347.8
$299.7
$319.6
$35.1
$37.5
$59.7
$71.1
$28.4
$34.5
$35.1
$51.0
$78.4
$73.6
$99.5
$128.7
7.3%
6.4%
10.7%
11.7%
0%
2%
4%
6%
8%
10%
12%
14%
$0
$20
$40
$60
$80
$100
$120
$140
$160
$180
$200
2007
2008
2009
LTM 8/31/10
Performance Chemicals
Decorative Products
Eliokem
EBITDA Margin
$23.8
$7.2
$16.9
$18.5 |
 18
Creating a Global Specialty Chemicals Business
Creating a Global Specialty Chemicals Business
Coatings/
Toners
$69M
25%
Oil Field
$25M
9%
Specialty
Latex
$48M
17%
Elastomeric
Modifiers/
Reinforcing
$64M
23%
Specialty
Rubbers
$26M
10%
Antioxidants
$45M
16%
Paper &
Carpet
$319M
63%
Specialties
$188M
37%
Eliokem
LTM Sales
$277M
OMNOVA
Performance
Chemicals
LTM
Sales
$507M
OMNOVA Performance
Chemicals
Combined
Sales
$784M
Paper &
Carpet
$319M
41%
Specialties
$188M
24%
Eliokem
$277M
35%
•
75% of Eliokem’s
Business Are New Markets for OMNOVA
•
Specialties Will Expand to 60% of Performance Chemicals
•
Combined Sales Outside North America 36% of Total
•
75% of Eliokem’s
Business Are New Markets for OMNOVA
•
Specialties Will Expand to 60% of Performance Chemicals
•
Combined Sales Outside North America 36% of Total
LTM: Last Twelve Months Through August 31, 2010 |
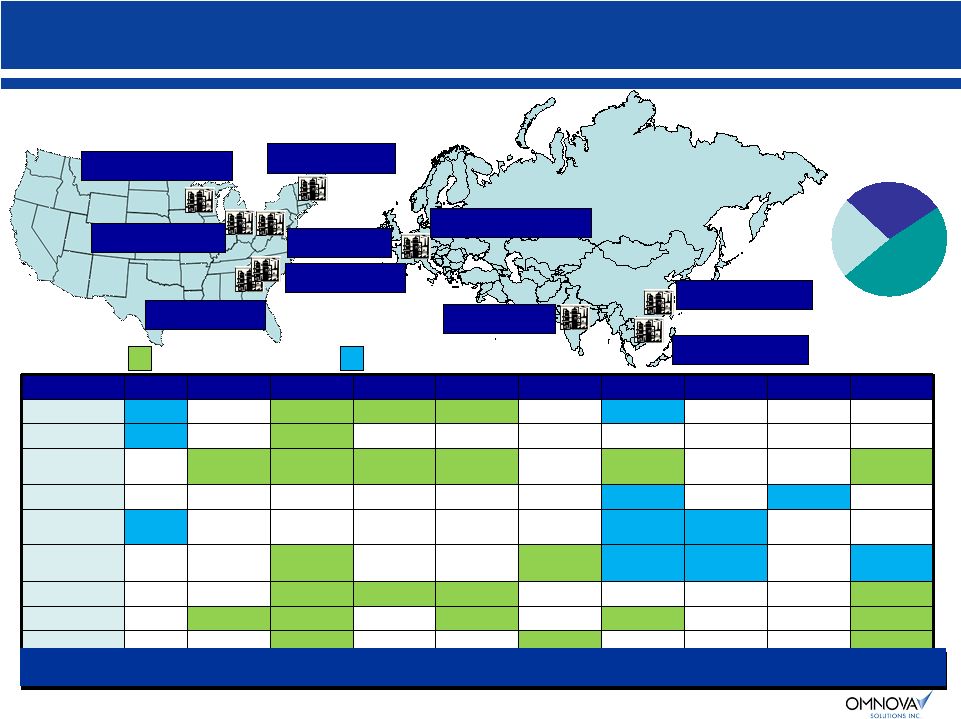 19
Global Footprint In Performance Chemicals
Global Footprint In Performance Chemicals
Product Focus
Akron
Green Bay
Mogadore
Fitchburg
Chester
Calhoun
Le Havre
Valia
Ningbo
Caojing
Coatings
Oil Field
Nonwovens/
Textiles
Antioxidants
Elastomers/
Reinforcing
Specialty
Rubbers/Latex
Tape & Releases
Paper
Carpet
Valia, India
Ningbo, China
Caojing, China
Le Havre, France
Fitchburg, MA
Green Bay, WI
Akron, OH
Mogadore, OH
Chester, SC
Calhoun, GA
OMNOVA
Eliokem
Leveraging Eliokem manufacturing infrastructure with OMNOVA technology
Leveraging Eliokem manufacturing infrastructure with OMNOVA technology
Europe &
Africa
29%
Americas
23%
Asia
48%
Eliokem Production Capacity |
 20
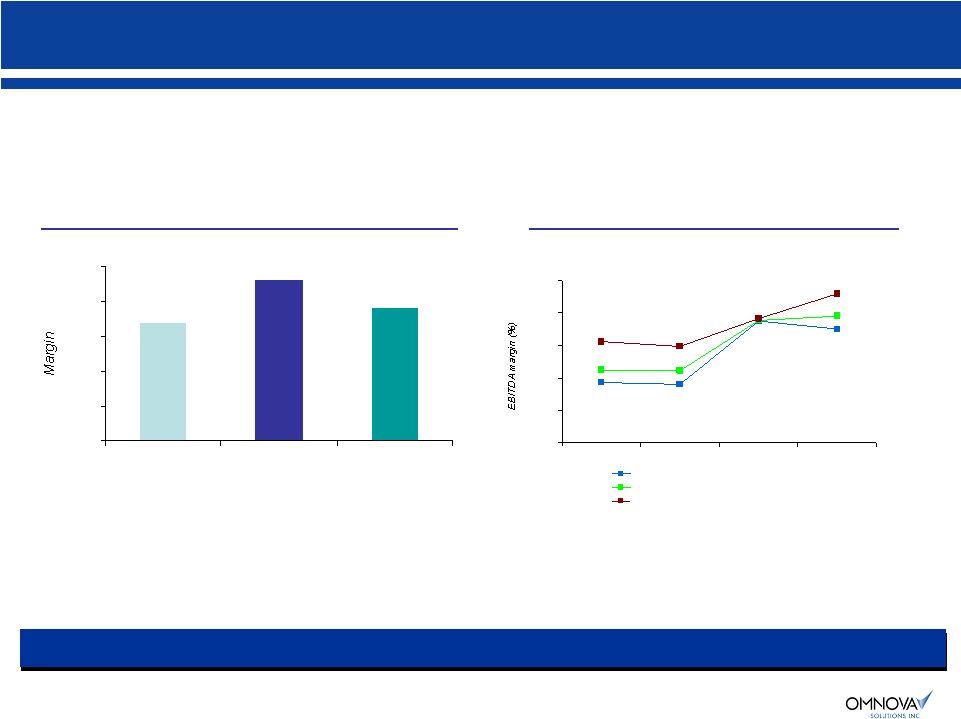
Enhances Performance Chemicals Profitability Profile
Enhances Performance Chemicals Profitability Profile
9.5%
13.1%
10.8%
0%
3%
6%
8%
11%
14%
OMNOVA
Performance
Chemicals
Eliokem
Pro Forma
Performance
Chemicals
Average Adj. EBITDA* margin (2007-2009)
Improves Operating Profile Through Niche / Specialty, Higher Margin Products
Improves Operating Profile Through Niche / Specialty, Higher Margin Products
Adj. EBITDA* margins over time
7.4%
7.2%
15.0%
14.0%
15.6%
9.0%
8.9%
15.1%
18.4%
15.3%
11.9%
12.5%
0%
4%
8%
12%
16%
20%
2007
2008
2009
LTM
OMNOVA Performance Chemicals
Pro Forma OMNOVA Performance Chemicals
Eliokem
LTM: Last Twelve Months Through August 31, 2010
* Adjusted EBITDA - see Appendices 2 and 6
|
 21
Top 10
Customers
34%
Other
Customers
66%
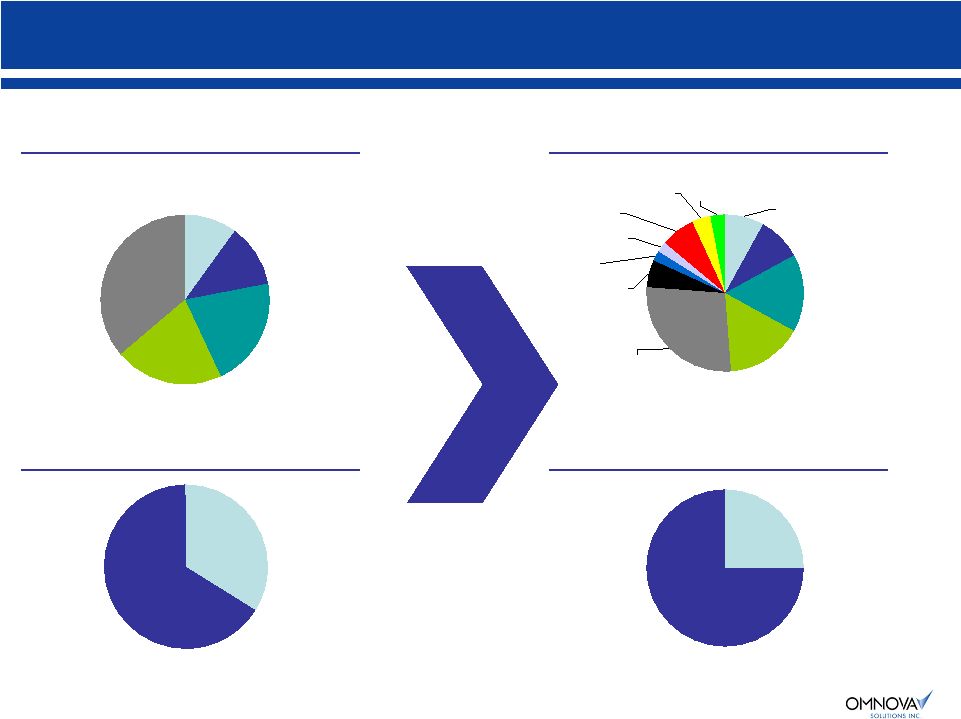
OMNOVA
Consolidated
-
Enhanced
End
Use
Revenue
Diversification
OMNOVA
Consolidated
-
Enhanced
End
Use
Revenue
Diversification
OMNOVA End Market
Revenue
OMNOVA Top 10 Customers
Pro Forma OMNOVA End
Market Revenue
Pro Forma OMNOVA Top 10
Customers
Specialties
21%
Commercial
Wallcovering
10%
Laminates &
Films
12%
Coated
Fabrics
21%
Paper &
Carpet
36%
Specialties
16%
Elastometric
Modifiers
3%
Specialty Rubbers
7%
Antioxidants
4%
Oil Field
2%
Commercial
Wallcovering
8%
Laminates & Films
9%
Coated Fabrics
16%
Paper & Carpet
27%
Coatings
6%
Reinforcing
2%
Top 10 Customers
25%
Other Customers
75%
Note: Figures represent 2009 data. |
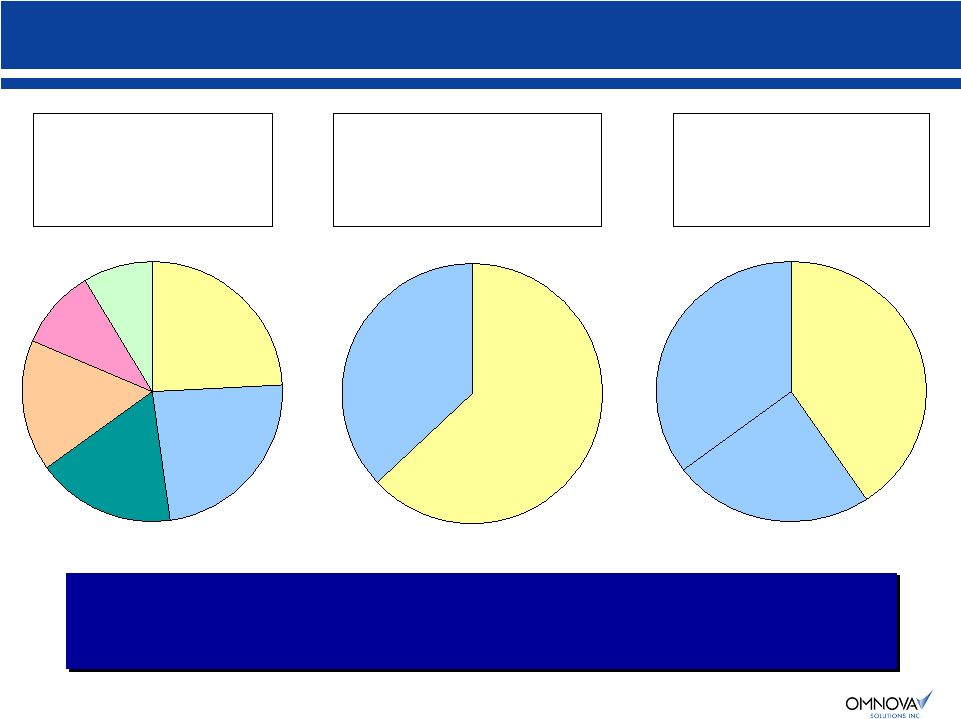
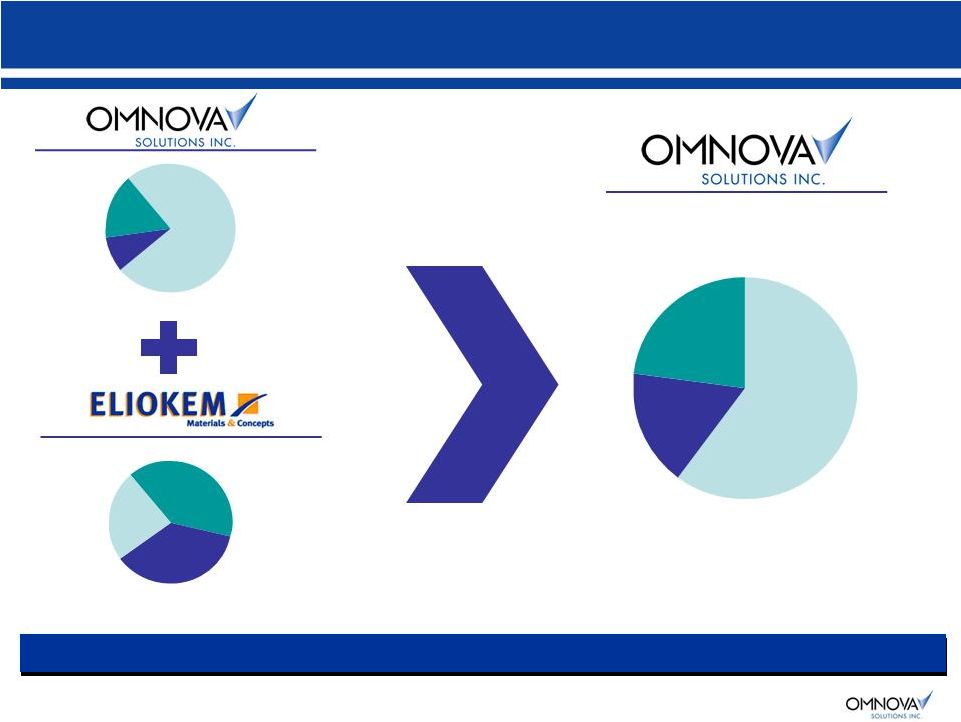 Accelerates OMNOVA’s
Global Reach On A Pro Forma Basis
Accelerates OMNOVA’s
Global Reach On A Pro Forma Basis
LTM Sales $827 Million
LTM Sales $277 Million
LTM Sales $1.1 Billion
Positioned For Strong Growth Potential In Asia And Europe
Positioned For Strong Growth Potential In Asia And Europe
Pro Forma Consolidated
LTM: Last Twelve Months Through August 31, 2010.
Europe &
Africa
36%
Asia & Middle
East
40%
Americas
24%
Europe &
Africa
17%
Asia &
Middle East
23%
USA
60%
Europe
9%
USA
75%
Asia
16%
22 |
 23
Terms
Terms
Attractive Value for OMNOVA
Attractive Value for OMNOVA
Price:
€227.5 million (~$300 million) cash
Eliokem
LTM Sales:
$277 million
Eliokem
LTM Adjusted EBITDA*:
$51 million
OMNOVA Capital Structure:
$425 million total debt (funded)
(post-acquisition)
$100 million asset-based facility (unused)
$40 million cash
$385 million Net Debt**
$129 million pro forma consolidated Adjusted EBITDA*
OMNOVA Leverage:
3.0x pro forma Net Debt / Adjusted EBITDA*
(post-acquisition)
Timing:
Expected by end of 2010
Conditions to Closing:
Completion of definitive agreement
Regulatory approvals
French Works Council consultation
Financing
Other customary conditions
LTM: Last Twelve Months Through August 31, 2010
* Adjusted EBITDA - see Appendices 1 and 6
** Net Debt is Equal to Total Debt of $425 Million Less Cash of $40 Million
|
 24
Summary –
Consistent With Our Previously Stated Strategy
Summary –
Consistent With Our Previously Stated Strategy
1.
Profitably grow performance chemicals segment
–
Globalization
–
Penetration into new but related markets / applications
–
Technology / new product driven growth in core markets
2.
Accelerate access to high growth / volume regions
–
Established presence in Asia and Europe
3.
Diversification in new but related specialty markets
–
Provides attractive growth / scale in business with very
similar key factors for success
4.
Pursue niche markets for emulsion polymers with high
margins
5.
Productivity mindset . . . Lean cost structure
Eliokem
•
Enhance Value For Our Stakeholders
•
Expected To Be Accretive in 2012
•
Enhance Value For Our Stakeholders
•
Expected To Be Accretive in 2012 |
 25
Appendix |
 26
Appendix —
Non-GAAP Financial Measures
Appendix —
Non-GAAP Financial Measures
This presentation includes EBITDA, Adjusted EBITDA and Net Debt which are
Non-GAAP financial measures as defined by the Securities and Exchange
Commission. OMNOVA’s
EBITDA is calculated as income (loss) from continuing operations less interest
expense, amortization of deferred financing costs, income taxes and
depreciation and amortization expense. OMNOVA’s Adjusted EBITDA is
calculated as OMNOVA’s
EBITDA less restructuring and severance expenses, asset impairments, non-cash
stock compensation and other items. Segment EBITDA is calculated as
segment operating income (loss) less interest expense, amortization of
deferred financing costs, income taxes and depreciation and amortization expense.
Segment Adjusted EBITDA is calculated as Segment EBITDA less restructuring and
severance expenses, asset impairments, non-cash stock compensation and
other items. For purposes of this presentation, Net Debt is calculated
as total debt less cash. Eliokem’s
EBITDA is calculated as net income less interest expense, amortization of deferred
financing costs, income taxes and depreciation and amortization expense.
Eliokem’s Adjusted EBITDA is calculated as Eliokem’s
EBITDA less restructuring and severance expenses, asset impairments and other
items. EBITDA, Adjusted EBITDA and Net Debt are not measures of
financial performance under GAAP. EBITDA, Adjusted EBITDA and Net Debt
are not calculated in the same manner by all companies and, accordingly, are
not necessarily comparable to similarly titled measures of other companies and
may not be appropriate measures for comparing performance relative to other
companies. EBITDA, Adjusted EBITDA and Net Debt should not be construed as
indicators of the Company’s operating performance or liquidity and should not be
considered in isolation from or as a substitute for net income (loss), cash
flows from operations or cash flow data, which are all prepared in accordance
with GAAP. EBITDA, Adjusted EBITDA and Net Debt are not intended to represent, and should not be
considered more meaningful than or as an alternative to, measures of operating
performance as determined in accordance with GAAP. Management believes
that presenting this information is useful to investors because these measures
are commonly used as analytical indicators to evaluate performance and by management to allocate
resources. Set forth below are the reconciliations of these non-GAAP
measures to their most directly comparable GAAP financial measure.
|
 27
Appendix 1 -
Adjusted EBITDA
Appendix 1 -
Adjusted EBITDA
($ Millions)
LTM
OMNOVA Solutions Consolidated
2007*
2008
2009
Aug 31, 2010
Income (loss) from continuing operations
$
(4.9)
$
(2.2)
$
26.2
$
37.5
Interest expense
15.7
12.3
7.5
6.9
Amortization of deferred financing costs
0.8
0.7
0.6
0.6
Income tax
0.1
0.2
1.7
2.8
Depreciation & amortization
23.1
23.9
22.9
21.4
EBITDA
$
34.8
$
34.9
$
58.9
$
69.2
Restructuring & severance
1.0
0.6
2.1
0.6
Asset impairments
-
-
1.1
6.6
Non-cash stock compensation
2.9
2.4
2.8
3.5
Other
11.3
1.2
(0.5)
(2.2)
Adjusted EBITDA
$
50.0
$
39.1
$
64.4
$
77.7
OMNOVA Solutions Adjusted EBITDA
$
50.0
$
39.1
$
64.4
$
77.7
Eliokem
International Adjusted EBITDA
28.4
34.5
35.1
51.0
Combined Adjusted EBITDA
$
78.4
$
73.6
$
99.5
$
128.7
LTM: Last Twelve Months through August 31, 2010
* NOTE: 2007 Sales and Adjusted EBITDA have been adjusted by $94.4 million and $4.8
million, respectively. Pro forma
2007
reflects
the
full
year
results
of
the
Asian
businesses
acquired
during
December
2007
as if the acquisition took place December 1, 2006. |
 28
Appendix 2 -
Adjusted EBITDA
Appendix 2 -
Adjusted EBITDA
3 YR
LTM
Performance Chemicals Segment
2007
2008
2009
Average
Aug 31, 2010
Segment Operating Profit
$
23.7
$
25.2
$
47.9
$
32.3
$
69.6
Interest Expense
-
-
-
-
-
Amortization of deferred financing costs
-
-
-
-
-
Income Tax
-
-
-
-
-
Depreciation & amortization
11.1
11.0
9.9
10.7
9.6
EBITDA
$
34.8
$
36.2
$
57.8
$
42.9
$
79.2
Restructuring & severance
-
0.1
0.2
0.1
Asset Impairments
-
-
0.7
0.2
-
Non-cash stock compensation
1.0
1.1
0.8
1.0
1.2
Other
(0.7)
0.1
0.2
(0.1)
(9.3)
Adjusted EBITDA
$
35.1
$
37.5
$
59.7
$
44.1
$
71.1
Sales
$
475.3
$
521.6
$
396.8
$
464.6
$
507.0
Percentage of Adjusted EBITDA to Sales
7.4%
7.2%
15.0%
9.5%
14.0%
LTM: Last Twelve Months through August 31, 2010
($ Millions) |
 29
Appendix 3 -
Adjusted EBITDA
Appendix 3 -
Adjusted EBITDA
($ Millions)
LTM
Decorative Products Segment
2007*
2008
2009
Aug 31, 2010
Segment Operating Profit
$
10.4
$
(6.7)
$
1.6
$
(5.9)
Interest Expense
-
-
-
-
Amortization of deferred financing costs
-
-
-
-
Income Tax
-
-
-
-
Depreciation & amortization
11.7
12.5
12.5
11.3
EBITDA
$
22.1
$
5.8
$
14.1
$
5.4
Restructuring & severance
0.7
0.5
1.8
0.2
Asset Impairments
-
-
0.6
5.4
Non-cash stock compensation
0.8
0.9
0.4
0.6
Other
0.2
-
-
6.9
Adjusted EBITDA
$
23.8
$
7.2
$
16.9
$
18.5
LTM: Last Twelve Months through August 31, 2010
* NOTE: 2007 Sales and Adjusted EBITDA have been adjusted by $94.4 million and $4.8
million, respectively. Pro forma 2007 reflects the full year results of the
Asian businesses acquired during December 2007 as if the acquisition took
place December 1, 2006. |
 30
Appendix 4 -
Adjusted EBITDA (Last 12 Months “LTM”)
Appendix 4 -
Adjusted EBITDA (Last 12 Months “LTM”)
($ Millions)
OMNOVA Solutions Consolidated
1st Qtr
2nd Qtr
3rd Qtr
4th Qtr
1st Qtr
2nd Qtr
3rd Qtr
Income (loss) from continuing operations
$
0.7
$
8.9
$
15.9
$
26.2
$
34.1
$
44.1
$
37.5
Interest expense
11.2
9.7
8.7
7.5
7.1
7.0
6.9
Amortization of deferred financing costs
0.6
0.6
0.6
0.6
0.6
0.6
0.6
Income tax
0.3
0.6
0.3
1.7
2.2
2.6
2.8
Depreciation & amortization
24.1
23.4
23.1
22.9
22.8
22.6
21.4
EBITDA
$
36.9
$
43.2
$
48.6
$
58.9
$
66.8
$
76.9
$
69.2
Restructuring & severance
1.5
2.3
2.2
2.1
1.5
0.7
0.6
Asset impairments
-
0.7
0.7
1.1
1.1
6.6
6.6
Non-cash stock compensation
2.1
1.9
2.0
2.8
3.5
3.4
3.5
Other
0.2
(0.1)
0.1
(0.5)
(0.5)
(8.5)
(2.2)
Adjusted EBITDA
$
40.7
$
48.0
$
53.6
$
64.4
$
72.4
$
79.1
$
77.7
Net Debt
1st Qtr
2nd Qtr
3rd Qtr
4t Qtr
1st Qtr
2nd Qtr
3rd Qtr
Total Debt
$
174.1
$
156.6
$
144.6
$
144.1
$
143.7
$
144.1
$
144.4
Less Cash
(15.3)
(23.7)
(29.6)
(41.5)
(35.4)
(42.0)
(59.7)
Net Debt
$
158.8
$
132.9
$
115.0
$
102.6
$
108.3
$
102.1
$
84.7
Adjusted EBITDA to Net Debt
3.9
X
2.8
X
2.1
X
1.6
X
1.5
X
1.3
X
1.1
X
Net Debt
2007
2008
Total Debt
$
149.9
$
188.3
Less Cash
(12.6)
(17.4)
Net Debt
$
137.3
$
170.9
2009
2010
2009
2010 |
 31
Appendix 5 -
Performance Chemicals Sales and EBITDA
Appendix 5 -
Performance Chemicals Sales and EBITDA
($ Millions)
2005
Sales
SOP
Interest
Taxes
Depreciation
Amortization
EBITDA
1st Qtr
102.1
3.5
-
-
2.6
0.4
6.5
2nd Qtr
118.1
11.0
-
-
2.7
0.4
14.1
3rd Qtr
119.0
9.3
-
-
2.7
0.4
12.4
4th Qtr
113.7
10.0
-
-
2.5
0.4
12.9
2006
1st Qtr
109.3
5.2
-
-
2.5
0.4
8.1
2nd Qtr
111.4
8.9
-
-
2.5
0.4
11.8
3rd Qtr
109.6
8.2
-
-
2.5
0.4
11.1
4th Qtr
111.2
7.4
-
-
2.1
0.4
9.9
2007
1st Qtr
105.8
3.6
-
-
2.4
0.3
6.3
2nd Qtr
116.4
5.8
-
-
2.4
0.4
8.6
3rd Qtr
126.7
7.9
-
-
2.4
0.4
10.7
4th Qtr
126.4
6.5
-
-
2.4
0.4
9.3
2008
1st Qtr
118.9
2.6
-
-
2.4
0.4
5.4
2nd Qtr
125.2
1.9
-
-
2.5
0.4
4.8
3rd Qtr
145.5
10.5
-
-
2.4
0.4
13.3
Average
117.3
9.7
Average EBITDA Margin 1st qtr 2005 through 3rd qtr 2008
8.3%
2008
Sales
SOP
Interest
Taxes
Depreciation
Amortization
EBITDA
4th Qtr
132.0
10.2
-
-
2.2
0.3
12.7
2009
1st Qtr
94.6
7.8
-
-
2.2
0.2
10.2
2nd Qtr
87.0
11.4
-
-
2.3
0.2
13.9
3rd Qtr
104.4
14.8
-
-
2.3
0.2
17.3
4th Qtr
110.7
14.0
-
-
2.3
0.2
16.5
2010
1st Qtr
112.8
13.8
-
-
2.2
0.2
16.2
2nd Qtr
138.6
17.0
-
-
2.2
0.1
19.3
3rd Qtr
145.3
15.2
-
-
2.0
0.3
17.5
Average
115.7
15.5
Average EBITDA Margin 4th qtr 2008 through 3rd qtr 2010
13.4%
SOP is Segment Operating Profit
Note: 2nd qtr SOP 2010 excludes $9.7 million from the gain on the dissolution of
RohmNova Joint Venture |
 32
Appendix 6 -
Adjusted EBITDA
Appendix 6 -
Adjusted EBITDA
($ Millions)
3 YR
LTM
Eliokem International
2007
2008
2009
Average
Aug 31, 2010
Net income
$
5.3
$
(2.5)
$
1.2
$
1.3
$
0.9
Interest expense
15.0
17.5
16.8
16.4
16.1
Amortization of deferred financing costs
0.5
0.5
0.5
0.5
0.5
Income Tax
3.0
(3.3)
1.3
0.3
1.0
Depreciation & amortization
12.5
14.3
13.4
13.4
13.2
EBITDA
$
36.3
$
26.5
$
33.2
$
32.0
$
31.7
Restructuring & severance
1.1
1.1
3.9
2.0
5.4
Other
(9.0)
6.9
(2.0)
(1.4)
13.9
Adjusted EBITDA
$
28.4
$
34.5
$
35.1
$
32.7
$
51.0
Sales
$
228.1
$
289.5
$
229.4
$
249.0
$
276.5
Percentage of Adjusted EBITDA to Sales
12.5%
11.9%
15.3%
13.1%
18.4%
3 YR
LTM
Combined Adjusted EBITDA
2007
2008
2009
Average
Aug 31, 2010
Performance Chemicals Adjusted EBITDA
$
35.1
$
37.5
$
59.7
$
44.1
$
71.1
Eliokem International Adjusted EBITDA
28.4
34.5
35.1
32.7
51.0
Combined Adjusted EBITDA
$
63.5
$
72.0
$
94.8
$
76.8
$
122.1
Combined Sales
Performance Chemicals
$
475.3
$
521.6
$
396.8
$
464.6
$
507.0
Eliokem International
228.1
289.5
229.4
249.0
276.5
Combined Sales
$
703.4
$
811.1
$
626.2
$
713.6
$
783.5
Percentage of Adjusted EBITDA to Sales
9.0%
8.9%
15.1%
10.8%
15.6%
LTM: Last Twelve Months through August 31, 2010 |
 33 |